Abstract
The primary motive of this paper is to examine the determinants of financial inclusion in Tanzania. The paper borrows data from a household survey conducted by TWAWEZA. Employing the probit regression, the findings of this paper reveal that gender, education, age and income are the pertinent factors which affect the financial inclusion in Tanzania. The paper further shows the following: First, if you are a man, financially stable, have a good education and are relatively older, you then stand better chances of being financially included. The results show that, as the level of education increases, the individual is more likely to be financially included. The possible reason for this observation may be clearly linked with the financial ability of educated individuals to afford holding bank accounts and presenting personal guarantees when required by the banks during loan application because the level of education goes parallel with the income level. In addition, the results confirm a gender gap in formal financial inclusion, and this may be due to the factors such as inability of women to show collateral, their poor financial education awareness and lower business experience. Second, the paper also shows that the factors which affect traditional banking services are the same as those affecting mobile banking services (gender, age, income and education), and that there is a negative trend and a clear departure of customers’ usage from banking retail services to mobile financial services. Although this gap has been narrowed recently, the best option with the banking sector is to create more new delivery channels while using mobile financial services as an infrastructure to deepen financial access reaching more un-banked population. The paper, therefore, recommends banks to create more delivery channels while using mobile telecommunication network as an infrastructure to deepen financial access reaching more unbanked people rather than competing with mobile network operators. The findings of this paper may also be used as a wake-up call for policy makers to put more emphasis on women and young people who are often left behind during Government’s effort toward reaching the entire population as far as financial inclusion is concerned.
1. Introduction
Financial inclusion does not have a single acceptable definition around the world, but different countries refer to financial inclusion based on their own market perspective. In Tanzania, National Financial Inclusion (NFIF) [1] defines financial inclusion as a frequent use of financial services and provides three dimensions of financial inclusion namely; the measurability and frequent usage of financial services meaning that the financial services are of required quality and can improve the life standard of users; the types of financial inclusion services offered which include savings, credit, payment (transfer and remittance), insurance and pension, and the last is the target group, which includes all Tanzanians but with emphasis on the poor, enterprise low income women and youth with children to build financial stability in society.
World bank [2] refers to financial inclusion as strategies which show nationally agreed road maps of actions that provide guidance to stakeholders in achieving the goals of financial inclusion. The strategies which are termed superior and successful, according to World Bank [2], are those which complement efforts with those of the major financial inclusion stakeholders, provide clear responsibilities of each stakeholder, and highlight transparently resource planning by giving priority targets. Such strategies should be able to encourage a more effective and efficient process of achieving substantial development of financial inclusion.
The National Framework for Financial Inclusion (NFIF) [3] recognizes the position of mobile phone in facilitating the effort of financial inclusion in the financial market. The national financial inclusion recognizes that the access strand to financial services in Tanzania has improved from 11.2% of adult population accessing formal financial services in 2006 (before mobile money service emerged) to about 17% after evolution of mobile money service in 2009. According to FinScope Tanzania report [4], about 65% of the adult population in Tanzania is now formally financially included. This abrupt increase in financial inclusion is acknowledged by the national financial inclusion framework to be contributed highly by what is referred to as the introduction of non-traditional players in delivery of financial services in Tanzania—the mobile network operators (MNOs) who have revolutionized the landscape of financial services delivery in the country by reaching the majority which was originally left aside and financially excluded in the country.
According to FinScope [4], over the past three years, enhancements in accessibility of financial services have been remarkable as greater proximity of financial services and greater access to mobile phones have made substantial contributions to this outstanding growth. For instance, the proportion of the rural adult population living within 5 km of a financial service access point has now reached over 78% and the increased adoption of mobile phones within households which is now at 86%countrywide allows people to access mobile financial services more conveniently.
These developments provide an opportunity for Tanzania to deepen the financial system by leveraging technology to drive up usage and reduce transaction costs. It is also crucial to note that the use of mobile money is of a paramount importance because it also helps to reduce time of getting service by reducing long queues in banks and ensures security of carrying money. Following this remarkable increase in the financial inclusion, the contribution of mobile money services provided by the MNOs cannot be left unnoticed. Financial inclusion is a concern in developing economies. Finscope [4] reveals that the banking system in Africa do include people financially in a slower pace than banking systems of developed countries such as America and Europe countries. Since financial inclusion is regarded as the pillar of financial sector development, which contributes greatly in economic growth, studying its determinants is of paramount importance.
The understanding of the determinants of financial inclusion has currently been an issue of concern to researchers. In Tanzania, this is even more crucial especially during the fifth Government regime in which the core agenda is industrial economy, and financial inclusion is definitely a back born of the agenda. This paper aims at coming up with the determinants of financial inclusion in Tanzania. The paper also assesses consumers’ preference on the mobile financial services channels available in Tanzania. Furthermore, the paper examines the trend of market share on the delivery of financial services between the mobile network operators and the traditional banking institutions.
2. Related Literature
A main debate on informal finance concerns whether informal financing businesses may substitute the formally accepted financial services. Formal inclusion of people in financial services may never reduce the number of people using informal finance, and that owning a formal bank account would be directly related to the use of informal financial mechanisms.
Allen et al. [5] conducted a study examining country characteristics influencing financial inclusion. The author found that high-quality institutions, efficient legal rules, strong contract enforcement and political stability bring about more financial inclusion. Moreover, according to Allen et al. [5], characteristics about the banking sector also have an essential role to play. They recognized challenges of financial inclusion such as high costs of opening and using bank accounts, high distance and high disclosure requirements, while trust in the banking sector is also influential.
Demirgüç-Kunt et al. [6] also recognizes religion as another factor which affect financial inclusion. The authors found that Muslims more likely own formal bank accounts and save more compared to their counterparts non-Muslims. According to the authors, other general factors which are considered to drive financial inclusion such as income, education, gender etc. also hold for both Muslims and non-Muslims categories. Therefore, according to the authors, in Sub-Saharan Africa, religion is considered as one of the hindrances to financial inclusion by Muslims because in some circumstances Muslims, due to their beliefs, are limited to participate in borrowing activities which usually are usually the catalyst to the financial inclusion development.
In another study Naceur et al. [7] used the sample of Muslim countries to determine the association between Islamic banking and financial inclusion, and the results show that in these countries the access to financial services has spread significantly although when it comes to the use of such services the countries are far behind though financial access has increased rapidly in these countries, financial usage has not increased as quickly. According to the authors there is a direct relationship between financial inclusion and credit for household and that for companies.
Demirgüç-Kunt et al. [6] also considered gender as a factor which affects financial inclusion. According to the author gender and financial inclusion are strongly positively related. The authors reveal a substantial difference between men and women in as far as borrowing and savings are concerned. According to the authors men do formally borrow and save more likely than women due to factors related to income and asset ownership. One should understand that, being a woman increases the likelihood of one being financially excluded because of women having inferior level of income, lower financial literacy and less business experience, hence relying more on informal financial services.
Financial inclusion is made simple through communication technology. Hoernig and Bourreau [8] recognize mobile money services as the tool to enhance financial inclusion. According to Hoernig and Bourreau [8] mobile money services improves access to financial services for the un-banked population, and to them mobile banking is the extension of banking services delivery through a mobile phone. The example of such service is cited as M-PESA by Aron [9]. The author recognizes technology as the major driver to fill the poor infrastructure of the conventional banking. Gibney et al. [10] shared Aron’s [9] position that mobile financial services are a solution towards financial inclusion outsmarting the traditional financial institution. In the same regard UNCTAD [11] discredited conventional banking over the mobile financial services, as it is not inclusive.
The inclusiveness is attributed to wider reach of the mobile network operators beyond the scope of the traditional banking. This signals the shift pushing the traditional banking institutions into irrelevance as far as the delivery of financial services is concerned.
According to Klein and Mayer [12] M-PESA facilitates cash store and remittance over the phone, and this service is easily available for all kind people ranging from poor to rich ones. Mobile money service is an alternative approach to actual money transfer via banks. Previously, customers had to go physically to bank branches to get this kind of service which they now have on their mobile phones. The mobile financial services are not limited to lower quintile; Deloitte [13] posited that mobile money services are not only for the unbanked and poor, but also serves the upper quintile—rich people. It is further argued that what existing bank customer can be offered on the mobile channel among others may be customized banking solutions, which are available on the go, in real time and ensure fewer clicks. On the partnership between mobile network operators and banks within mobile money space, Malady and Buckely [14] argued that the partnership is beneficial on several fronts. According to Malady and Buckely [14], partnerships can assist in addressing the regulatory issues.
Anderson L.C., et al. [15] further highlighted the difficulties on the side of the mobile financial services agent to maintain liquidity. This varies on whether one is in urban or rural areas. The mobile financial services agent based in rural area has transaction characterized as highly withdrawal—“high on e-floats while low in cash reserve”—while that located in urban areas has transactions characterized as deposit—“high on cash reserve while low in e-floats”. The mobile network operators have regulatory constraint to hold large sums of money, which is an opportunity for traditional banking institutions to step in to strengthen the delivery of financial services where mobile network operators fall short to fill the void and thus be part of the whole mobile money ecosystem to support mobile financial services agents and coordinate disbursement. It is no longer a myth that in developing countries mobile network operators have emerged as major providers of financial services bypassing the sparse retail network of traditional banks (Economides and Jeziorski [16]). Anderson L.C., et al. [15] further argued that the customers are expected to benefit from interoperability through lower prices and expanding network access. This helps users to get electronic financial services which saves cost and time and above all brings convenience to users. In Tanzania, Indonesia, Pakistan, and Sri Lanka, for instance, mobile network operators have entered into contracts that allows users of their respective mobile money scheme to transfer funds across mobile wallets, mobile money accounts and bank accounts, but this kind of agreements has not been brokered elsewhere.
On the other hand, Khiaonarong [17] has more to say about financial inclusion in relation to mobile financial services. According to the author mobile money services simplify the service acquisition by reducing time to get service and getting it anywhere instead of queueing at the bank branches and have potential to reach out to a large unbanked population. Furthermore, the author reported on the exclusion of the majority in the developing world where mobile phone penetration becomes a new business model filling the existing void. It is further argued that globally, out of 2.5 billion people who are still denied access to financial system, 1.7 billion people have mobile phones. On the point of meeting customers’ expectations against the hurdles presented by the traditional financial institutions in delivery of financial services, Khiaonarong [17] reported on the overall reduction of the channel operation cost on the premise that mobile financial services offer customers quick, convenient and frequent transactions.
Going forward, Khiaonarong [17] also reported that mobile financial services are growing in terms of usage and adoption worldwide. According to the author, there are 203 million registered mobile money accounts and 60 million active users. Activeness was measured by the initiation of at least one transaction in the previous 90 days. Khiaonarong further argued that number of transactions through the mobile money accounts stand at 326 million, with a value amounted to 3.2 billion USD. There is a 25% increase in transaction, equivalent to 4.2 billion USD in value, if cash in and cash out items are included.
Traditional banking institutions have started exploiting the opportunities presented by the advent of the mobile network operators. as and Kumar [18] argued that mobile banking presents customers with a reliable convenience to transact at any time, and anywhere provided relevant infrastructures are readily available to facilitate. The relevance of mobile financial services is highlighted in the Bank of Tanzania (BOT) [19] that the mobile payment services provide an avenue for linking bank account holders to the unbanked population. In addition, the service has provided convenience in making payments for specified utilities and other consumer services.
BOT [19] have also reiterated the relatedness of the technology with the use of financial services. They relate the technology with the easiness of the customers to get financial services. Against this background, therefore, there are many ways that financial institutions can fit in the new model of mobile financial services. As described by Choi and Gutierrez [20] banks can partner with the mobile network operators. Raphael [21] argued that the access to financial services in East African countries is very low, especially for the huge population in the rural areas. In Tanzania, for example, one in six Tanzanian have access to financial services from formal Institutions, i.e., over half of the people in Tanzania are excluded from financial services. Calleo [22] similarly argued that, in Tanzania, many mobile money users find the service cheaper, quicker, easier to use, safer and more convenient than using either cash or other formal financial services. Traditional banks, on the other hand, offer a full range of financial services which allow for savings, payments, investment and credit options. The challenge is to find a way to provide these services to the unbanked that is as easy and convenient as mobile financial services and can therefore see the same level of adoption.
Literature does not conclude about factors influencing financial inclusion across countries. The debate is very hot among researchers. Sam and Pais [23] consider income, income inequality and use of communications technology as the factors influencing financial inclusion. According to the authors nations whose GDP per capita are low experience poor connectivity and low level of literacy have lower level of financial inclusion. Using China sample Fungáčová & Weill [24] shows level of education and income to significantly affect financial inclusion. The authors report high education level and income as the significant factors which determine financial inclusion in China. Similar results that shows the influence of education and income on financial inclusion was conducted by Tuesta, et al. [25] in Argentina. On the other hand Chithra & Selvam [26], using sample of India, reveal that income level, population, literacy level significantly relate to financial inclusion. Another study in Peru, conducted by Camara, Peña & Tuesta [27], report income levels and education as significant explanatory variables for the status of financial inclusion.
3. Methodology
Data and Sampling
This paper adapts data from Sauti za Wananchi, Africa’s first nationally representative high frequency mobile phone survey conducted by TWAWEZA. The data were collected from 1800 respondents across Mainland Tanzania between 14 and 26 September 2016. Since the paper relies on the Sauti za Wananchi panel data, the entire methodology of Sauti za Wananchi is adopted herewith.
The sampling was done following three major steps. In the first step research areas were determined randomly from specified strata. The second steps then followed where respondents were sampled randomly from the lists of research area’ lists, and in the last step, one adult household member was chosen as respondent randomly from the adult household list.
The paper employs Probit estimations, following the approach of Zins and Weill [28] to evaluate the determinants of financial inclusion in Tanzania. This approach is appropriate for this kind of study as the variables are dichotomous. The following equation is specified
where;
Xi = a + B × GND+ C × AG + D × INCi + E × ED + εi
Xi = the financial inclusion variable which is the dependent variable and other explanatory.
As in Demirguc-Kunt et al [6], we use possession of bank account to capture financial inclusion. “i” represents one given individual.
AG = Number of years.
GND = Dummy variable ‘Gender’ having value of one for female households and zero otherwise.
INC = Dummy variable ‘Income’ of households grouped into four levels; level one with quintile 20% called LEV1 when income of the household falls in this level and zero otherwise, followed by other three levels; LEV 2, LEV 3 and LEV4 each with quintile 20% with similar definition as level one.
ED = Dummy variable ‘Education’ categorized into Secondary and post-secondary education. Secondary education is given value of 1 when the household has a secondary education and zero otherwise (ED-SEC). Likewise, Post-secondary education is given value of 1 only when the household has an education above secondary and zero otherwise (ED-POST).
4. Results
4.1. A Descriptive Analysis
4.1.1. The Usage and Access Pattern of Financial Services
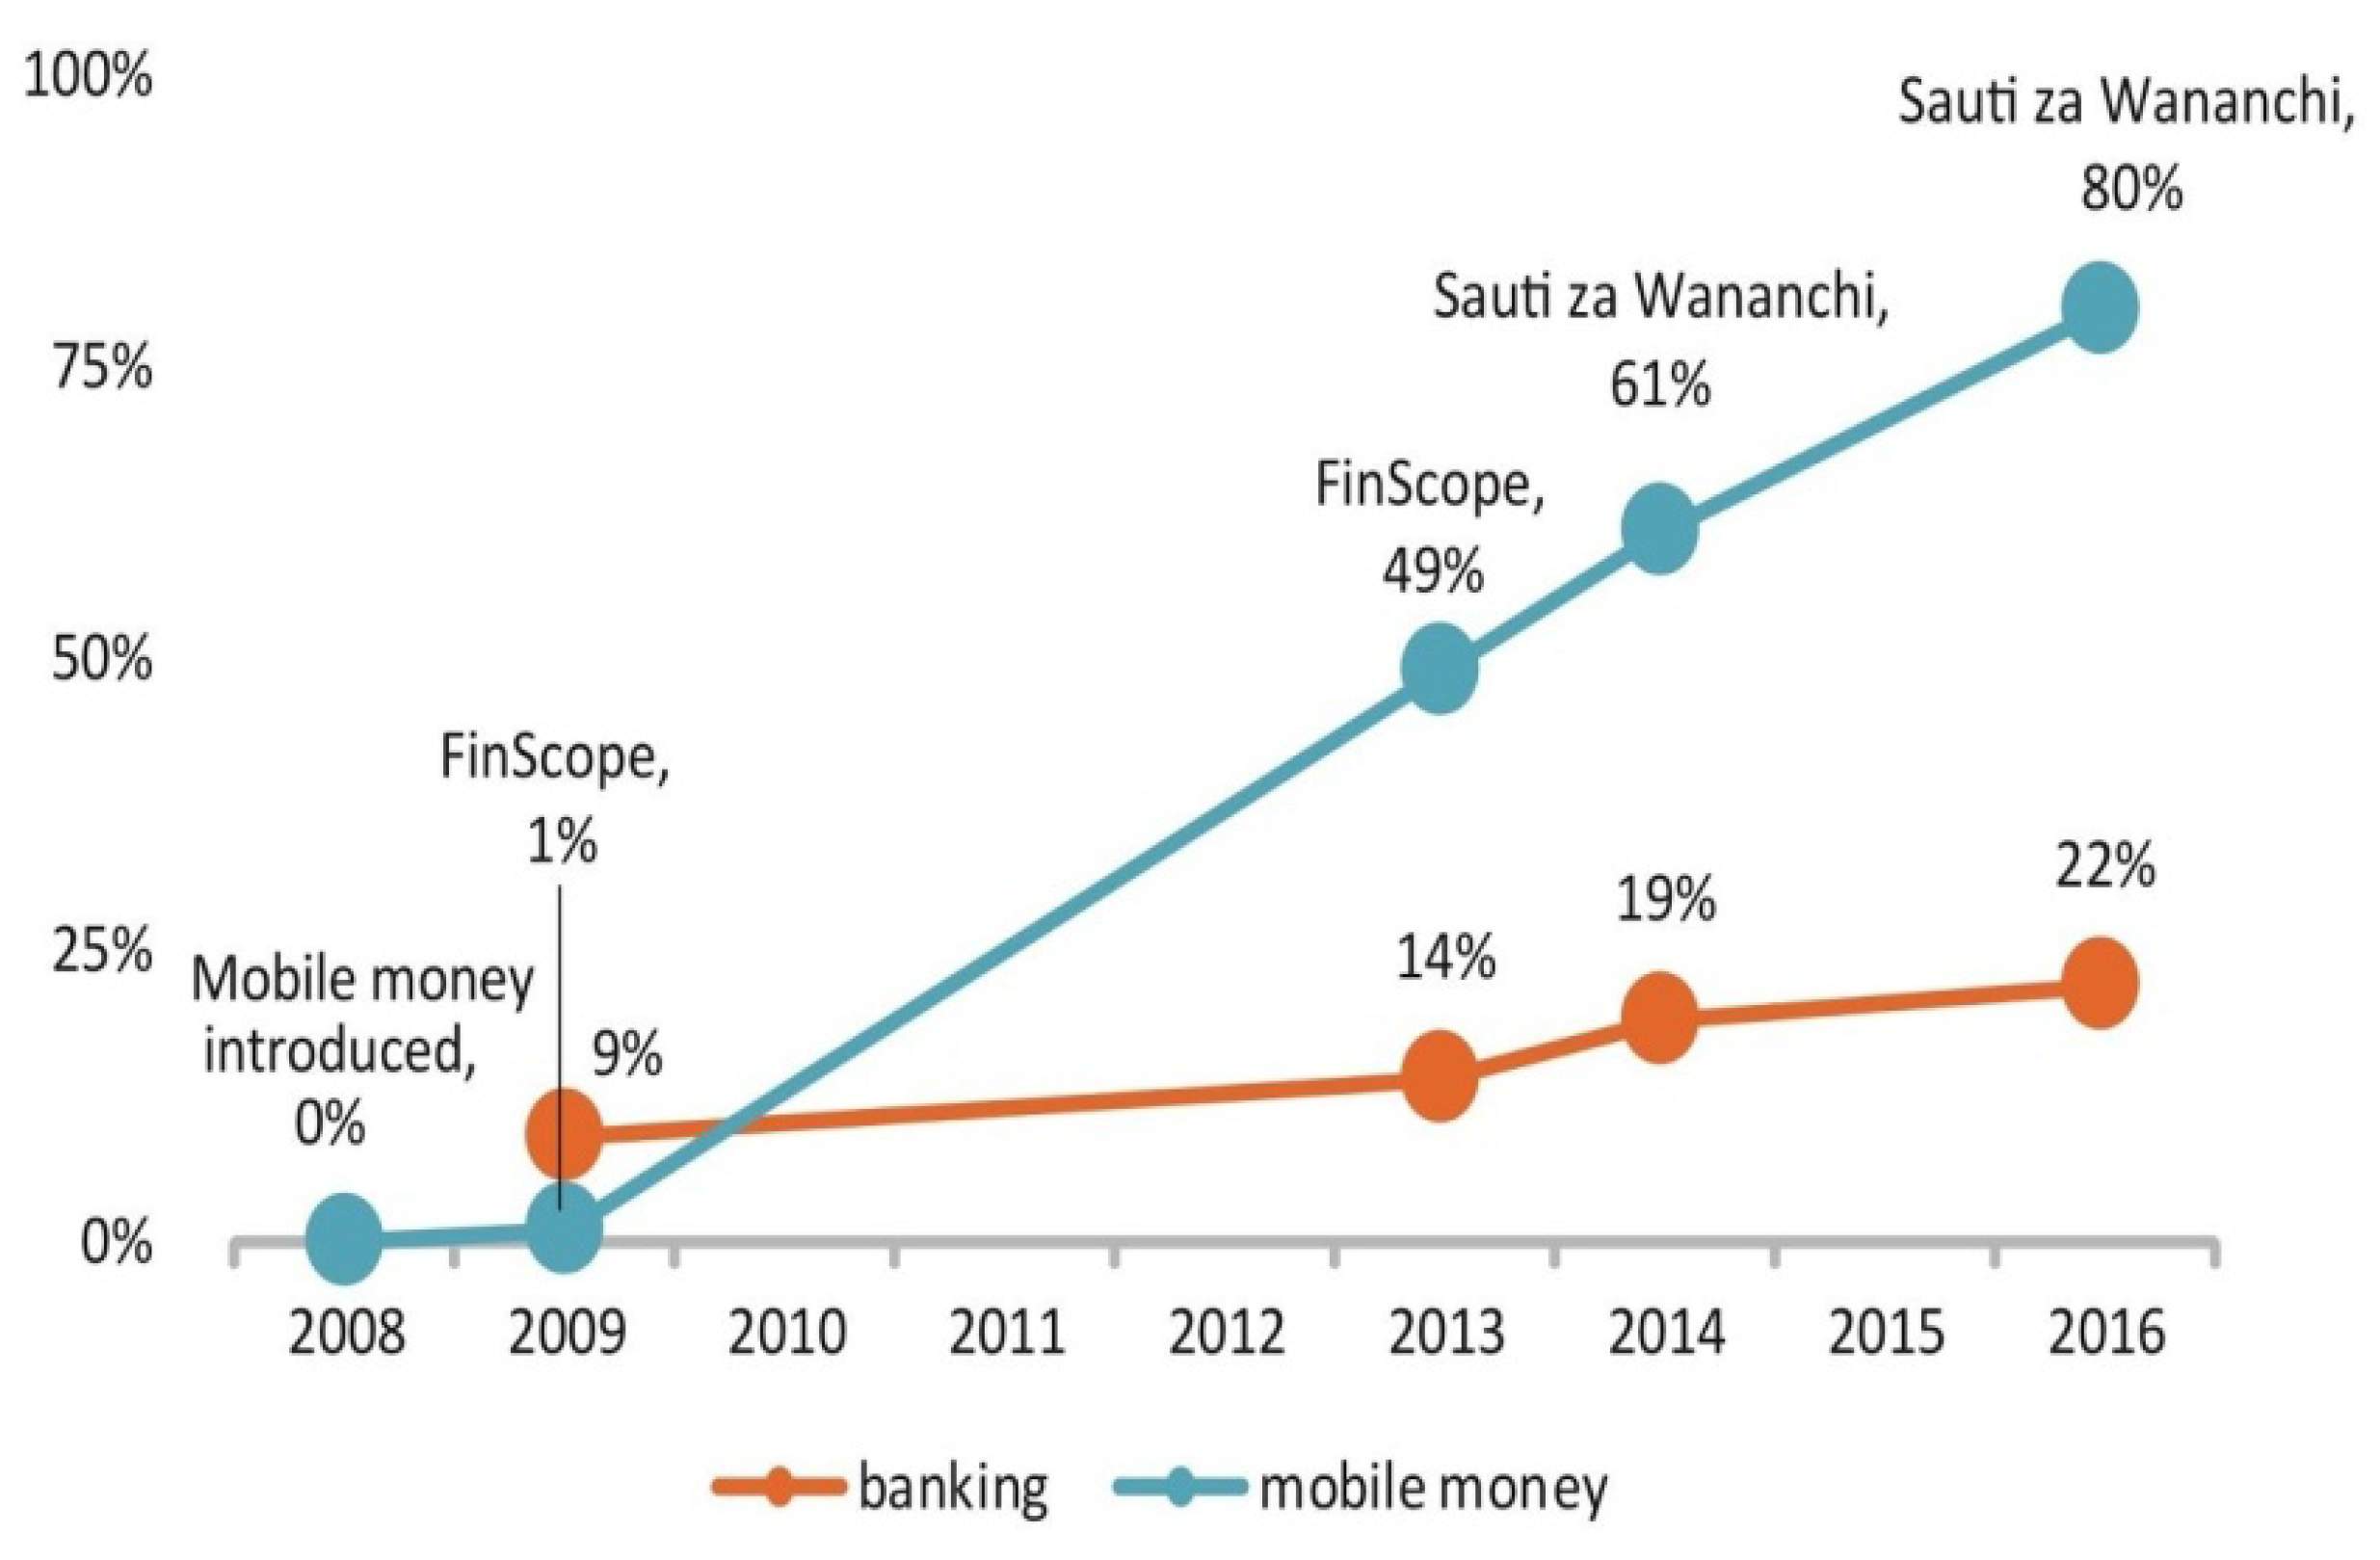
The surge on the access pattern of the financial services was mainly contributed by the mobile network operators in Tanzania. Figure 1 shows the size of population financially included since mobile money was introduced in 2008. The graph is drawn using data from FinScope report [29] and Sauti Za Watu datasets [30]. The two datasets are comparable as they are collected from similar settings using similar sampling procedures. The graph shows that the majority (91%) of the population in the period before the introduction of the mobile money services were excluded from the financial services with traditional banking services with only 9% getting financial services. In 2009, mobile money was introduced, and five years later the figure of financially included population through mobile money rose to 49% while during this period the figure of bank customers served through traditional banking increased to only 14%. In 2014, data from Sauti Za Watu [30] show an increase of the population receiving financial services via mobile money from 19% to 61% while those served through the traditional banking services increased only from 5% to 19%. In 2016, the population served via traditional banking and mobile money increased to 22% and 80%, respectively.

Figure 1.
People with mobile money and bank accounts over time.
4.1.2. Penetration of Mobile Phone and Mobile Money Services
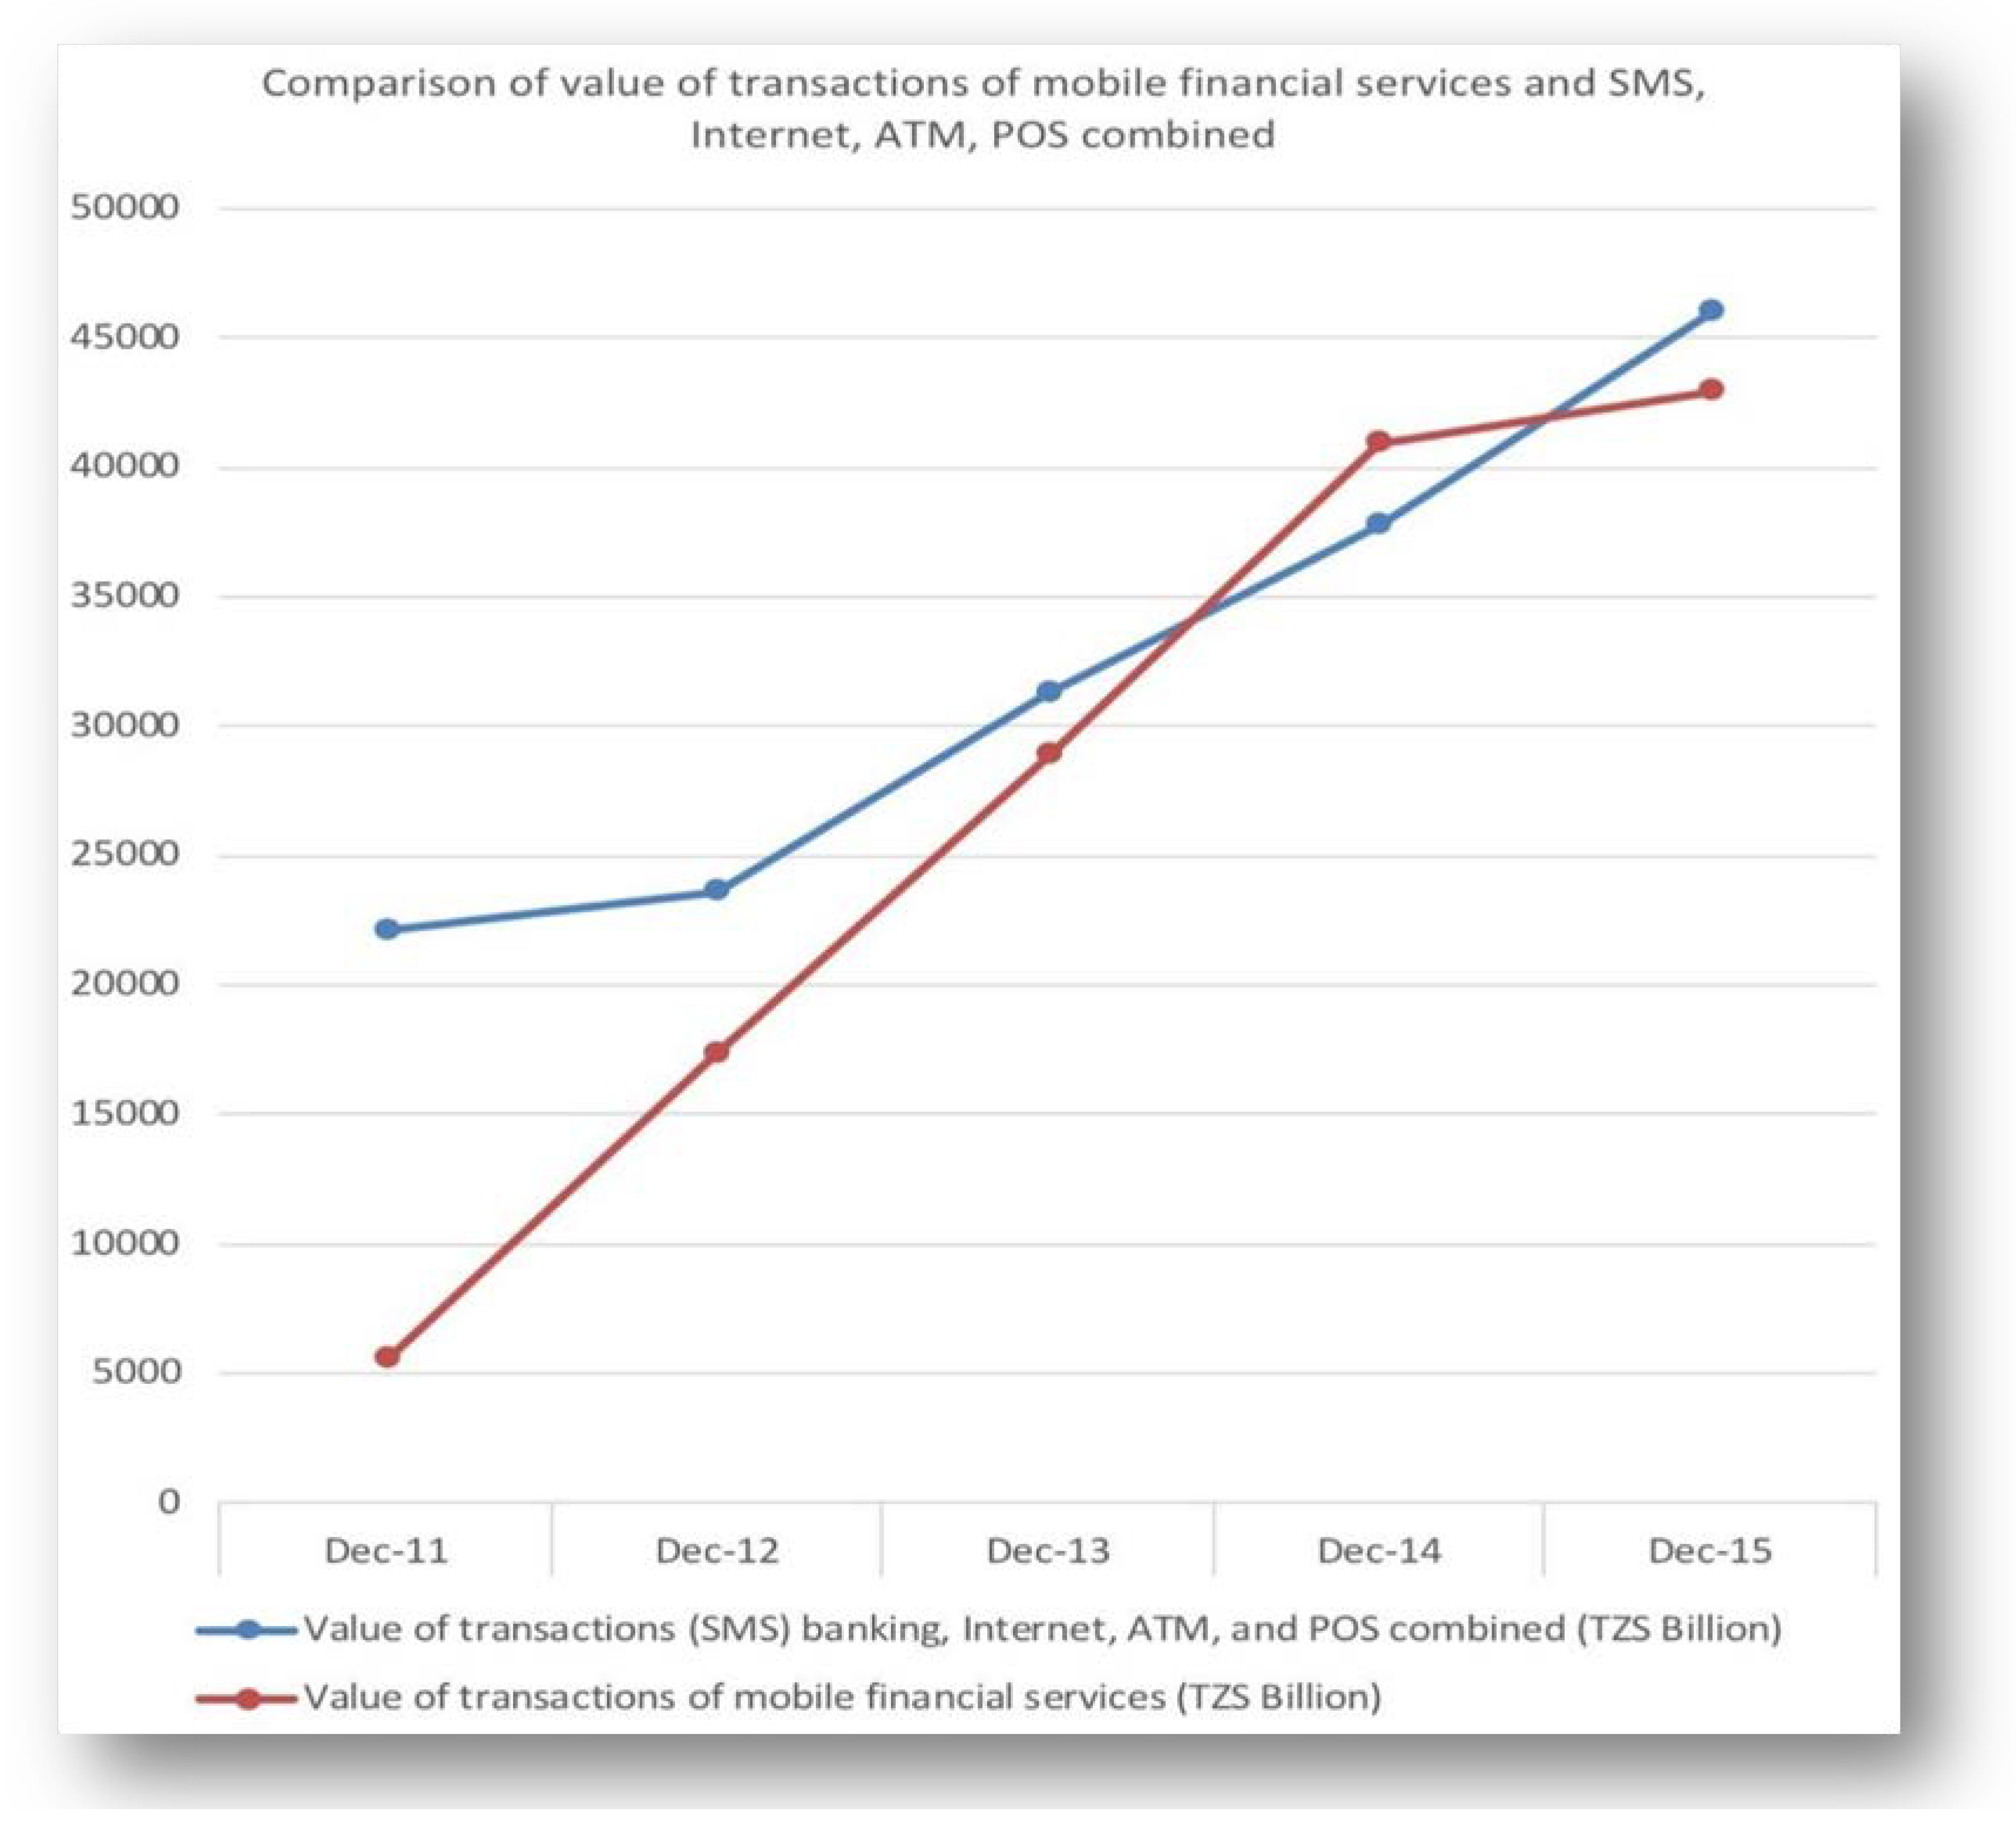
The penetration of mobile phones is a very important factor in spread of mobile money, and it is indeed very helpful in increasing the chances of improving financial services for the financially excluded population. Countries across the world have different level of mobile money penetration, hence, financial inclusion. Considering the access pattern for both traditional banking and mobile money financial services standing at 51% cumulatively, usage and storage are inseparable. As shown in Figure 1, the percentage of access to financial services through mobile financial services (80%) is higher than the access through traditional banking services (22%). This means the surge in transaction on the side of the banking system is mainly contributed by the mobile network operators through mobile financial services. As shown in Figure 2, in 2014, the value of transactions through mobile financial services was greater than through banking channels. The steady growth of the transaction of the mobile financial services from 2011 to 2014 is noted. Such steady growth of the value of transactions on the side of the banking channels is also noted in 2012—the effect of the synergy between the banking financial institutions and mobile network operators. Another factor that attributed to sharp increase in the value of SMS banking transactions and Internet Banking transactions was the increase in the number of banking institutions offering the mobile SMS and Internet banking: from 21 and 19 in 2014 to 30 and 23 in 2015, respectively (2015 DBS Annual report).
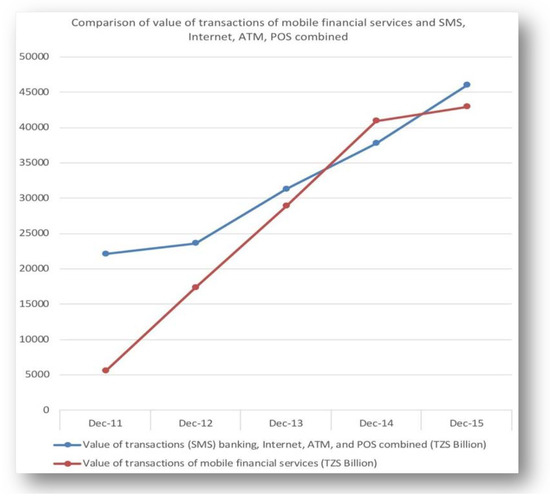
Figure 2.
Value of transactions at both MNOs and Banks financial services access points. Source: Bank of Tanzania, 2015 Annual Report and author’s computation.
The trend of mobile money service usage has shown a great improvement in several African countries. Among 23 African countries included in the global financial index database 2017, Tanzania is placed in a better position for number of adults holding mobile money account. According to Demirüc-Kunt et al. [6], about 47% of adults in Tanzania possess mobile money accounts. The country with many individual adults maintaining mobile money account in Africa is Kenya (82%) while the country with the lowest number of adults holding mobile money account is Southern Sudan (9%). Among 23 African countries, only eight are reported to perform better than Tanzania (with percent of adults holding mobile money in bracket): Uganda (59%), Zimbabwe (55%), Namibia (81%), Libya (66%), Ghana (58%), Gabon (59%), Kenya (82%) and South Africa (69%).
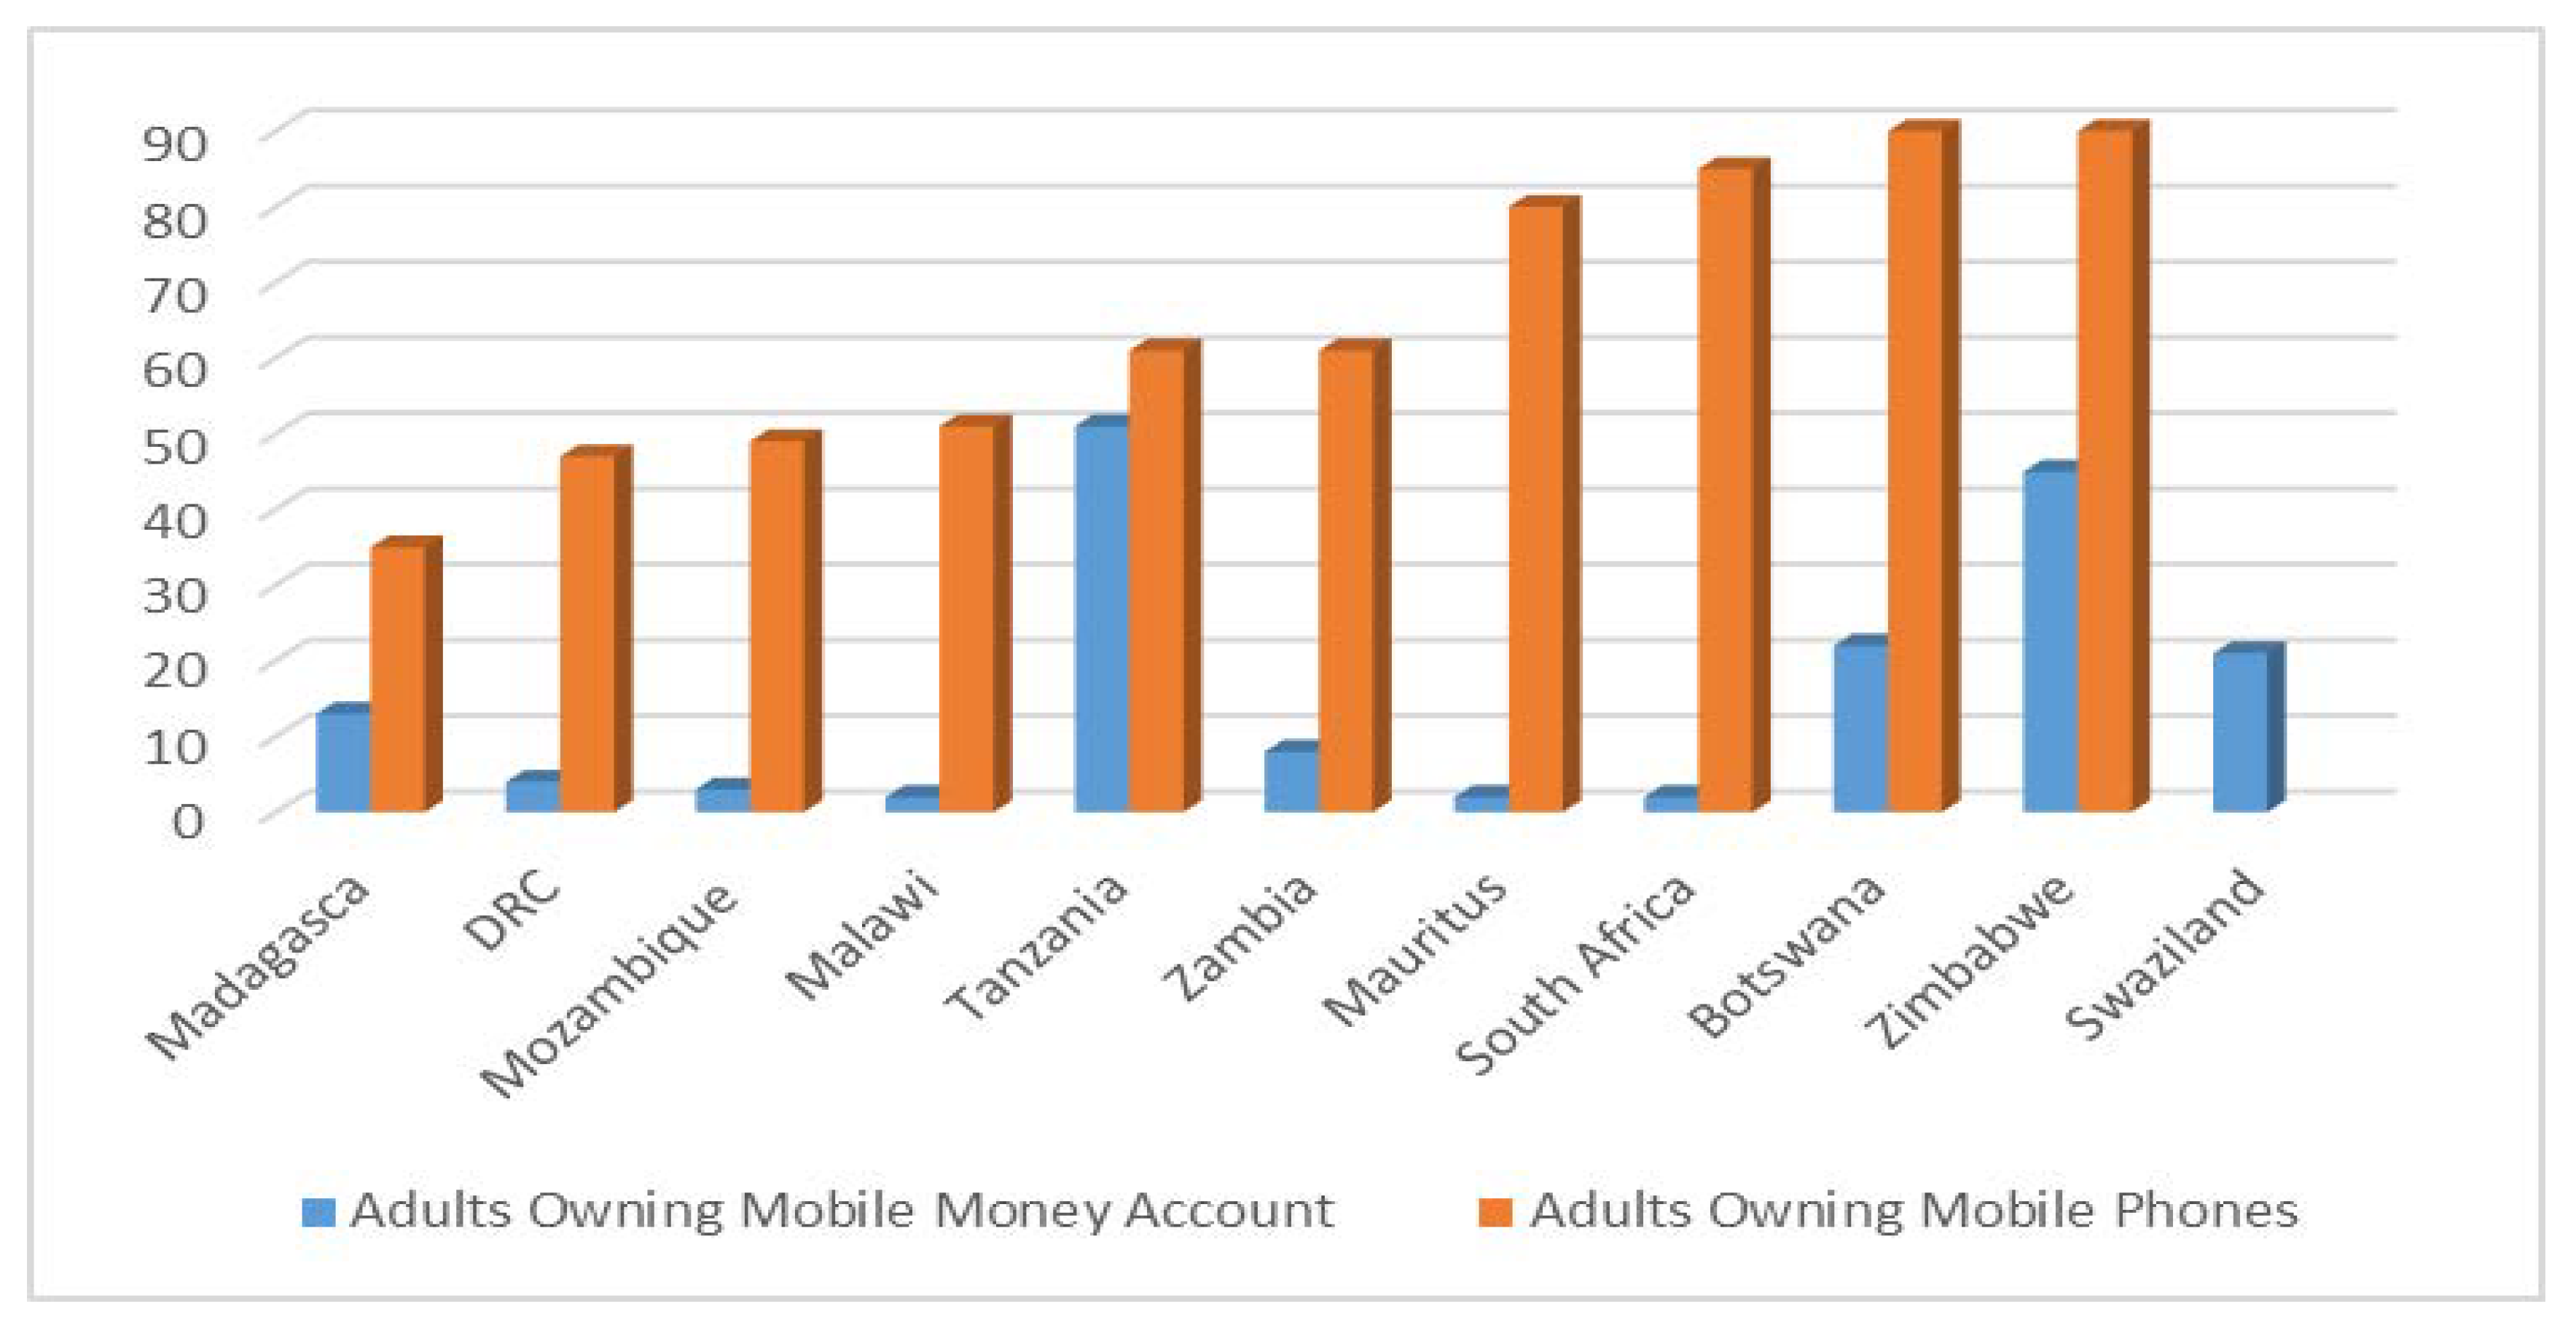
Using data from Finscope [29], this paper conducted an analysis to compare the penetration mobile phone and mobile money account ownership for 11 SADC countries, and the results are presented in Figure 3. Figure 3 show that, Swaziland is ranked number one with 92% of its adults owning a mobile phone while Madagascar is ranked the last in that order with only 35% of their adult population owning a mobile phone. This study shows that the level of per capita income of the country is unrelated to mobile money service penetration. Therefore, it is not surprising to find that Swaziland and Zimbabwe have higher mobile phone penetration than South Africa and Mauritius although their per capita income level is lower than the later. This suggests that there are factors at play other than income that explain mobile phone penetration across countries. More than 50% of the adults in most of the countries in the dataset possess mobile phones, except Madagascar, the Democratic Republic of Congo and Malawi. Lower level of mobile phone penetration in such countries may harm the level of financial inclusion because mobile money services may be at risk.

Figure 3.
Adults owning Mobile Phones and Mobile money Account. Source: Fincope Survey (2013).
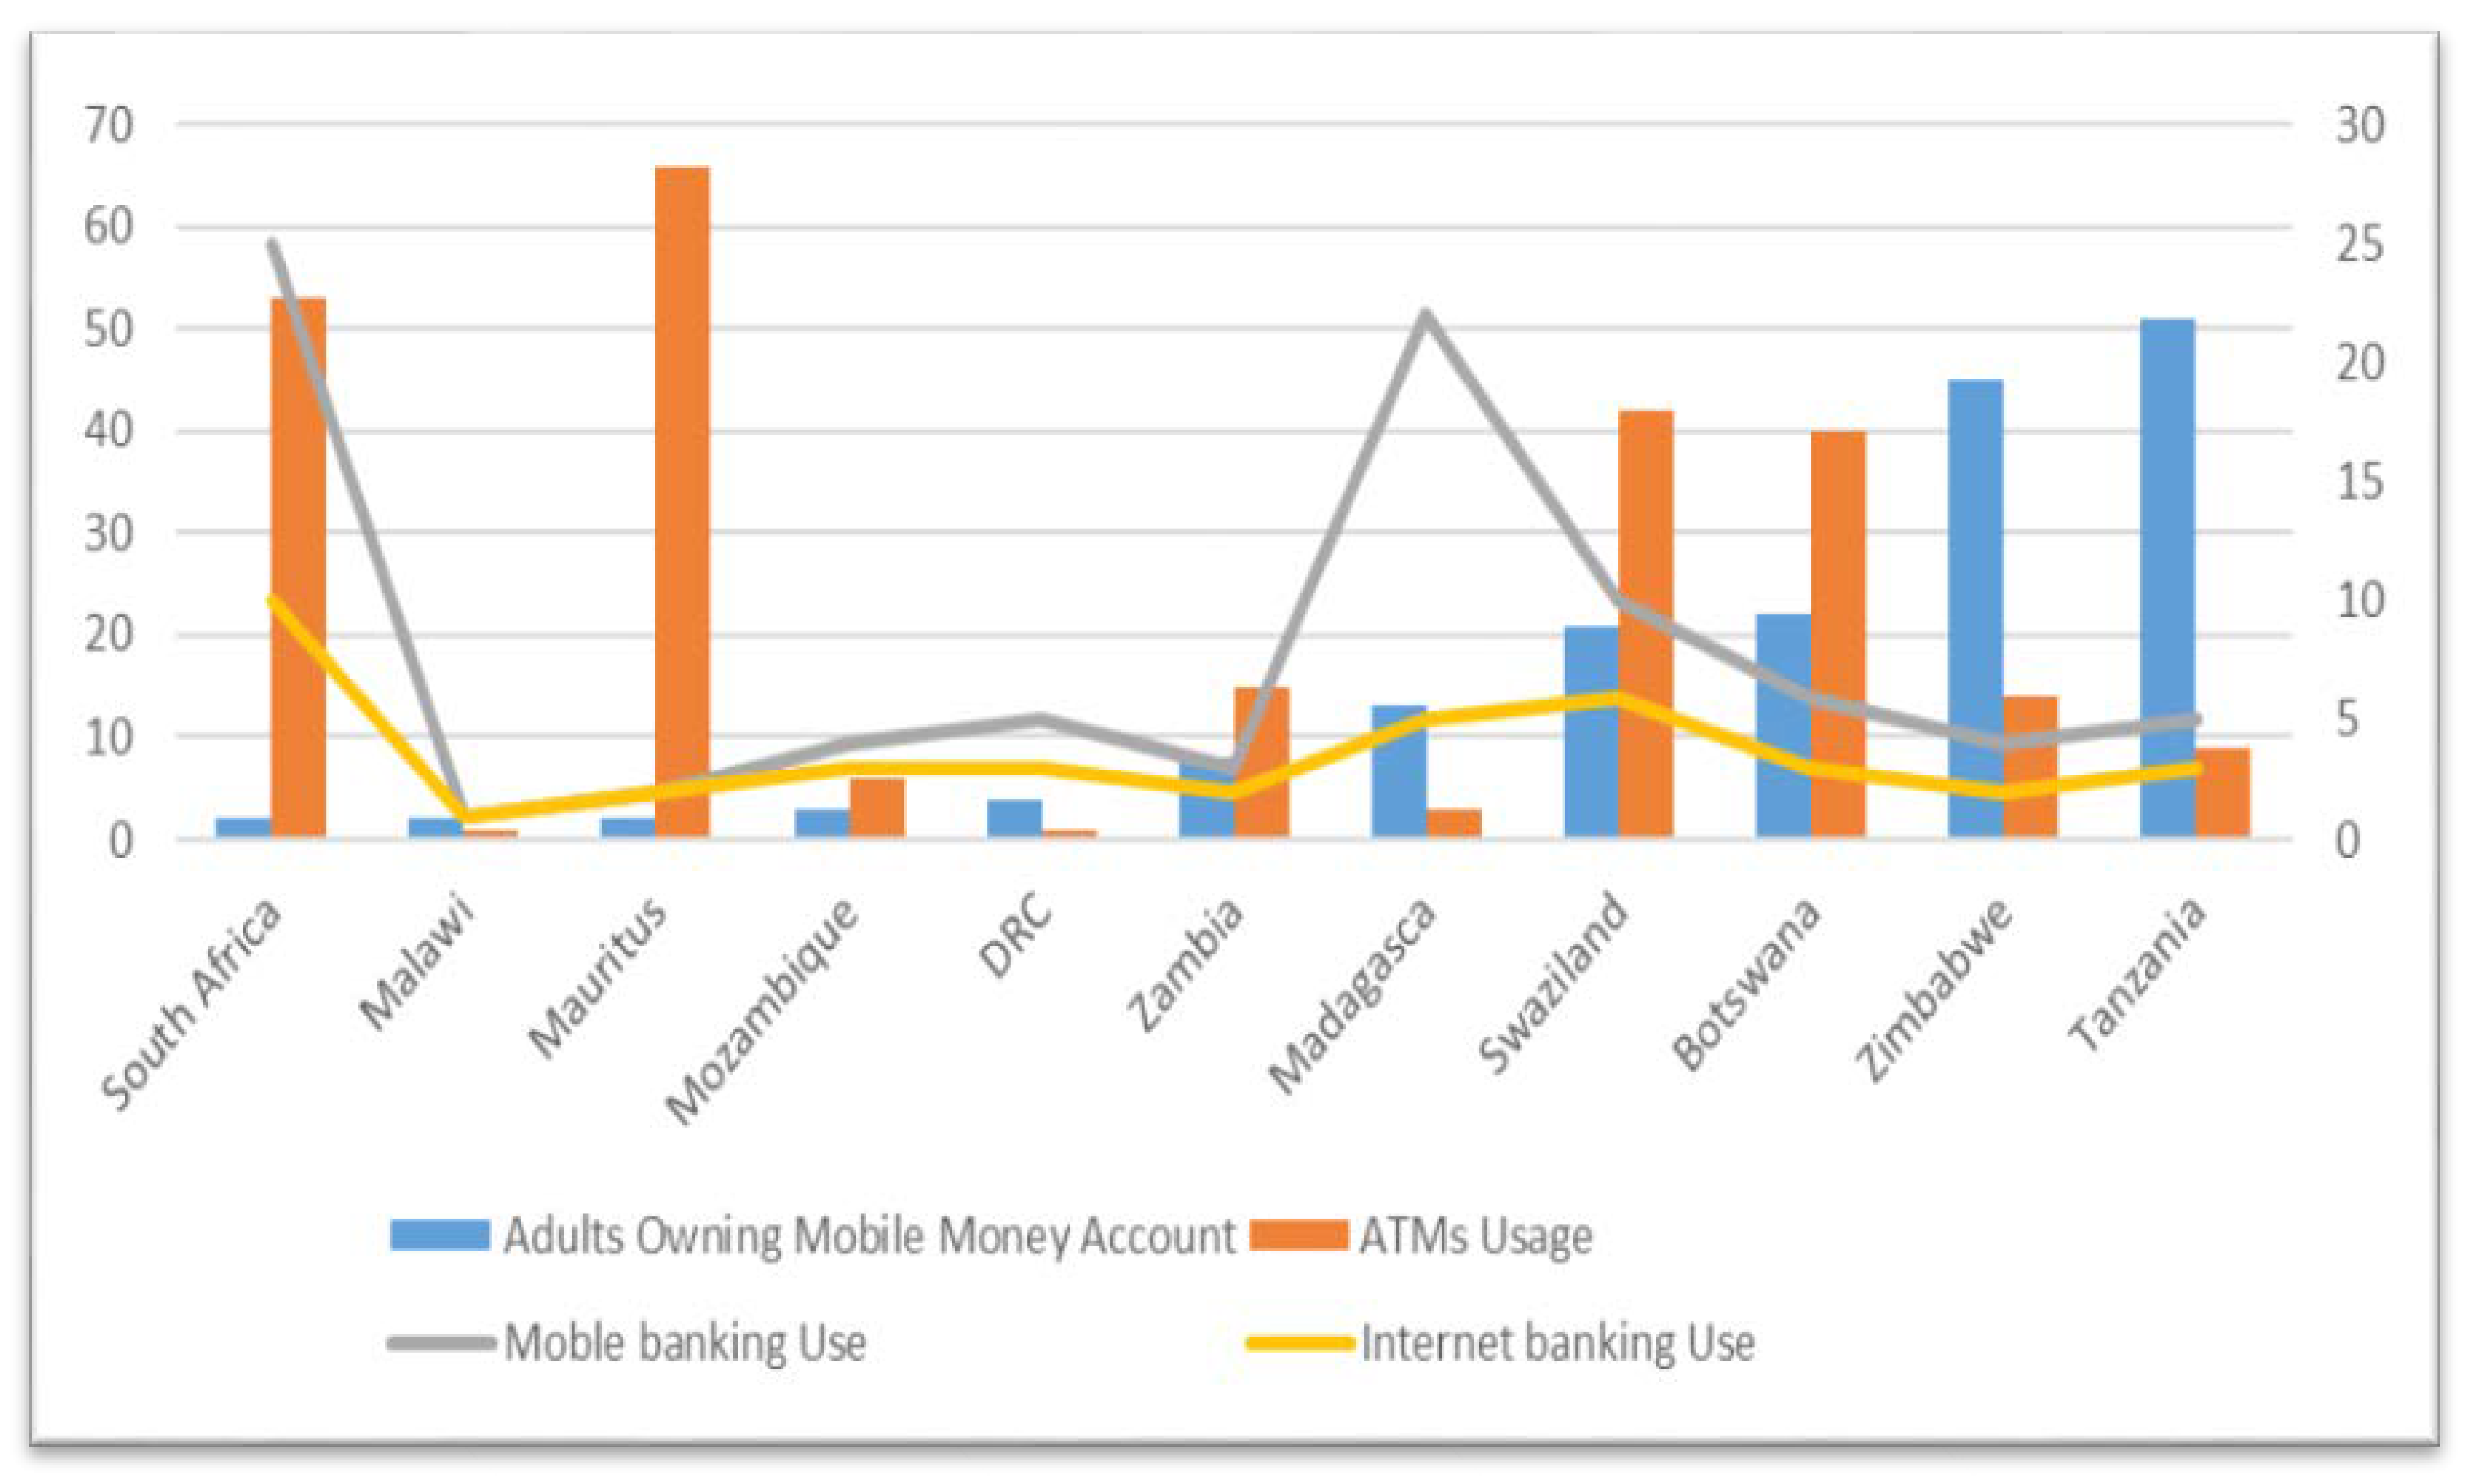
Figure 4 shows that not all countries with high mobile phone penetration rate have correspondingly higher rate of holding mobile money account. Tanzania ranks sixth in mobile phone penetration among 11 SADC countries involved in this study, while it ranks first in rate of holding mobile money account. Among 11 SADC countries, Tanzania leads in adult population having mobile money accounts (51%) followed by Zimbabwe (45%). The least countries are Mauritius, South Africa, Malawi, Mozambique, DRC, Zambia, Madagascar, Swaziland and Botswana, sequentially. Tanzania leads when compared to these countries since 83% of its adults who own mobile phones do hold mobile money account. This apparently shows that the development of mobile money service needs both improvement of mobile telecommunication infrastructures and mobile money service access.

Figure 4.
Mobile Money, ATMs Usage, Mobile banking and Internet banking. Source: Fincope Survey (2013).
4.1.3. The Role of Technology in Improving Financial Services
The improvement of technology has completely changed the ease of accessing financial services. The emergence of Automated Teller Machines (ATMs) has simplified the twenty-four-hour access to bank accounts, and this has been very helpful to users of financial services because, even after work hours, when banks are closed, customers can still get bank services. Moreover, banks also introduced mobile banking and Internet banking to further revolutionize the way people access their bank accounts. Mobile and Internet banking are the advancement of ATMs because, with mobile and Internet banking, customers access their bank accounts anytime and anywhere giving them both time and locational freedom. Furthermore, with mobile money, the customer has a choice to get financial services without even opening a bank account. Using data from Finscope [29], the level of technological advancement in delivering financial services is compared across 11 SADC Countries. When it comes to usage of ATMs across 11 SADC countries Figure 4 shows that, while South Africa and Mauritius lead in usage of ATMs, Tanzania, on the other hand, is outperformed by almost all other countries with less than 10% of its adults using ATMs to get banking services. Figure 4 further shows that the use of internet banking and mobile banking is the highest in South Africa and Madagascar and the lowest in Malawi and Zambia.
4.1.4. Customers Satisfaction on the Cost of Mobile Financial Services Delivery Channel
In what may be regarded as search for a more convenient and fast ways to transact, the mobile phone has greatly redefined the ecosystem of financial services delivery in Tanzania with a new niche that has attempted to match the customers’ preferences. This paradigm shift came into effect in 2008 when mobile payment services were first introduced in Tanzania.
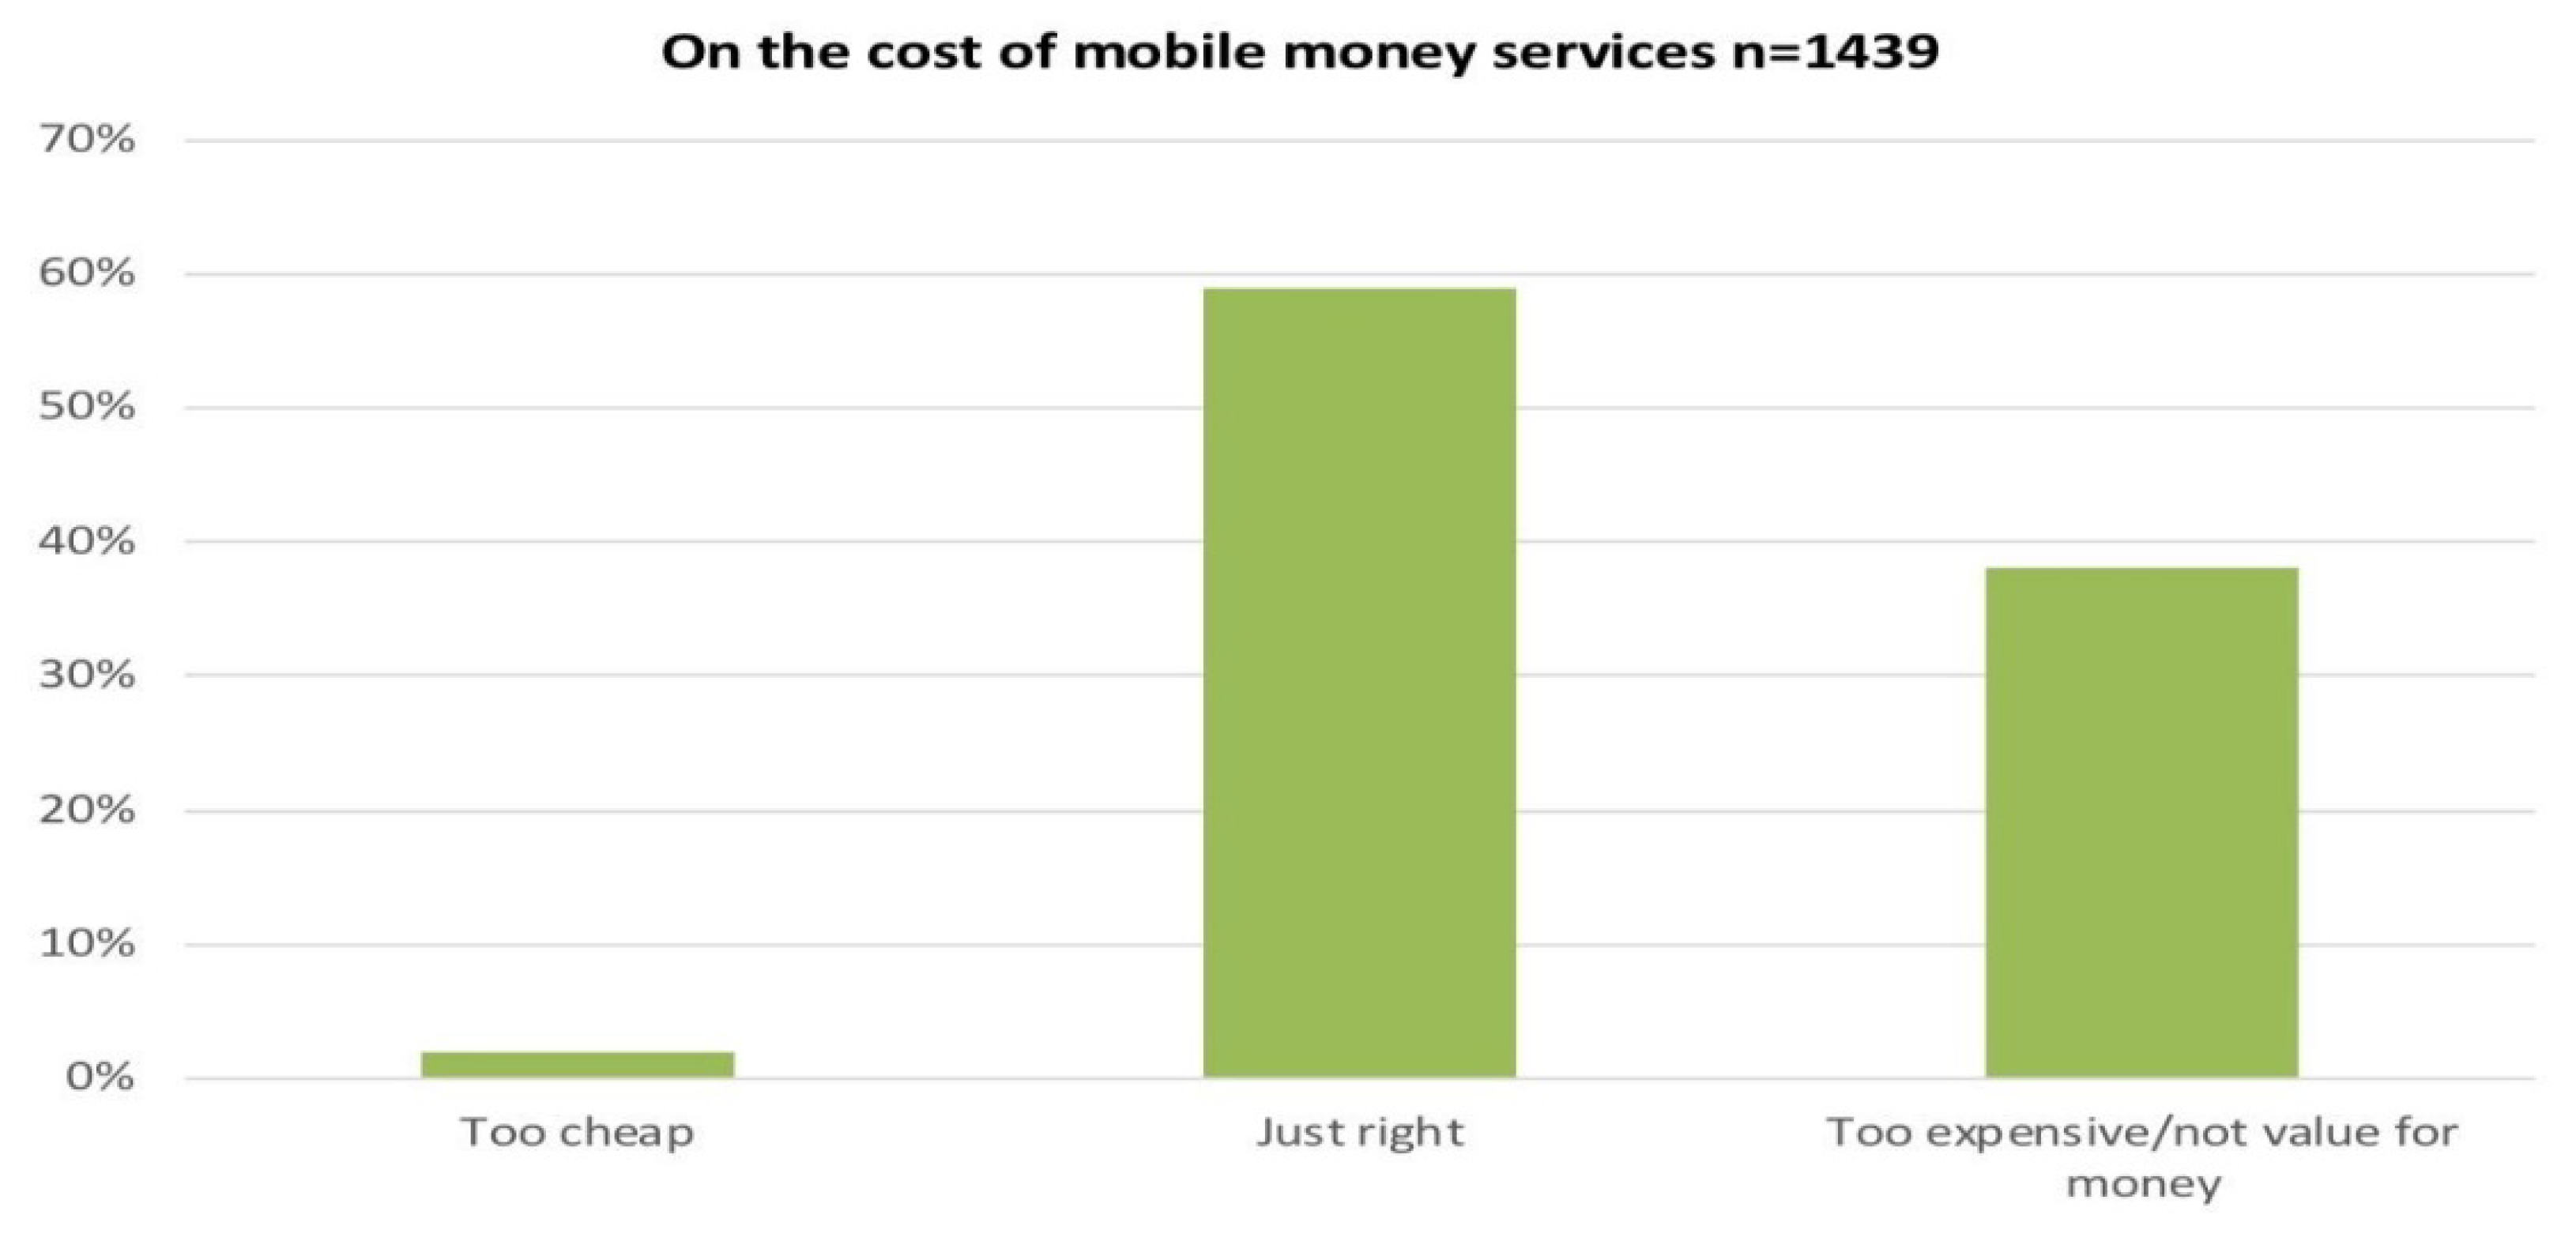
Thus, upon introduction of any new technology, it is important to know the level of consumer satisfaction. With regard consumers preference on the use of mobile financial services channels available in Tanzania, 6 in 10 consumers were satisfied with the mobile money services on the aspect relating to cost of mobile money services while about 4 in 10 consumers attributed mobile money services as too expensive or not having value for money (Figure 5). This satisfaction may be attributed to a sense of no other readily available alternative, and that mobile banking is far better than traditional banking; appreciation is expected. This finding sends a clear signal to MNOs on the need of further improvements to their services regarding cost and access. In addition, the dynamics of the industry may push them into irrelevance if far better alternatives for financial delivery services evolve.

Figure 5.
Cost of mobile money services. Source: Sauti za wananchi;brief No. 38 and author’s computation.
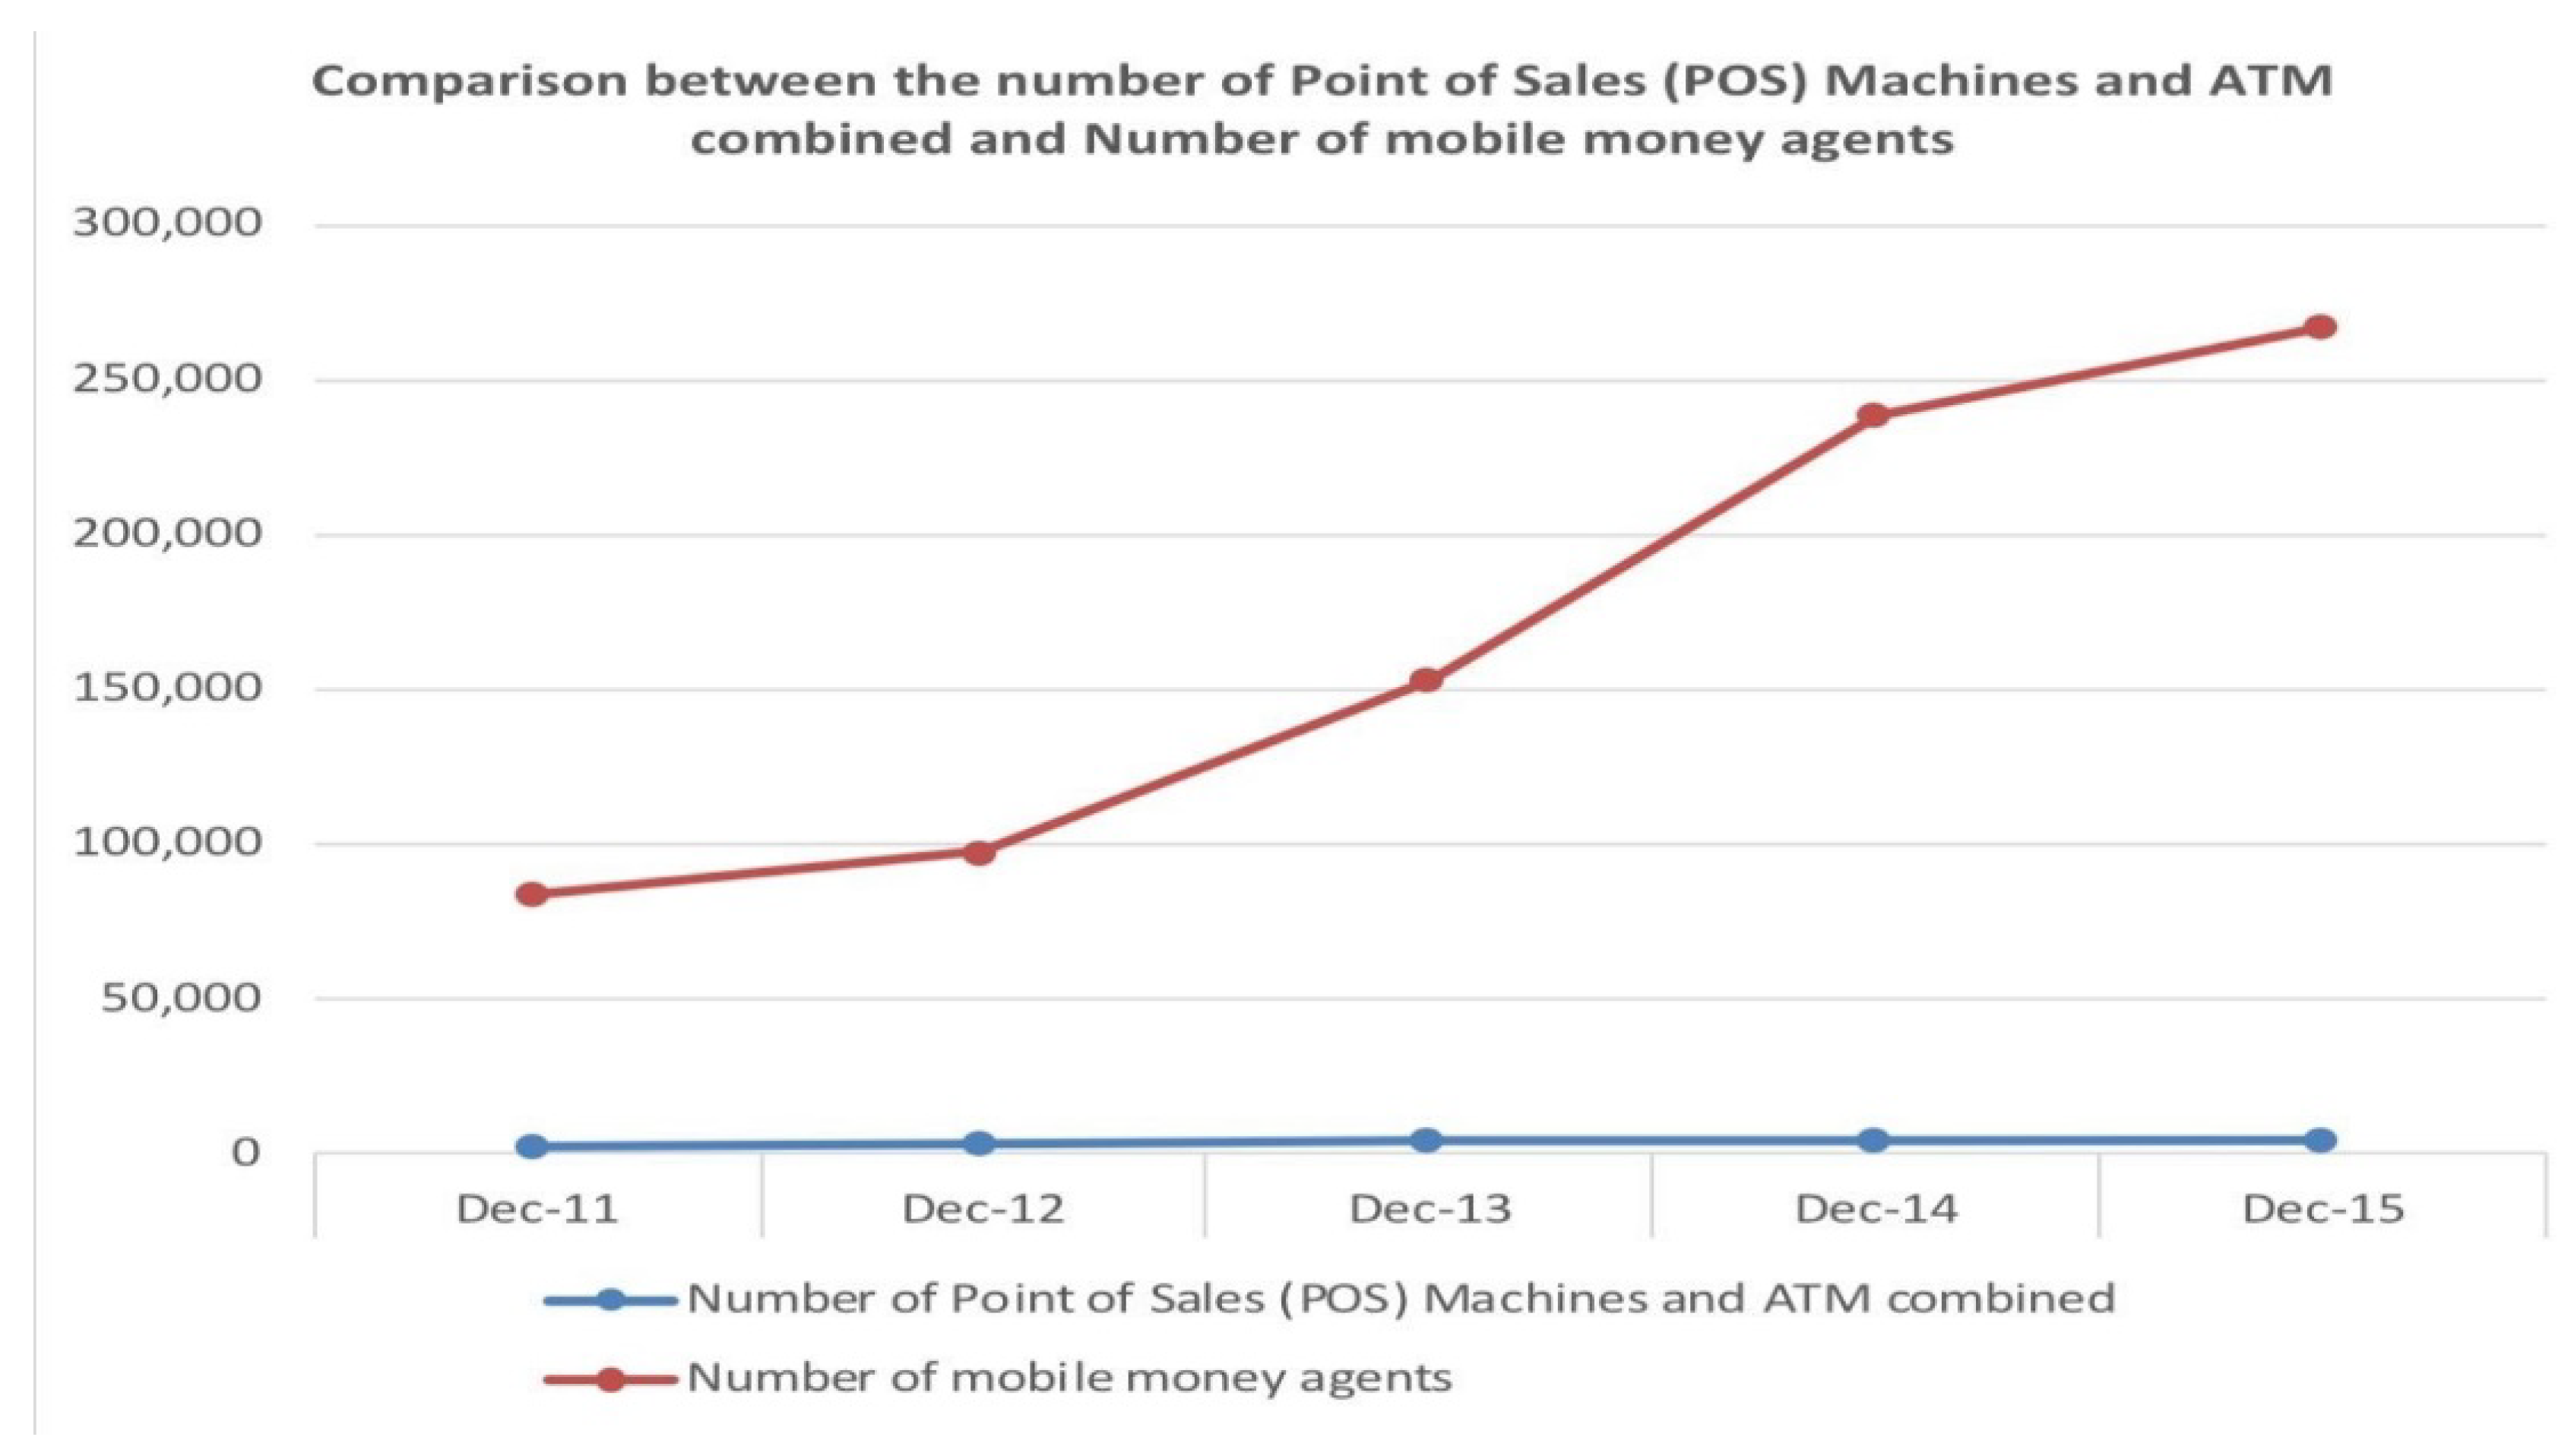
As the means to majority of the population on financial services delivery, MNOs have by far out performed the traditional banking system, in terms of access points. As shown in Figure 6, while traditional banking system access points are still under 5000 cumulatively, those of the mobile financial services are 50-fold ahead. It must be noted that these differences are justifiable in terms of investment cost involved. Thus, the technological advancement on the side of the new entrants has made delivery of financial services even easier than before; without it, no great development could have been made in widening the reach within the traditional banking ecosystem due to the nature of the technology involved-bricks and mortar.

Figure 6.
The comparison of financial access points for MNOs and banks. Source: Bank of Tanzania and authors’ computation.
4.2. Analytical Insights
4.2.1. The Determinants of Mobile Money Adoption
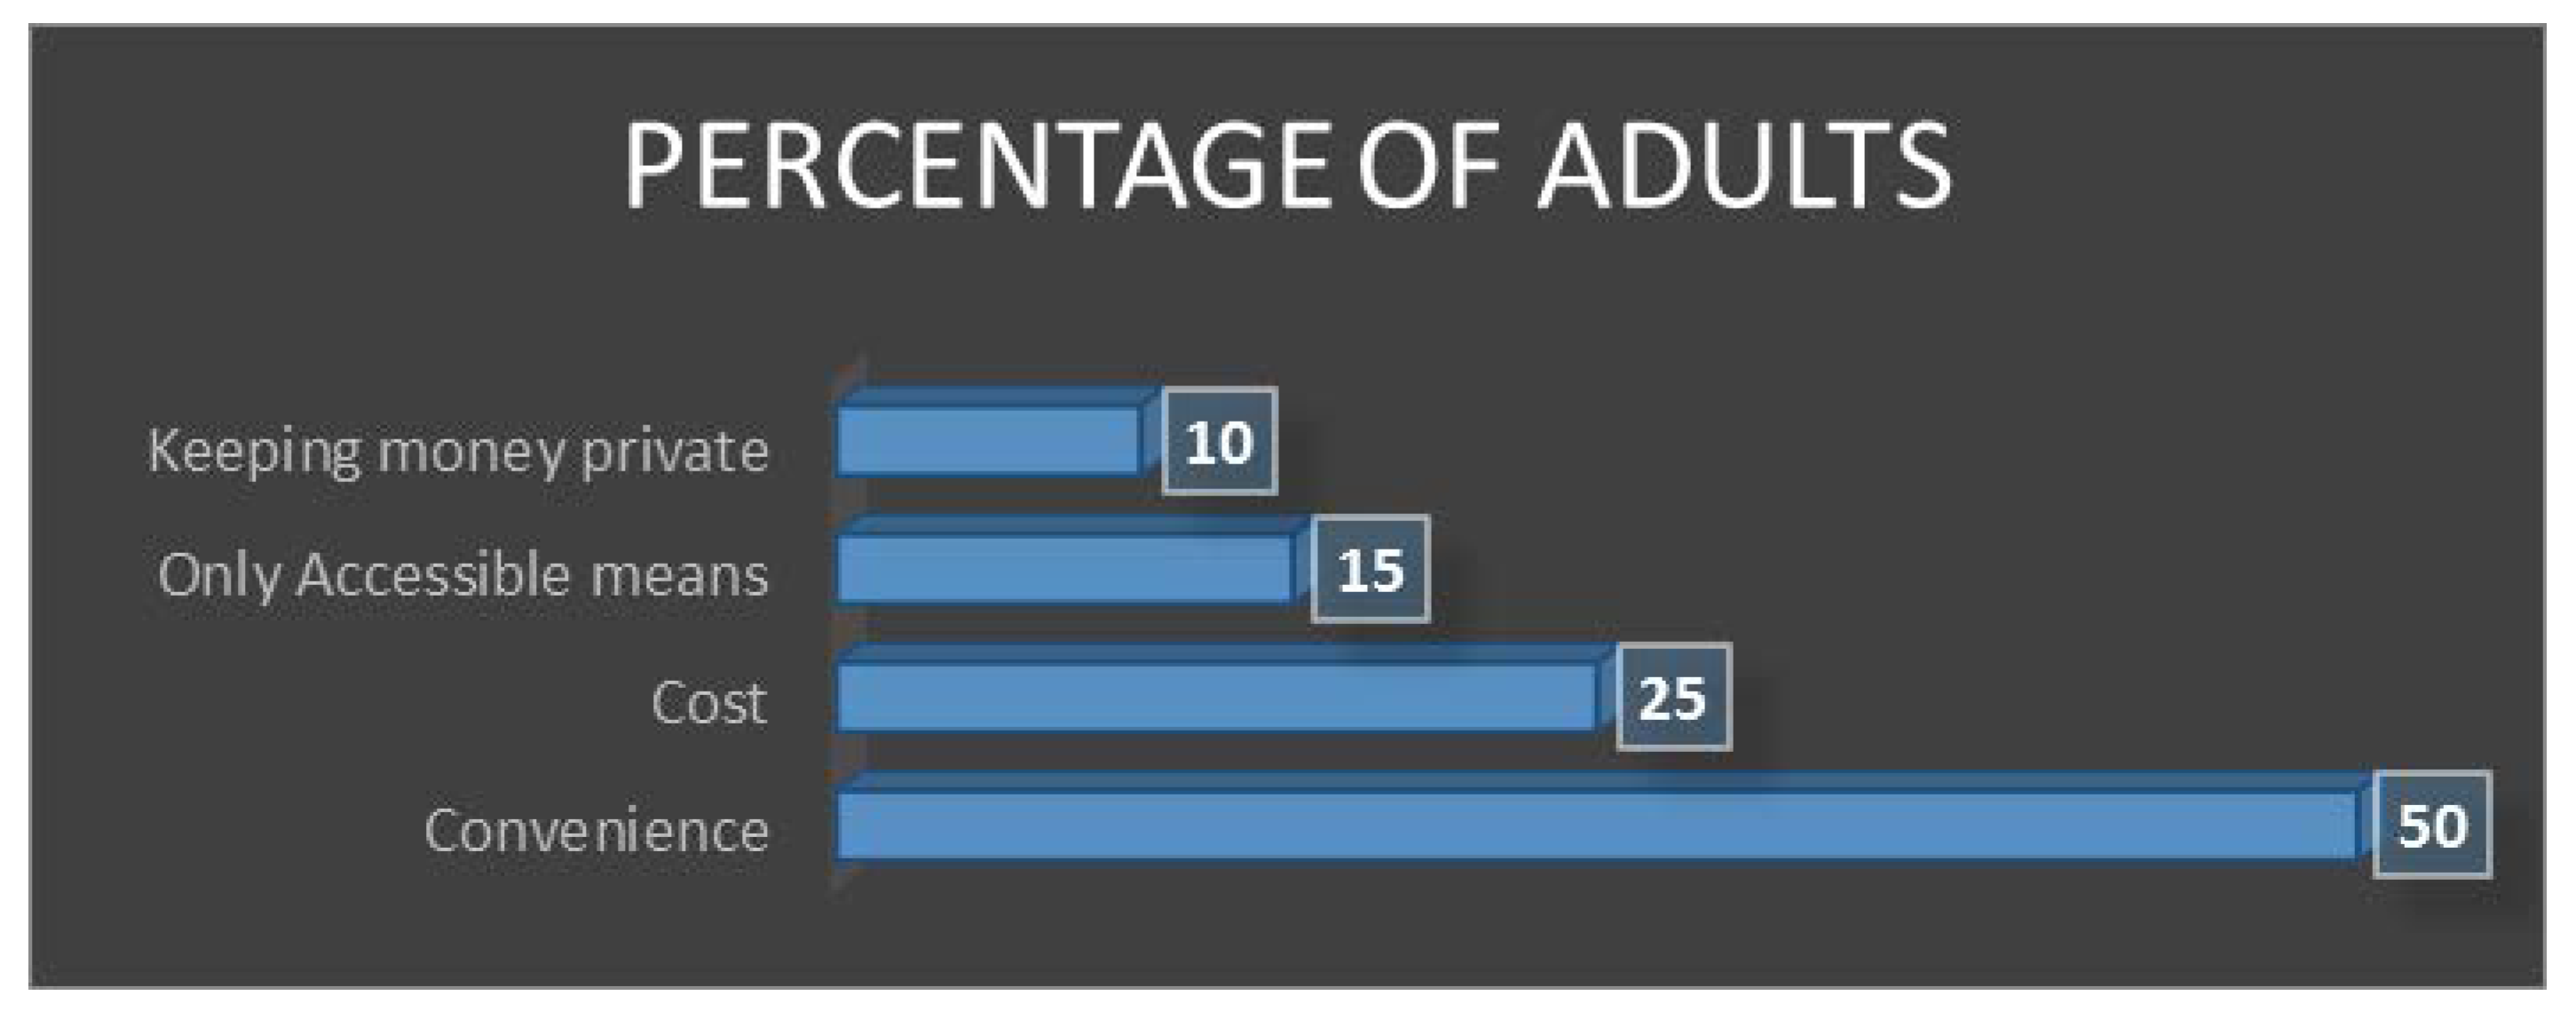
To determine the most influential factors of mobile money account ownership, respondents of this study were asked to rank the reasons for their choices of opening and maintaining mobile money account. Four reasons were listed for respondents to rank, based on which reason sounds most appealing for their choices, to register a mobile money account. Such reasons are convenience, cheapness, mobile money being the only means and keeping money private. The results presented in Figure 7 show that almost 75% of respondents said they opened a mobile money account because of convenience and low cost while 15% of the respondents said that they maintain the mobile money account because it is the only means available to access financial services. Only 10% of the respondents cited keeping money private as a reason for using mobile money. In general, people use mobile money for its convenience and cost as reflected in this paper.

Figure 7.
Reasons for Maintaining Mobile Money Account.
Studies also show that, apart from convenience and cost, demographic factors such as educational level of the mobile money service user and age are equally important factors which influence the adoption of the mobile money services (see, for example, Mas and Kumar, [18]). It should be appreciated that education enables mobile money usage and those without education face a lot of challenges. As shown in Figure 8 mobile phone ownership increases with increased levels of education. Figure 8 also shows clearly that education has a direct link with mobile phone ownership. The figure shows that only 20% of households without any formal education possess mobile phones followed by 25% of those with primary education and then 31% of those with secondary education. The proportion of households with post-secondary education holding mobile phones is higher than all categories and goes as higher as 43%. However, the trend of mobile phone ownership does not directly the usage of mobile money services as the usage is low among those with secondary education and higher among those with primary and post-secondary education, as stipulated in Figure 8.
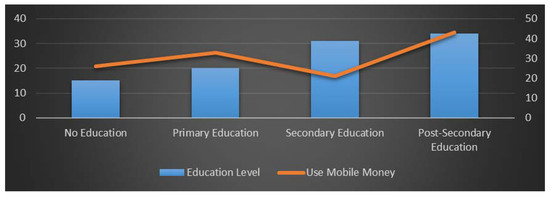
Figure 8.
Education Level and Use of Mobile Money.
A comparison of mobile phone ownership across the age groups was conducted to see the correlation between age and use of mobile money service. Figure 9 shows that mobile phone ownership is higher among the adults with families (52%) followed by youths (32%) and lowest among retired group (16%). Similarly, mobile money account ownership follows a similar tend with that of mobile phone ownership with 56%, 26% and 18% for adults with families, youths and retired group, respectively. When you compare the adoption of mobile phone with mobile money account you can find that they are strongly related implying that mobile money account ownership may be enhanced heavily by improving the adults’ ability to own and use mobile phones.
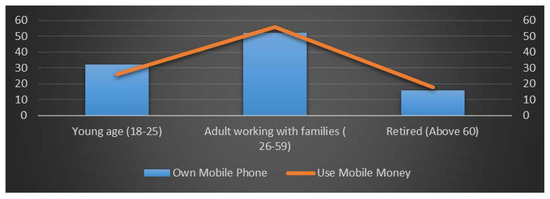
Figure 9.
Age group and Use of Mobile Money.
4.2.2. Probit Regression Results
In this paper, probit regression was applied to examine the determinants of financial inclusion in Tanzania. Table 1 shows probit estimations of the determinants of financial inclusion measured by formal bank account and that for mobile money service adoption. The dependent variables are presented at the top of each column. Independent variables are gender, age, income and education. Estimated marginal effects are presented and standard errors are in parentheses. The results in Table 1 observe that all independent variables are statistically significant at 1% significant level.

Table 1.
Determinants of the main financial inclusion indicators.
Regarding gender, the result shows that for a respondent who is a woman, the probability of having a formal bank account (formally financially included) reduces significantly. This is evidenced by a negative relationship, indicated in Table 1, between gender and financial inclusion (holding a formal bank account). This result supports the fact that women face many challenges to be financially included. According to Demirgüç-Kunt et al. [6], inability to show collateral, poor awareness on financial education and less business experience are some of the major reasons for such gender gap in formal financial inclusion.
The usefulness of education in financial inclusion may be evidenced from significant coefficients of the two levels of educations shown in the results presented in Table 1. The results show that, as the level of education of the respondent increases, the individual is more likely to be financially included. The possible reason for this observation may be clearly linked with the financial ability of educated individuals to afford holding a bank account and presenting personal guarantees when required by the banks during loan application because the level of education goes parallel with the income level (Demirgüç-Kunt et al.) [6].
The results further show that Age is non-linearly related to financial inclusion, with a positive and significant coefficient for variable “Age” and a significantly negative for Age2. This implies that individuals in a higher age group are more likely to be financially included, but after a certain age group, the probability of being financially included decreases.
Furthermore, the table shows that higher income is related to higher financial inclusion. The dummy variables created for income are all statistically significant and negative for the financial inclusion indicators. The results imply that when the level of income increases all the obstacles of one being financially included is reduced significantly. People with high income are most likely capable of having personal guarantees and collaterals which makes their borrowing ability easy as opposed to poor people who cannot be trusted by banks, Allen et al. [5].
The results also show the marginal effects of the explanatory variables on financial inclusion. It is shown in Table 1 that the most important factors in determining the financial inclusion are education and income of the respondents. According to the results, the probability of a person with post-secondary education to be financially included (having formal bank account) increases by 39% and that of income increases by 19%. However, it is noticed that being a woman decreases the probability of having a formal account by 2%. This result highlights the fact that gender is not the main explanation of formal exclusion in Tanzania.
The findings generally show that, when you are a man, more educated and older, your chances of being financially included is higher than when you are a woman, less educated and younger.
Due to the fast growth of mobile banking in Tanzania, the study also examined the determinants of mobile banking. Because mobile banking is a way of improving the financial inclusion of people, the same factors affecting financial inclusion are considered as presented in the last column of Table 1. A comparative analysis is made between financial inclusion via traditional banking services (formal bank account) and mobile banking services (mobile banking account). The key conclusion is that mobile banking is affected by the similar factors with traditional banking in Tanzania.
All variables—gender, age, income and education—show similar relationships with both traditional banking services and mobile banking. According to the comparative analysis, it is shown that, being a female reduces the probability of holding a mobile account and of opening a formal bank account (−2% and −1.9%). As in the previous discussion on traditional banking services (formal bank account), age has a non-linear relationship with mobile money account while income is negatively related to mobile account.
In any case, whether in traditional banking services or mobile banking, the income level of individuals decreases the probability of one to subscribe to formal bank account (−2.3% for the income level 2 (20% quintile) or mobile account (−7.6% for the income level 2 (20% quintile). The analysis in Table 1 also shows that post-secondary education has higher coefficients compared to secondary education, and directly associates with all indicators implying that the more educated the individuals are the more likely they will have a mobile money and formal bank account with coefficients of about 45% and 39% respectively.
5. Conclusions
Developing economies, such as Tanzania, have low financial inclusion as compared to their developed counterparts. Since financial inclusion can be considered as a tool for poverty reduction, studying its determinant is inevitable. This study investigated the determinants of financial inclusion in Tanzania using the survey data from Sauti za Wananchi, Africa’s first nationally representative high frequency mobile phone survey conducted by TWAWEZA. Employing the Probit regression, the findings of this paper reveal the following. First, if you are a man, financially sound, have a good education and are relatively older, then you stand a better chance of being financially included.
The results further show that, as the level of education increases, the individual is more likely to be financially included. The possible reason for this observation may be clearly linked with the financial ability of educated individuals to afford holding a bank account and presenting personal guarantees when required by the banks during loan application because the level of education goes parallel with the income level. In addition, the results confirm a gender gap in formal financial inclusion, and this may be due to inability of women to show collateral, their poor awareness on financial education and lower business experience.
This finding may be used as a wake-up call for policy makers to target certain groups of population such as women and young people so that they may not be left behind in Government’s effort towards financially including the entire population.
The paper also shows that similar determinants for traditional banking services apply also for mobile banking services reflecting similar patterns, except that mobile banking services simplify more provisions of financial services such as service time and costs. The descriptive analysis has shown the negative trend and a clear departure of customers’ usage from banking retail services to mobile financial services. This is observed in the value of transactions made in mobile financial services compared to value of transactions in traditional banking channel overtime. Although this gap has narrowed recently, the best option with the banking sector is to create more new delivery channels while using mobile financial services as an infrastructure to deepen financial access reaching more un-banked population.
From the outset, the banking industry has a clear choice. The competition is not likely an option at hand. The best option is to create more delivery channels while using mobile telecommunication network as an infrastructure to deepen financial access reaching more unbanked population. By any measure, the flow of new entrants in delivery of financial services to the excluded is inevitable. These new entrants have several competitive advantages, including the time factor; convenience; high accessibility; reliability, given the wider network they enjoy countrywide with penetration level of over 80%; and the trust already created among the users of the service.
This study would benefit very much from secondary data related to financial inclusion as the present one is based on only primary data. The future study should increase the scope to include other African countries and utilize secondary data to perform more detailed analysis.
Funding
This research received no external funding.
Acknowledgments
I acknowledge the generosity of TWAWEZA to allow me using their data.
Conflicts of Interest
The author declares no conflict of interest.
References
- National Financial Inclusion Framework. A Public-Private Sector Initiative; National Council for Financial Inclusion: Dar es Salaam, Tanzania, 2014.
- National Financial Inclusion Framework. A Public-Private Sector Initiative; National Council for Financial Inclusion: Dar es Salaam, Tanzania, 2017.
- World Bank. Gender and Development. World Development Report; World bank: Washington, DC, USA, 2012. [Google Scholar]
- FinScope Tanzania. Insight that Drive Innovation; Financial Sector Deepening Trust: Dar es Salaam, Tanzania, 2017; Available online: www.fsdt.or.tz/.../FinScope-Tanzania-2017 URL (accessed on 6 August 2018).
- Allen, F.; Demirgüç-Kunt, A.; Klapper, L.; Peria, M.S.M. The foundations of financial inclusion: Understanding ownership and use of formal accounts. J. Financ. Intermed. 2016. [Google Scholar] [CrossRef]
- Demirüc-Kunt, A.; Klapper, L.; Singer, D.; Ansar, S.; Hess, J. Measuring financial inclusion and the fintech revolution. In The Global Findex Database 2017; The World Bank: Washington, DC, USA, 2018. [Google Scholar]
- Naceur, M.S.B.; Barajas, M.A.; Massara, M.A. Can Islamic Banking Increase Financial Inclusion? 15–31; International Monetary Fund: New York, NY, USA, 2015. [Google Scholar]
- Hoernig, S.; Bourreau, M. Interoperability of Mobile Money: International Experience and Recommendations for Mozambique; A Final Report, S-36404-MOZ-1. 2016. Available online: https://www.theigc.org/wp-content/uploads/2017/01/Hoernig-et-al-2016-Final-Report.pdf (accessed on 5 August 2018).
- Aron, J. ‘Leapfrogging’: A Survey of the Nature and Economic Implication of Mobile Money; Centre for the Study of African Economies, University of Oxford: Oxford, UK, 2015. [Google Scholar]
- Gibney, C.; Trites, S.; Ufoegbune, N.; Levesque, B. International Review: Mobile Payments and Consumer Protection; Research Division, Financial Consumer Agency of Canada: Ottawa, ON, Canada, 2015. [Google Scholar]
- United Nations Conference on Trade and Development (UNCTAD). Mobile Money for Business Development in the East African Community: A Comparative Study of Existing Platforms and Regulations; United Nation: Geneva, Switzerland, 2015. [Google Scholar]
- Klein, M.; Mayor, C. Mobile Banking and Financial Inclusion: The Regulatory Lessons; Frankfurt School, Working Paper No. 166; The World Bank: Washington, DC, USA, 2011. [Google Scholar]
- Deloitte. Can You Carry Your Own Money in Your Mobile? M-Banking and M-Payments: The Next Frontier. Deloitte: New York, NY, USA, 2013. [Google Scholar]
- Malady, L.; Buckely, R. Regulation of Mobile Money in Emerging Markets—State of Play; Centre for International Finance and Regulation, Project No. E226; The United Nations Capital Development Fund: Brussels, Belgium, 2014. [Google Scholar]
- Anderson, L.C.; Biscaye, P.; Alyward, C.; Coney, S.; Hutchinson, B.; Reynolds, T. Review of Interoperability and Regulation of Mobile Money; A report; University of Washington: Seattle, WA, USA, 2015. [Google Scholar]
- Economides, N.; Jeziorski, P. Mobile Money in Tanzania. Forthcom. Mark. Sci. 2016, 36, 815–837. [Google Scholar] [CrossRef]
- Khiaonarong, T. Oversight Issues in Mobile Payments; IMF Working Paper No. 14/123; International Monetary Fund: Washington, DC, USA, 2014. [Google Scholar]
- Mas, I.; Kumar, K. Banking on Mobiles: Why, How, for Whom? Focus Note 48; CGAP: Washington, DC, USA, 2009. [Google Scholar]
- Bank of Tanzania. Annual Report; Directorate of Banking Supervision; BOT: Dar es Salaam, Tanzania, 2016. [Google Scholar]
- Gutierrez, E.; Choi, T. Mobile Money Services Development. The Cases of Republic of Korea and Uganda; Policy Research Working Paper 6786; The World Bank: Washington, DC, USA, 2014. [Google Scholar]
- Raphael, G. Efficiency of commercial banks in East Africa: A non parametric approach. Int. J. Bus. Manag. 2013, 8, 50. [Google Scholar] [CrossRef]
- Calleo. Payment Technologies: Accessing the Unbanked: Branchless Banking in Africa: Delivering a Secure and Cost-Effective Solution to Gain New Customers; iVeri Whitepaper—Branchless Banking in Africa: Cape Town, South Africa, 2014. [Google Scholar]
- Sarma, M.; Pais, J. Financial inclusion and development. J. Int. Dev. 2011, 23, 613–628. [Google Scholar] [CrossRef]
- Fungáčová, Z.; Weill, L. Understanding financial inclusion in China. China Econ. Rev. 2015, 34, 196–206. [Google Scholar] [CrossRef]
- Tuesta, D.; Sorensen, G.; Haring, A.; Camara, N. Financial Inclusion and Its Determinants: The Case of Argentina, No. 1503. 2015. Available online: https://www.bbvaresearch.com/wp-content/uploads/2015/01/WP_15-03_Financial-Inclusion-in-Argentina.pdf (accessed on 4 August 2018).
- Chithra, N.; Selvam, M. Determinants of Financial Inclusion: An Empirical Study on the Inter-State Variations in India. 2015. Available online: https://papers.ssrn.com/sol3/papers.cfm?abstract_id=2296096 (accessed on 4 August 2018).
- Camara, N.; Peña, X.; Tuesta, D. Factors that matter for financial inclusion: Evidence from Peru. BBVA Res. 2015, 10, 10–31. [Google Scholar]
- Zins, A.; Weill, L. The determinants of financial inclusion in Africa. Rev. Dev. Financ. 2016, 6, 46–57. [Google Scholar] [CrossRef]
- FinScope Tanzania. Widening Your Financial Future; Financial Sector Deepening Trust: Dar es Salaam, Tanzania, 2013; Available online: www.fsdt.or.tz/.../FinScope-Tanzania-2013 (accessed on 4 August 2018).
- Twaweza East Africa. Money Matter; Citizen and Financial Inclusion; Brief No. 38; Twaweza East Africa: Dar es Salaam, Tanzania, 2016. [Google Scholar]


© 2018 by the author. Licensee MDPI, Basel, Switzerland. This article is an open access article distributed under the terms and conditions of the Creative Commons Attribution (CC BY) license (http://creativecommons.org/licenses/by/4.0/).