Abstract
Research of travel behaviors of university students is of theoretical and empirical importance. The literature, however, has paid little attention to mode choice of students at college towns. This study aims to specifically explore influence factors of the mode choice of college town students. After conducting a survey of commuter students at Iowa State University, a college-town university in the United States, the study uses both simple statistics and advanced statistical models (e.g., multinomial logit and nested logit models) to analyze the data and produces findings to confirm and test existing knowledge and to gain new insights. Firstly, students at a college town are more likely to adopt greener (non-driving-alone) modes, especially walking, to commute compared to their counterparts at urban universities; this is as revealed in the literature. Secondly, students may use “bundled services” to fulfill their travel needs. The students who prioritized rent affordability in housing choice tend to live in proximity to bus stops and are more likely to ride buses. Lastly, commuter students who do not drive alone to school tend to prefer a residence with transit proximity. Moreover, students who reside in proximity to transit and who reported “peer effects” would use non-driving modes more if commute time was shortened.
1. Introduction
In recent years, travel behaviors of university students have caught increasing attention among both researchers and policy makers [1,2,3,4,5,6,7,8,9,10,11,12]. The related research is of significant theoretical and empirical importance. Firstly, since university students are expected to be more likely than the general public to frequently use all modes of travel, research of their travel behaviors could generate valuable knowledge for the development of multimodal transport systems. Secondly, universities are often large trip attractors and, therefore, optimizing students’ travel behaviors may help reduce transportation-related infrastructure costs. Moreover, universities may set good examples for society with regard to promoting environmental awareness and encouraging good travel behaviors through education and other related measures [1,3,8].
The existing literature has focused on urban universities, exploring the travel behaviors of students who go to university in large urban areas [1,2,3,4,6,13,14]. However, research on student travel behaviors in the setting of a college town has been inadequate. A college town is a jurisdiction where the university students account for a significant share (at least 10%) of the local population [15]. There are many college towns in the United States (US). Among the top 50 college towns in the US [15], the median of the percentage of university students of the local population is 33%, and only three have a percentage lower than 10%. It is commonly accepted that college towns tend to have smaller population sizes and more compact urban forms in comparison to urban areas. Consequently, students in college towns are expected to differ from their counterparts at urban universities in activity patterns and mode choice. For example, some argue that college town students are more likely to walk or bike to school and less likely to drive due to the compactness of the locality. Related empirical knowledge, however, is still fairly limited. Thus, the travel behaviors of college town students warrant more study.
In this study, we aim to explore what factors influence the mode choice of students at a college town, with special attention to the factors that affect the popularity of biking and walking among these students. The study empirically explores this research question with survey data from Iowa State University (ISU), a typical college-town university in the US [15], using the analysis tools of the multinomial logit model (MNL) and the nested logit model (NLM). By and large, this study is an exploratory pilot study, given the fact that the survey data are from only one university. Nevertheless, through investigating a typical college town in the US, this study attempts to establish replicable research procedures and to create survey instruments for future studies on the related topics. Also, it hopes to generate some general (probably preliminary) insights into student mode choice at college towns, especially in the US context, which is notorious for widespread car dependence.
The article is organized as follows. The next section reviews the literature on the influence factors of university students’ mode choice. The third section introduces the methodology and the collected data. The fourth section presents the results of the analyses. The article concludes with a discussion of major findings and directions for future research.
2. Literature Review
In the large volume of literature on mode choice, scholars [2,3,16,17,18,19,20,21,22,23,24,25,26,27,28,29,30,31,32,33] have identified six general groups of factors that individually or collectively influence people’s mode choice. The six groups of factors are:
- Physical environment and urban form [16], such as travel distance, travel time, and land use and transportation planning;
- Mode-specific or service factors [17], such as travel cost and transit proximity;
- Personal attributes [17,34], such as age, gender, and income;
- Trip characteristics [17], such as time of travel;
- Travel demand management (TDM) measures [18], such as discounted bus passes;
- Psychological factors [19,35], such as environmental awareness and perceived safety.
The classification, although possibly oversimplifying the reality, provides a useful analytical framework for this study to organize and review the literature on mode choice of university students. Table 1 summarizes major existing studies that investigate the influence factors of mode choice of university students. The studied universities can be categorized into two groups: urban universities and college towns. The findings are organized by the type of influence factors listed above.

Table 1.
Mode choice of university students by location.
Firstly, with regard to physical environment, factors such as commute distance, travel time, and infrastructure density are considered important to the mode choice of university students. Specifically, students living on or near campus are significantly more likely to walk and bike, and less likely to drive automobiles [2]. Street density increases the utility of car and transit, whereas sidewalk density decreases the utility of these two motorized modes [8]. Compared to commuter students of urban universities, those of college towns drive alone less and walk or bike more [1,13].
Secondly, by focusing on urban universities, scholars find that mode-specific or service factors also matter to student mode choice. Specifically, Collins and Chambers [12] find that mode-specific costs and access to bus, together with travel distance, travel time, and environmental awareness, may jointly influence the mode choice. Zhan, et al. [36] argue that transit access increases transit usage among university students. Shannon, et al. [9] find that perceived and actual travel time by bus or by bike has the greatest impact on transit usage and biking behaviors among university members.
Thirdly, personal attributes are found to contribute to the mode choice of urban university students. A number of related factors, such as gender, status (undergraduate vs. graduate), age, income, shared residence, and having friends or classmates living nearby, may all influence the active mode choice [3,5,36]. For example, female students are generally less likely to be bicycle riders and more likely to be auto drivers [6]. In addition, cycling is the most attractive alternative for individuals who do not live with their families [8]. Notably, a study by Limanond, et al. [37] from a rural university (a college town) finds that vehicle ownership increases the probability of driving or riding a motorcycle among the students.
Moreover, TDM measures, such as discounted transit passes, may increase university students’ usage of alternative modes [10,38]. For example, possessing a transit pass increases the probability of commuting by transit while it decreases the probability of driving alone [4]. Meanwhile, complete, timely, and accurate information can increase the usage of non-driving-alone modes [11]. Moreover, owning a parking permit may increase the utility of traveling by car by a large margin [8].
Last, but not least, psychological factors matter, too. Behavioral intention to travel by car [39] and affective motivation and symbolic function of driving [40] could effectively motivate students to drive. Also, perceived safety may affect the probability of walking [14]. Moreover, environmental awareness together with mode-specific costs and travel distance/time may jointly influence mode choice [41]. Notably, a study by Bopp, et al. [42] of a college town demonstrates that psychological factors may explain the largest variance in the student mode choice.
Overall, a review of the literature clearly demonstrates that the travel behaviors of college town students have not yet been intensively studied, except in Bopp, Kaczynski and Wittman [42] and Limanond, Butsingkorn and Chermkhunthod [37]. So far, scholars find that some physical environment factors, personal attributes, and psychological factors may help explain the mode choice of college town students. It is, however, unknown whether these factors may jointly influence the mode choice. It is also a question whether these factors influence the mode choice of college town students and that of urban university students in different ways. In light of these questions, this study conducts a survey of commute students of a college town (ISU) and explores how the six groups of factors may individually or collectively influence the students’ mode choice.
3. Methodology and Data
The study site is Iowa State University (ISU), located in City of Ames, Iowa. Ames is a small jurisdiction with a size of 24.27 square miles. It is a typical college town [15] with 57% of the local population being ISU students. The City of Ames and ISU jointly provide bus service “Cyride” that covers the city. This bus service is a crucial component of the TDM measures in Ames and at ISU. The ISU campus is the hub of Cyride with seven bus routes intersecting and overlapping one another. ISU student government fees and ISU general funds provide 45% of the funding for the operation and maintenance of Cyride. All ISU students can ride Cyride for free with their ISU IDs.
In this study, we conducted a survey to investigate the mode choice of commuter students at ISU, paying particular attention to those factors that are expected to influence the student mode choice. Here, commuter students are defined as students who do not live on campus and must commute to school. The mode choice alternatives of these students include driving alone, carpooling, taking public transit, biking, and walking. Notably, to ensure the survey data are well focused, the survey only asks students about their primary mode of transportation. We understand, however, that there might be multimodal travel behaviors in reality. We consider all six groups of influence factors of people’s mode choice as identified in the existing literature, including physical environment, mode-specific or service factors, personal attributes, trip characteristics, TDM measures, and psychological factors.
The online survey was sent to all active ISU students with an email account in April 2012. This survey offered five $50 cash awards in order to increase response rate. It generated a response rate of 6% (1661/26,144). This response rate is not high but comparable to the sampling/response rates of other well-known surveys, such as the National Household Travel Survey (2001) with a sampling rate of 0.06% [43] and the California Household Travel Survey (2013) with a response rate of 4.9% [44]. In Table 2, the survey respondents are compared with the student population of ISU in several aspects. A chi-square test reveals insignificant difference between the two groups of people, indicating that the respondents may well represent the student population, at least in such aspects as housing distribution, gender, and age.
Table 2.
Comparison of the respondents and the student population.
The collected survey data are summarized in Table 3, including the mode choice alternatives of ISU students and six groups of influence factors. Salient observations of the data include a high rate of walking and a short mean commute distance. The percentage of walking as the primary mode of transport is 36.6%, and the average commute distance is 2.2 miles. These are consistent with our expectations of a college town. Notably, despite the short commute distance, over 50% of the students still rely on motorized modes for daily commuting, including driving alone, carpooling, and taking transit. This phenomenon is worthy of particular attention.
Table 3.
Variables, Descriptions and Values.
4. Results
4.1. Descriptive Analyses of the Survey Data
In this research, we not only re-examine the impacts of the factors that are known to influence student mode choice in a college town but also explore the effects of some new factors, focusing on mode-specific or service factors and personal attributes. Regarding the student mode choice, our preliminary analysis shows that 77% of the ISU students use non-driving-alone modes, which is much higher than the shares at urban universities, such as 27% at Ohio State University (OSU) [6], 66% at the University of Western Australia (UWA) [9], 42% at Old Dominion University (ODU), and 54% at Virginia Commonwealth University (VCU) [1]. Among the non-driving-alone modes, both transit and walking are rather popular among ISU students: 33% of ISU students ride buses, and 37% walk to campus. Notably, the carpooling rate is rather low: only 1.6% of the students commute to school by carpooling. In this section, the descriptive analyses of the survey data focus on the relationship between the student mode choice and several important influence factors.
4.1.1. Mode Choice and Physical Environment
This study considers three physical environment factors—commute distance, perceived commute time, and residential type/locale—with special attention paid to commute distance. For ISU students, proximity to campus does not make alternative modes more attractive. As many as 25% of the respondents with commute distance less than two miles (n = 169) still drive alone to campus (Table 4). This means that commute distance is irrelevant to their decision of driving. To further explore the relationship between commute distance and specific mode choices, unpaired student t-tests were conducted between driving alone and other modes. The results reveal that only students who ride transit have a distribution in commute distance similar to those driving alone (p < 0.05).
Table 4.
Mode choice and commute distance.
4.1.2. Mode Choice and Mode-Specific or Service Factors
This study examines transit proximity as a service factor that is expected to influence the student mode choice. Here, transit proximity is measured as the distance from home to the closest transit stop of a direct bus line to ISU. The results of the analysis (Table 5) demonstrate that proximity to transit services does not make riding transit more attractive. In fact, 23% (n = 212) of the students with good transit proximity—living within 0.25 miles of a bus stop—still choose to drive alone or carpool to school.
Table 5.
Mode choice and transit proximity.
4.1.3. Mode Choice and Personal Attributes
This study explores the impact of five personal attributes on student mode choice: primary reason for housing choice, gender, age, income, and off-campus employment. In particular, when examining the primary reason for housing choice, the study compares students who prioritized rent affordability in their housing choice (n = 442) with those who prioritized other reasons (n = 647). The former group’s mean commute distance is 9% shorter than the latter’s (2.09 miles vs. 2.27 miles). With regard to the mode choice, the two groups of students have comparable rates of driving (including driving alone and carpooling: 25.3% vs. 24.5%). Among the non-driving alternatives, the former are more likely to commute by bus (47.2% vs. 24.1%) while less likely to bike or walk to school (32.2% vs. 51.3%) compared to the latter. Notably, combining the above findings regarding commute distance, transit proximity, and rent affordability, the study reveals that the students who prioritized rent affordability in housing choice tend to live in proximity to bus stops and are more likely to ride buses; that is, they use “bundled services” to fulfill their travel needs.
Meanwhile, the survey included a question regarding off-campus employment in order to examine whether having an off-campus job influences the mode choice of a student. This factor has not been explored in the existing literature. The analysis results show that off-campus employment may not have an impact on the rate of driving alone. In fact, this factor is found to be associated with a lower rate of driving alone (Table 6), in contrast to our expectation of a positive relationship. A possible explanation is that a student’s mode choice is more heavily influenced by factors such as the person’s financial situation rather than travel needs associated with off-campus employment.
Table 6.
Off-campus job and mode choice.
4.1.4. Mode Choice and Psychological Factors
This study explores the impact of a psychological factor—information contagion [3] (or peer effects)—on student mode choice. As Zhou [3] argues, friends or familiar roommates may provide trusted and relevant information to influence one’s mode choice. In the ISU survey, we specifically asked the students whether their choice of transportation is affected by the people they live with. Among the respondents (n = 1089), 38% indicated that their mode choice was affected by their roommates, who can be broadly regarded as their peers. We speculate that the information contagion (peer effects in this study) influences university students’ mode choice.
4.2. Multinomial Logit Model
4.2.1. Model Description
The multinomial logit model (MNL) has been widely used to explore students’ mode choice in the context of urban universities [3,4,8]. Based on Greene [46], the MNL assumes that the probability that the ith student would choose jth mode of transportation is given by:
for k ≠ j, j = 0, 1, 2, 3, which represent different mode choices, with Rij being the maximized utility attainable for student i if the student chooses jth mode, and:
where βj’ is a vector of coefficients of each of the explanatory variables. If the stochastic terms, ε, are identically and independently Gumbel distributed, the MNL can be expressed as:
Pij = Pr (Rij > Rik)
Rij = βj’Xij + εij
Pij = exp (βj’Xij)/∑ exp (βj’Xij)
The parameters (β) are estimated by maximizing a log likelihood function.
4.2.2. Empirical Results
Inspired by the existing literature, this study first develops two MNLs. One examines the effects of the influence factors on the marginal utility of alternative mode choices relative to the reference—i.e., driving alone—using only valid responses that contain all the variables of interest (n = 1089). The other focuses on the students using alternative modes, with riding transit being the reference (n = 823). It aims to identify factors that affect the popularity of biking and walking among ISU students. SPSS 19 by IBM Statistics, Chicago, Illinois (US) is used to generate the MNL results. The results with the largest Cox and Snell R-squared but a minimum number of explanatory variables (using 0.005 variation in Cox and Snell R-squared as the cut-off point) are presented in Table 7 and Table 8. The values of McFadden’s pseudo R-squared are also presented in both tables.
Table 7.
Estimates for alternative modes: multinomial logit model (comparison with driving alone).
Table 8.
Estimates for biking and walking: multinomial logit model (comparison with transit).
The results of the first MNL model are presented in Table 7. Both personal attributes and physical environment are found to have significant impacts on the adoption of alternative modes relative to driving alone. Firstly, two personal attributes (i.e., income and gender) matter. Income significantly affects transit usage and walking. The higher the annual income, the less likely a student would ride transit or walk to school. Also, gender is related to the choice of biking. Specifically, males are significantly more likely to bike to school than females. A similar gender difference in biking has been well documented in studies on urban universities [6,47], in which safety was considered a main explanation. The ISU case confirms that such a difference also exists in the context of a college town, where safety is a much lesser concern for females. In other words, the study suggests that even in a safe environment, female students may still be less likely to commute by biking.
Secondly, for physical environment, both commute distance and perceived commute time have significant impacts on the mode choice. Notably, these two independent variables have low correlation (the correlation coefficient = −0.06). Specifically, commute distance is found to have a significant, although small, negative impact on transit usage. This is generally consistent with the findings from urban universities [4,9]. Meanwhile, commute distance does not have a significant effect on the probability of biking. This echoes with the findings of Zhou from the University of California, Los Angeles (UCLA) [3,4]. A possible explanation is that university students who bike to school are a very special group: they choose to commute by biking regardless of the commute distance. Notably, compared to urban universities, college towns tend to be compact and small, and the commute distance of commuter students tends to be much shorter. Therefore, the students are expected to care more about actual/perceived commute time than commute distance when making mode choice, while the former could be influenced by factors such as availability of bike lanes, pedestrian/cyclist-friendly traffic signals and topography. In fact, our model confirms the expectation. Long perceived commute time is found to significantly deter biking and walking. This is consistent with findings from urban universities such as UCLA [4] and UWA [9].
Lastly, an additional finding from the MNL results is also worthy of note. In the ISU case, the age of a student does not have a significant effect on the use of public transit, indicating that students of all ages may equally use transit services. This is different from the finding of Zhou [3] that older students at UCLA are significantly less likely to take transit than younger ones.
The second MNL explores the impact of influence factors on the alternative mode choices of biking and walking relative to the reference mode (taking public transit). The analysis shows that both personal attributes (income) and physical environment (perceived commute time) matter, as illustrated in Table 8. Firstly, the higher the income, the less likely a student would walk to school. Notably, since no significant relationship is found between income and biking, the mode of bicycling seems to be equally popular among students of all income levels. Secondly, short perceived commute time would significantly increase the rates of biking and walking. This is consistent with the findings from urban universities such as UWA [9] and OSU [6].
4.3. Nested Logit Model
4.3.1. Model Description
As compared to MNLs, nested logit models (NLMs) relax the assumption regarding stochastic terms, ε; that is, the independence of irrelevant alternatives (IIA). This allows us to group similar or related alternative choices together and to avoid possible biased coefficient estimates due to correlated ε. Many scholars have detailed the specifications and fundamentals of NLMs [46,48]. Popular statistical packages such as STATA 13.0 by StataCorp., College Station, TX, USA, provide syntax for us to run NLMs conveniently. To highlight possible biased estimates of coefficients in MNLs, we ran NLMs based on the primary data we collected and secondary data that we derived based on those primary data and/or external sources (see Table 3).
In NLMs, we organize choices into different subsets (called “nests”)—Sm, where m = 1, 2, … m—to better study the probability of a choice by the study subjects. Any given choice, i, belongs to only one subset, Sj. Unsurprisingly, for a given number of choices that are equal to or greater than three, there could be more than one way to organize subsets. In our study of ISU, we found that the following subsets (Figure 1) are the most appropriate (based on trial-and-error) for providing reasonable modeling results.
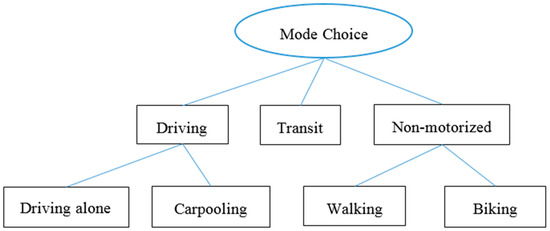
Figure 1.
Nesting structure of mode choice for ISU students.
Per the structure of NLMs exemplified in Figure 1, the probability of study subject (in our case student), i, choosing mode choice, j—i.e., (Pr (yi))—is equal to the product of the probability of choosing some subset, S(j), Pr{yi ϵ S(j)}. The conditional probability to choose the mode j given some alternative in S(j) is Pr{yi = j|yi ϵ S(j)}; that is:
Pj = Pr(y = j) = Pr{y = j|y ϵ S(j)} · Pr{y ϵ S(j)}.
One can use STATA 13.0 to perform maximum-likelihood estimation of Pj (dependent variable), different independent variables and related parameters, such as the likelihood-ratio test value about IIA to compare the goodness of fit between a null model and an alternative model, as well as the dissimilarity parameter, which measures the degree of correlation of random shocks within each of the nests/subsets (e.g., in Figure 1, there are three nests: driving, transit, and non-motorized).
4.3.2. Empirical Results
To examine the impacts of different factors (independent variables) on mode choice and to control possible self-selection issues (e.g., those who live in proximity to transit because they like to travel with transit), we ran as many as six NLMs with different numbers of responses:
- (1)
- With all students that can feasibly drive, carpool, ride Cyride, walk and/or bike to the ISU campus (“all” for shorthand hereafter). According to Figure 1, even if a student (in theory) has as many as five choices of travel, we removed certain choices from this person if some conditions are met. For instance, we removed the choice of driving alone when the person did not have access to a vehicle in his/her household, the choice of taking transit when the person lived outside the service area of Cyride, and the choice of biking/walking when the person lived too far to bike/walk to the ISU campus.
- (2)
- With all but those who reported that their current mode choice was affected by their peers. This model shows what factors affect students’ mode choice and to what degree when there were no peer effects.
- (3)
- With all but those who reported that they chose their current residence because of its transit proximity. This model shows what factors affect students’ mode choice and to what degree when there was no self-selection.
- (4)
- With only those who reported that their current mode choice was affected by their peers. This model illustrates, among students who self-reported peer effects, what factors affect their mode choice and to what degree.
- (5)
- With only those who reported that they chose their current residence because of its transit proximity. This model illustrates, among students who were subject to self-selection, what factors affect their mode choice and to what degree.
- (6)
- With all but those who reported that they chose their current residence because of its transit proximity and those who reported that their current mode choice was affected by their peers. This model demonstrates what factors affect students’ mode choice and to what degree if there were neither self-selection nor peer effects.
With regard to selecting independent variables for the NLMs, the literature review and the results of MNLs provided us with the initial inspirations. We then adopted some other independent variables based on our own knowledge and experience. Overall, our method for selecting independent variables was trial and error. Table 9 presents the results of the six NLMs.
Table 9.
Mode choice of different students: nested logit models.
Compared to the MNLs, the NLMs provide more nuanced (and probably more unbiased) estimation of the impacts of independent variables. The NLMs produce six major findings as follows:
- (1)
- The dissimilarity parameters (all are smaller than 1) show that all the NLMs are generally consistent with the expected random utility assumption about NLMs. In other words, it is appropriate to use the NLMs to examine the above impacts.
- (2)
- The results of NLMs (2–6) show that if we do not control peer effects and/or self-selection, we could introduce biases into the estimation of the impacts of independent variables. Living alone, for instance, was found to be significantly correlated with transit usage in NLM (1). But such correlation no longer exists after we control for peer effects and/or self-selection.
- (3)
- Regardless of the independent variables, the estimated impacts on non-driving modes in the NLMs, if any, tend to be smaller than those in the MNLs. The coefficient value of perceived commute time in NLMs, for instance, is only about 10% of that in MNLs.
- (4)
- If we control peer effects and/or self-selection (NLMs (2, 3, 6)), perceived commute time tends to have a mixed impact on non-driving mode choice. Those whose mode choice was affected by peers or those who chose their current residence because of transit proximity were more sensitive to such time than others. In other words, if we can combine peer effects and transit proximity with a shorter commute time, these students are more likely than others to use non-driving modes. The income coefficient further indicates that the combination could work across students of different levels of income.
- (5)
- Gender plays little or no role in influencing students’ non-driving mode choice according to the NLM results. This, however, may be unique in college towns. This is at odds with the result of MNLs that females bike less than males.
- (6)
- Except those who chose current residence because of transit proximity, age can be a good predictor for choosing non-motorized modes.
5. Discussion and Conclusions
Previous studies have advanced our understanding of mode choice of university students, shedding light on such questions as why it is important to study the issue and which factors may influence mode choice of university students. However, the existing literature has paid little attention to the mode choice of university students in college towns. It is hoped that the current study, which is based on descriptive/simple statistics as well as more advanced statistical models such as MNLs and NLMs, can help fill the gap through a survey of ISU commuter students about their travel behaviors.
Specific findings are as follows. Firstly, as expected, commuter students in the college town are more likely to use non-driving-alone modes, especially walking, to commute to school compared with their peers at urban universities such as UCLA [3], OSU [6], UWA [9], ODU and VCU [1]. Despite the high share of non-driving-alone modes, however, the college town students at ISU can still improve their percentage of carpooling, which was quite low based on the survey responses. In this regard, the experience of UCLA may provide some valuable insights in terms of employing TDM measures to promote carpooling [3]. At UCLA, two or three students who apply for a shared carpool parking permit enjoy a priority parking slot at a discounted rate. Meanwhile, the university designed an on-line tool, Zimride, to help its members easily find carpool partners.
Secondly, at the college town, commuter students’ use of alternative modes of travel is closely related to the distance between the residence and transit services. Specifically, the students who prioritized rent affordability in housing choice are found to tend to live in proximity to bus stops and are more likely to ride buses. They use the “bundled services” to fulfill their travel needs. Similar findings have been documented in studies about urban universities, such as UCLA [5] and McMaster University, located in Ontario, Canada [8]. Thus, “bundle services” should be considered by future TDM programs.
Third, most commuter students tend to prefer a residence as close to campus as their budget allows. The proximity, however, does not always translate into greener travel modes. At ISU, 25% of commuter students living within two miles of the campus still drive alone to school, and this percentage is significantly higher than commuter students elsewhere. A possible explanation is that a highly compact college town like Ames may still not satisfy all life needs of the commuter students. This forces the students to go outside their town, which often necessitates driving. Thus, future research needs to fully explore the travel needs of commuter students—for example, through activity-based studies—and to investigate how a college town may fulfill these needs.
Fourth, at ISU, male students are found to be more likely to commute by biking than female students if we only rely on MNLs. This is consistent with findings from urban universities such as UCLA [4] and OSU [6]. But the results of NLMs indicate that gender plays no or little role in influencing biking and walking. This indicates that even though promoting biking among females could still be challenging, college towns might be able to achieve an equally high share of non-motorized modes if they can complement a low share of biking with a high share of walking among females.
Last but not least, it is reconfirmed based on the MNL results that commuter students who do not drive alone to school tend to prefer a residence with transit proximity. In addition, the NLM (5) results show that students who already chose residences because of transit proximity would use non-driving modes more if commute time was shortened. These findings indicate that the effectiveness of TDM programs in promoting biking and walking at universities may hinge on the availability of, accessibility to, and level of, transit services. Notably, compared to urban universities and some other college towns, ISU has more advantages for non-driving-alone modes of travel, such as a short travel distance (mean: 2.2 miles), award-wining transit services (Cyride), short travel time (median: 10–20 min), and a safe environment (based on authors’ personal experience). These characteristics, however, may not guarantee more usage of alternative modes. Transportation planners thus need to consider more strategies, such as reducing abundant parking, applying the Goldilocks Price Principle of parking prices to balance supply and demand [49], and identifying and addressing commuter students’ unmet needs that force them to drive a car.
This study may be improved in three ways in the future. First, future studies should examine influence factors that are not considered in this study, such as car ownership and financial situation. The inclusion of these factors can help us better understand the mode choice of university students. Second, more studies may be conducted to further explore the variables provided by this survey; for instance, information contagion, peer effects and sustainable life habits. We did try building information contagion (as a form of peer effect) into the NLMs, but we did not find it correlated to any particular modes of travel. In the future, we should conduct a new survey and run new models to look into this. Lastly, data from more college-town universities may enhance the related research. Although Ames is considered a typical college town in the US, it may be unique in certain aspects. We are cautious not to generalize our findings outside Ames. More cases of college towns could test whether this study’s findings are transferrable across college-town universities.
Author Contributions
Conceptualization, J.Z.; Methodology and Models, J.Z., and J.W.; Formal Analysis, J.Z. and Y.W.; Writing—Original Draft Preparation, J.Z.; Writing—Review & Editing, Y.W.
Funding
Funding for this research was provided by the National Natural Science Foundation of China for Young Scholars (Grant No. 71804103).
Conflicts of Interest
The authors declare no conflict of interest.
References
- Khattak, A.; Wang, X.; Son, S.; Agnello, P. Travel by university students in Virginia: Is this travel different from travel by the general population? Transp. Res. Rec. J. Transp. Res. Board 2011, 2255, 137–145. [Google Scholar] [CrossRef]
- Wang, X.; Khattak, A.; Son, S. What can be learned from analyzing university student travel demand? Transp. Res. Rec. J. Transp. Res. Board 2012, 2322, 129–137. [Google Scholar] [CrossRef]
- Zhou, J. Sustainable commute in a car-dominant city: Factors affecting alternative mode choices among university students. Transp. Res. Part A Policy Pract. 2012, 46, 1013–1029. [Google Scholar] [CrossRef]
- Zhou, J. Proactive sustainable university transportation: Marginal effects, intrinsic values, and university students’ mode choice. Int. J. Sustain. Transp. 2016, 10, 815–824. [Google Scholar] [CrossRef]
- Zhou, J. From better understandings to proactive actions: Housing location and commuting mode choices among university students. Transp. Policy 2014, 33, 166–175. [Google Scholar] [CrossRef]
- Akar, G.; Fischer, N.; Namgung, M. Bicycling choice and gender case study: The Ohio State University. Int. J. Sustain. Transp. 2013, 7, 347–365. [Google Scholar] [CrossRef]
- Akar, G.; Flynn, C.; Namgung, M. Travel choices and links to transportation demand management: Case study at Ohio state university. Transp. Res. Rec. J. Transp. Res. Board 2012, 2319, 77–85. [Google Scholar] [CrossRef]
- Whalen, K.E.; Páez, A.; Carrasco, J.A. Mode choice of university students commuting to school and the role of active travel. J. Transp. Geogr. 2013, 31, 132–142. [Google Scholar] [CrossRef]
- Shannon, T.; Giles-Corti, B.; Pikora, T.; Bulsara, M.; Shilton, T.; Bull, F. Active commuting in a university setting: Assessing commuting habits and potential for modal change. Transp. Policy 2006, 13, 240–253. [Google Scholar] [CrossRef]
- Bamberg, S.; Ajzen, I.; Schmidt, P. Choice of travel mode in the theory of planned behavior: The roles of past behavior, habit, and reasoned action. Basic Appl. Soc. Psychol. 2003, 25, 175–187. [Google Scholar] [CrossRef]
- Rose, G. Encouraging sustainable campus travel: Self-reported impacts of a university travelsmart initiative. J. Public Transp. 2008, 11, 5. [Google Scholar] [CrossRef]
- Collins, C.M.; Chambers, S.M. Psychological and situational influences on commuter-transport-mode choice. Environ. Behav. 2005, 37, 640–661. [Google Scholar] [CrossRef]
- Chen, X. Statistical and activity-based modeling of university student travel behavior. Transp. Plan. Technol. 2012, 35, 591–610. [Google Scholar] [CrossRef]
- Rybarczyk, G.; Gallagher, L. Measuring the potential for bicycling and walking at a metropolitan commuter university. J. Transp. Geogr. 2014, 39, 1–10. [Google Scholar] [CrossRef]
- Best College Reviews. The 50 Best College Towns in America. Available online: http://www.bestcollegereviews.org/50-best-college-towns-america/ (accessed on 8 June 2018).
- Zhao, F.; Li, M.-T.; Chow, L.-F.; Shen, L. Fsutms Mode Choice Modeling: Factors Affecting Transit Use and Access; National Center for Transit Research, University of South Florida: Tampa, FL, USA, 2002. [Google Scholar]
- Walter, C.K.; Baumel, C.P.; Mahayni, R.G.; Sanchez, T.W.; Lipsman, M.A.; Misawa, T.; Rathi, S. Multimodal Investment Analysis Methodology: Phase 1 Contents; Center for Transportation Research and Education: Ames, IA, USA, 1998. [Google Scholar]
- Tyrinopoulos, Y.; Antoniou, C. Factors affecting modal choice in urban mobility. Eur. Transp. Res. Rev. 2013, 5, 27–39. [Google Scholar] [CrossRef]
- Sitlington, J. Moving to Healthier People and Healthier Places; VicHealth, Health Promotion Foundation: Melbourne, Australia, 1999.
- Cervero, R. Paradigm shift: From automobility to accessibility planning. Urban Futures 1997, 22, 9–20. [Google Scholar]
- Litman, T. The Cost of Automobile Dependence and the Benefits of Balanced Transportation; Victoria Transport Policy Institute: Victoria, BC, Canada, 1999. [Google Scholar]
- Newman, P.; Kenworthy, J. Sustainability and Cities: Overcoming Automobile Dependence; Island Press: Washington, DC, USA, 1999. [Google Scholar]
- Urban Land Institute. Smart Growth Online. Available online: http://www.smartgrowth.org/ (accessed on 15 September 2018).
- Dulken, D. The very model of a suburban community, what we can learn from the university campus. Planning 1992, 58, 24–25. [Google Scholar]
- Turner, P.V. Campus: An American Planning Tradition; The MIT Press: Cambridge, MA, USA, 1987; Volume 7. [Google Scholar]
- Ewing, R.; Schroeer, W.; Greene, W. School location and student travel analysis of factors affecting mode choice. Transp. Res. Rec. J. Transp. Res. Board 2004, 1895, 55–63. [Google Scholar] [CrossRef]
- Badoe, D.A.; Miller, E.J. Transportation-land-use interaction: Empirical findings in North America, and their implications for modeling. Transp. Res. Part D Transp. Environ. 2000, 5, 235–263. [Google Scholar] [CrossRef]
- Boarnet, M.G. A broader context for land use and travel behavior, and a research agenda. J. Am. Plan. Assoc. 2011, 77, 197–213. [Google Scholar] [CrossRef]
- Crane, R. The influence of urban form on travel: An interpretive review. J. Plan. Lit. 2000, 15, 3–23. [Google Scholar] [CrossRef]
- Ewing, R.; Cervero, R. Travel and the built environment: A meta-analysis. J. Am. Plan. Assoc. 2010, 76, 265–294. [Google Scholar] [CrossRef]
- Ewing, R.; Cervero, R. Travel and the built environment: A synthesis. Transp. Res. Rec. J. Transp. Res. Board 2001, 1780, 87–114. [Google Scholar] [CrossRef]
- Handy, S.; Cao, X.; Mokhtarian, P. Correlation or causality between the built environment and travel behavior? Evidence from Northern California. Transp. Res. Part D Transp. Environ. 2005, 10, 427–444. [Google Scholar] [CrossRef]
- Wang, D.; Zhou, M. The built environment and travel behavior in urban China: A literature review. Transp. Res. Part D Transp. Environ. 2017, 52, 574–585. [Google Scholar] [CrossRef]
- Belgiawan, P.F.; Schmöcker, J.-D.; Abou-Zeid, M.; Walker, J.; Lee, T.-C.; Ettema, D.F.; Fujii, S. Car ownership motivations among undergraduate students in China, Indonesia, Japan, Lebanon, Netherlands, Taiwan, and USA. Transportation 2014, 41, 1227–1244. [Google Scholar] [CrossRef]
- Van, H.T.; Choocharukul, K.; Fujii, S. The effect of attitudes toward cars and public transportation on behavioral intention in commuting mode choice—A comparison across six asian countries. Transp. Res. Part A Policy Pract. 2014, 69, 36–44. [Google Scholar] [CrossRef]
- Zhan, G.; Yan, X.; Zhu, S.; Wang, Y. Using hierarchical tree-based regression model to examine university student travel frequency and mode choice patterns in China. Transp. Policy 2016, 45, 55–65. [Google Scholar] [CrossRef]
- Limanond, T.; Butsingkorn, T.; Chermkhunthod, C. Travel behavior of university students who live on campus: A case study of a rural university in Asia. Transp. Policy 2011, 18, 163–171. [Google Scholar] [CrossRef]
- Victoria Transport Policy Institute (VTPI). Campus Transport Management: Trip Reduction Programs on College, University and Research Campuses; Victoria Transport Policy Institute: Victoria, BC, Canada, 2012. [Google Scholar]
- Kerr, A.; Lennon, A.; Watson, B. The call of the road: Factors predicting students’ car travelling intentions and behaviour. Transportation 2010, 37, 1–13. [Google Scholar] [CrossRef]
- Maxwell, S. Negotiating Car Use in Everyday Life. In Car Culture; Miller, D., Ed.; Berg: Oxford, UK, 2001. [Google Scholar]
- Klöckner, C.A.; Friedrichsmeier, T. A multi-level approach to travel mode choice—How person characteristics and situation specific aspects determine car use in a student sample. Transp. Res. Part F Traffic Psychol. Behav. 2011, 14, 261–277. [Google Scholar] [CrossRef]
- Bopp, M.; Kaczynski, A.; Wittman, P. Active commuting patterns at a large, Midwestern college campus. J. Am. Coll. Health 2011, 59, 605–611. [Google Scholar] [CrossRef] [PubMed]
- FHWA. Introduction to the 2009 NHTS. Available online: http://nhts.ornl.gov/introduction.shtml (accessed on 8 June 2018).
- Caltrans. 2010–2012 California Household Travel Survey: Final Report Appendix; California Department of Transportation: Sacramento, CA, USA, 2013.
- UCDavis. Ucdavis ev Explorer. Available online: https://phev.ucdavis.edu/project/ev-explorer/ (accessed on 15 September 2018).
- Greene, W.H. Econometric Analysis; Prentice Hall: Upper Saddle River, NJ, USA, 2011. [Google Scholar]
- Emond, C.; Tang, W.; Handy, S. Explaining gender difference in bicycling behavior. Transp. Res. Rec. J. Transp. Res. Board 2009, 2125, 16–25. [Google Scholar] [CrossRef]
- Train, K.E. Discrete Choice Methods with Simulation; Cambridge University Press: London, UK; New York, NY, USA, 2009. [Google Scholar]
- Shoup, D. The politics and economics of parking on campus. In The Implementation and Effectiveness of Transport Demand Management Measures: An International Perspective; Ison, S., Rye, T., Eds.; Ashgate Publishing: Aldershot, UK, 2008. [Google Scholar]

© 2018 by the authors. Licensee MDPI, Basel, Switzerland. This article is an open access article distributed under the terms and conditions of the Creative Commons Attribution (CC BY) license (http://creativecommons.org/licenses/by/4.0/).