4.1. The Coffee Market in Dak Lak
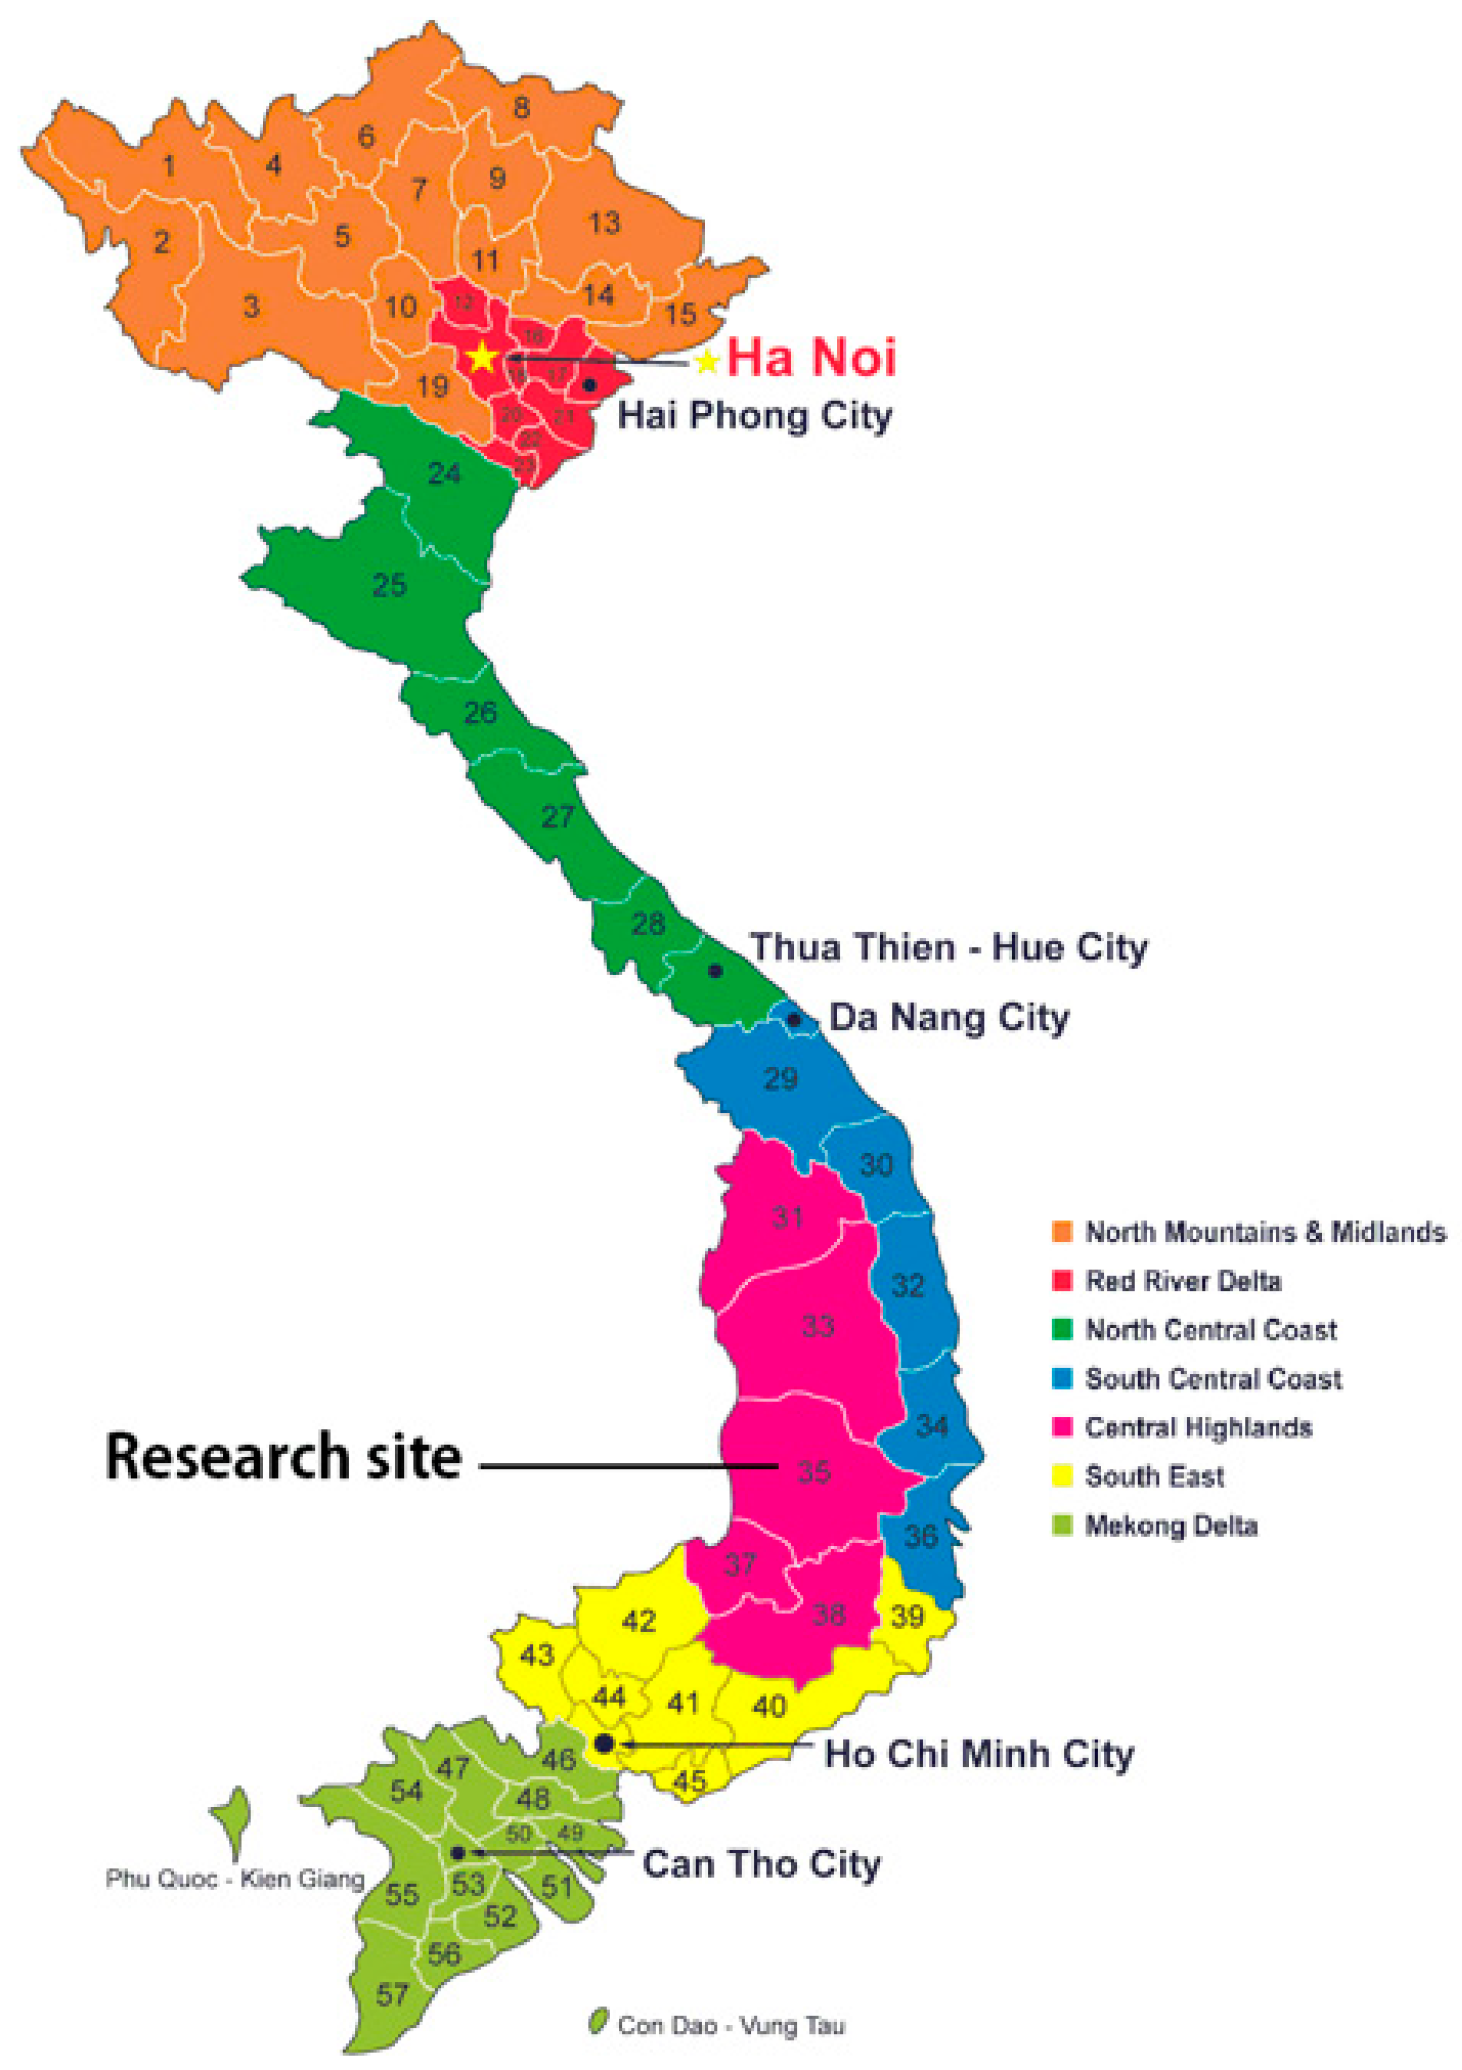
According to Dak Lak DARD in 2015, there are approximately 300,000 family labors, and 100,000 hired labors harvesting coffee from 203,746 hectares in Dak Lak. Coffee farmers achieved the average productivity of 2.3 tons/hectare, which contributed to the provincial annual yield of 400,000 tons. Smallholder coffee farmers sell their coffee to local traders, processors/exporters, roasters, and mostly to buying agents with the sale proportion of 5.37%, 2.01%, 0.46%, and 92.16%, respectively (Dak Lak DARD).
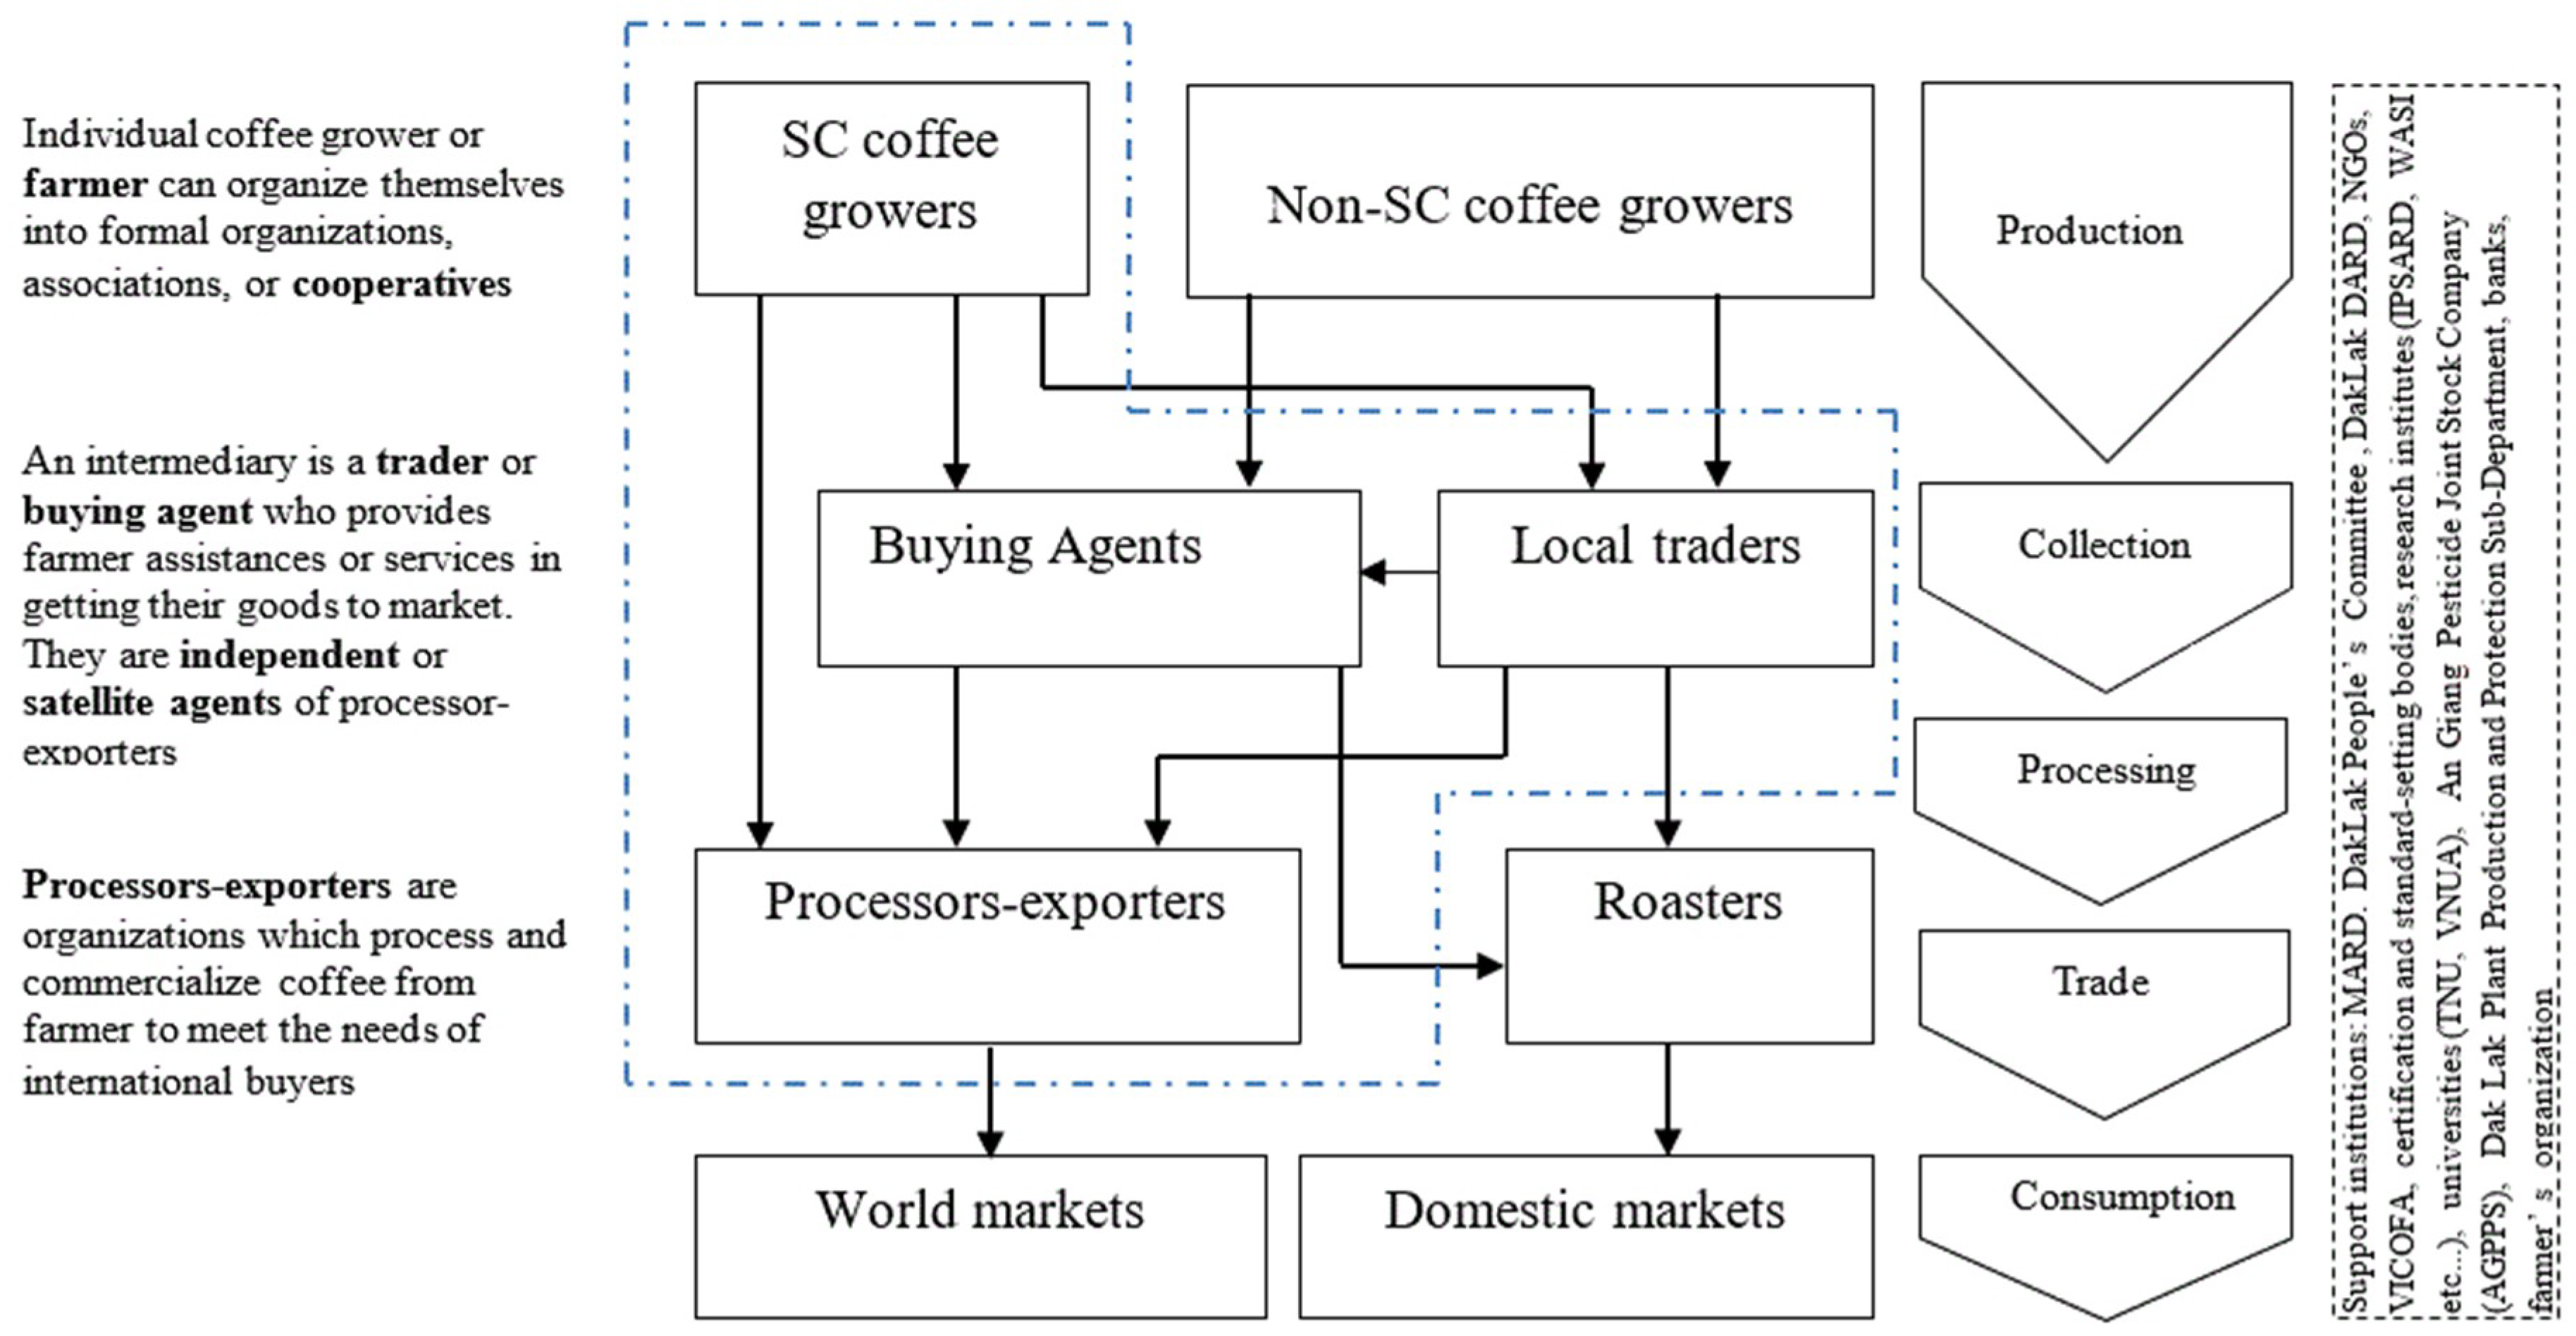
Figure 2 presents the supply chain of coffee in Dak Lak.
The harvest season of coffee in Dak Lak always lasts approximately a month, starting at the end of November or beginning of December. Once the coffee cherry was picked, it is either stored for a few weeks or hulled right away to remove the outer skin and the inner parchment. Then the preliminary dry processing must begin as quickly as possible to prevent spoilage. These activities have been done on the farm where many concrete yards and village roads are used for coffee sun-drying. After this, most of the sun-dried coffee beans are delivered to buying agents (or collectors). The buying agents purchase dried beans from smallholder farmers through individual informal contract (verbal). State-owned companies licensed these buying agents during the 1990s (functioning as satellite agents) but they are now operating mostly as private firms. Coffee farmers consign (or deposit) a large proportion of their harvest to them because of their credit-bound relationship. Coffee export prices and market trends were communicated daily between coffee farmers and buying agents. When the coffee farmers feel the price is right, then the decided sale volume is subtracted from the farmer’s consignment. Conversely, processors/exporters in the provincial coffee market also rely on buying agents to guarantee their supplies of dried coffee beans. Even though these companies have been trying to integrate coffee farmers into their own supply system through contract farming, the reward is considered insignificant. This explains the fact that only a small proportion of farmers’ dried beans bypasses the buying agents and are sold directly to processors/exporters.
Both private (including foreign-invested companies) processors/exporters and state-owned processors/exporters (including joint stock companies) are in the provincial supply chain making the coffee bean markets highly competitive. By far, the monopsony of the buying agents plus farmers’ coffee consignment to the buying agents altogether symbolizes the coffee market supply of Dak Lak [
51]. Throughout significant structural change in the coffee sector, from direct government intervention to primarily operating through private channels, the role of buying agents in the coffee market is unquestionable. Despite fierce competition between state-owned processors/exporters (joint-stock company) and private processors/exporters (companies with foreign direct investment) in local coffee bean markets, buying agents still acquire the largest share of the market supply. Local traders are also those who try to play the buying agents’ game to gain benefit through price margins, especially during the harvest season.
At harvest time, a small quantity of red cherries goes to wet processing by selling directly to processors/exporters or indirectly through local traders. Coffee processed by wet method (called wet processed or washed coffee) only accounted for approximately 15.3% in 2015. According to Dak Lak DARD, there are 16 enterprises owning wet processing technology and 23 processing enterprises owning dry processing technology. The wet processing capacity of the whole province is 64,000 tons/year while the dry processing capacity is 475,000 tons/year. Although further processing steps take place whereby the coffee beans are cleaned, sorted, polished, and graded, coffee beans are exported to 53 different world markets including: Germany (43,468 million USD), Japan (53,090 million USD), Switzerland (43,468 million USD), Italy (42,228 million USD), etc.
4.2. Descriptive Statistics
According to the descriptive statistics shown in
Table 2 the results revealed that surveyed coffee farmers in CMG and KRP mostly are male (122 of 183). Similar to other agricultural sectors, male farmers often play an important role in the decision making of the household. These farmers have considerable experience in coffee farming (more than 8 years), and some farmers even have 15 years of participating in this sector. The age of coffee farmers ranges from 20 to 67, and the average age is 44.6 years. The average years of educational level are 9.66 meaning most farmers attained their education at high school level. Household size was approximately five persons on average. In some cases, household size was eight persons. Coffee farmers probably may utilize members of the household as family labor for some operations relating to the production and marketing of coffee. BMTCA reported that hired labor is costly and extremely hard to find in harvest season. Furthermore, the average farm size was 1.4 hectares and the maximum farm size was 4 hectares. The fact is that most coffee plantations in Dak Lak are small-scale operations (<2 hectares) that do not allow farmers to benefit from economies of scale as well as expand areas and apply synchronous technologies. The average productivity was 3.2 tons/hectare and the maximum productivity was 5.4 tons/hectare. A total 139 respondents are Kinh ethnic, the rest are Ede, Gia rai, Tay, etc. Surveyed farmers have different kinds of sustainable coffee production certifications such as 4C, Fairtrade, RFA (Rainforest Alliance), and UTZ Certified. The number of respondents for each kind of certification are 13 (7.1%), 60 (32.8%), 34 (18.6%) and 76 (41.5%) respectively (
Table 3).
Descriptive statistics results also show that SCP farmers sell their coffee beans to processors/exporters, buying agents, and local traders with the respective sale proportions of 0.27, 0.54, and 0.17. Results of a pairwise comparison show that the farmers’ average proportion of coffee sold to buying agents (PCSA) is significantly higher than farmers’ average proportion of coffee sold to processors/exporters (PCSE) and local traders (PCST). The t values from a pairwise comparison between PCSE and PCSA, PCSE and PCST, PCSA and PCST are −12.778, 4.843, and 14.610 respectively. When comparing the farmer’s proportion of coffee sold to different markets between regions (CMG and KRP), the test statistics however show insignificant differences of PCSE, PCSA, and PCST. The mean values of PCSE, PCSA, and PCST in CMG and KRP are 0.26 and 0.28 (independent sample t-test with
t = −1.423), 0.54 and 0.56 (independent sample t-test with
t = −0.268), 0.20 and 0.16 (independent sample
t-test with
t = 1.445) respectively (
Appendix A). From this point, regional factors might not have a significant impact on SCP farmers’ preference prior to different buyers in provincial coffee market. However, as distinct market competitiveness and local infrastructure conditions in each production area, the inclusion of the regional factor in the SUR model for further analysis might give opposite outcomes.
Table 4 shows the descriptive statistics of different transaction cost attributes of sustainable coffee farmer in each market. In terms of price uncertainty (UCER), only 35.6% and 37.2% of the surveyed farmers are confident about the price prior to selling their coffee to processors/exporters and local traders respectively. Indeed, this value is much higher in the market of buying agents (76%). This is because the farmers are able to access the daily export price information from the processors/exporters through buying agents. Sustainable certified coffee farmers in KRP are slightly more confident about the price than those in CMG when they sell their coffee to processors/exporters (21.9% vs. 13.7%) and buying agents (39.9% vs. 36.1%). The story is opposite in case of selling to the local traders market (16.4% vs. 20.8%). Although the coffee farmers seemed confident about the price, only a relatively small number of farmers reported that they have access to market information (INFO) prior to selling at each market. About 21.9%, 69%, and 37.2% of the respondents have access to market information when they sell coffees to processors/exporters, buying agents, and local traders respectively. Still, buying agents are able to provide more market information to coffee farmers than other actors in the coffee supply chain.
As mentioned previously, the provincial coffee market is either dominated by private or state-own processors/exporters. In KRP, Thangloi and Phuocan (state-owned company) are sharing the market. In CMG, Dakman and Amazaro (foreign-invested company) have long been the largest players. In fact, none of the surveyed farmers in CMG agreed that the market of processors/exporters is highly competitive. However, about 11.5% of the respondents in KRP agreed that competition exists between two state-owned companies, Thangloi and Phuocan. Indeed, the markets of buying agents and local traders are more competitive as many of these chain actors are scattered throughout the coffee production areas. A total of 60.1% and 79.8% of the respondents claimed that markets of buying agents and local traders are highly competitive.
Out of the total of the surveyed farmers, nearly 80.3%, 76.5, and 60.6% need to ship their coffee prior to selling to processors/exporters, buying agents, and local traders respectively. The number of KRP coffee farmers that had to bear the expense of transportation (PORT) is significantly higher than CMG. This is because most of coffee collection and trading activities in KRP take place adjacent to the Interstate 14 where Thangloi and Phuocan companies are based and the road conditions are much worse than CMG. At the procurement point, the percentages 45.5%, 36.1%, and 33.9% of the surveyed farmers need to go through grading procedure (GRAD) before finalizing the transactions with processors/exporters, buying agents, and local traders. The grading requirements from the processors/exporters are highly stringent, as coffee beans are sorted by size as well as the classification of ripe cherries. The comparison of GRAD variables in each market and the average PCSE, PCSA, and PCST also reveals that grading requirements might hinder farmers from entering the market. Many more coffee farmers in KRP have to go through grading requirements compared to CMG at each market.
Dak Lak coffee farmers receive cash in the market exchange with local traders or processors/exporters. Prior to selling to buying agents, farmers consign (or deposit) their coffee beans and receive payment in cash later or in exchange of inputs for the next crop year. In some worse scenarios, the consignment is immediately used to pay for the previous loans. Delayed payment in most markets is often a case. About 45.9%, 18.5%, and 35% of the respondents have experienced delayed payment prior to selling coffee to processors/exporters, buying agents, and local traders respectively. In the case of processor/exporter markets, the number of surveyed farmers who receive late payment in CMG (16.4%) is significantly smaller than KRP (29.5%). However, the story is somewhat different at the market of buying agents (10.9% vs. 7.6%).
Through informal contracts with processors/exporters, the delivery of sustainable certified coffee is arranged before the harvest. The fact is that only 53% of the respondents report that the delivery was scheduled (DELI) with the processors/exporters. The statistics are 26.6% and 26.2% in case of selling to buying agents and local traders. Agreement on quantity (QUAN) is not always fixed between sustainable certified coffee farmers and buyers. This variable was reported at 56.3%, 24.1%, and 23.5% prior to selling to processors/exporters, buying agents, and local traders respectively. In rural areas, the trust factor is not simply in terms of a verbal or written contract, but also built over time with desired economic attributes such as consistency, trustworthiness, dependability, and reliability. Farmers establish long-term client relationships based on the economic merits of the traders [
38]. In this case, the social relationships are embedded in economic transaction. However, there are many incidents in Dak Lak where buying agents’ bankruptcy has ruined their strong bond with coffee farmers, even though many buying agents and local traders are villagers. Not surprisingly, only 36.1% and 36.6% of the surveyed farmers have trust in buying agents and local traders, while this number in the case of selling to processor/exporters is much higher (80.3%). Our in-depth interviews confirm that written commitment is more reliable and convincible than verbal commitment, especially when coffee farmers move from subsistence farming to commercial farming.
4.3. Estimation of SUR Model
In this section, the SUR model was used to analyze the factors influencing the farmers’ preferences over the different markets for sustainable certified coffee. The proportion of coffee sold to each market (PCSE, PCSA, and PCST) was regressed on a farmer’s socio-economics characteristics and different transaction cost attributes to identify reasons underlying the market choice. The test statistic of Breusch–Pagan (test of independence) was 71.171 (
Table A4 Appendix A). Hence, the equations are stochastically related through the disturbances that are serially correlated across equations. This indicates the system is referred to as SUR model.
Parameter estimates found in
Table 5 provide additional insights about the determinants of farmers’ choice of market. The probability of farmers’ participation in processor/exporter market was significantly influenced by speed of payment (PAY), fixed procurement quantity (QUAN), age of farmer household (AGE), education level (EDU), ethnic of farmer household (ETHN), and farm size (FARM). Speed of payment (PAY) is positively correlated with the probability of farmers’ preference for the market of processors/exporters at 10% level of significance. QUAN (negotiation cost) appears to be a more important determinant than other transaction cost attributes that influences coffee farmers’ decision prior to selling to processors/exporters. This variable is positively correlated with the probability of farmers’ preference for processor/exporter market at 5% level of significance. Socio-economic characteristic such as age (AGE), education level (EDU), farm size (FARM) have a negative influence on the farmers’ preference for processor/exporter market at respectively 0.10, 0.05, and 0.01 level of significance. Therefore, coffee farmers with older age, higher education, and larger farm size do not intend to increase their proportion of coffee sold to processor/exporter market outlets. Variable Ethnic (ETHN) has a significantly positive influence on the farmer’s preference for processor/exporter market at 0.01 level. Thus, Kinh ethnic coffee farmers prefer to sell their coffee beans to processor/exporter market.
The probability of choosing buying agent market was determined by price uncertainty (UCER), market competition (COM), transportation cost (PORT), fixed procurement quantity (QUAN), age of household (AGE), ethnic (ETHN), and farm size (FARM). In this market, information costs (UCER and COM) are statistically significant determinants of farmers’ preference for the buying agent market. Coffee farmers with a perception of market competition and being confident about the price are more likely to increase their proportion of coffee sold to the buying agent. On the other hand, price uncertainty may hinder a farmer’s participation in the market as it most likely increases search, screening, and negotiation costs [
52,
53]. Transportation cost (negotiation cost) is negatively correlated with farmers’ preference for the buying agent market at 1% level of significance. Higher transportation cost eventually hinders coffee farmers from increasing their proportion of coffee sold to buying agents. Besides, variable QUAN (also negotiation cost) has a positive influence on the coffee farmer’s choice of buying agent market at 1% level of significance. Contrary to the market of processor/exporter, the age of farmer household (AGE) has positive influence on the farmer’s preference for market of buying agents. This means farmer with farmers with an older age prefer to increase their sales to buying agents. Farm size (FARM) also has a positive influence on a farmer’s preference for the market of buying agents at 5% level of significance. The estimated coefficient of ETHN show that Kinh ethnic coffee farmers tend to decrease their proportion of coffee sold to buying agents, which also indicates that the minority farmers favor this market.
The determinants of a farmer’s preference for market of local traders are price uncertainty (UCER), fixed procurement quantity (QUAN), trust on buyers (TRUS), and farm size (FARM). This suggests that coffee farmers who have guaranteed quantity of sale and trust on local traders, are confident about the price, and own a large farm size are more likely to increase their proportion of coffee sold to local traders. The positive influence of UCER, QUAN, TRUS, and FARM variables on farmer’s preference for market of local traders are statistically significant at 1%, 1%, 5%, and 5% respectively. In general, variables such as market information (INFO), grading (GRAD), payment (PAY), delivery frequency (DELI), gender (GEN), and farming experience (EXPE), and location (LOC) do not have significant impact on the market preference of smallholder coffee farmers.


