Abstract
In various countries, offset policies allow economic developments to proceed on condition that proponents undertake agreed actions that offset the resulting losses of environmental values. Although ecological and environmental benefits are the main concern of a conservation agency when assessing an offset proposal, it is also important to be aware of the full cost of implementing the offset. However, there is currently a lack of understanding of the costs of implementing offsets, including which costs are relevant and what their magnitudes are. To address this knowledge gap, we developed a typology of costs that are relevant to offset schemes. We searched the publicly available information on costs of offset activities for thirty-four threatened species and communities in Australia to apply our cost framework. The results indicate that cost information is lacking in many cases. Information about some of the cost categories is not available for any of the species (e.g., induced costs to other areas or sectors). It is not clear whether the unreported cost categories are not considered during negotiation or whether it is just a case of lack of reporting.
1. Introduction
Offset schemes allow economic developments to proceed on conditions that the developers invest in other actions that compensate for the losses caused by the developments [1]. Offsets provide environmental benefits that counterbalance residual environmental impacts of a project or activity. Theoretically, offsets are proposed only as the last measure when all other options to avoid and reduce adverse environmental impacts have been exhausted [2]. In reality, offset schemes are often considered and implemented without thorough consideration of other steps [3]. Offset schemes have been increasingly used in various countries, including the USA, Canada, Germany, Spain and Australia [4]. Maron, et al. [5] reported that such schemes are in operation in around 69 countries.
In these offset schemes, there is a general emphasis on the protection of areas with equivalent species, habitat or ecological communities as the area impacted by the development activities. However, such ‘like-for-like’ offsets are hard to implement due to the difficulty of identifying available areas with similar environmental values and characteristics. As a result, offset schemes often allow a combination of direct and indirect activities. For example, the Western Australian Environmental Offset Guidelines [6] have identified three types of environmental offsets—land acquisition, on-ground management, and research. The New South Wales Biodiversity Offsets Policy for Major Projects, 2014 [7] specified that only when ‘like-for-like’ offsets could not be implemented could other indirect measures be applied. In many cases, developers/proponents are allowed to provide a lump sum amount of money as compensation in exchange for certain activities. For example, in Brazil, industries are required to pay a minimum amount of 0.5 percent of total capital costs of the development to support offsets commensurate with impacts [8].
A key challenge for conservation agencies that are managing offset schemes is to set an appropriate fee to the developers when the conservation agency is responsible for establishing and managing the offsets (or carrying out indirect offset activities) on behalf of the developers. In such cases, consideration of all types of costs is important in order to cover the full cost of development activities. Even when conservation agencies are not directly responsible for managing offsets, it is beneficial for them to estimate the full costs related to offsets for two reasons. Firstly, from the conservation-agency perspective, the benefits of the offset must be sufficient to outweigh the external costs of the development plus all costs of the offset other than those borne by the developer. Secondly, being able to advise developers of the true costs of an offset may prompt developers to modify their development plans so as to reduce biodiversity losses. Under-pricing offsets may result in over-investment in offsetting activities by developers when other measures (such as avoidance of damaging activities) would have been more appropriate [9].
Despite the importance of offset costs, most studies examining the performance of offset schemes do not examine costs [3,10,11]. Costs for offset activities are rarely reported in the published literature [12]. As such, there is a clear lack of understanding of the types of costs being considered when an offset program is being set up. In this paper we aim to address this knowledge gap.
We developed a typology of costs related to conservation offsets. Taking a selected group of endangered species and communities in Australia as a case study, we explored how this typology could be applied. Since 2001, environmental offsets in Australia have been implemented under the Commonwealth Environment Protection and Biodiversity Conservation Act 1999 [13]. We searched publicly available information on the costs of different activities considered in offset policies and planning documents. The results have been summarized by cost types, activities, species status and sources of information. The results highlight that there are information gaps that constrain the ability of agencies to assess the cost-effectiveness of different offset activities.
2. Types of Costs Relevant for Offset Programs
Table 1 shows the costs related to the establishment of an offset—a project that is intended to compensate for losses of conservation values. The costs are divided into five groups: acquisition cost, opportunity cost, management cost, transaction costs and indirect induced costs to other areas or sectors. We describe them below.

Table 1.
Different types of costs related to an offset.
Acquisition costs: Acquisition costs refer to the costs of securing a site for setting up an offset. This includes the purchase costs if the land is purchased or perhaps leasing costs if the offset is temporary. Acquisition cost reflects the opportunity costs of the land, which denotes the loss of income, or potentially of non-market benefits, which could have been obtained if the land was not used for an offset. If the decision about which land to acquire is left to the developer, they would have a tendency to find the cheapest land to acquire, which may or may not be suitable to satisfy the offsetting conditions [11].
Upfront establishment costs: Establishment costs are those costs, above and beyond acquisition costs, required to implement the offset. These could include costs of fencing, predator control, site works, inputs, and so on. Establishment costs depend on the types of offset activities that are being considered. Most of the establishment costs occur upfront or at an early stage of the implementation of an offset. They are usually born by the developers.
Long-term management and maintenance costs: Long-term management and maintenance of the established offsets (such as regular predator control or weed removal) are required for long-term benefits of offset activities to be maintained. This cost category also includes costs of monitoring the biological condition of the offsets, which is necessary to assess the performance of the scheme. Management costs can be high—potentially higher than the initial establishment costs, especially for long-term or permanent offsets. However, ironically, they are often ignored while setting up the offset schemes. This has two potential outcomes: either the cost is born by the agencies and/or the covenant holder after the Environment Protection and Biodiversity Conservation (EPBC) approval expires or the long-term management fails to occur because failure to budget for it means that funds are not available, resulting in loss of environmental values [14].
Transaction costs: Transaction costs are the costs of putting in place and enforcing the offset agreement or contract [15]. It may include costs of searching for suitable offsets, negotiation between developers and the agency, obtaining approval, monitoring compliance, enforcement, insurance, design of the scheme and legal processes [16]. Transaction costs are often difficult to estimate for individual projects and thus it may be tempting to ignore them during the setting up of an offset scheme. However, transaction costs could be substantial; some estimates indicate that transaction costs can be between 20% and 50% of the total cost of general environmental programs [17]. Transaction costs are likely to be incurred by both the conservation agency and the developer. High levels of transaction cost would mean both parties have incentives to reduce transaction costs, which could result in adverse conservation outcomes. For example, attempts to minimize transaction costs might result in poorly designed offsets or inadequate monitoring of compliance. On the other hand, there may be strategies that can reduce transaction costs without compromising conservation outcomes [18]. For example, sites which have high conservation values but which are currently unprotected or inadequately protected could be identified by government in a systematic way, avoiding duplication of effort by offset proponents [19].
Induced cost to other areas or sectors: There can sometimes be indirect effects of setting up an offset in a new area. In the economics literature, these are referred to as externalities. Externalities can be either positive (external benefits) or negative (external costs). For example, setting up an offset could result in increased problems with feral animals for neighboring farmers. This type of cost is rarely discussed in the conservation literature.
Of these five cost categories, acquisition and establishment costs are most likely to be salient to the developer, and perhaps also the agency, when the establishment of an offset is being considered. The last category, induced costs, is not borne by the developer or the agency, so is most likely to be ignored.
3. Materials and Methods
A list of thirty-four threatened species and communities were prepared in consultation with threatened species experts and conservation agencies. A full list of species and their EPBC Act and state vulnerability status is included in Table S1 (Supplementary Material).
For each of the threatened species and communities, a systematic review of three types of literature were carried out: approval notices of offsets, species recovery plans, and other sources such as peer-reviewed journals, government reports and public documents providing conservation offset costs. Google Scholar and the University of Western Australia Library’s OneSearch web application were extensively searched from May to July in 2017. Databases were searched using the following terms:
“[SPECIES/COMMUNITY NAME]” AND (“Conservation” OR “Recovery” OR “Survey” OR “Breeding” OR “Management”) AND (“Costs” OR “Prices”)
For the species or community name, the common name rather than the scientific name was used based on common practice in government recovery plans. For species with multiple commonly-used words in their name (such as the Pilbara leaf-nosed bat) or communities specific to certain locations (like Eucalyptus petiolaris woodland on Eyre Peninsula), the name was broken up into smaller search terms to increase the likelihood of obtaining results. For example, searches for the Pilbara leaf-nosed bat were performed using both terms (“Pilbara leaf-nosed bat”) as well as (“Pilbara leaf” AND “nosed” AND “bat”). In the case of Eucalyptus petiolaris woodland on Eyre Peninsula, the community name used in the search was (“Eucalyptus petiolaris woodland” AND “Eyre Peninsula”).
As many of the search results originated in the biological literature, the results were reviewed to determine that the “costs” described in the document were relevant to this study rather than being discussions of “energetic” or “metabolic” or other biochemical “costs”. The majority of results mentioned “costs” without providing any numeric, monetary value for the costs and were eliminated from further review. A great many studies, particularly those in the conservation biology literature, discuss conservation measures as being “low-cost”, “cost-effective”, or “cost-efficient” without any real justification or comparison with other measures. A handful of studies described relative or proportional costs of conservation offsets, but in the absence of a benchmark cost with which to compare them, they were also deemed unusable for this analysis. The remaining documents provided conservation offset costs in Australian dollar values for their respective threatened species/community.
The conservation offsets listed in each document were then categorized into one of twelve cost groups that fall into the broad categories of Target species; Competitor/predator control; Habitat; Information, education, and planning; and Protocols and guidelines. Table 2, below, lists the categories and the cost groups within the categories, and provides a description of how conservation offsets from documents were classified into cost groups. Costs associated with offset measures were adjusted to 2019 Australian dollars using the Consumer Price Index. The federal and state vulnerability statuses for each species were identified. In many cases, an offset agreement provides benefits to multiple species or communities. In the database, cost estimates have been provided against individual species or communities. Out of 34 species and communities, we found relevant information for 27 species and communities.
Table 2.
Cost category, sub-categories and criteria used to classify cost information.
Due to the vast array of offset measures and widely different approaches to even similar types of offsets, determining an appropriate unified metric by which to compare the costs of the measures was impossible. Consequently, this study instead quantitatively analyses the conservation offset measures identified by examining the number of measures with respect to the EPBC Act and state conservation status, biological resource threatened (species, species group, or community), offset category, and trends over time. Offsets are evaluated with regard to overall costs, but without a standard metric for individual measures, no side-by-side comparison of offsets can be made.
4. Results and Discussion
4.1. Types of Costs Reported
Our review of publicly available information reveals that most of the identified cost items are related to establishment costs and acquisition costs followed by long-term management costs. The transaction costs and induced costs to other area or sectors have not been explicitly mentioned at all. It is not clear whether these types of costs have been completely omitted or have not been reported in the documents. If they have been omitted, the cost to society of investment in offset activities may have been under-estimated, raising questions about the robustness of the numbers used during negotiation or finalizing of offset plans.
4.2. Distribution of Cost Records
In Table 3, the distribution of cost items by activity and vulnerability status have been presented, from which three main points can be identified. The first point to note is that, overall, the most common item for which cost information is available is surveys and research on target species (22%) followed by habitat creation (19%), predator control (10%) and habitat protection (9%). Together they cover almost 60% of the reported cost items (last column in Table 3). Secondly, there are disparities among the three sources of information: approval decisions, species recovery plan, and other sources. For example, the most frequently mentioned cost items in the offset approval notices are habitat creation (70%) followed by native vegetation protection (25%). In the species recovery plans, surveying is the most frequently cited activity (30%) followed by habitat protection (14%). The popularity of surveying activities indicates that there is still a lack of basic information on target species and communities. It could also reflect the relative ease of conducting these activities. It should be noted that the cost items mentioned in the species recovery plans are mostly aspirational, whereas the cost items mentioned in the approval decisions are for committed activities.
Table 3.
Distribution (%) of cost items by activity and vulnerability status.
Thirdly, there is some variation in reported costs with respect to vulnerability status and species group. From Table 3 it can be observed that surveying is the most common activity for all types of vulnerability group across the three sources of information. Interestingly, for ‘not listed’ species it constitutes 75% of all the cost items. This could mean that, since the species is not listed under any vulnerability status, the most suitable action is judged to be collection of more information. For endangered and vulnerable species, predator control is the second most commonly mentioned cost item, whereas, for critically endangered species, preparation of management plans is the second most frequent activity.
4.3. Trend in Reporting of Cost Items
Figure 1 presents the cumulative count and proportion of cost items over time for broad categories of activities. Reporting on all five major groups of activities has increased over time. The overall rate is highest for activities for target species or community, even though the proportion of items related to target species has gradually fallen. On the other hand, the proportionate share of cost items related to habitat management and predator control has increased.
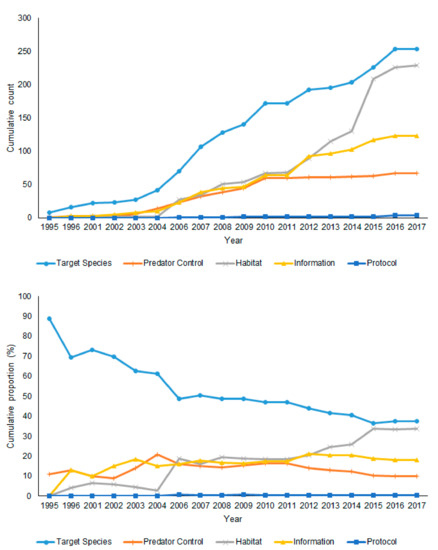
Figure 1.
Temporal trend in reporting of cost items by broad categories of activities.
4.4. Variation in Cost Items by Species
There is a large variation in the total number of reported cost items per species or communities (Table 4). For some species and communities (e.g., Eucalyptus petiolaris and malleefowl) we could find more than 40 cost items (the second column of Table 4), whereas, for more than half of the target species and communities we could find fewer than 20 cost items. For some species and communities (Brigalow and Littoral rain forest) there are fewer than 5 cost items. This indicates a potential serious lack of cost information in the public domain for offsetting activities of some species or communities.
Table 4.
Total number cost items per species and their distribution by sources of information.
4.5. Comparability of Cost Items
The effort to find comparable costs of conservation measures is hampered, unfortunately, by the vast array of offset measures and widely different approaches to even similar types of offsets. See Table S2 (Supplementary Material) for a description of individual cost entries mentioned in approval notices and offset agreements. In some very limited cases, however, it is possible to find comparable cost estimates. For example, cost estimates were identified for native vegetation protection activity for a set of species/communities in Western Australia (Table 5). It can be seen from Table 5 and Table S2 that the variations in cost estimates are very large within and between species or community. This could be partly due to the fact that offsets are linked with particular development activities which are highly variable, hence, the cost of offset activities should also be variable. Further, in case of direct payments, the payment amounts are usually negotiated between the proponent and the agency for a particular development activity. Many factors, including the nature of the offset, the development activity, the negotiation skill of the agency representatives and the power balance between the proponent and agencies, could influence the results of the negotiation.
Table 5.
Amount mentioned in the approval notices for offsets for selected species ($/ha, 2019AUD).
In cataloging and categorizing the actions in recovery plans, we found research and survey actions to be present in almost every recovery plan reviewed. Although the number of research and survey actions differed from plan to plan, as did the methods, the type of cost information collected for these actions for each recovery plan is largely the same due to the EPBC Act requirements. Table 6 presents the total research and survey measure costs per year by species mentioned in the species recovery plans. There is a slight upward trend in the total research and survey conservation measure costs with the year the recovery plan was published, but without a strong relationship.
Table 6.
Total research and survey measure costs per year by species mentioned in the species recovery plans.
A far clearer pattern emerges when we group the costs in Table 6 by vulnerability status. The cost of conservation measures increases from $130,130 for vulnerable species to $226,706 for endangered species, and to $290,373 for critically endangered species. These results by vulnerability status may reflect the state of research for species and communities within the different vulnerability categories. Vulnerable species, like malleefowl, are typically common enough that they have already been easily studied and so require the least amount for future research and surveys [20]. Endangered species and communities, like the northern quoll and sandhill dunnart, would require more resources for research and surveys than vulnerable species [21,22], and critically endangered species, like the southern bent-wing bat, have enough existing information to categorize them as critically endangered, but generally have the highest demand for surveys and information corresponding to efforts commensurate with their vulnerability status [23]. It may also be that there is generally more focus on more threatened species and their protection is taken more seriously. If more on-ground work is going to be carried out, more research is probably required to inform the design of those works.
5. Conclusions
Our review of publicly available information reveals that most of the cost items found are related to establishment costs and acquisition costs followed by long-term management costs. There is very limited information available on transaction costs or induced costs to other areas or sectors. A challenge for policy-making agencies is to ensure selection of a suitable set of offset activities which are able to achieve environmental goals in cost-effective manner. A key requirement to compare different offset activities is to understand the cost of implementing these activities. However, there is no consolidated source of information about offset costs that agencies and proponents can use to base their cost estimates on. And, as we have shown, efforts to collate and utilize existing information are hampered by the poor quality of much of that information.
Given that it is important to understand the cost of biodiversity offsets, agencies could employ economic tools and techniques to collect and analyze cost information more systematically [24,25]. Acquisition cost could be calculated based on the opportunity costs of the land use. Various techniques such as capitalized gross revenue, gross margin of the productive use of land, analysis of property or land-sale prices could be used to estimate those opportunity costs. Management costs could be calculated based on the market prices of the relevant inputs. Transaction costs are difficult to measure as they are very diverse and are often not budgeted for or monitored explicitly. Indicative transaction costs could be estimated from analyses of institutional processes and internal costs, and from surveys of proponents’ time requirements and other costs to get approval for and implement an offset. Induced external costs are likely to be highly case-specific, and therefore it would be difficult to determine typical or average values. Nevertheless, analyses of external costs in a range of contexts could help to inform future estimates made by agencies [14]. Such information could be used to develop a comprehensive cost catalog for Australian species recovery plans to develop a database for use by conservation managers as a basis for the consideration of future offset costs. This will enable the agencies and the proponents to understand the circumstances under which offset activities would be the most effective response to environmental damage. This will help to design more cost-effective offset programs.
Supplementary Materials
The following are available online at https://www.mdpi.com/2071-1050/11/19/5273/s1, Table S1: List of species and communities considered in the study and Table S2: Individual cost items mentioned in offset agreements.
Author Contributions
Conceptualization, M.S.I. and D.P.; methodology, M.S.I. and D.P.; formal analysis, M.S.I. and J.H.; writing—M.S.I., D.P. and J.H.
Funding
This research was funded by the National Environmental Science Program (NESP 5.1), Commonwealth of Australia.
Acknowledgments
The authors would like to acknowledge Megan Evans, Martin Maron and other colleagues in NESP for their input to the project. Comments made by anonymous reviewers have improved the paper.
Conflicts of Interest
The authors declare no conflict of interest.
References
- Commonwealth of Australia. Environment Protection and Biodiversity Conservation Act 1999 Environmental Offsets Policy; Department of Sustainability, Environment, Water, Population and Communities, Commonwealth of Australia: Canberra, Australia, 2012; p. 32.
- Lapeyre, R.; Froger, G.; Hrabanski, M. Biodiversity offsets as market-based instruments for ecosystem services? From discourses to practices. Ecosyst. Serv. 2015, 15, 125–133. [Google Scholar] [CrossRef]
- May, J.; Hobbs, R.J.; Valentine, L.E. Are offsets effective? An evaluation of recent environmental offsets in Western Australia. Biol. Conserv. 2017, 206, 249–257. [Google Scholar] [CrossRef]
- Maron, M.; Hobbs, R.J.; Moilanen, A.; Matthews, J.W.; Christie, K.; Gardner, T.A.; Keith, D.A.; Lindenmayer, D.B.; McAlpine, C.A. Faustian bargains? Restoration realities in the context of biodiversity offset policies. Biol. Conserv. 2012, 155, 141–148. [Google Scholar] [CrossRef]
- Maron, M.; Ives, C.D.; Kujala, H.; Bull, J.W.; Maseyk, F.J.; Bekessy, S.; Gordon, A.; Watson, J.E.; Lentini, P.E.; Gibbons, P. Taming a wicked problem: Resolving controversies in biodiversity offsetting. BioScience 2016, 66, 489–498. [Google Scholar] [CrossRef]
- Government of Western Australia. Western Australia Environmental Offsets Guidelines; Government of Western Australia: Perth, Australia, 2014; p. 39.
- NSW Government. NSW Biodiversity Offsets Policy for Major Projects; Office of Environment and Heritage for the NSW Government: Sydney, Australia, 2014; p. 33.
- McKenney, B.A.; Kiesecker, J.M. Policy development for biodiversity offsets: A review of offset frameworks. Environ. Manag. 2010, 45, 165–176. [Google Scholar] [CrossRef] [PubMed]
- Joseph, L.N.; Maloney, R.F.; Possingham, H.P. Optimal allocation of resources among threatened species: A project prioritization protocol. Conserv. Biol. 2009, 23, 328–338. [Google Scholar] [CrossRef] [PubMed]
- Bull, J.; Milner-Gulland, E.; Suttle, K.; Singh, N. Comparing biodiversity offset calculation methods with a case study in Uzbekistan. Biol. Conserv. 2014, 178, 2–10. [Google Scholar] [CrossRef]
- Habib, T.J.; Farr, D.R.; Schneider, R.R.; Boutin, S. Economic and ecological outcomes of flexible biodiversity offset systems. Conserv. Biol. 2013, 27, 1313–1323. [Google Scholar] [CrossRef] [PubMed]
- Curran, M.; Hellweg, S.; Beck, J. Is there any empirical support for biodiversity offset policy? Ecol. Appl. 2014, 24, 617–632. [Google Scholar] [CrossRef] [PubMed]
- Miller, K.L.; Trezise, J.A.; Kraus, S.; Dripps, K.; Evans, M.C.; Gibbons, P.; Possingham, H.P.; Maron, M. The development of the Australian environmental offsets policy: From theory to practice. Environ. Conserv. 2015, 42, 306–314. [Google Scholar] [CrossRef]
- Iftekhar, M.S.; Polyakov, M.; Ansell, D.; Gibson, F.; Kay, G. How economics can further the success of ecological restoration. Conserv. Biol. 2017, 31, 261–268. [Google Scholar] [CrossRef] [PubMed]
- Cacho, O.J.; Marshall, G.R.; Milne, M. Transaction and abatement costs of carbon-sink projects in developing countries. Environ. Dev. Econ. 2005, 10, 597–614. [Google Scholar] [CrossRef]
- Galik, C.S.; Cooley, D.M.; Baker, J.S. Analysis of the production and transaction costs of forest carbon offset projects in the USA. J. Environ. Manag. 2012, 112, 128–136. [Google Scholar] [CrossRef] [PubMed]
- Coggan, A.; Whitten, S.M.; Bennett, J. Influences of transaction costs in environmental policy. Ecol. Econ. 2010, 69, 1777–1784. [Google Scholar] [CrossRef]
- Quétier, F.; Regnery, B.; Levrel, H. No net loss of biodiversity or paper offsets? A critical review of the French no net loss policy. Environ. Sci. Policy. 2014, 38, 120–131. [Google Scholar] [CrossRef]
- ICMM—International Council on Mining & Metals. Independent Report on Biodiversity Offsets. Available online: https://www.icmm.com/website/publications/pdfs/biodiversity/biodiversity-offsets. (accessed on 7 September 2019).
- Benshemesh, J. National Recovery Plan for Malleefowl; Government of South Australia: Adelaide, Australia, 2007.
- Hill, B.; Ward, S. National Recovery Plan for the Northern Quoll Dasyurus Hallucatus; Northern Territory Department of Natural Resources, Environment, The Arts and Sport: Palmerston, Australia, 2010. [Google Scholar]
- Churchill, S. Recovery Plan for the Sandhill Dunnart (Sminthopsis psammophila); Department for Environment and Heritage: Adelaide, Australia, 2001.
- Lumsden, L.F.; Jemison, M.L. National Recovery Plan for the Southern Bent-Wing Bat Miniopterus schreibersii bassanii; Department of Environment, Land, Water and Planning: East Melbourne, Australia, 2015.
- Hockings, M. Evaluating Effectiveness: A framework for Assessing Management Effectiveness of Protected Areas; IUCN: Gland, Switzerland, 2006. [Google Scholar]
- Battisti, C. Unifying the trans-disciplinary arsenal of project management tools in a single logical framework: Further suggestion for IUCN project cycle development. J. Nat. Conserv. 2018, 41, 63–72. [Google Scholar] [CrossRef]

© 2019 by the authors. Licensee MDPI, Basel, Switzerland. This article is an open access article distributed under the terms and conditions of the Creative Commons Attribution (CC BY) license (http://creativecommons.org/licenses/by/4.0/).