Abstract
To improve the output characteristics of offshore wind power and to enhance the wind power accommodation, this paper analyzes its output characteristics along the southern coast in China, and then proposes an optimal sizing method of seawater pumped storage plant (SPSP) with variable-speed units in a connected mode on an islanded microgrid. Based on the constraints of variable-speed unit characteristics and power smoothness at the point of common coupling (PCC), the maximum static revenue as the objective function for the optimal sizing of SPSP is established. Notably, under an appropriate smoothness rate at PCC, the constraints that are mentioned above can adequately reflect the advantages of variable-speed units: fast power response and wide operating range. Additionally, they contain more concise models and variables than previously, which are friendly for optimizing the calculations. The results demonstrate that the proposed method is feasible and practical, by simulating and comparing in different scenarios.
1. Introduction
At the current stage, researches on wind power accommodation and fluctuations mainly focus on the onshore wind power rather than the offshore. Generally, large-scale offshore wind power is directly connected to the major-grid through submarine cables, which brings significant challenges to the safety and stability of the gird [1,2,3]. It is a feasible solution to configure an energy storage system, for example, battery storage [4]. However, the disadvantages of battery storage, such as high cost, potential safety hazards, environmental impact, and other technical issues, have limited its further development. According to the classification of Sandia National Laboratories, only pumped storage can provide higher power ratings (>100 MW) and longer discharge times than any other energy storage technologies, with the exception of compressed air energy storage (CAES). Pumped storage technology is more reliable than CAES. In contrast, the chemical battery, flywheels, and super-capacitors can only provide lower power ratings (<10 MW) and shorter discharge times [5].
Meanwhile, researches regarding the islanded microgrid are mainly about power supply, but large-scale offshore wind power accommodation near islands is rarely considered [6]. One of the reasons is that pumped storage plant (PSP) cannot follow the load variation immediately, because of the ramp rate limit of the fixed-speed unit. It is operating on timescales of minutes, which is too slow for load tracking. That means that the contribution of the fixed-speed unit is limited to the power response time.
Therefore, this paper proposes a solution to combine the power supply of the islanded microgrid with the offshore wind power accommodation [7] by taking advantage of variable-speed units. Moreover, the requirements of both faster power response (within seconds) and higher power ratings (>100 MW) can be satisfied.
In the field of onshore wind power, the optimal operation issues, such as peak shaving performance, minimization of wind curtailment, and maximization of revenue have been intensively studied through a wind-seawater pumped storage plant (SPSP) jointed system [8,9,10]. The conventional fixed-speed unit is still adopted for nearly several decades, and the power response time is not short enough. Especially, the input power of the fixed-speed unit in pump mode cannot be variable as the stochastic load fluctuation. Pan et al. [11] discussed the sizing factors of PSP under different operating conditions and gave an optimal sizing method of PSP with the goal of improving wind power plant revenue and dynamic safety, but it also adopts fixed-speed units. Katsaprakakis et al. [12] and Zhang et al. [13] reviewed the prospects and challenges of the multi-energy complementary system on islanded microgrids, but the power supply is not considered, and there are not particularly many discussions regarding the issues of large-scale offshore wind power accommodation. Taking the Canary Islands in Spain as an example, an optimal sizing method for SPSP is proposed when considering the maximum wind-solar power accommodation and the economic benefits, but fixed-speed units are still utilized [14].
Applying the SPSP with variable-speed units can solve the problems on both offshore wind power accommodation and power supply on islands at the same time [15]. The SPSP is a pure daily pumped storage facility that uses seawater as its lower reservoir. It will be built near the seaside or on a remote island, which can reduce the cost of operation and transmission line construction. Besides, the variable-speed unit can provide high performance on fast power response and wide operating range. While fully considering the characteristics of variable-speed units and smoothness constraints of the transmission line, this paper comes up with an optimal sizing method of SPSP in the connected mode, based on life cycle, energy conversion efficiency, operating cost, capital cost, and electricity price [16].
Additionally, it is worthwhile noticing that, under current circumstances, the utilization of SPSP is facing severe restrictions. Assessment needs to consider many options, including geographical environment, terrain, geology, constructing condition for reservoirs, and the ratio of distance to height. One of the advantages of SPSP is that the construction of the lower reservoir is avoided, so site selection is only available on the coastline or island. The guidelines for the reservoir construction are as follows:
- Extension of existing reservoirs is the first choice for reservoir construction to avoid building a new one and increasing additional excavations. Engineering geology issues must be prevented. Friendly terrain is better for transporting and arranging giant machines. The water inlet of the lower reservoir should not be selected in the sea area with high silt or sand content.
- Regarding the regions that have the insistent demands of the power supply but cannot address the requirements for upper reservoir construction, digging underground caverns as the lower reservoir will probably be an informed decision.
- It is necessary to use covers that are made from special materials on the upper reservoir surface. The covers can prevent seawater leakage and adapt temperature variation. Many sensors buried under the covers are used to monitor and control the pump operation in the case of seawater leakage.
- As a new-style power plant, it should not apply for an oversize installed capacity of SPSP. The head of SPSP should be greater than 100 meters to ensure the sufficient generator head and the smaller scale of the upper reservoir. In order to minimize the investment and energy losses, the horizontal distance between the reservoirs should be as short as possible. The ratio of horizontal distance to hydraulic head is within the allowable limit of 10.

Table 1.
Global construction projects for seawater pumped storage plant (SPSP) in planning.
Main contributions are as follows.
- An optimal sizing method of SPSP with variable-speed units in connected mode on an islanded microgrid is proposed.
- A simplified modeling method of variable-speed units is proposed and applied for the optimal sizing of SPSP.
- The contributing factors to the revenue of SPSP are discussed.
2. Output Characteristics of Offshore Wind Power
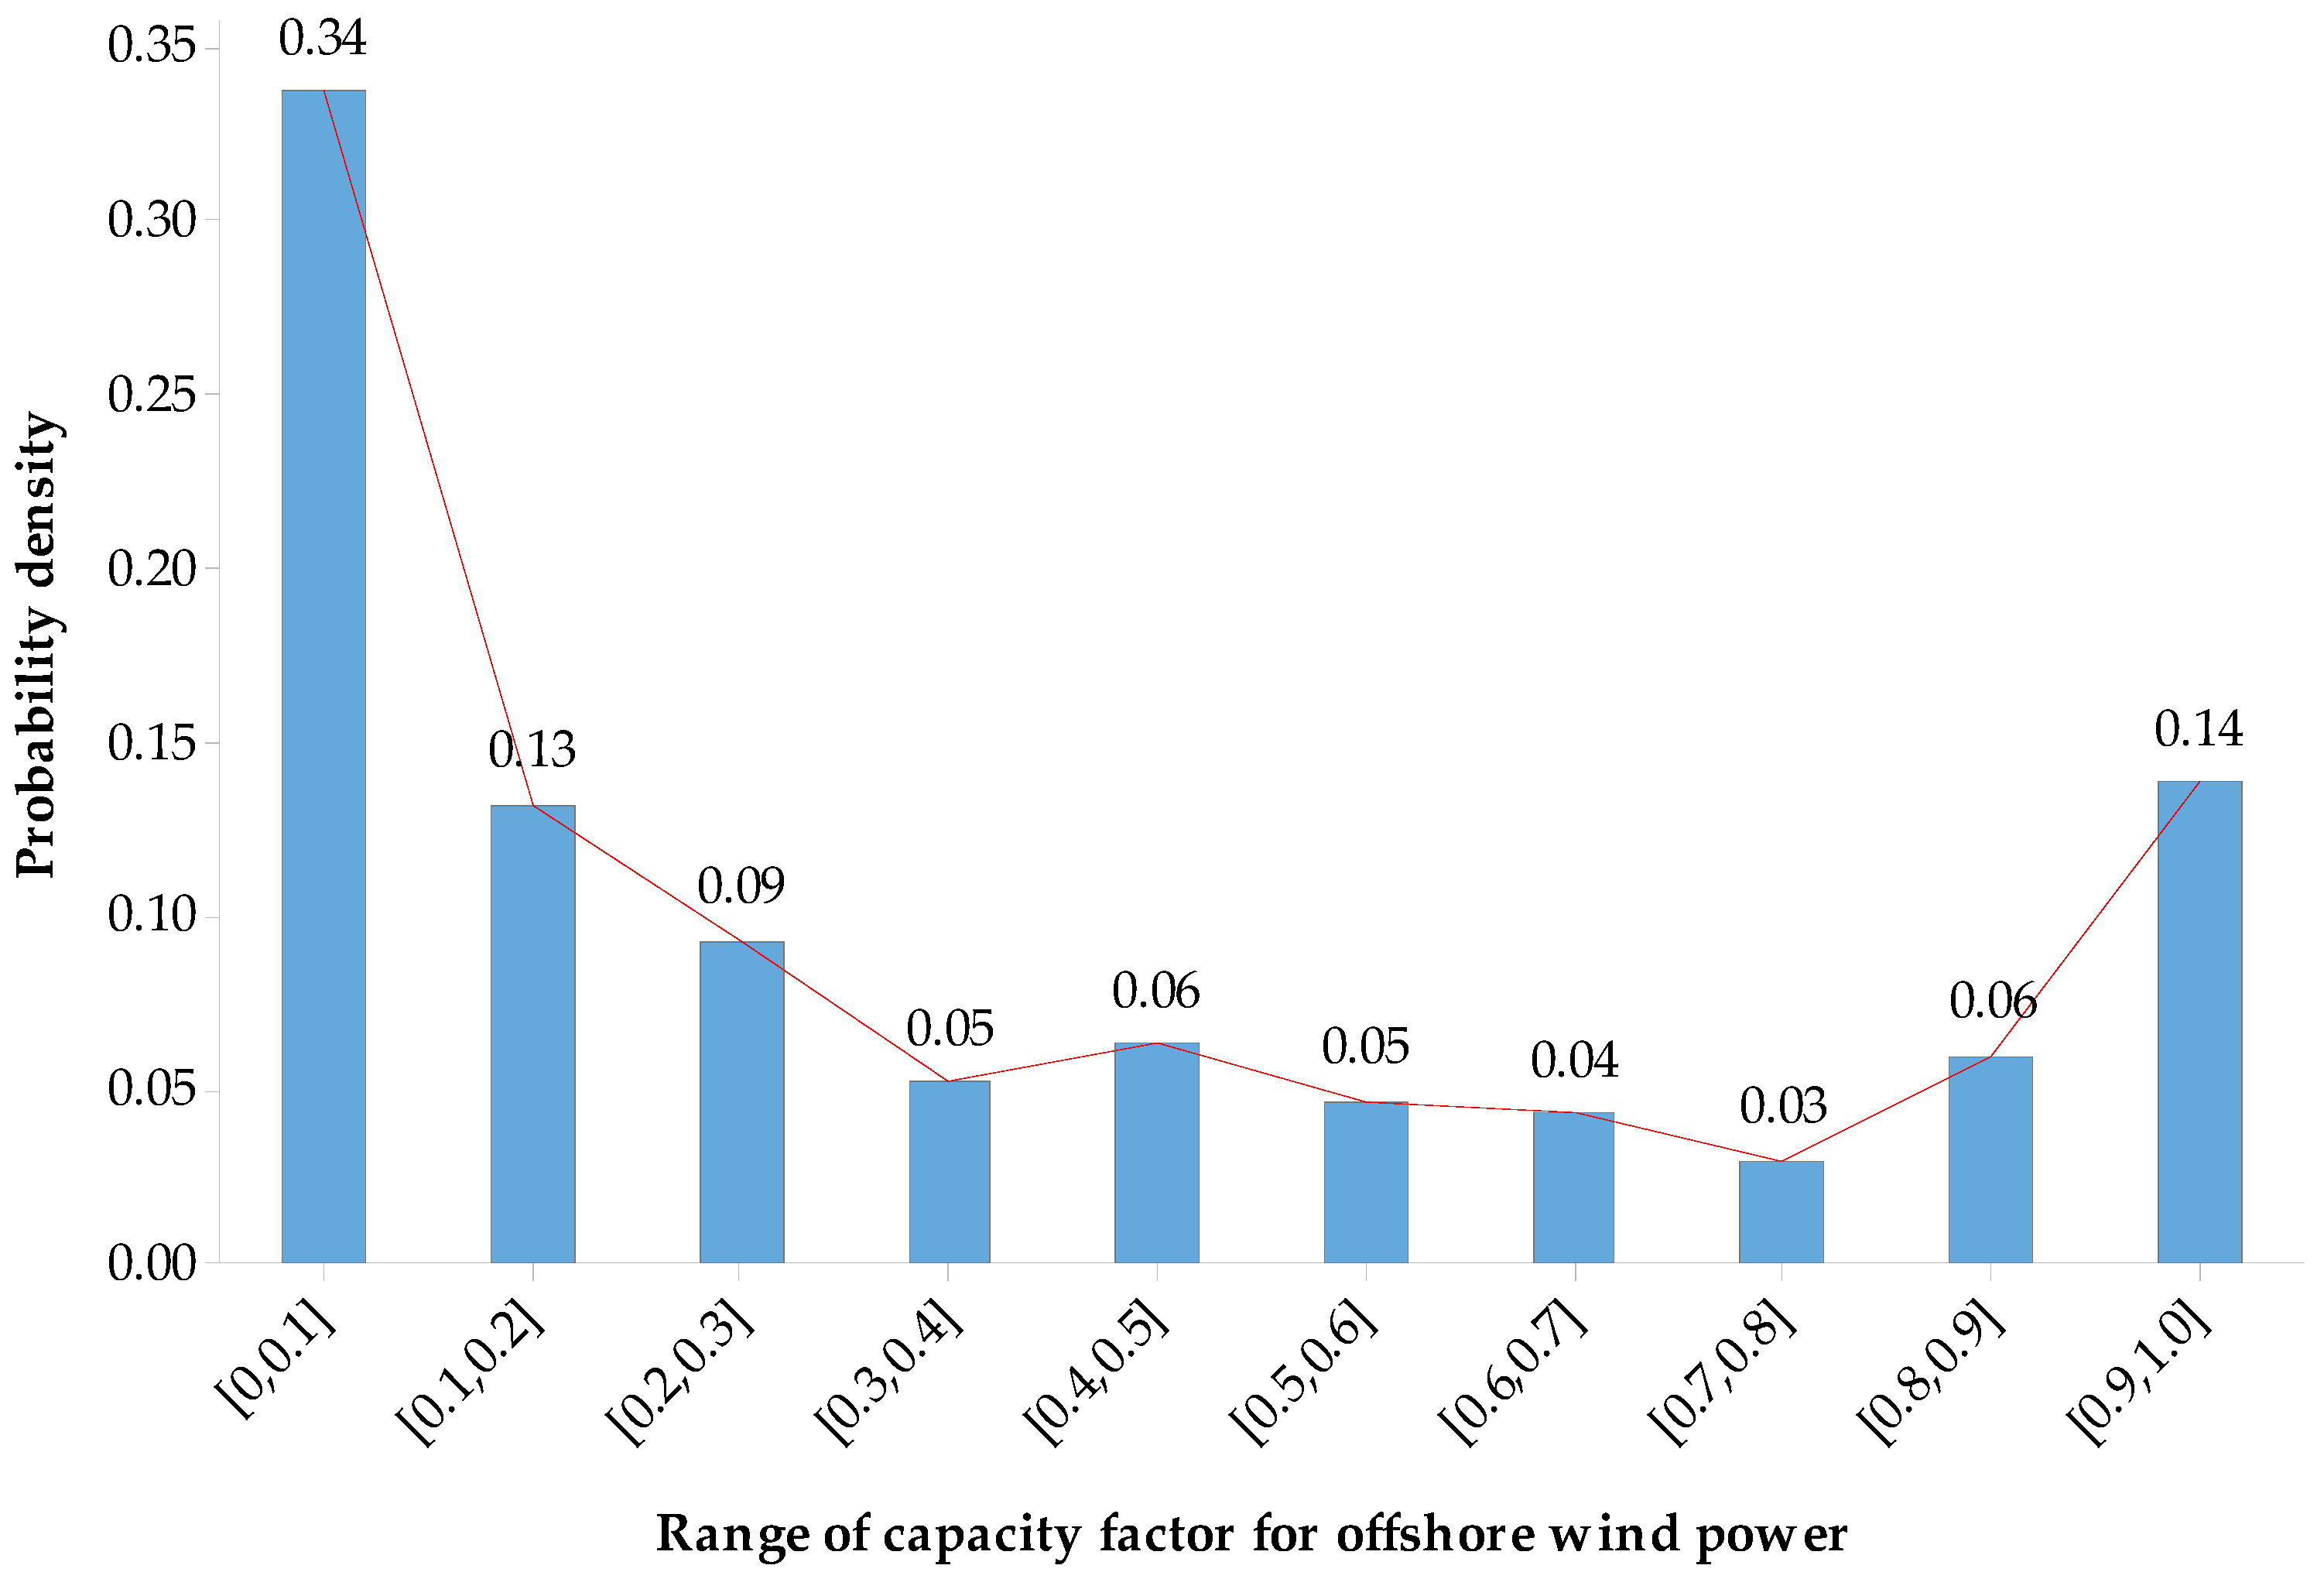
When compared with onshore wind power, the researches on output characteristics of offshore wind power are relatively lagging. Xu et al. [21] proposed an evaluation index used to describe the distribution law of output power of wind power plants. For example, it analyzes the output characteristics of several offshore wind power plants along the South China Sea. As shown in Figure 1, the statistical probability density of offshore wind power demonstrates U-shaped. The x-axis depicts the capacity factor of the wind power plant, which is the unitless ratio of the actual electrical energy output over a given period of time to the maximum possible electrical energy output over that period [22]. The probability density decreases with the increasing of the wind power capacity factor, especially on the interval [0, 0.8]. As the wind power continues to increase, the probability density increases. The share of the wind power capacity factor mainly falls on [0, 0.3] and [0.9, 1], as high as 70%, which clearly shows a trend of polarization. The mean value of capacity factor in major offshore wind power markets in the world is generally between 0.29 and 0.48. In this study, it is equal to 0.35.
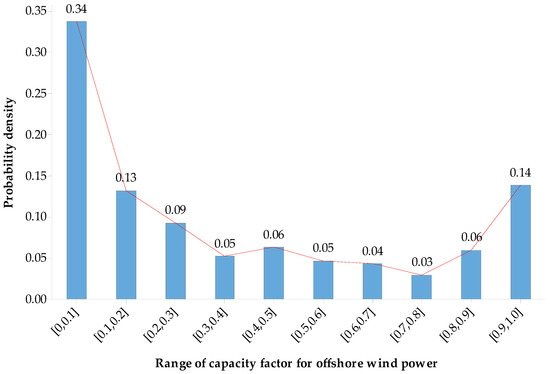
Figure 1.
Probability density of the offshore wind power plant somewhere in the South China Sea.
Statistically compared with the data listed in [21], the result that is shown in Table 2 demonstrates that the average output power of onshore wind power plant is at a lower level (~76%) and the shape is relatively flat. However, offshore wind power has a polarized characteristic when compared with onshore wind power. Moreover, the fluctuation of offshore wind power is also much stronger.
Table 2.
Comparison of probability characteristics of onshore/offshore wind power.
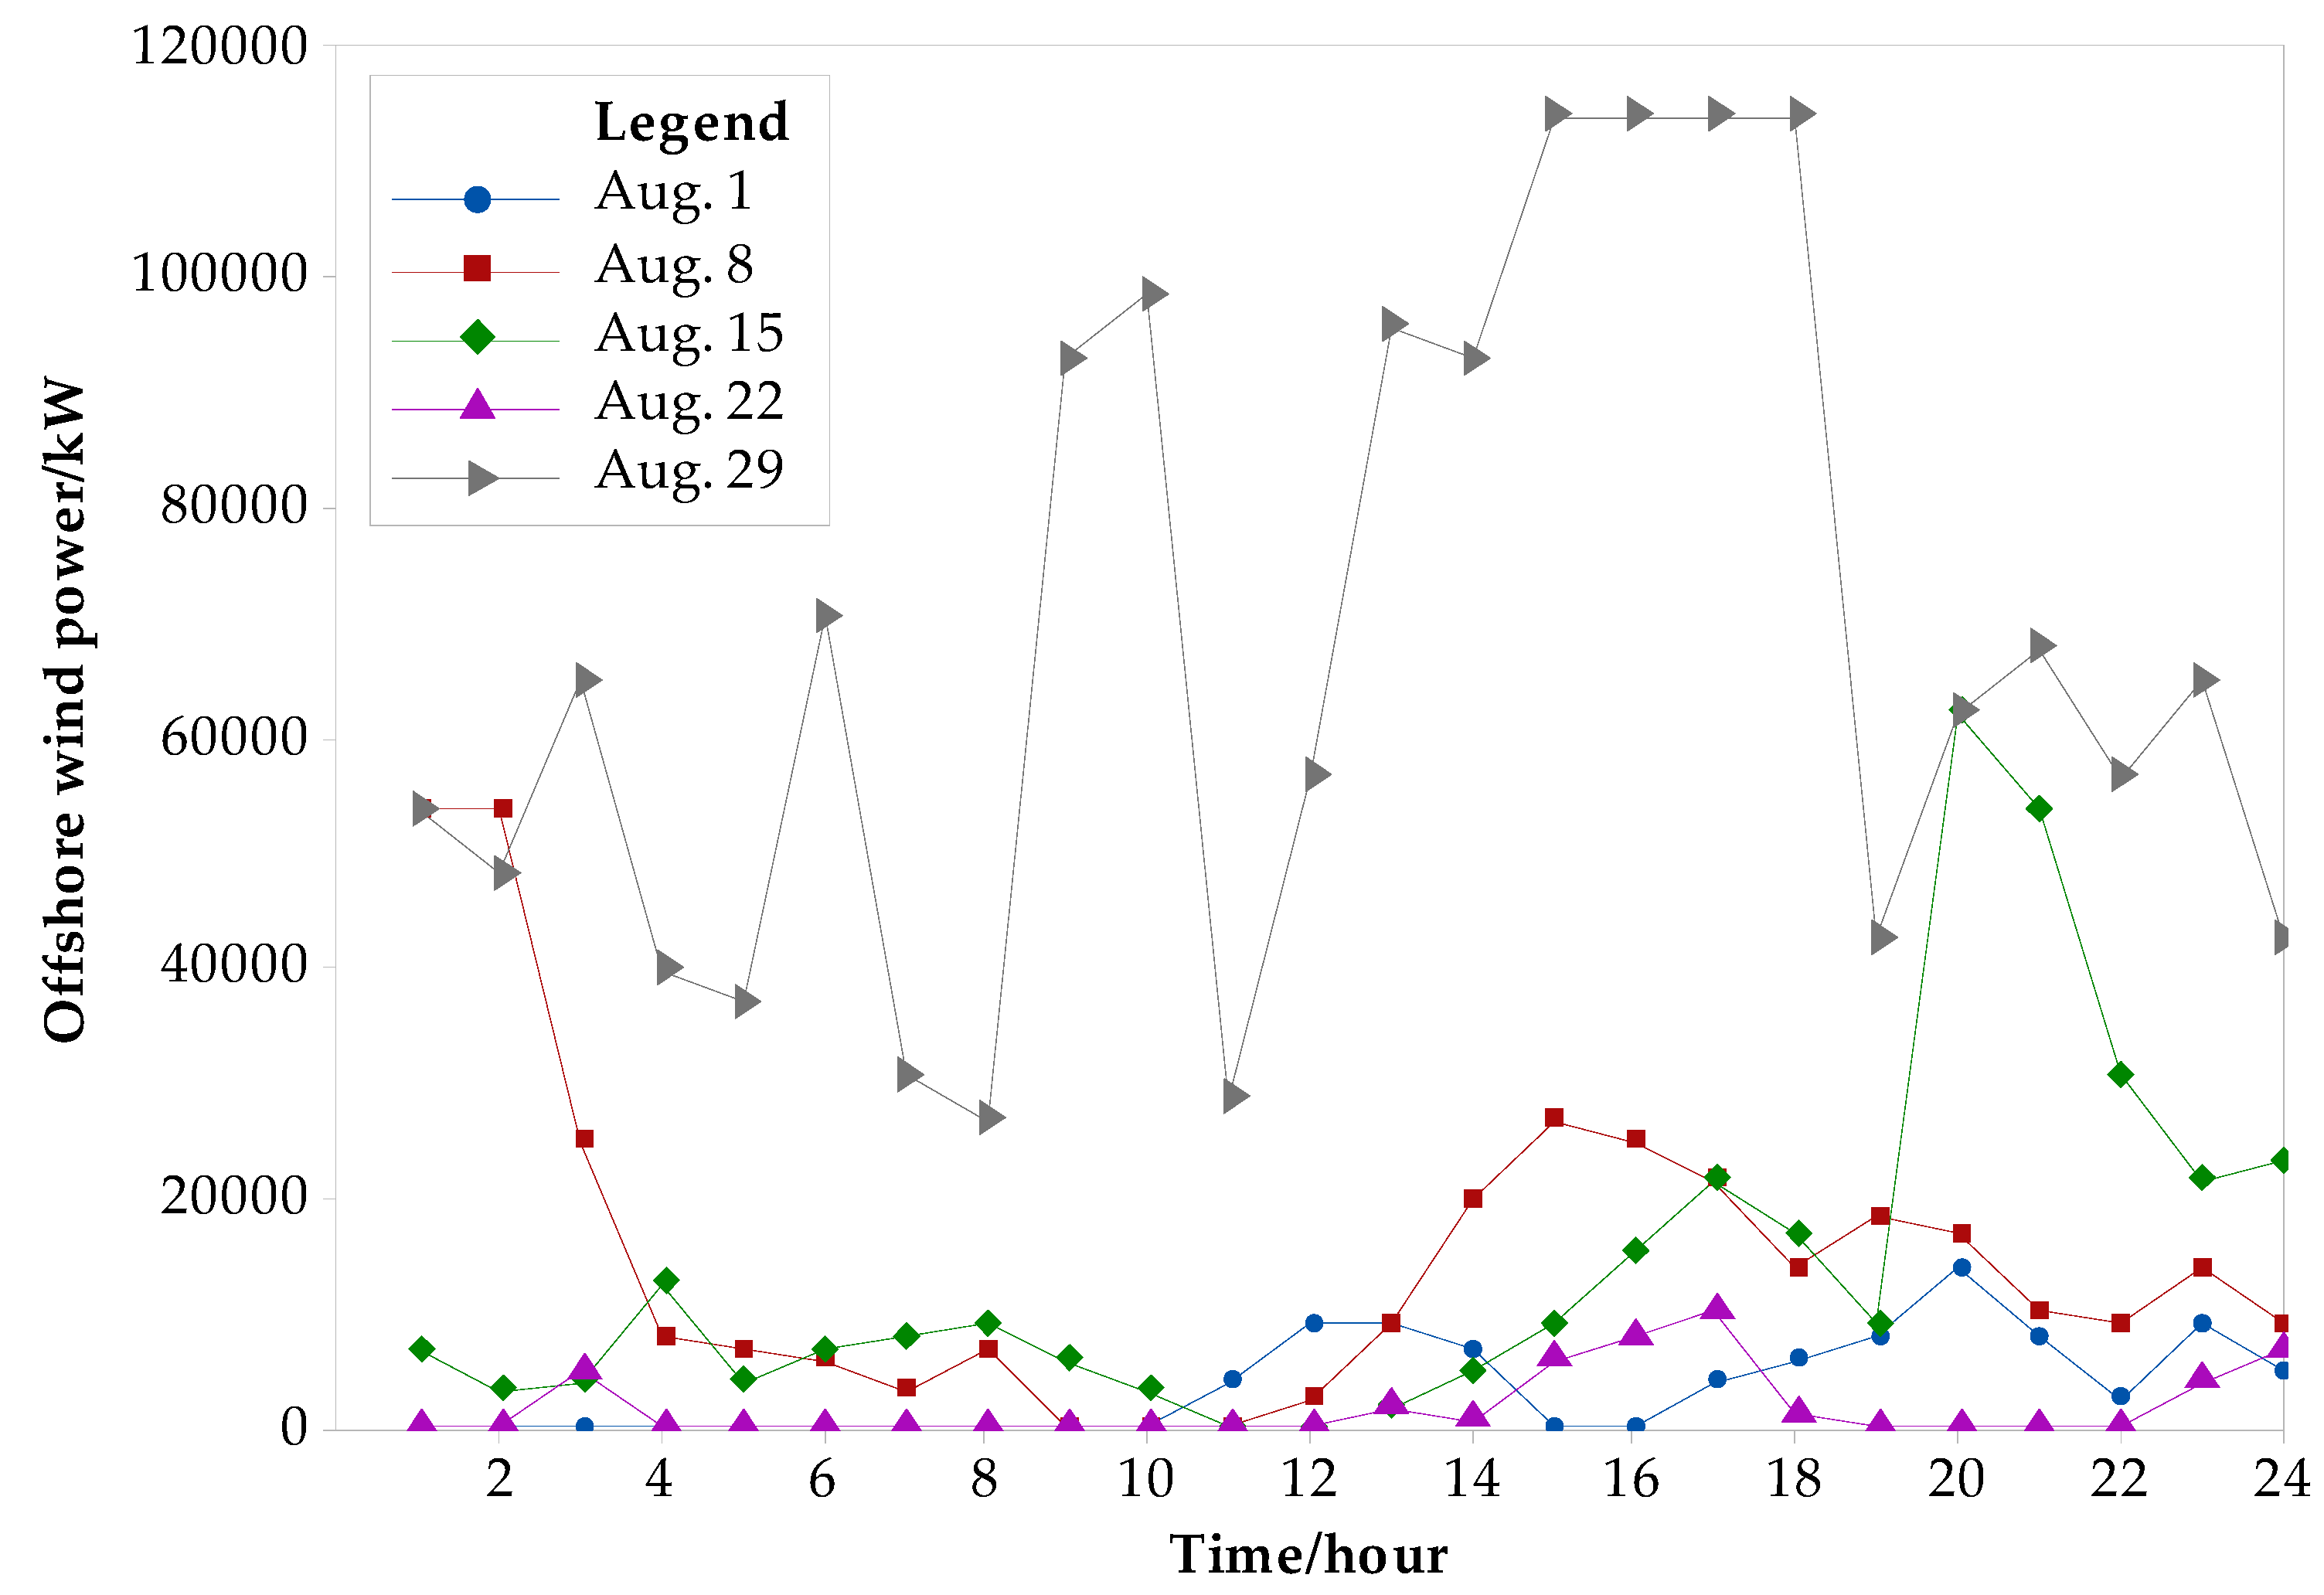
Besides, it is necessary to analyze the distribution law from time series. Sinden et al. [23] and Xu et al. [21], respectively, analyzed the output characteristics of offshore wind power in the United Kingdom (UK) and China on different timescales. According to the statistical data in a whole year (8760 h), it is found that offshore wind power has seasonal characteristics. Generally speaking, the output of offshore wind power is much higher during the winter than during the summer. Unfortunately, the seasonal characteristics of load demand seem to be in a completely different way, which results in extreme difficulty for wind power accommodation. Seasonal variation of wind speed leads to this difference directly. During the summer with the largest load demand, the offshore wind power is not strong enough, because it is just at a low level between 0.1 pu and 0.4 pu. Figure 2 shows, similarly, on the timescale of days, five typical daily power curves in severe peaking regulation. The rated power of this offshore wind power plant is 120 MW. Within the single day, the high value of wind power appears in the evening, while the low value in the morning, which shows a significant anti-peaking characteristic. Additionally, the wind power fluctuation varies more widely on different days. The average value of wind power is lower on four days and higher on one day only (August 29), as shown in Figure 2. This phenomenon also meets the probability characteristics of offshore wind power analyzed above.
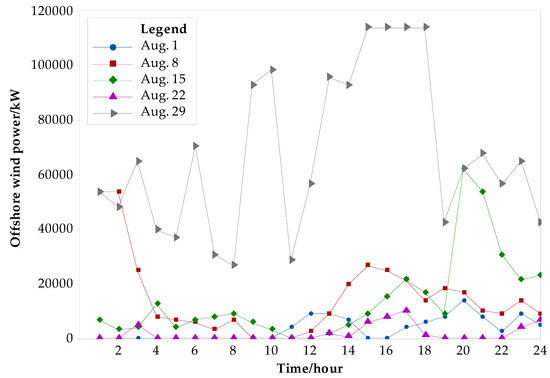
Figure 2.
Typical daily power curves from an offshore wind power plant in the South China Sea.
3. Optimal Sizing of SPSP
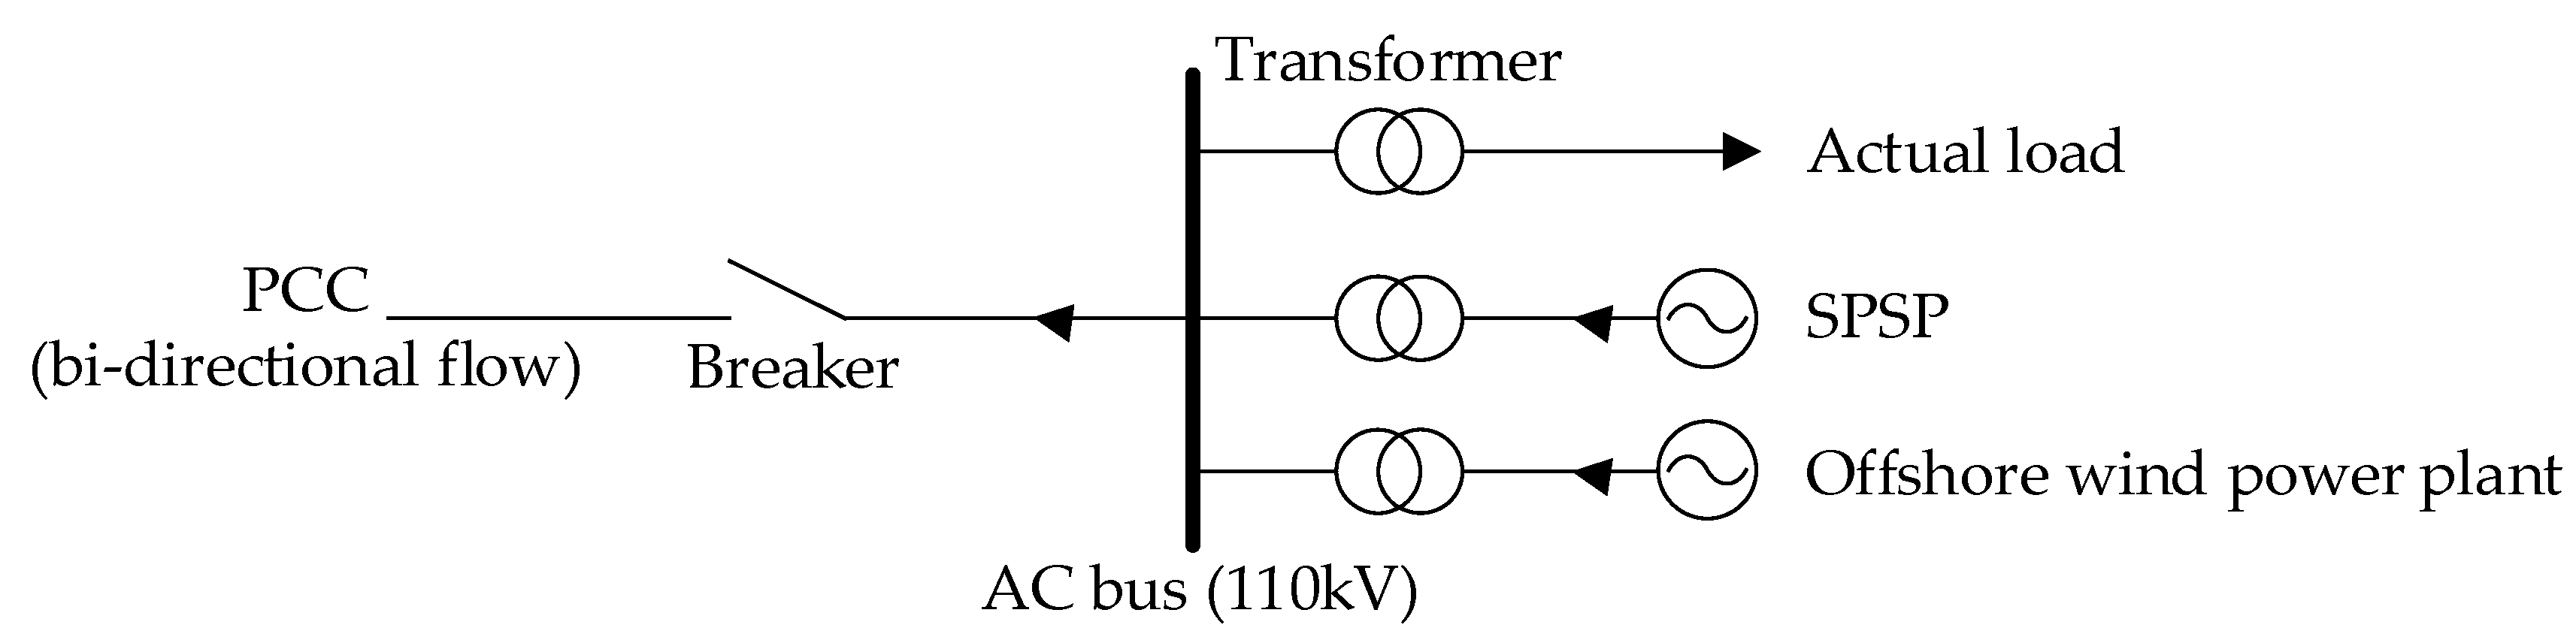
Figure 3 shows the target grid structure for all scenarios in this paper. The actual load of the islanded microgrid, the SPSP, and the offshore wind power plant are all connected to the AC busbar and finally linked to the major-grid through PCC.
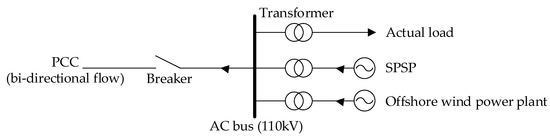
Figure 3.
The grid structure of islanded microgrid (arrows as the positive direction).
3.1. Objective Function
The revenue after applying the SPSP is mainly reflected in the installed capacity revenue and the electrical energy revenue through the different time-of-use tariffs. Coordinating with the offshore wind power plant, the SPSP is used to maximize the economic benefits of the islanded microgrid [24]. On this basis, the peaking cost that is caused by renewable energy fluctuation is specifically considered. Therefore, the total static revenues, respectively, include installed capacity revenue, electrical energy revenue, capital cost, energy losses cost, operating cost, and peaking cost. Finally, the objective function to maximize the static revenue can be expressed, as follows:
where:
The relevant variable descriptions are shown in nomenclature section of this paper. In Equation (3), only one of two variables PT or PP is enabled at the same time, obtained PG(t) = PT(t) in turbine mode or PG(t) = −PP(t) in pump mode. Δt in all equations above is the time interval. As the time-of-use tariffs are applied for this study, Δt is equal to one hour, for convenience.
3.2. Constraints
3.2.1. Power Balance Constraints of Islanded Microgrid
3.2.2. Output Power Constraints of Offshore Wind Power Plant
3.2.3. Output Power Constraints of SPSP
3.2.4. Electrical Energy Limit Constraints of SPSP
3.2.5. Electrical Energy Balance Constraints of the SPSP
3.2.6. Life Cycle Constraints of SPSP
3.2.7. Ramp Rate Constraints of Variable-Speed Units
4. Equivalent Modeling and Constraint Correction of SPSP
4.1. Output Power Characteristics of Variable-Speed Units
Based on the output characteristics of variable-speed units, a simplified modeling method of the units is proposed, which is mainly suitable for planning and scheduling in steady-state operation.
4.1.1. Generator Operating Mode
The variable-speed unit consists of two parts: pump-turbine and generator-motor. The pump-turbine is analogous to the conventional turbine in the generator operating mode, and the output power is related to the head and flow. A classic formula on it is as follows:
One of the advantages of variable-speed units is that it can adjust the different speed in real time to make the pump-turbine into the optimal efficiency range. This paper assumes that the pump turbine is running in the optimal efficiency range under steady-state operation. Muljadi et al. [26] and Koritarov et al. [27] analyze the optimized operation characteristics of the variable-speed unit in detail. Under the condition of a certain hydraulic head, the output power of a turbine is approximately linear with the rotor speed. The formulas are as follows:
Further simplification yields output power as a function of speed and head, as follows:
where the subscripts * is the per unit value (the same below). It can be seen that, in the case of a certain head, the turbine output power is almost determined by a single value. The above formula no longer contains variable flow QT, which simplifies the calculations. In the case of a certain head, there is a different but individual maximum output power that corresponds to different speed.
As all of the energy is almost from prime mover: the pump-turbine, so the power and mechanical speed of the generator-motor is equal to the pump-turbine, respectively. The power converter does not generate energy by itself. If the power conversion losses are not accounted for, the output power of the variable-speed unit is equal to the pump turbine approximately, being expressed as follows:
4.1.2. Pump Operating Mode
Generally, the input power of the conventional fixed-speed unit cannot be adjusted. However, the variable-speed unit can track the optimal efficiency point in the pump mode by changing the speed to adjust the power demand and improving the operating conditions. The classic equation for the input power of the pump-turbine in pump mode is as follows:
The pump characteristic curve is nonlinear and is determined by the curve. The relationship between speed ωr, lift HP, and flow QP in pump mode is approximately expressed by a quadratic polynomial, as follows [28]:
where a0, a1, and a2 are polynomial fitting coefficients. a0 will be greater than zero and a1, a2 less than zero.
While still assuming that the pump turbine is operating in the optimal efficiency range, Equations (20) and (21) are arranged to obtain the expression of input power with respect to speed and pump head:
Similarly, it is considered that the output power of the variable-speed unit is the opposite of the input power of the pump turbine.
As a certain lift , different speeds correspond to different maximum output power. In this paper, a0 is 1.4, a1 is −0.2, and a2 is −0.3.
In summary, after determining the maximum variable range of speed (e.g., a change rate of ~10%), the output (or input) power at the current hydraulic (or pump) head can be obtained according to the simplified formula in Section 4.1.
4.2. Constraint Correction of SPSP
Based on the above analysis, it is necessary to further modify the conventional constraints for the power characteristics of the variable-speed unit.
4.2.1. Equivalent SOC of SPSP
State of charge (SOC), which is a common concept in a battery storage system, will be applied to SPSP with variable-speed units because of the fast power response characteristic. The ratio of the residual electrical energy to the maximum electrical energy in the upper reservoir is defined as the equivalent SOC. Equation (11) is amended, as follows:
SOC can be obtained through the integration of area and head fitted by the reservoir curve. Among them, the calculation equation of electrical energy is as follows:
where electrical energy Eup can be calculated between different heads (from H1 to H2).
4.2.2. Equivalent Self-Discharge of SPSP
Water losses (e.g., evaporation and leakage) of the SPSP are inevitable during the operation, so these energy losses can be analogous to the losses that are caused by self-discharge behavior of battery storage system. Therefore, also based on Equation (12), the following equations hold.
where loss is set to 0.01% per day of reservoir volume, the computation is seen below.
For all PSP, it is necessary to compensate for some water in reservoirs because of evaporation and leakage from the water surface. Many factors affect the loss rate (e.g., terrain, wind speed, climatic conditions, precipitation, etc.). The losses are relevant to the time interval. Daily evaporation losses are assumed to be negligible due to the amount of water evaporated and leaked being far too small when compared to the total water volume in the upper reservoir. However, when ensuring the completeness of the proposed method, it is essential to introduce this variable loss. According to Scherer et al. [29], the global average of water consumption of reservoirs is 27.4 m3/GJ per year. After conversion, it is 0.2702 m3/MWh per day. For this daily SPSP, total electrical energy for two times (pump and turbine mode) in the whole day is set to 100 × 2 MWh, for convenience. The maximum volume of the reservoir is 6.1×10⁵ m3. The final result is roughly equivalent to 0.01%. It is as follows:
In equation (29), m(t) and n(t) are boolean values (equal 0 or 1), just like x(t) and y(t), which are used to indicate the status of the unit: generator or pump operating mode. For example, when m(t) = 1 and n(t) =0, which means that the SPSP is operating in pump mode at time t, and vice versa. Certainly, m(t) and n(t) cannot be equal to 1, simultaneously.
Thanks to the applying of high-power converters, the power response rate of the variable-speed unit can be in the order of milliseconds [30,31]. It provides an excellent performance, like a battery energy storage system. It is not necessary to consider the ramp rate constraint like a conventional fixed-speed unit, so Equations (14) and (15) are redundant. Additionally, when considering the scheduling plan for the next day, the initial and final values of the upper reservoir energy should be equal.
4.3. Power and Fluctuation Limit Constraints at PCC
Thermal stability limit of the transmission line at PCC is as follows:
where is thermal stability power at PCC (associated with rated short-time withstand current).
Moreover, the sample standard deviation of power is defined as the evaluation index for power fluctuation. As the power accommodation is an urgent concern in this study, the standard deviation of power is applied instead of the power ramp rate. The former one varies on timescales of days and the latter one on timescales of minutes. The control strategy on timescales of minutes or seconds is not discussed in this study. Within a scheduling period, expressions should be satisfied, as follows:
where σpcc is the sample standard deviation of power at PCC and the spcc is the evaluation index for normalized power fluctuation at PCC. Of course, the lower spcc the better. However, it depends on boundary parameter β, while too low a value will produce much higher costs.
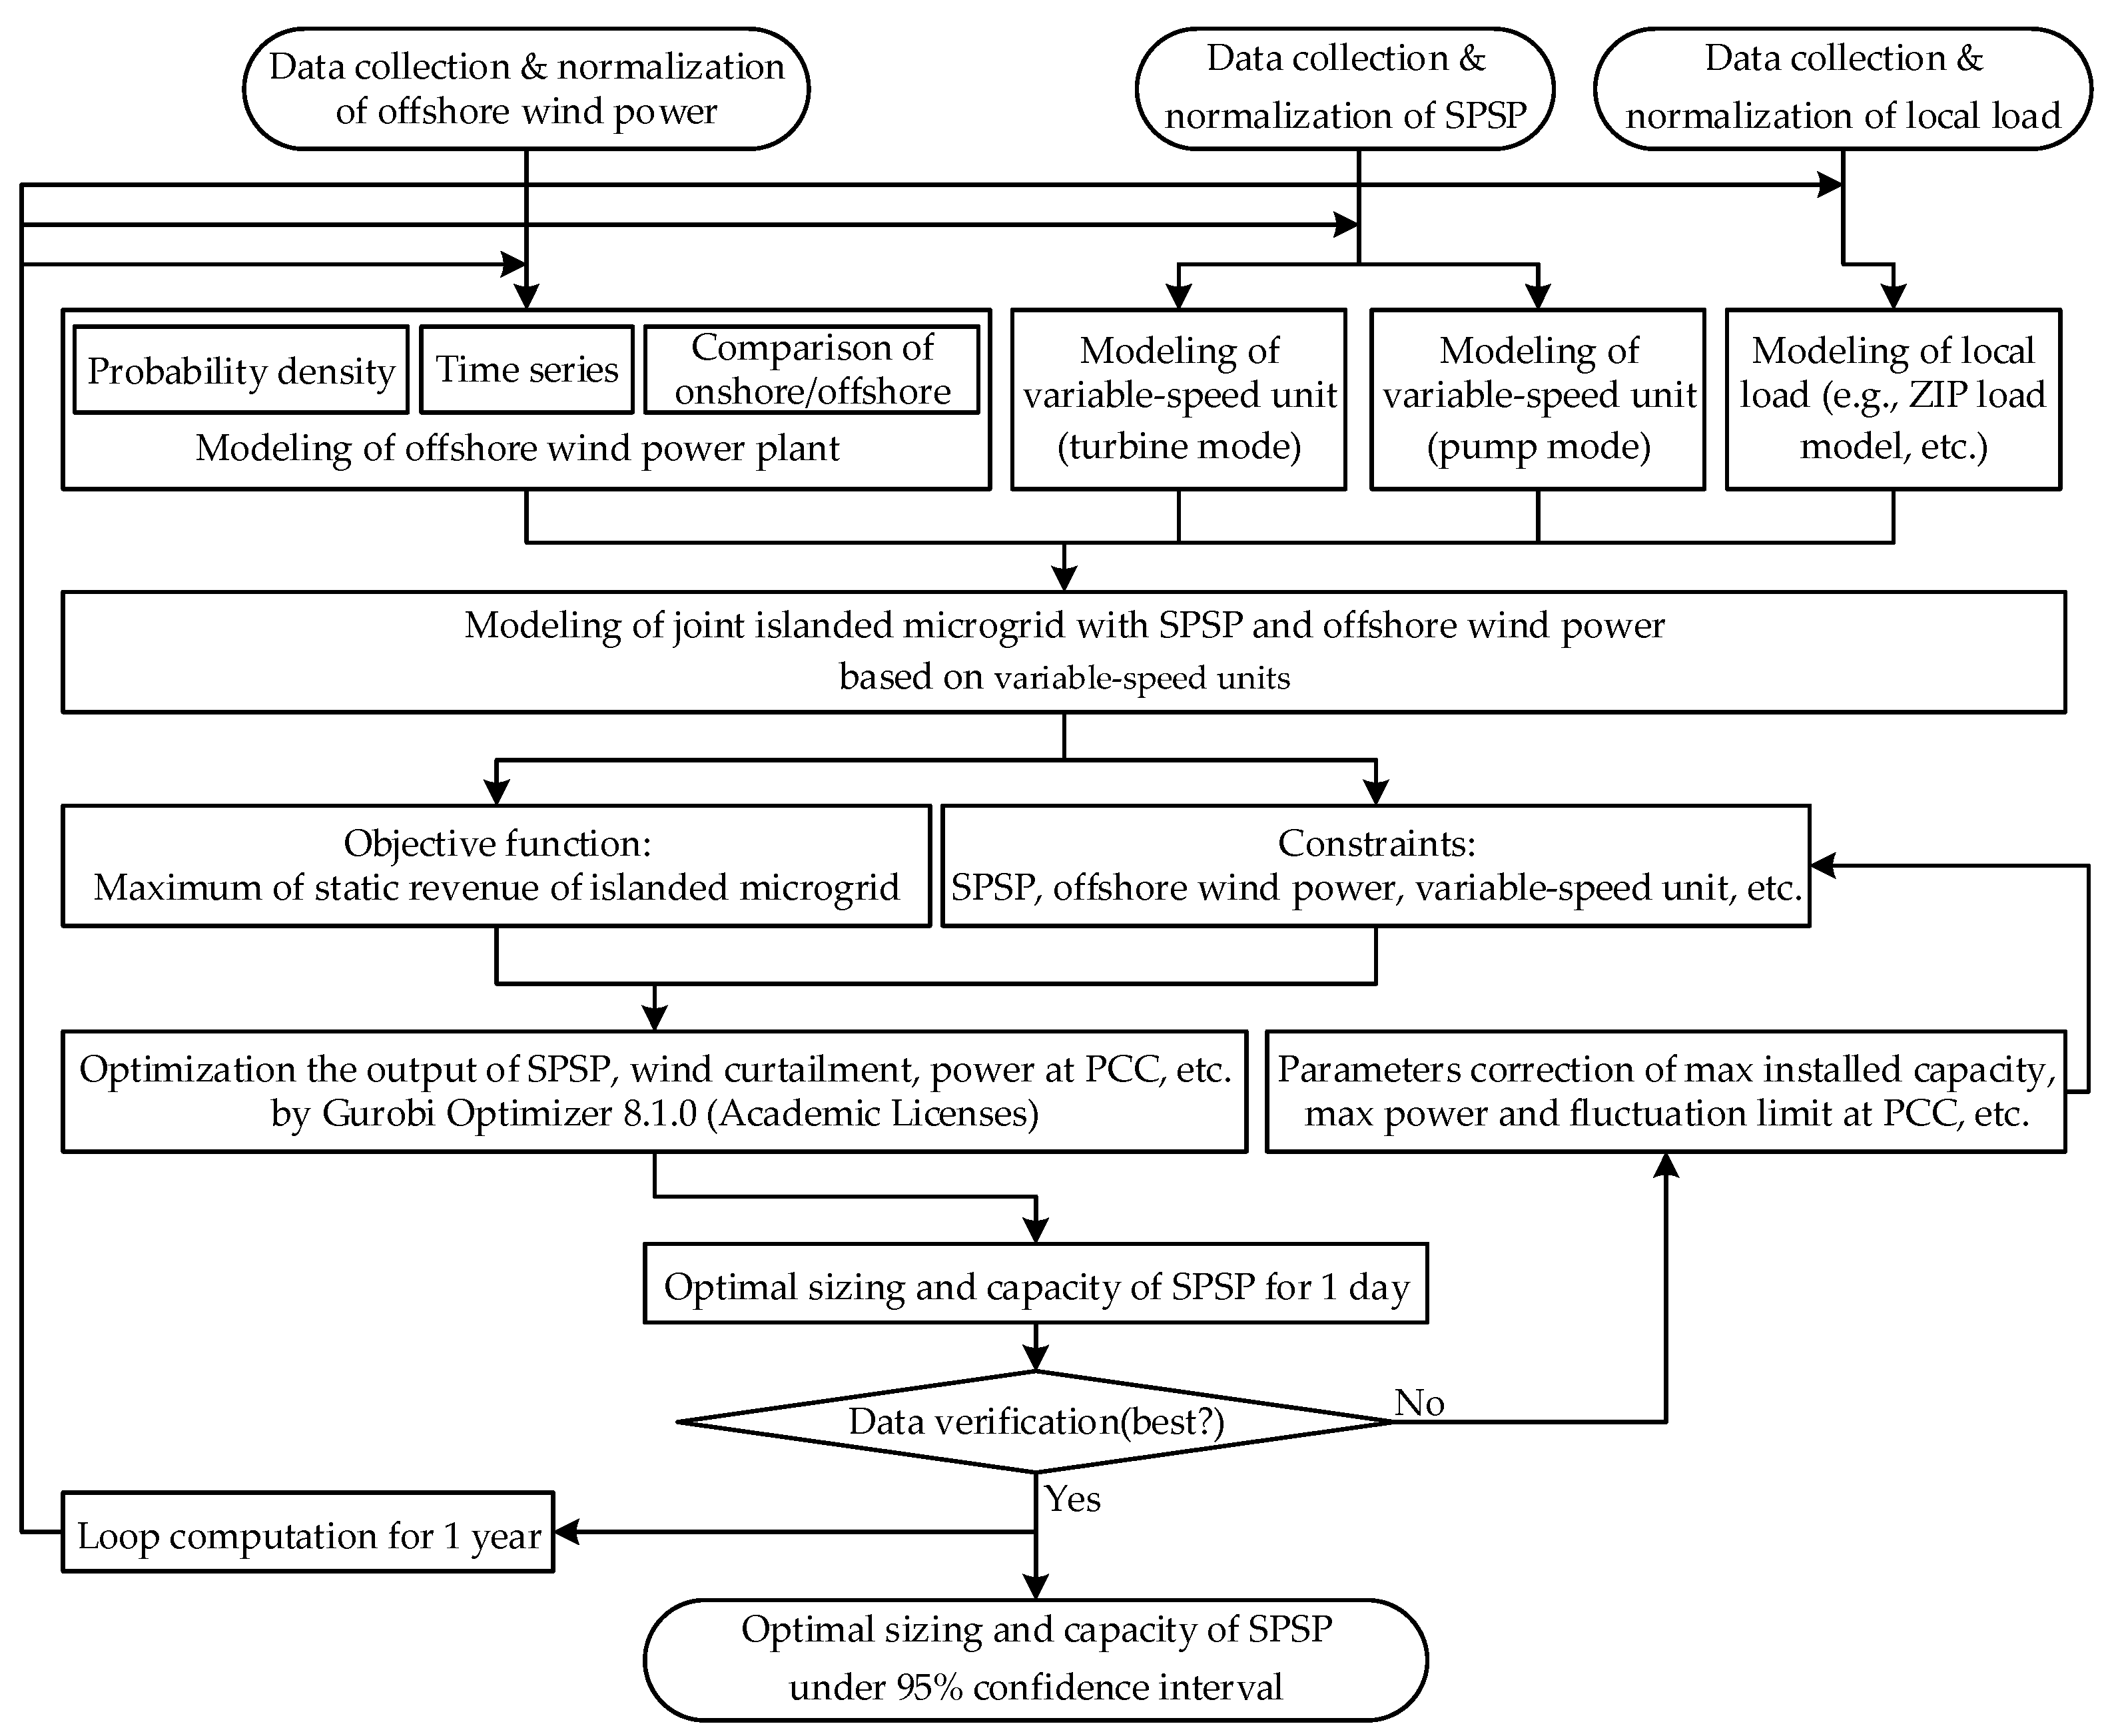
Finally, Gurobi Optimizer 8.1.0 is used to solve the quadratic programming problem and it performs effectively in this study than other algorithms. This software is a commercial optimization solver developed by Gurobi Optimization, LLC. (Beaverton, Oregon, USA), founded by Zonghao Gu, Edward Rothberg and Robert Bixby. Figure 4 shows a particular flowchart.

Figure 4.
Flowchart of the proposed approach.
5. Case Study
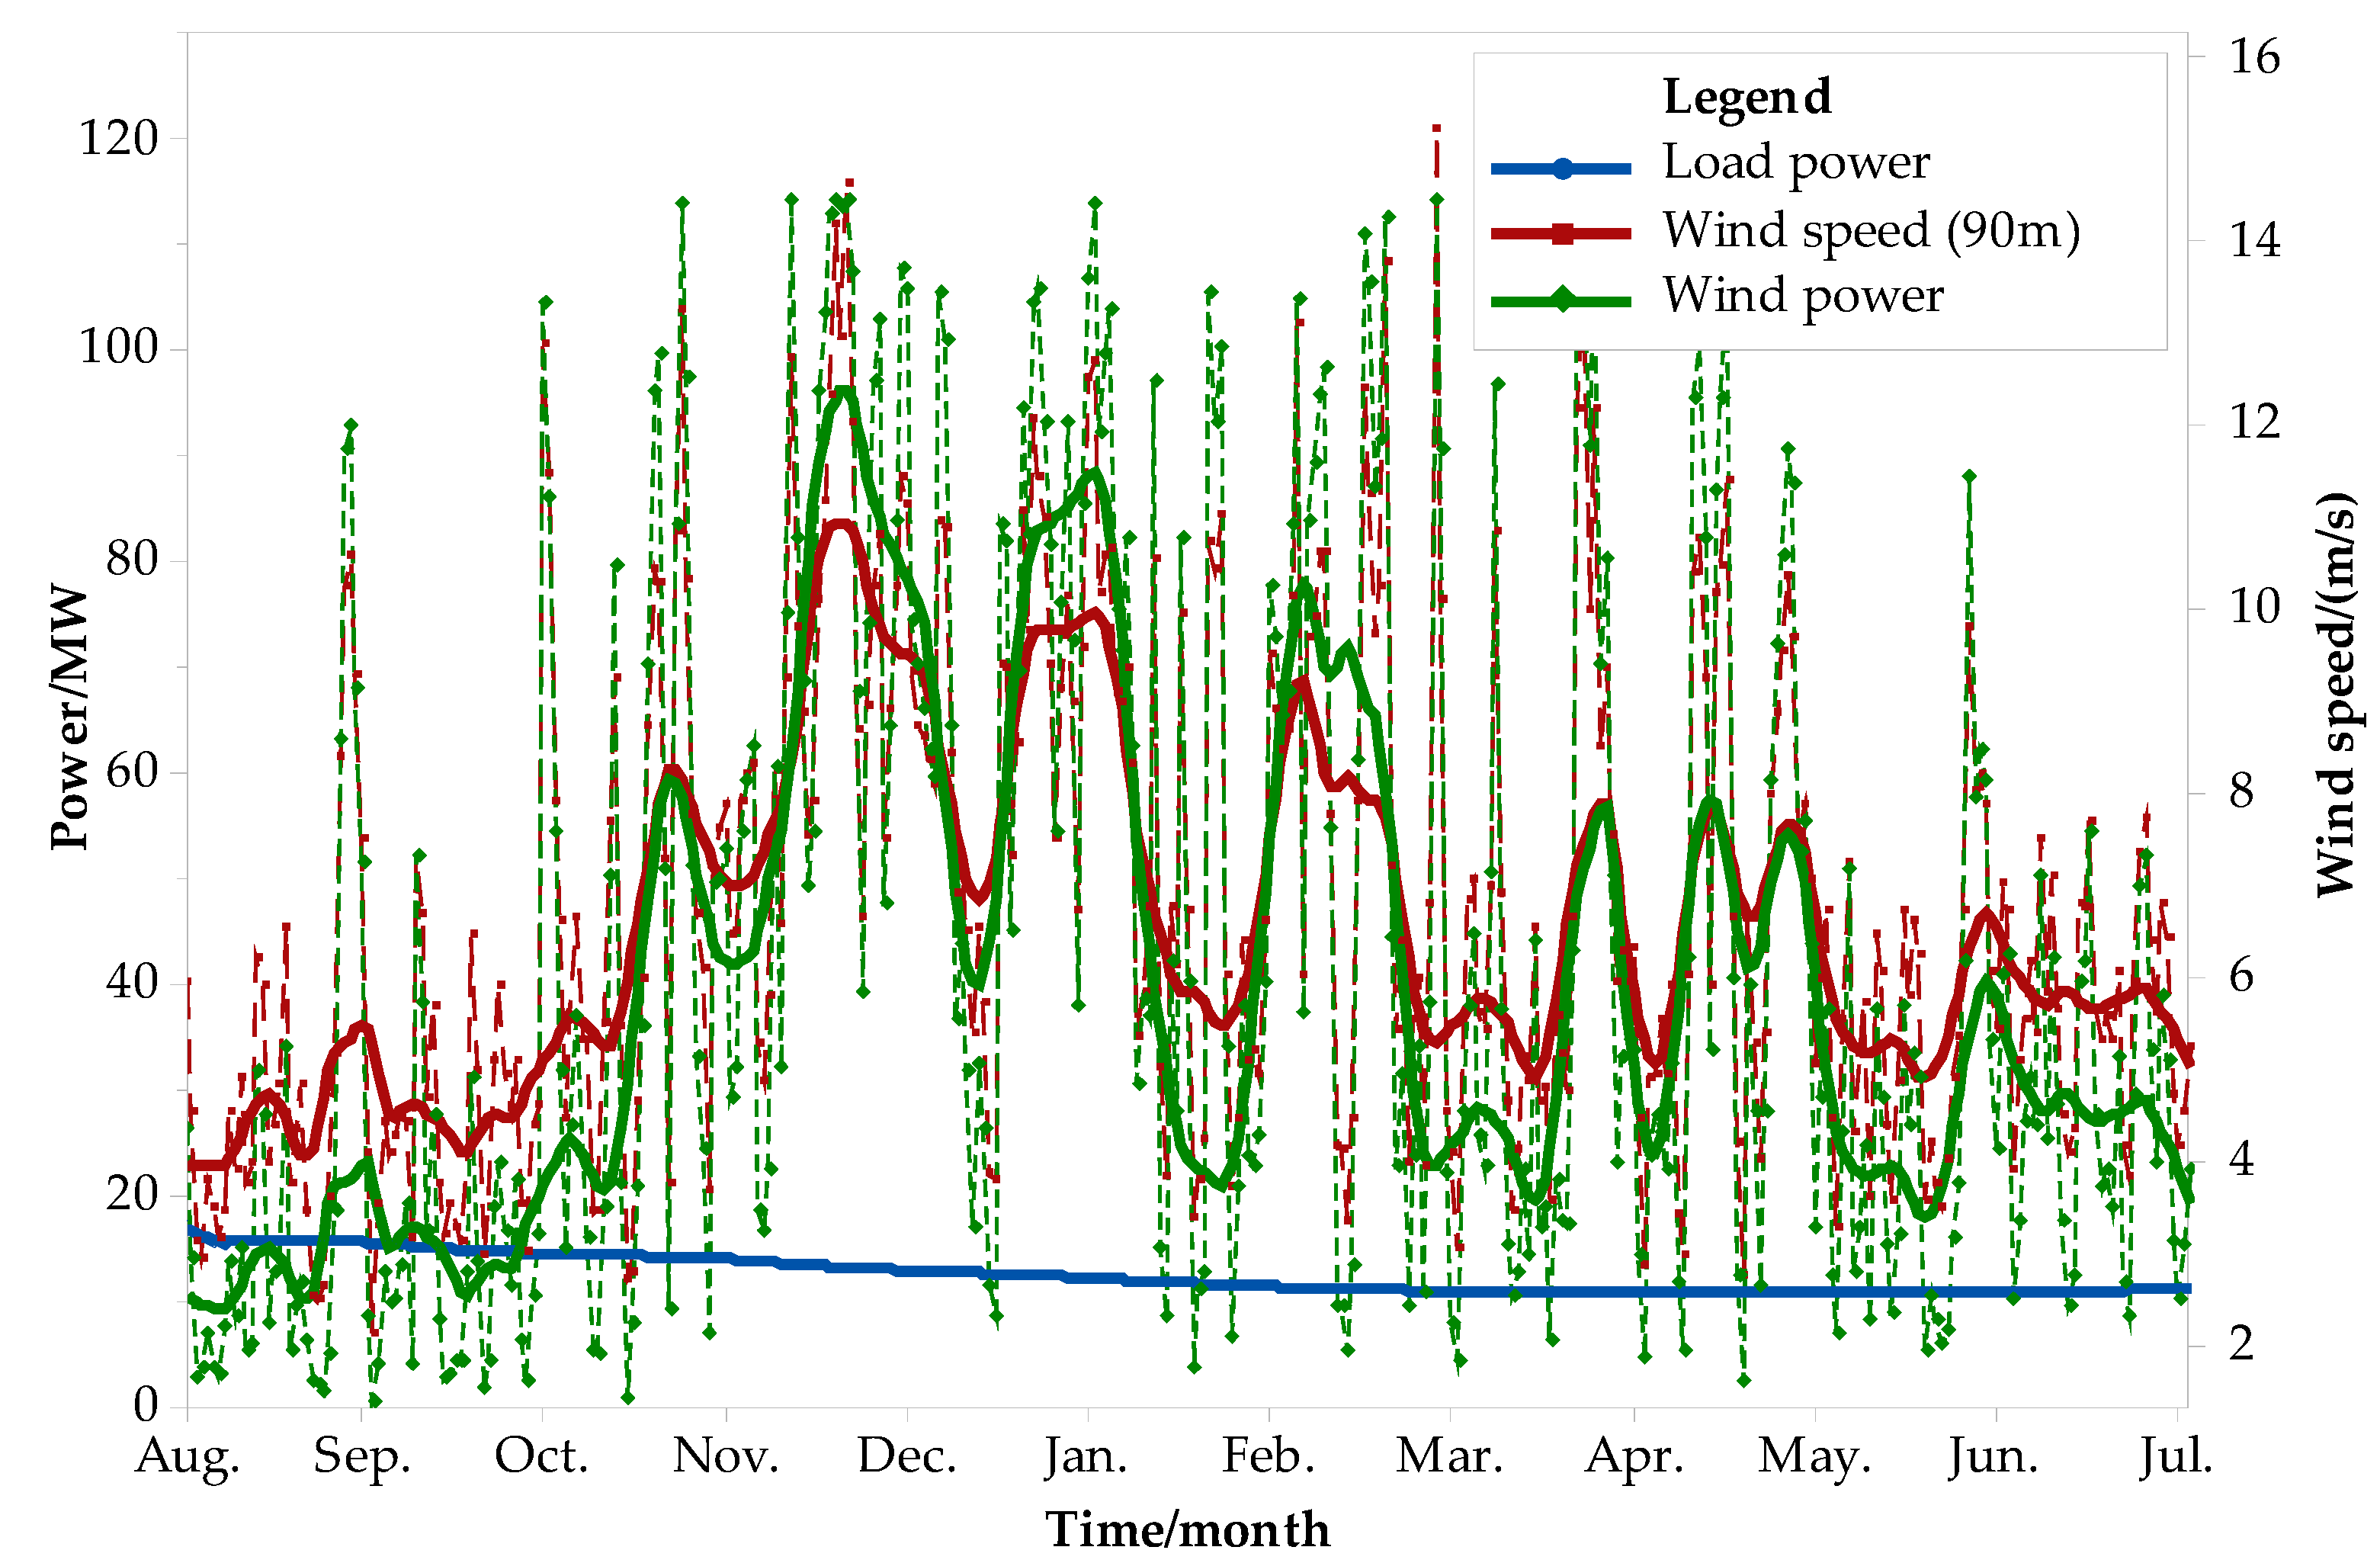
All data regarding the offshore wind power plant and islanded microgrid are taken from Zhuhai City, Guangzhou (located in the South China Sea for latitude 21.95° and longitude 113.75°). The total installed capacity of the wind power plant is 120 MW and the capacity factor is 36%. The maximum daily load of the islanded microgrid is 18 MW and the average daily load factor is 0.693, as shown in Figure 5. For better visualization, the statistics method with locally weighted scatterplot smoothing (Lowess = 0.05) is used for graph smoothing in Figure 5.
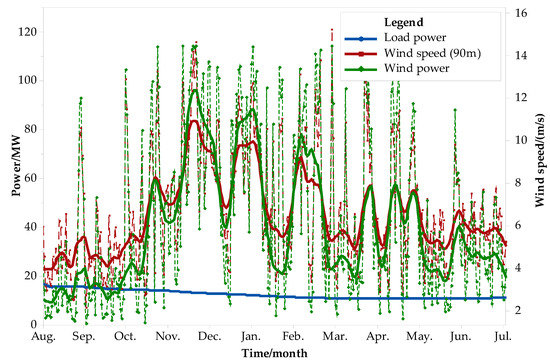
Figure 5.
The timing diagram of wind speed, load and wind power after smoothing (Lowess = 0.05).
According to the statistic of 8760 h over the whole year, the Pearson correlation coefficient between the measured speed at 90 m in height and the offshore wind power is 0.984 (approximately equal to 1), which indicates that the wind speed and the wind power are have a significant positive correlation. During the summer with the largest load demand, the wind power is not at a high level. Even the wind power shortage occurs at some times, which shows a degree of anti-peaking characteristics. The probability density curve of the wind power is polarized. The operating time at low power or full power is relatively long, which is basically consistent with the above analysis. Table 3 shows the natural geographic conditions of the SPSP after a survey.
Table 3.
Geographic parameters of the SPSP.
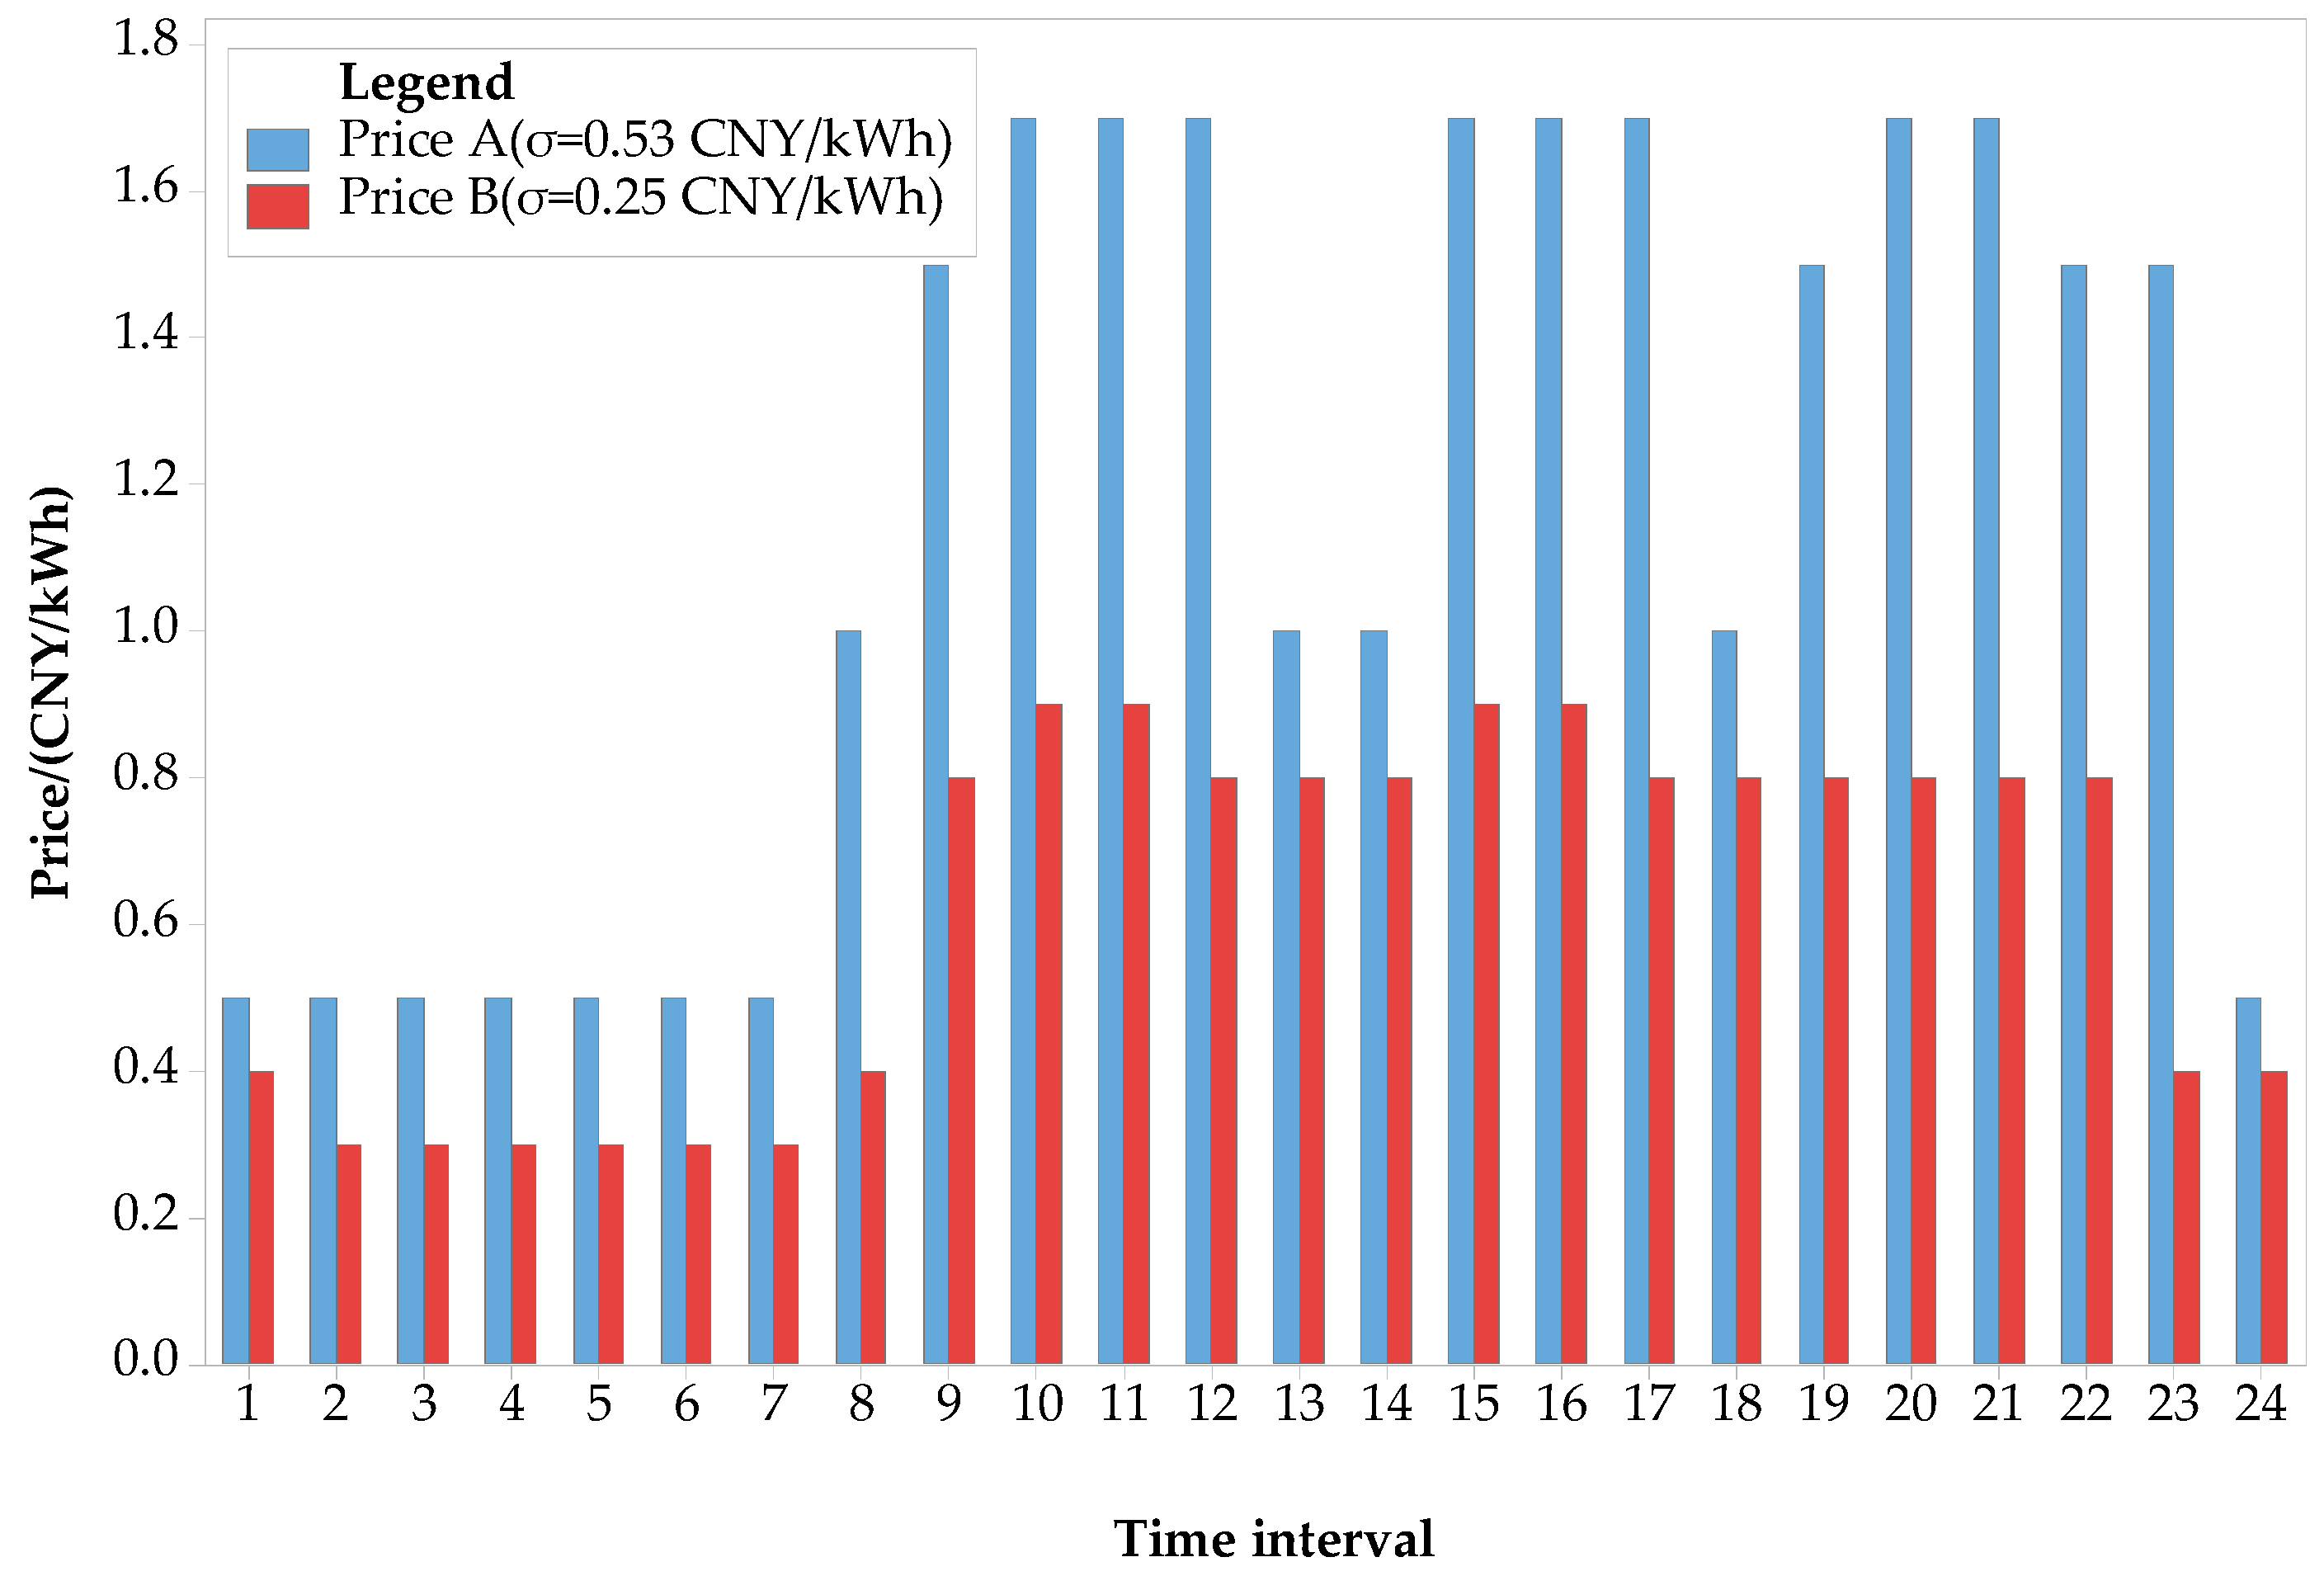
The relevant operating parameters are shown in Table 4 [32]. According to common industry norms, the energy conversion efficiency is set to 0.9 under turbine mode and 0.8 under pump mode, respectively. The time-of-use tariff of price A (blue), which is the standard deviation of this price, is 0.53 CNY/kWh, as shown in Figure 6. According to pricing policy No.1763 launched by the Chinese government in 2014, the price for pumping is calculated at 75% of the time-of-use tariff.
Table 4.
Geographic parameters of the SPSP.
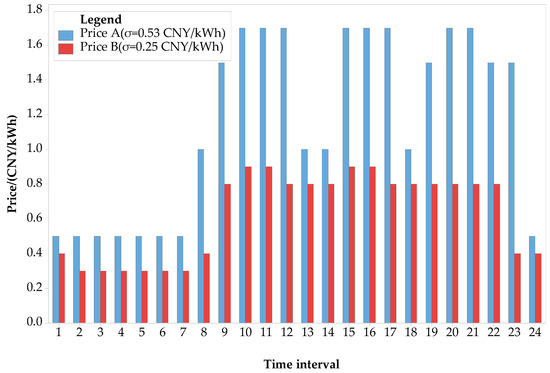
Figure 6.
Comparison of time-of-use tariffs with different standard deviation for SPSP.
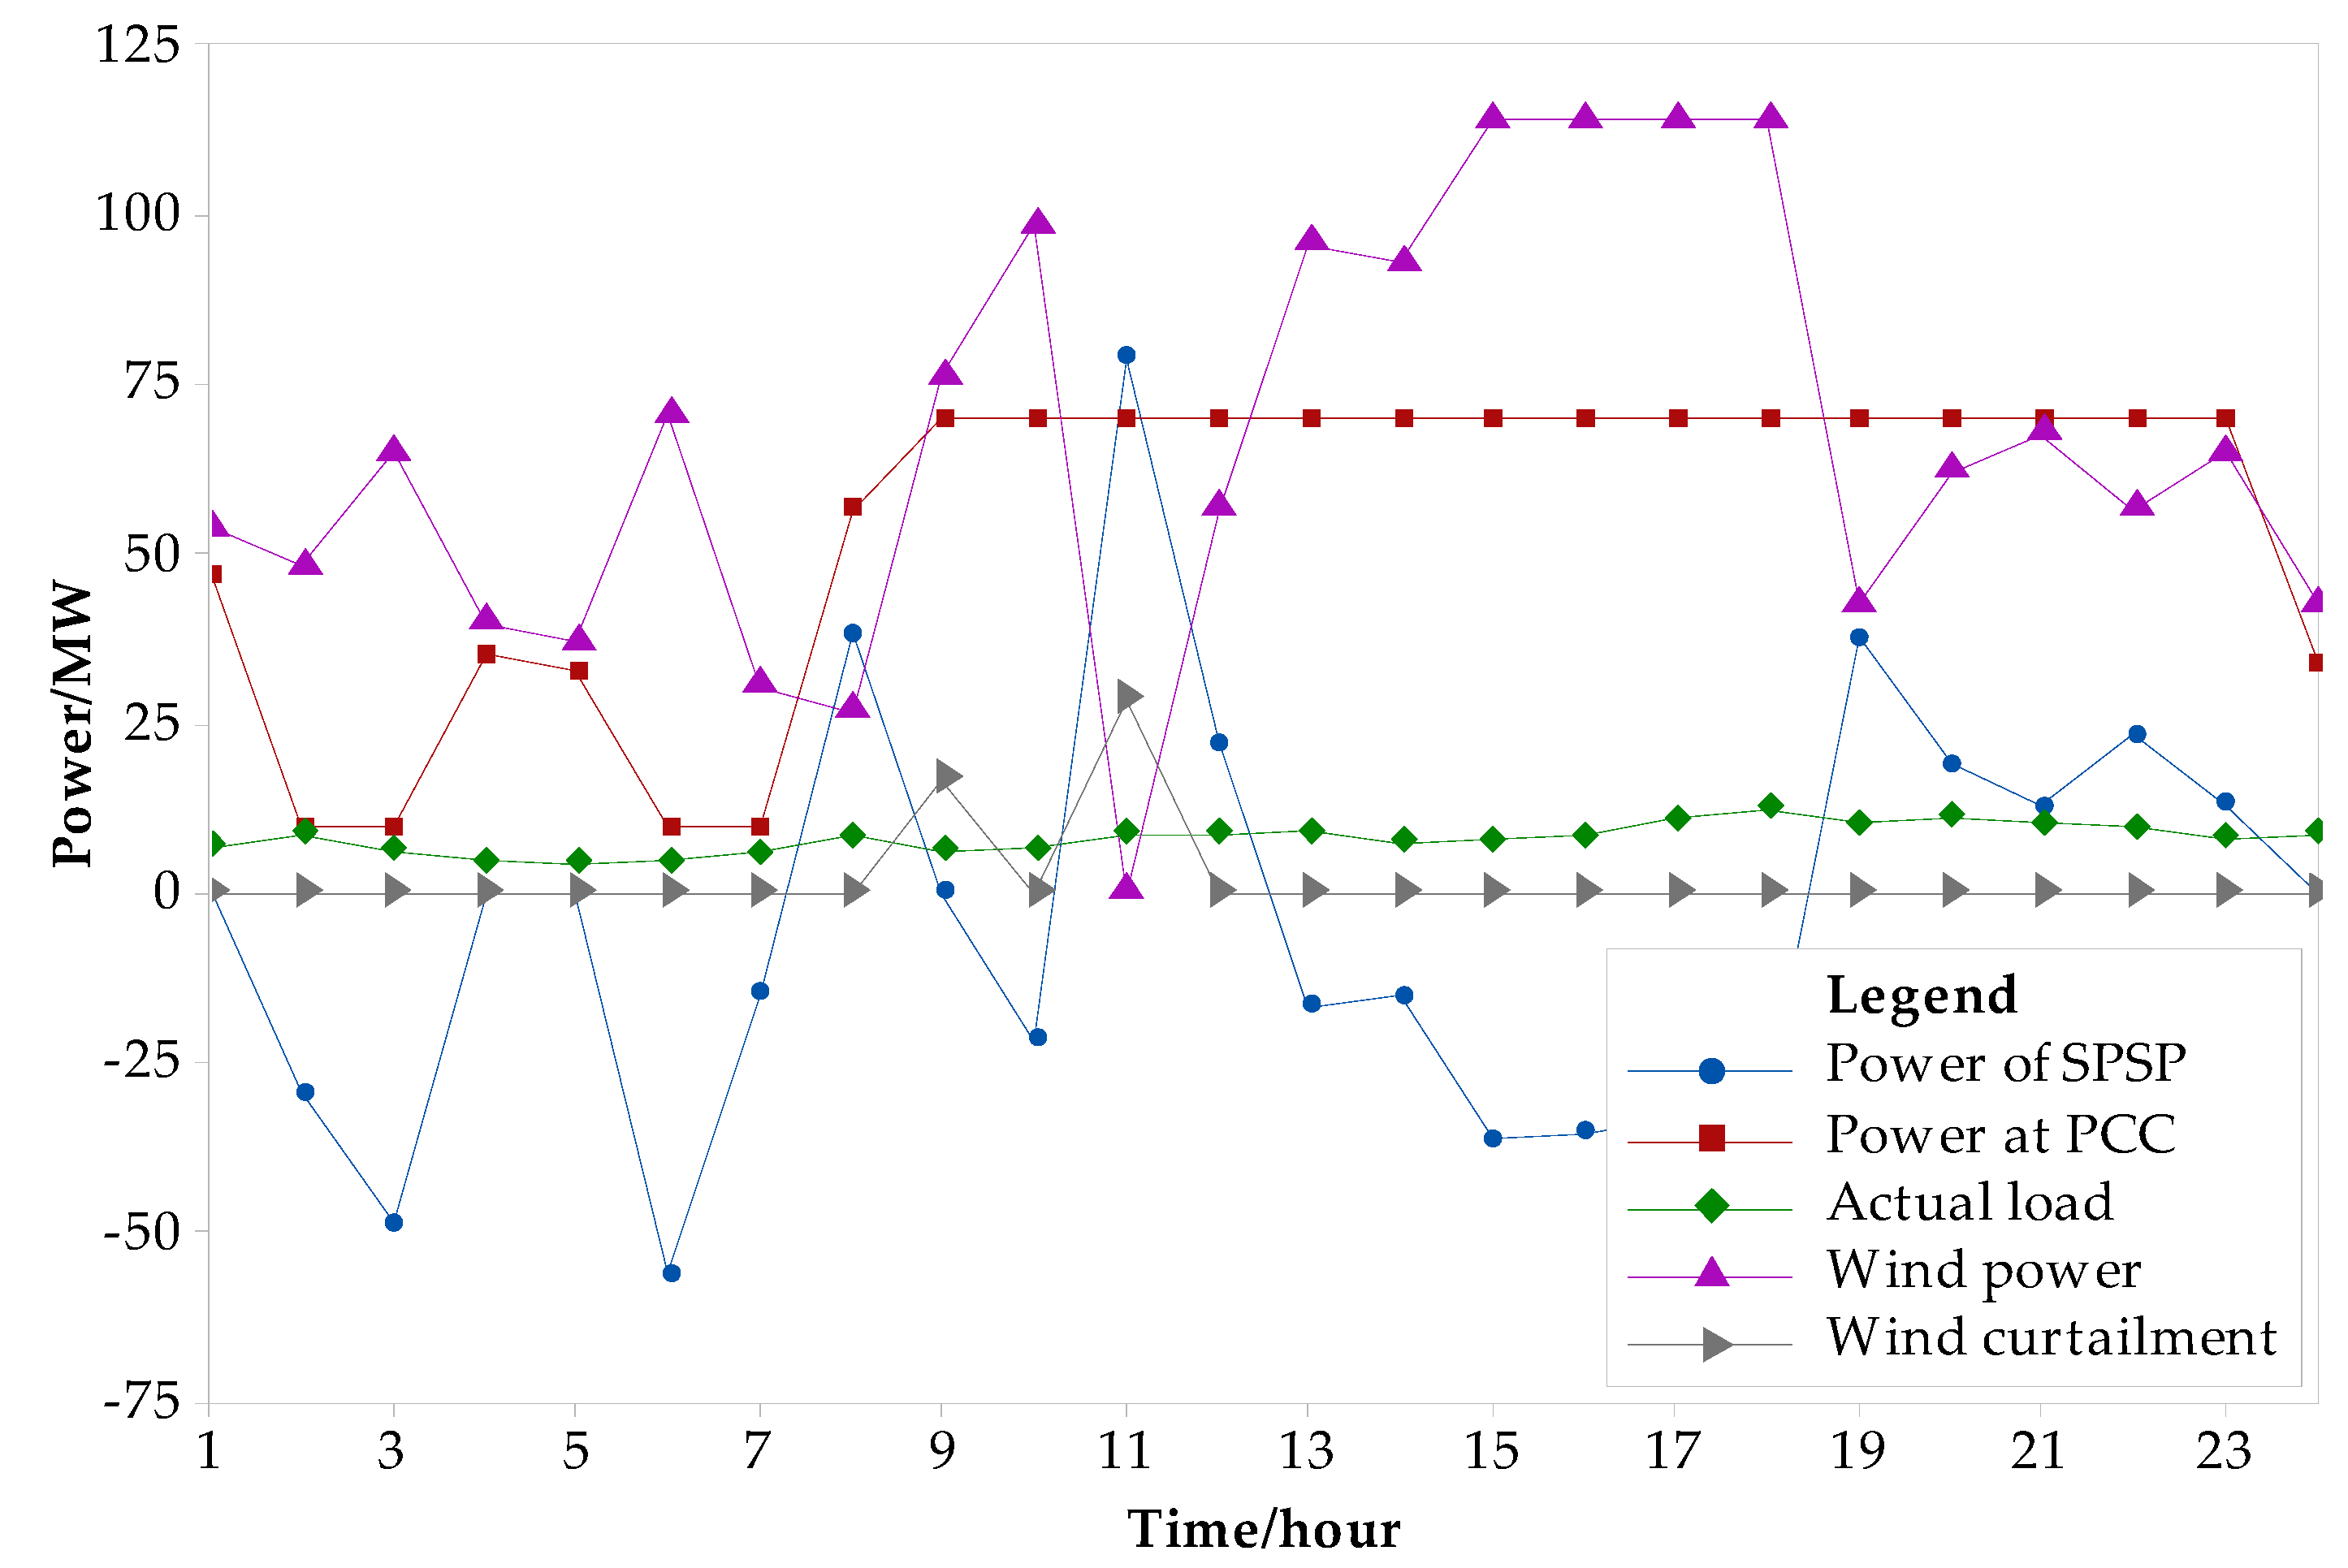
Figure 7 is an operation diagram after calculation on a typical day (August 29th). The preconditions are as follows: the upper limit of power at PCC is 70 MW, the upper limit of fluctuation at PCC is 35%, and the upper limit of the installed capacity of SPSP is 200 MW. It can be seen that the daily load is relatively stable all day. The average daily output power of offshore wind power plant is relatively high, reaching a high level of above 0.6 pu from 9:00 to 23:00. However, from 11:00 to 12:00, a local minimum value of wind power appears, and it suddenly drops to 0.1 pu. Under the constraints of power and fluctuation, the randomness of offshore wind power causes severe wind curtailment. Fortunately, applying SPSP makes the wind curtailment reduce from 207 MWh to 45 MWh.
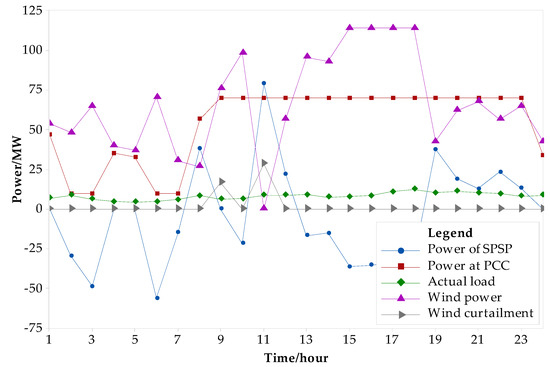
Figure 7.
The optimal operation curve of the islanded microgrid on a typical day.
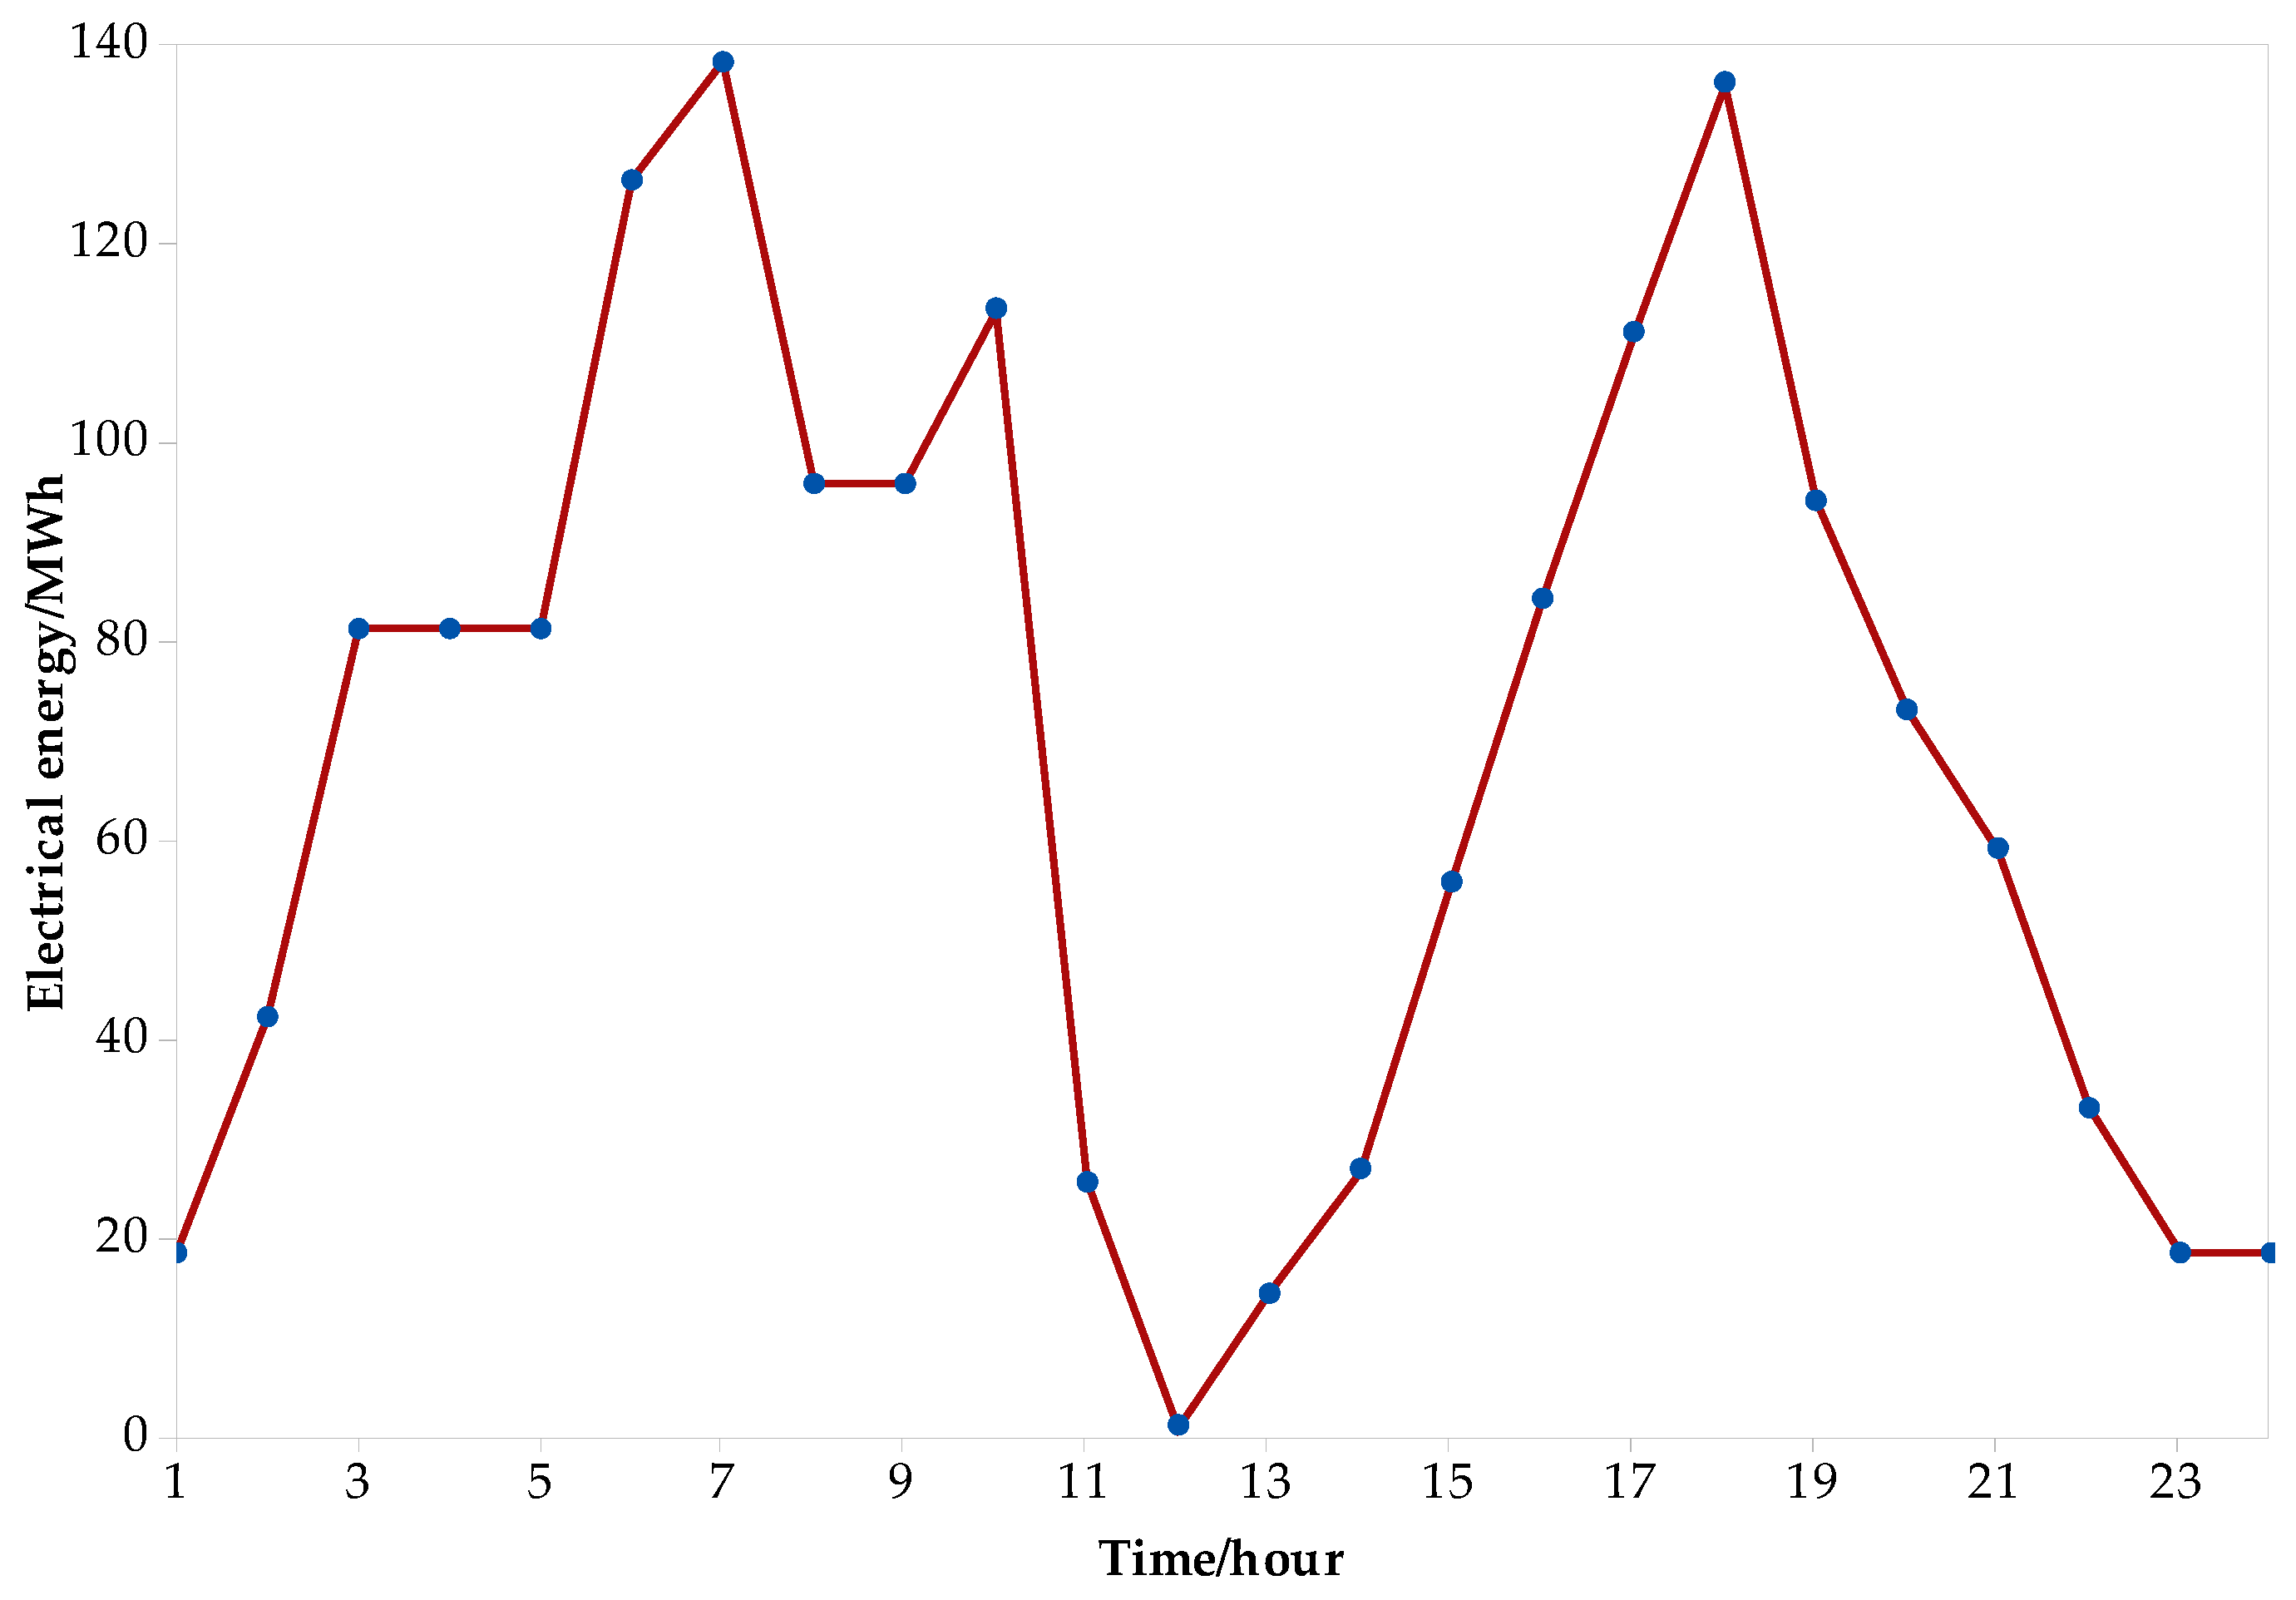
Figure 8 shows the timing diagram of the schedulable electrical energy of the upper reservoir on the same day with the same parameter settings. The SPSP absorbs a large amount of “cheap” wind energy during the early morning hours or the time of wind power excess. The SPSP maximizes the electrical energy revenue through cyclic regulation [33]. Finally, the SPSP has an optimal installed capacity of 78 MW and a maximum electrical energy of 136 MWh under the current scenario.
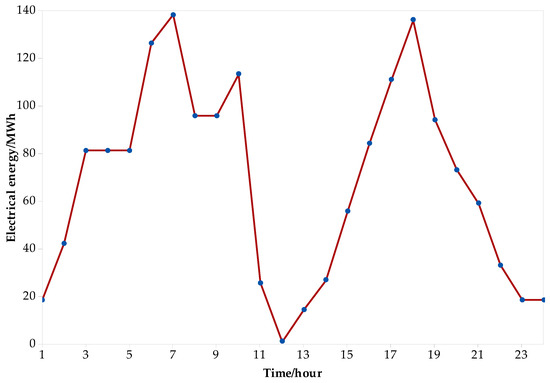
Figure 8.
The schedulable electrical energy of SPSP on a typical day.
At the same time, the total static revenue of the SPSP is also calculated after peaking regulation, as shown in Table 5. The total static revenue is 1.75 million CNY/day (after) or 1.47 million CNY/day (before), so the net revenue is 280,000 CNY/day after peaking regulation.
Table 5.
Static revenue of the islanded microgrid on a typical day.
Further, a different optimal installed capacity and maximum revenue can be obtained in different restricted conditions, if necessary. As shown in Figure 9, both the installed capacity limit and the power limit at PCC greatly affect the optimal installed capacity of SPSP. Taking a typical day as an example, the general trend increases with the increase of both the installed capacity limit and the power limit at PCC. However, in areas where the installed capacity value is less than 120 MW and the power limit at PCC is greater than 100 MW, there is a local maximum value of 130 MW for the optimal capacity of SPSP. That means that the optimal capacity surface of SPSP is nonlinear.
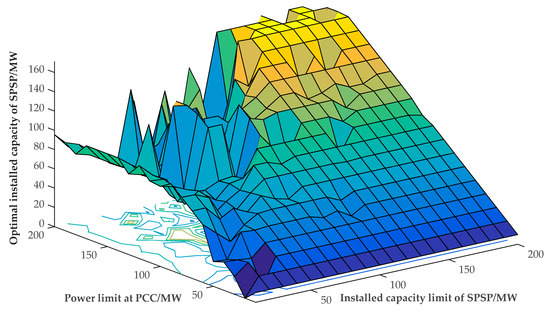
Figure 9.
The optimal capacity surface of SPSP on a typical day (β = 35%).
Figure 10 illustrates the optimal static revenue of the investment entity under different parameter settings. It increases with the increase of the installed capacity limit. Meanwhile, as the installed capacity limit reaches 120 MW, there are no longer any increases. Similarly, it almost has little to do with the power limit at PCC.
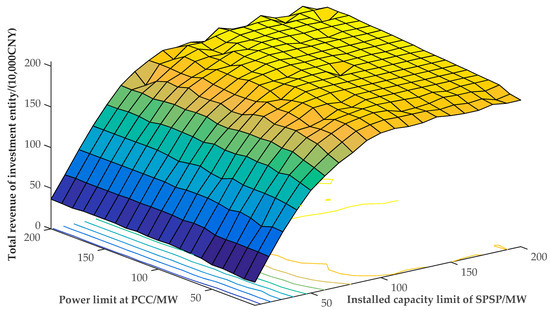
Figure 10.
Optimal static revenue of investment entity on a typical day (β = 35%).
Using the above method, in a particular scenario (e.g., power limit at PCC of 70 MW, fluctuation limit of 35%, installed capacity of 200 MW), all of the results of typical planning year is calculated, and Table 6 shows the recommended values.
Table 6.
Recommended values after applying SPSP in a particular scenario.
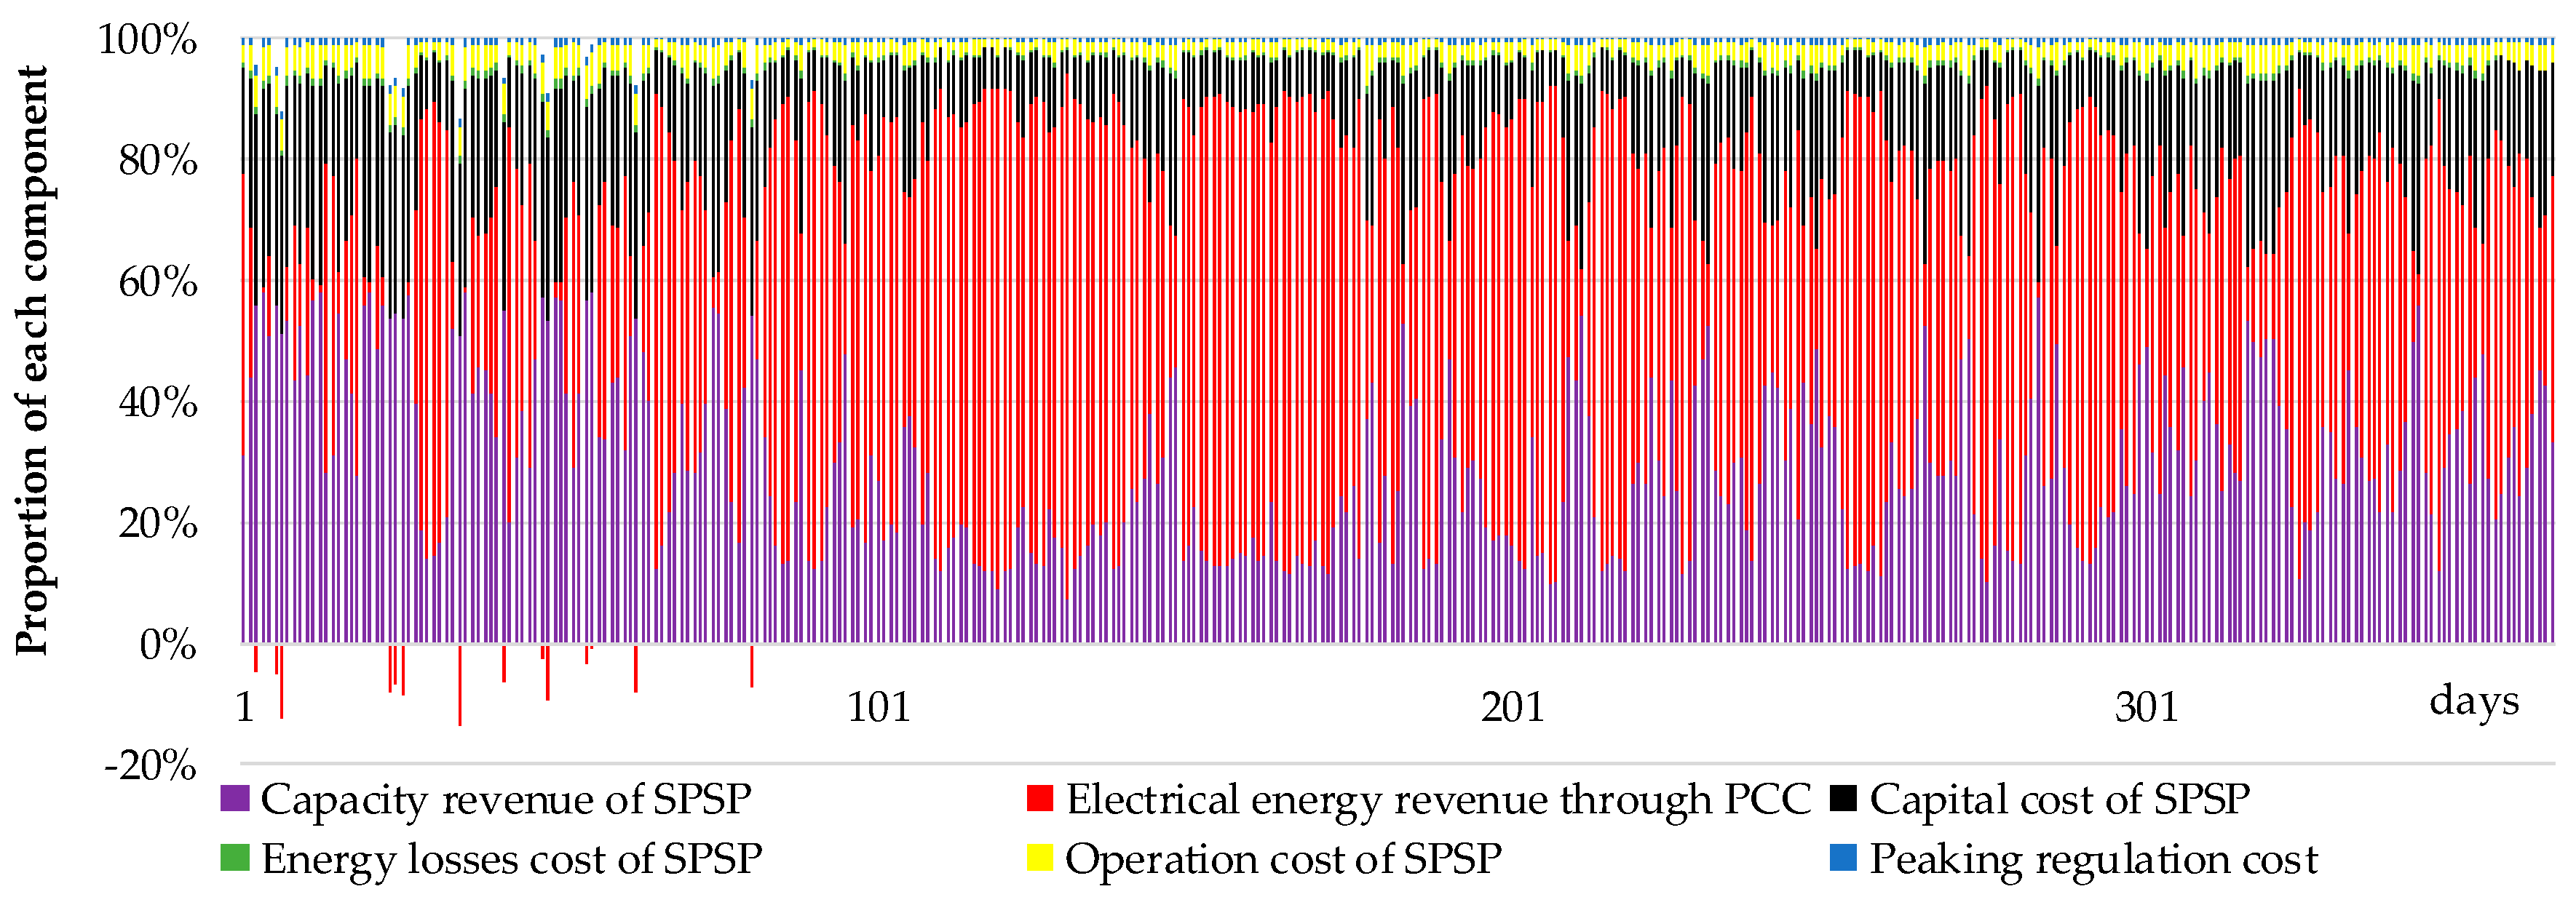
While setting the islanded microgrid as an investment entity, a comparison of the components of total revenue is shown in Figure 11.
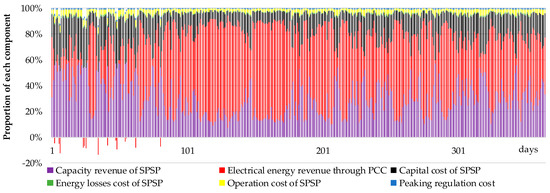
Figure 11.
Comparison of the components of total revenue in a typical planning year.
It can be seen that the installed capacity and electrical energy revenue accounts for the largest proportion of total revenue. Moreover, electrical energy revenue is the major variable revenue. It drives the SPSP participating in peaking regulation as much as possible: more pumping and generating is in demand. Price is a key factor. Meanwhile, the larger the price difference, the higher the total revenue. For example, there are two prices that are shown in Figure 6. The standard deviation for price A (0.53 CNY/kWh) is greater than B (0.25 CNY/kWh). If price B (red) is applied, then the final optimal sizing of SPSP is equal to zero, which means that the SPSP is uneconomical when the price is unfriendly. After changing the different limit settings, the optimal installed capacity and maximum revenue can be obtained under corresponding conditions, so the calculations will not be covered again here.
6. Conclusions
Based on the problem of offshore wind power accommodation, this paper analyzes the output characteristics of the offshore wind power of the southern coast in China. Simplified modeling of the SPSP with variable-speed units is presented for power optimization. Setting the maximum static revenue of the investment entity as the objective function, an optimal sizing method of SPSP is proposed by taking into account the power characteristics of variable-speed units and the smoothness constraints at PCC (e.g., power limit and fluctuation limit).
The simulation shows that the offshore wind power is extremely uneven, because it demonstrates a U-shaped distribution with high at both ends, but low in the middle. The optimal capacity of the SPSP is highly related to the maximum installed capacity limit and the power limit at PCC under the different fluctuation limit. Furthermore, the maximum static revenue, in most cases, is related not to the power limit at PCC but the installed capacity limit of SPSP. Additionally, as electrical energy revenue is the most important variable revenue, it is necessary to reasonably expand the installed capacity of SPSP, because of the scale effects of cost reduction. Meanwhile, by implementing the time-of-use tariffs with a high standard deviation, it has proved to be available and profitable. More pumping and generating is encouraged. A follow-up study of the grid structure of islanded microgrid is worthy of being considered in the future, as this paper does not draw sufficient attention to it.
Author Contributions
Conceptualization, W.Y. and C.D.; Formal analysis, W.Y., C.D., D.L., M.C., P.P. and H.Z.; Software, W.Y.; Funding acquisition, C.D., D.L., M.C., P.P., and H.Z. All of the authors revised the manuscript.
Funding
This research was funded by the National Key Research and Development Program of China (No. 2017YFB0903700, 2017YFB0903705).
Conflicts of Interest
The authors declare no conflict of interest.
Nomenclature (In Order of Appearance)
| capacity revenue of the SPSP (CNY) | |
| electrical energy revenue settled through PCC (incl. sales income and purchasing cost) (CNY) | |
| capital cost of the SPSP (CNY) | |
| energy losses cost of the SPSP (CNY) | |
| operating cost of the SPSP (CNY) | |
| peaking regulation cost of the SPSP (CNY) | |
| capacity tariff(price) of the SPSP (CNY/kW) | |
| time-of-use tariffs for generating at time t (CNY/kWh) | |
| time-of-use tariffs for pumping at time t (CNY/kWh) | |
| power at PCC at time t (positive or negative) (kW) | |
| output power of the SPSP at time t (positive or negative) (kW) | |
| output power of the SPSP at time t in turbine mode (kW) | |
| input power of the SPSP at time t in pump mode (kW) | |
| minimum and maximum output power of the SPSP at time t in turbine mode (kW) | |
| minimum and maximum input power of the SPSP at time t in pump mode (kW) | |
| installed capacity of the SPSP (kW) | |
| offshore wind power at time t (kW) | |
| predicted value of offshore wind power at time t (kW) | |
| actual load at time t (kW) | |
| peaking cost factor (CNY/kWh) | |
| boolean value (unitless) | |
| electrical energy of the upper reservoir at time t (kW) | |
| minimum and maximum electrical energy of the upper reservoir (MWh) | |
| electrical energy generated and consumed during a scheduling period (e.g., 24 h) (MWh) | |
| energy conversion efficiency of the SPSP in turbine and pump modes (unitless) | |
| life cycle, maximum service life (times) | |
| ramp rate of the variable-speed units at time t in turbine and pump mode (MW/h) | |
| maximum ramp rate of the variable-speed units at time t in turbine and pump mode (MW/h) | |
| density of seawater (1.05×10³ kg/m3) | |
| active head of gravity (9.81 m/s2) | |
| hydraulic head and pump head (m) | |
| hydraulic head and pump head (pu) | |
| turbine flow and pump flow (m3/s) | |
| turbine flow and pump flow (pu) | |
| mechanical speed (pu) | |
| relative deviation of mechanical speed (pu) | |
| reference power (pu) | |
| polynomial fitting coefficients (unitless) | |
| residual electrical energy rate of the upper reservoir at time t (MWh) | |
| minimum and maximum residual electrical energy rate of the upper reservoir (MWh) | |
| volume of upper reservoir at time t (m3) | |
| maximum volume of upper reservoir at time t (m3) | |
| fitting function of the sectional area about head (m2) | |
| energy loss rate (unitless) | |
| thermal stability power at PCC (associated with rated short-time withstand current) (kW) | |
| sample standard deviation of power at PCC (kW) | |
| evaluation index for power fluctuation at PCC (unitless) | |
| parameter values of σpcc (unitless) |
References
- Kook, K.; McKenzie, K.; Liu, Y.; Atcitty, S. A study on applications of energy storage for the wind power operation in power systems. In Proceedings of the IEEE PES General Meeting, Montreal, QC, Canada, 18–22 June 2006. [Google Scholar]
- Vatu, R.; Ceaki, O.; Mancasi, M.; Porumb, R.; Seritan, G. Power quality issues produced by embedded storage technologies in smart grid environment. In Proceedings of the 50th International Universities Power Engineering Conference (UPEC), Stoke on Trent, UK, 1–4 September 2015. [Google Scholar]
- Golovanov, N.; Lazaroiu, G.; Porumb, R. Wind generation assessment proposal by experimental harmonic and distortion factor analysis. In Proceedings of the 48th International Universities’ Power Engineering Conference (UPEC), Dublin, Ireland, 2–5 September 2013. [Google Scholar]
- Vatu, R.; Ceaki, O.; Golovanov, N.; Porumb, R.; Seritan, G. Analysis of storage technologies with smart grid framework. In Proceedings of the 49th International Universities Power Engineering Conference (UPEC), Cluj-Napoca, Romania, 2–5 September 2014. [Google Scholar]
- Akhil, A.; Huff, G.; Currier, A.; Kaun, B.; Rastler, D.; Chen, S.; Cotter, A.; Bradshaw, D.; Gauntlett, W. DOE/EPRI 2013 Electricity Storage Handbook in Collaboration with NRECA. Sandia National Lab; Report SAND2013-5131; 2013. Available online: https://www.sandia.gov/ess-ssl/publications/SAND2013-5131.pdf (accessed on 14 March 2019).
- McLean, E.; Kearney, D. An evaluation of seawater pumped hydro storage for regulating the export of renewable energy to the national grid. Energy Procedia 2014, 46, 152–160. [Google Scholar] [CrossRef]
- Karampelas, K.; Ekonomu, L. Electricity Distribution-Intelligent Solutions for Electricity Transmission and Distribution Networks, 1st ed.; Springer: Berlin, Germany, 2016; pp. 27–61. [Google Scholar]
- Xu, F.; Chen, L.; Jin, H.; Liu, Z. Modeling and application analysis of optimal joint operation of pumped storage power station and wind power. Autom. Electr. Power Syst. 2013, 37, 149–154. [Google Scholar]
- Jiang, R.; Wang, J.; Guan, Y. Robust unit commitment with wind power and pumped storage hydro. IEEE Trans. Power Syst. 2012, 27, 800–810. [Google Scholar] [CrossRef]
- Gill, S.; Ault, G.; Kockar, I. The optimal operation of energy storage in a wind power curtailment scheme. In Proceedings of the IEEE PES General Meeting, San Diego, CA, USA, 22–26 July 2012. [Google Scholar]
- Pan, W.; Fan, Y.; Zhu, L.; Gao, A. The optimal sizing for pumped storage system in wind farm. Trans. China Electrotech. Soc. 2008, 23, 120–124. [Google Scholar]
- Katsaprakakis, D.; Christakis, D.; Stefanakis, I.; Spanos, P.; Stefanakis, N. Technical details regarding the design, the construction and the operation of seawater pumped storage system. Energy 2013, 55, 619–630. [Google Scholar] [CrossRef]
- Zhang, D.; Zhang, X.; He, J.; Chai, Q. Offshore wind energy development in China: Current status and future perspective. Renew. Sustain. Energy Rev. 2011, 15, 4673–4684. [Google Scholar] [CrossRef]
- Portero, U.; Velázquez, S.; Carta, J. Sizing of a wind-hydro system using a reversible hydraulic facility with seawater. A case study in the Canary Islands. Energy Convers. Manag. 2015, 106, 1251–1263. [Google Scholar] [CrossRef]
- Suul, J.; Uhlen, K.; Undeland, T. Variable speed pumped storage hydropower for integration of wind energy in isolated grids-case description and control strategies. In Proceedings of the IEEE International Conference on Sustainable Energy Technologies, Espoo, Finland, 24–27 November 2008. [Google Scholar]
- Zhu, S.; Zhang, Y.; Chowdhury, A. Capacity credit of wind generation based on minimum resource adequacy procurement. IEEE Trans. Ind. Appl. 2012, 48, 730–735. [Google Scholar] [CrossRef]
- Fujihara, T.; Imano, H.; Oshima, K. Development of Pump Turbine for Seawater Pumped Storage Power Plant. Hitachi Rev. 1998, 47, 199–202. [Google Scholar]
- Rehman, S.; Al-Hadhrami, L.; Alam, M. Pumped hydro energy storage system: A technological review. Renew. Sust. Energy Rev. 2015, 44, 586–598. [Google Scholar] [CrossRef]
- Geth, F.; Brijs, T.; Kathan, J.; Driesen, J.; Belmans, R. An overview of large-scale stationary electricity storage plants in Europe: Current status and new developments. Renew. Sust. Energy Rev. 2015, 52, 1212–1227. [Google Scholar] [CrossRef]
- Pina, A.; Ioakimidis, C.; Ferrão, P. Economic modeling of a seawater pumped-storage system in the context of São Miguel. In Proceedings of the IEEE International Conference on Sustainable Energy Technologies, Singapore, 24–27 November 2008. [Google Scholar]
- Xu, Q.; Kang, C.; Zhang, N.; Fan, Y.; Zhu, H. A discussion on offshore wind power output characteristics and its accommodation. Autom. Electr. Power Syst. 2011, 35, 54–59. [Google Scholar]
- Ioakimidis, C.; Genikomsakis, K. Integration of Seawater Pumped-Storage in the Energy System of the Island of São Miguel (Azores). Sustainability 2018, 10, 3438. [Google Scholar] [CrossRef]
- Sinden, G. Characteristics of the UK wind resource: Long-term patterns and relationship to electricity demand. Energy Policy 2007, 35, 112–127. [Google Scholar] [CrossRef]
- Castronuovo, E.; Lopes, J. On the optimization of the daily operation of a wind-hydro power plant. IEEE Trans. Power Syst. 2004, 19, 1599–1606. [Google Scholar] [CrossRef]
- Tewari, S.; Mohan, N. Value of NAS Energy Storage toward Integrating Wind: Results from the Wind to Battery Project. IEEE Trans. Power Syst. 2013, 532–541. [Google Scholar] [CrossRef]
- Muljadi, E.; Singh, M.; Gevorgian, V.; Mohanpurkar, M.; Hovsapian, R.; Koritarov, V. Dynamic modeling of adjustable-speed pumped storage hydropower plant. In Proceedings of the IEEE PES General Meeting, Denver, CO, USA, 26–30 July 2015. [Google Scholar]
- Koritarov, V.; Guzowski, L.; Feltes, J.; Kazachkov, Y.; Gong, B.; Trouille, B.; Donalek, P. Modeling Adjustable Speed Pumped Storage Hydro Units Employing Doubly-Fed Induction Machines; Report ANL/DIS-13/06; Argonne National Lab: Lemont, IL, USA, 2013. Available online: https://ceeesa.es.anl.gov/projects/psh/ANL_DIS-13_06_Modeling_AS_PSH.pdf (accessed on 26 February 2019).
- Liang, J.; Harley, R. Pumped storage hydro-plant models for system transient and long-term dynamic studies. In Proceedings of the IEEE PES General Meeting, Providence, RI, USA, 25–29 July 2010. [Google Scholar]
- Scherer, L.; Pfister, S. Global water footprint assessment of hydropower. Renew. Energy 2016, 99, 711–720. [Google Scholar] [CrossRef]
- Kuwabara, T.; Shibuya, A.; Furuta, H.; Kita, E.; Mitsuhashi, K. Design and dynamic response characteristics of 400 MW adjustable speed pumped storage unit for Ohkawachi power station. IEEE Trans. Energy Convers. 1996, 11, 376–384. [Google Scholar] [CrossRef]
- Sivakumar, N.; Das, D.; Padhy, N. Variable speed operation of reversible pump-turbines at Kadamparai pumped storage plant-A case study. Energy Convers. Manag. 2014, 78, 96–104. [Google Scholar] [CrossRef]
- He, Y.; Hu, J.; Yan, Z.; Shang, J. Compensation mechanism for ancillary service cost of grid-integration of large-scale wind farms. Power Syst. Technol. 2013, 37, 3552–3557. [Google Scholar]
- Juan, I.; Alejandro, P.; José, R. Optimal short-term operation and sizing of pumped-storage power plants in systems with high penetration of wind energy. In Proceedings of the 7th International Conference on the European Energy Market (EMM), Madrid, Spain, 23–25 June 2010. [Google Scholar]


© 2019 by the authors. Licensee MDPI, Basel, Switzerland. This article is an open access article distributed under the terms and conditions of the Creative Commons Attribution (CC BY) license (http://creativecommons.org/licenses/by/4.0/).