Projection of Wind Energy Potential over Northern China Using a Regional Climate Model

Abstract
:1. Introduction
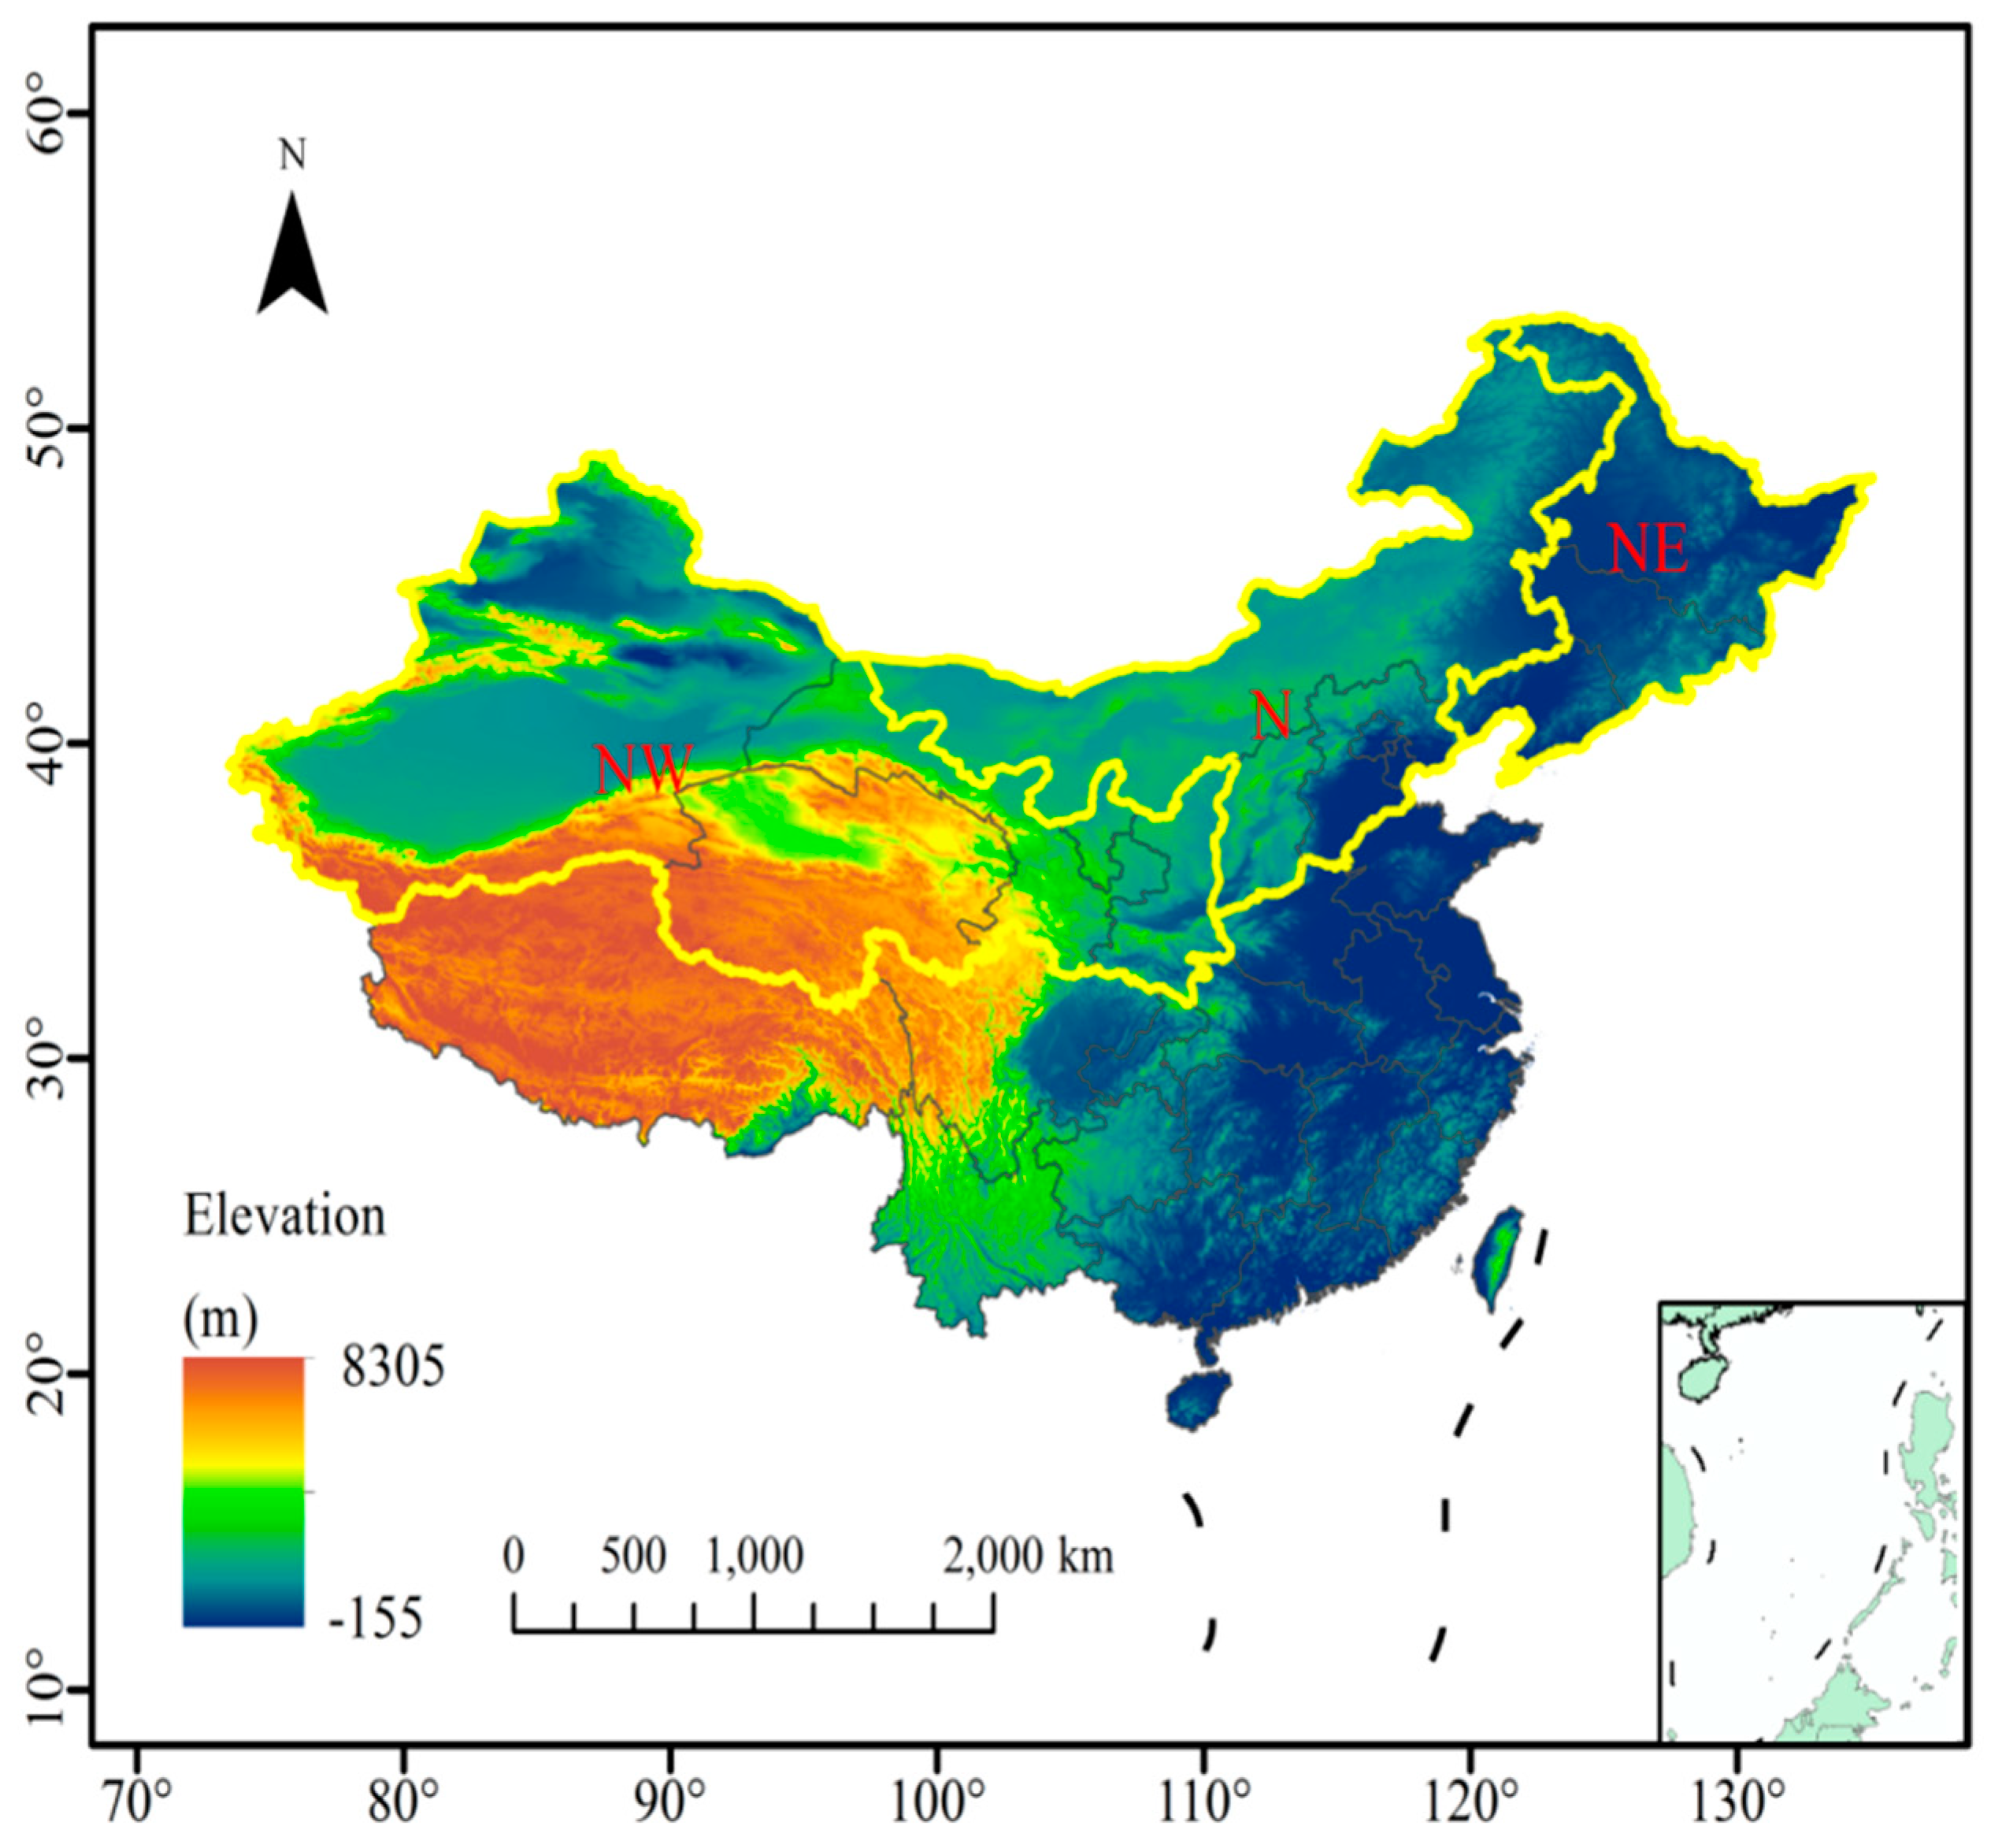
2. Study Domain
3. Data and Methods
3.1. Data
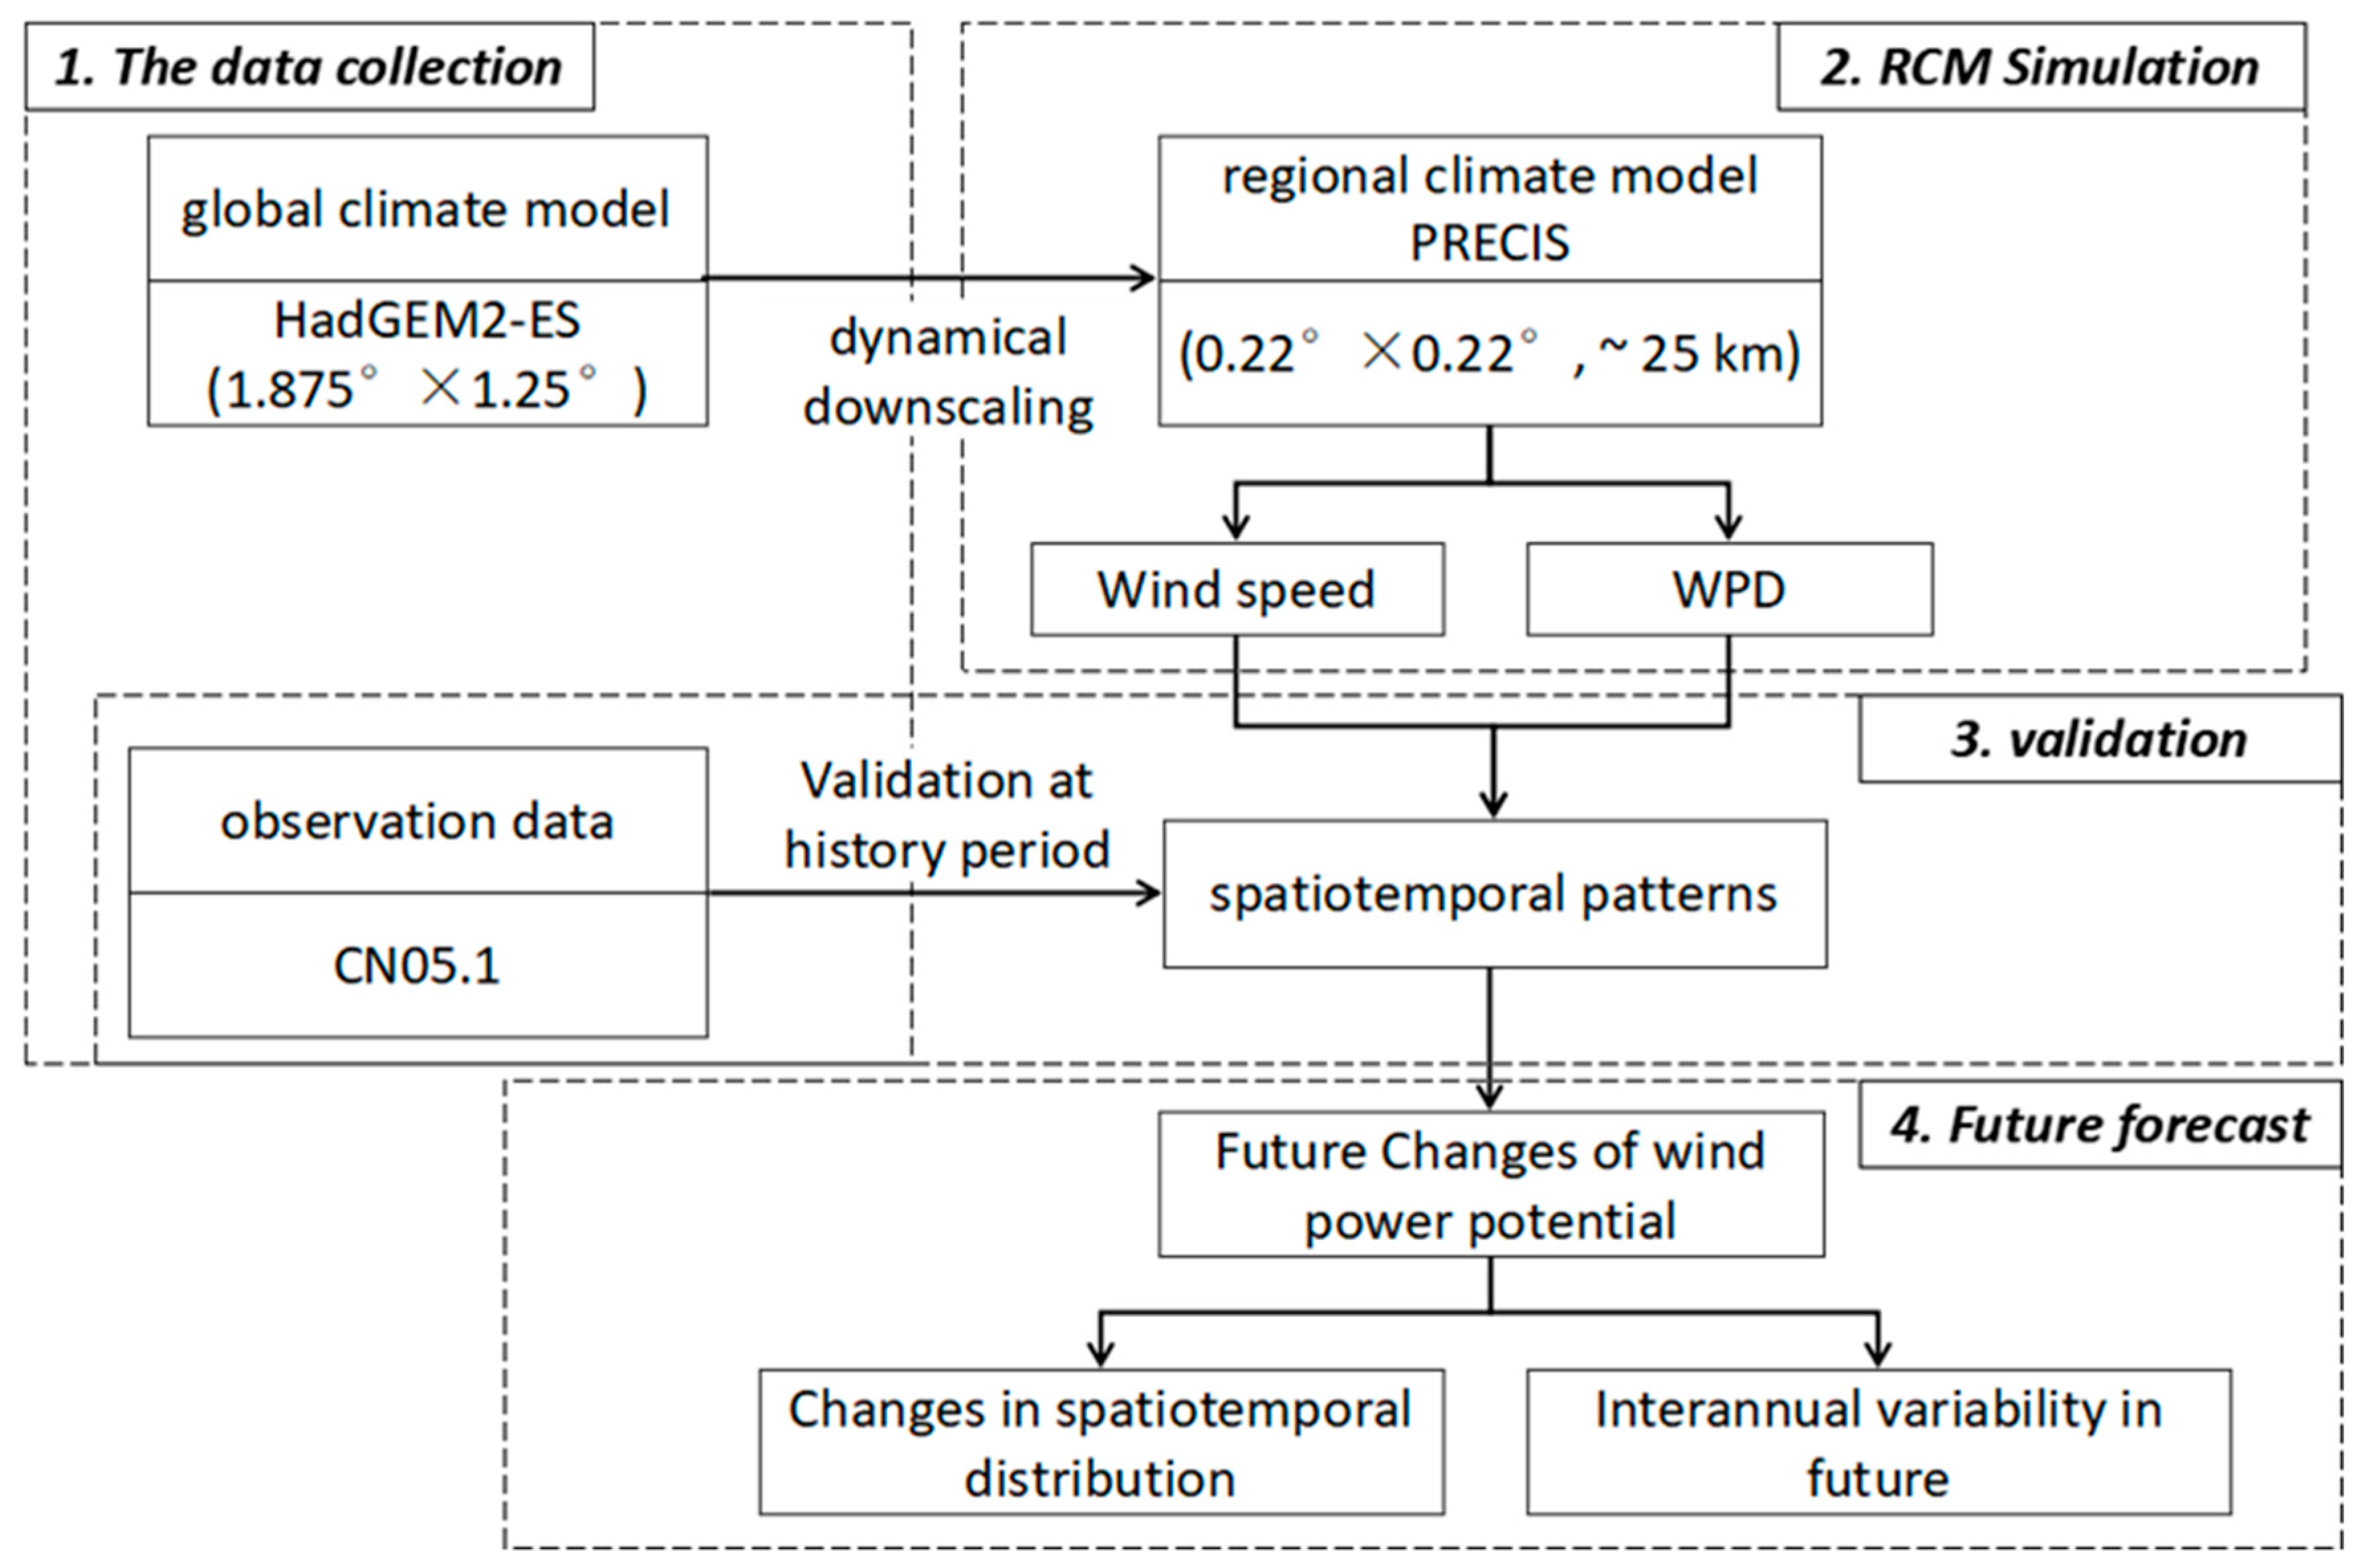
3.2. Methods
3.2.1. Wind Speed at Hub-Height
3.2.2. Wind Power Density (WPD)
3.2.3. Statistical Analysis Methods
4. Result
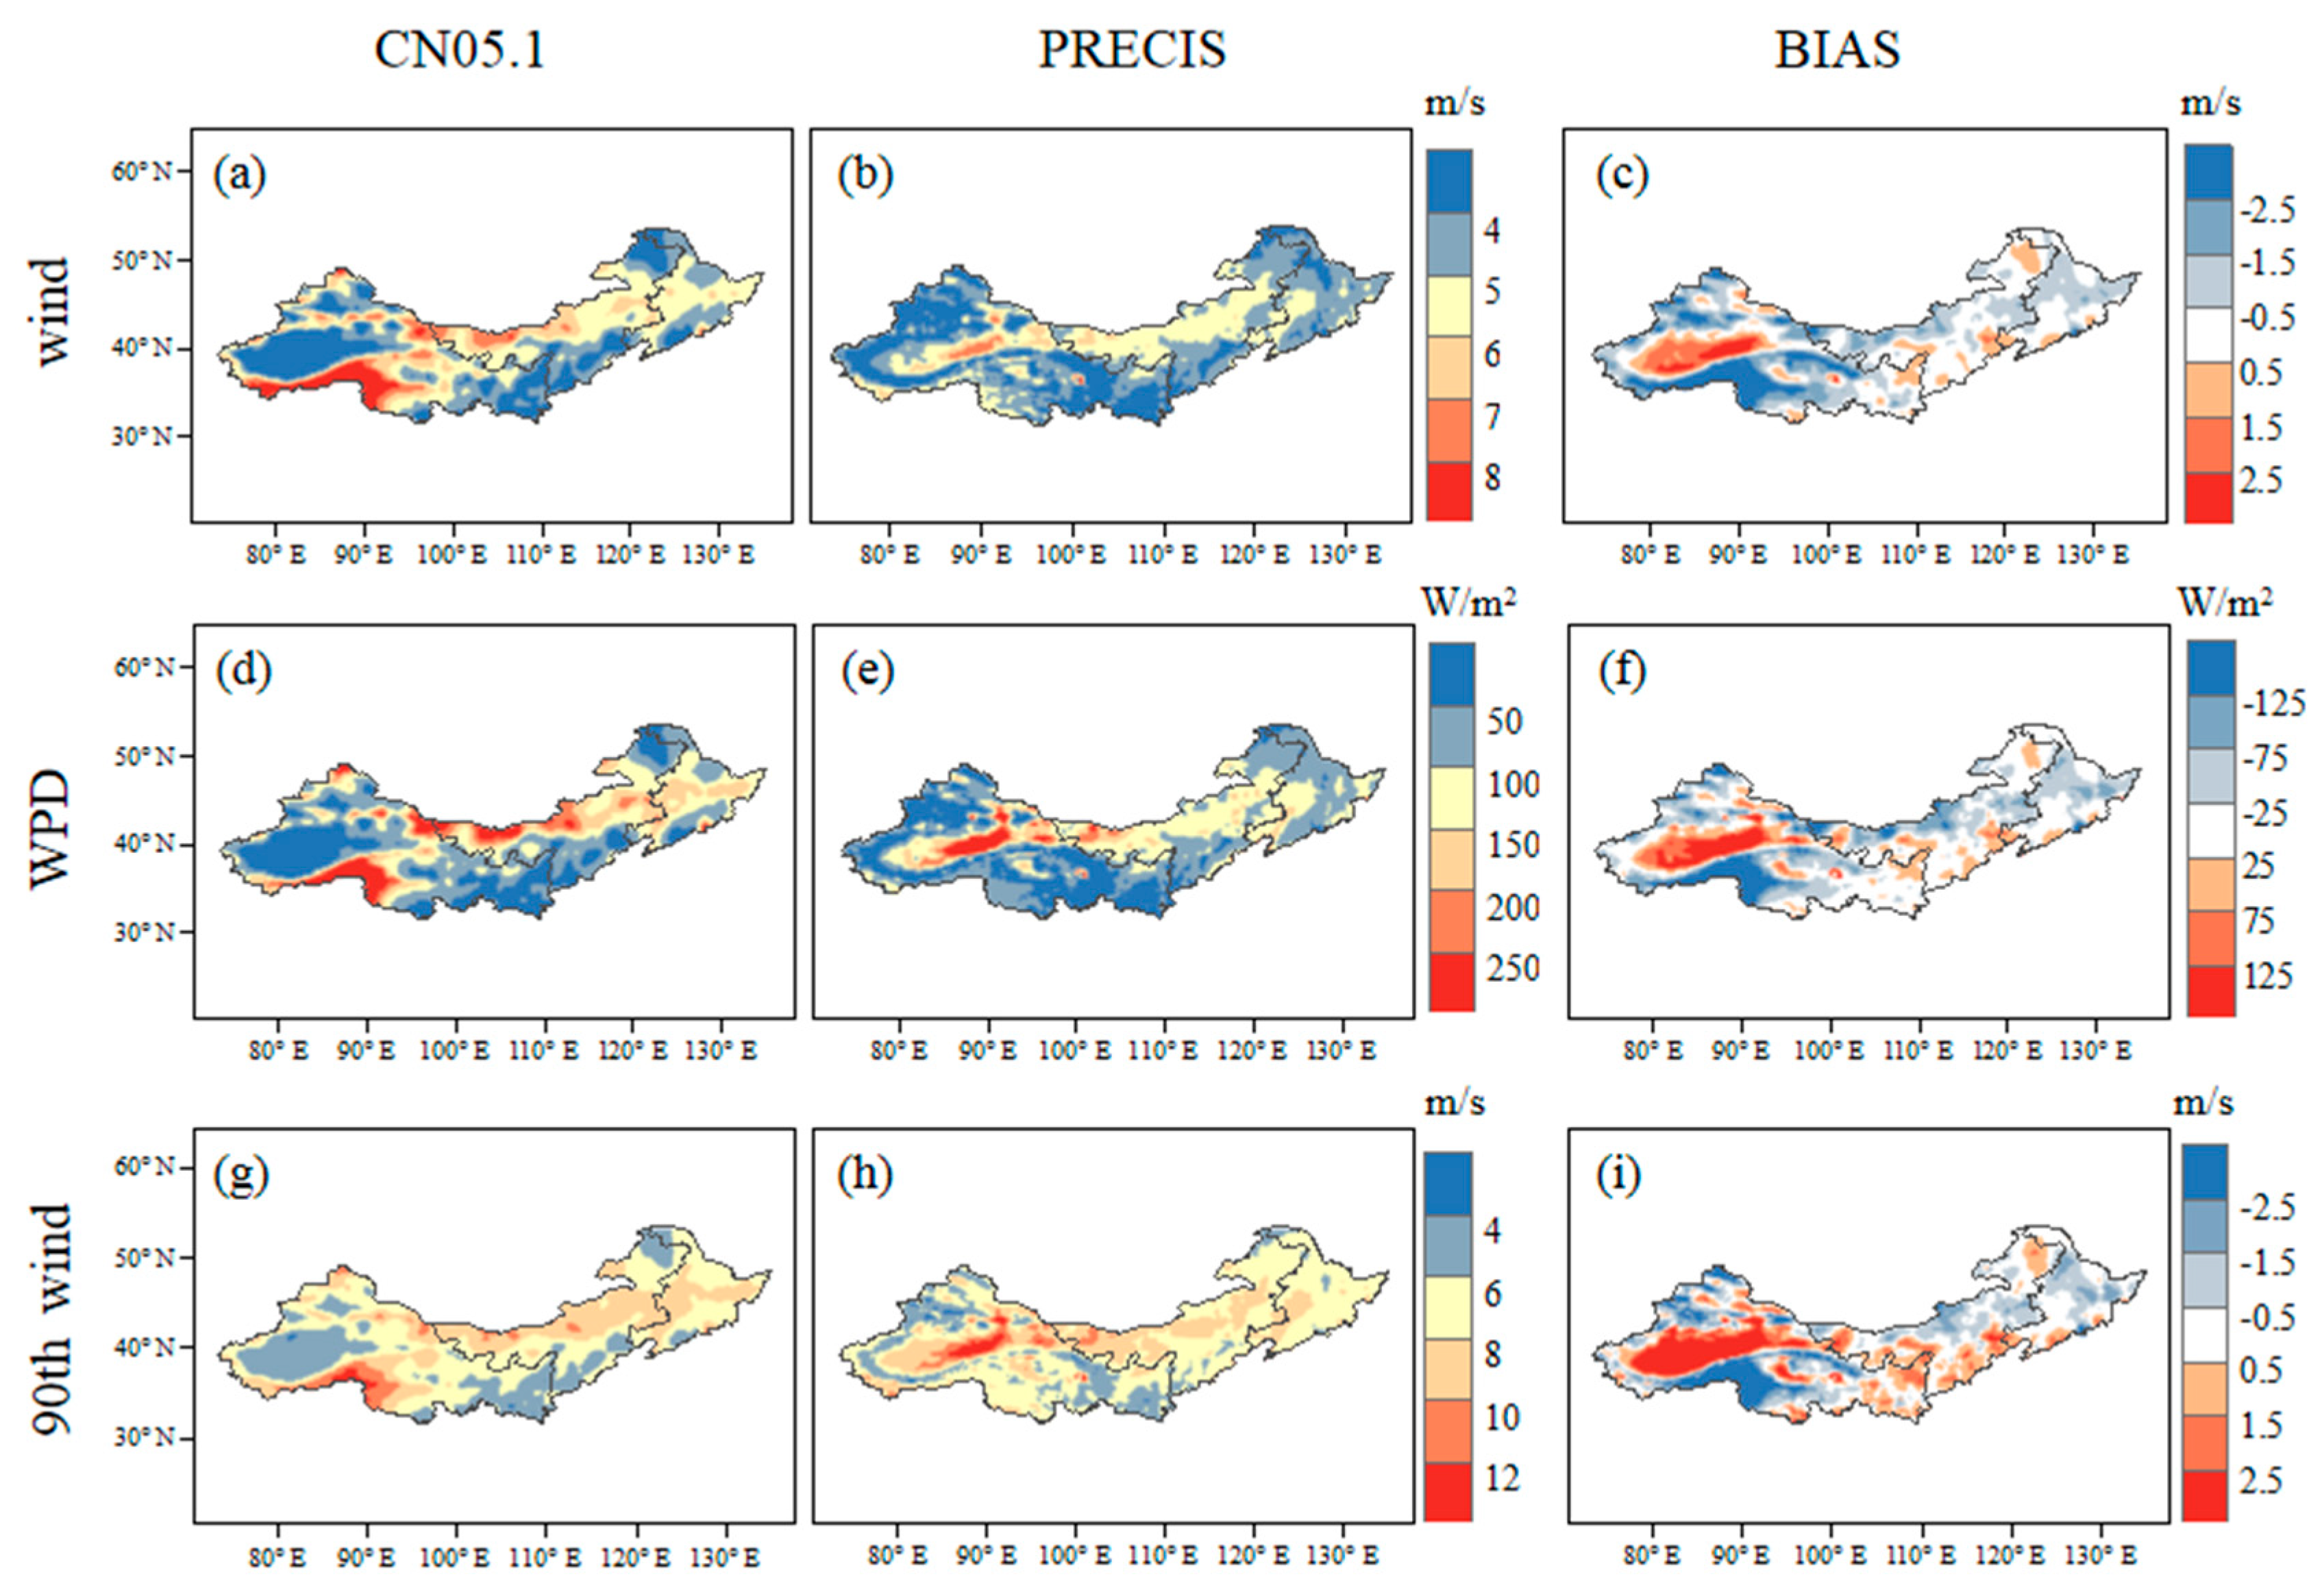
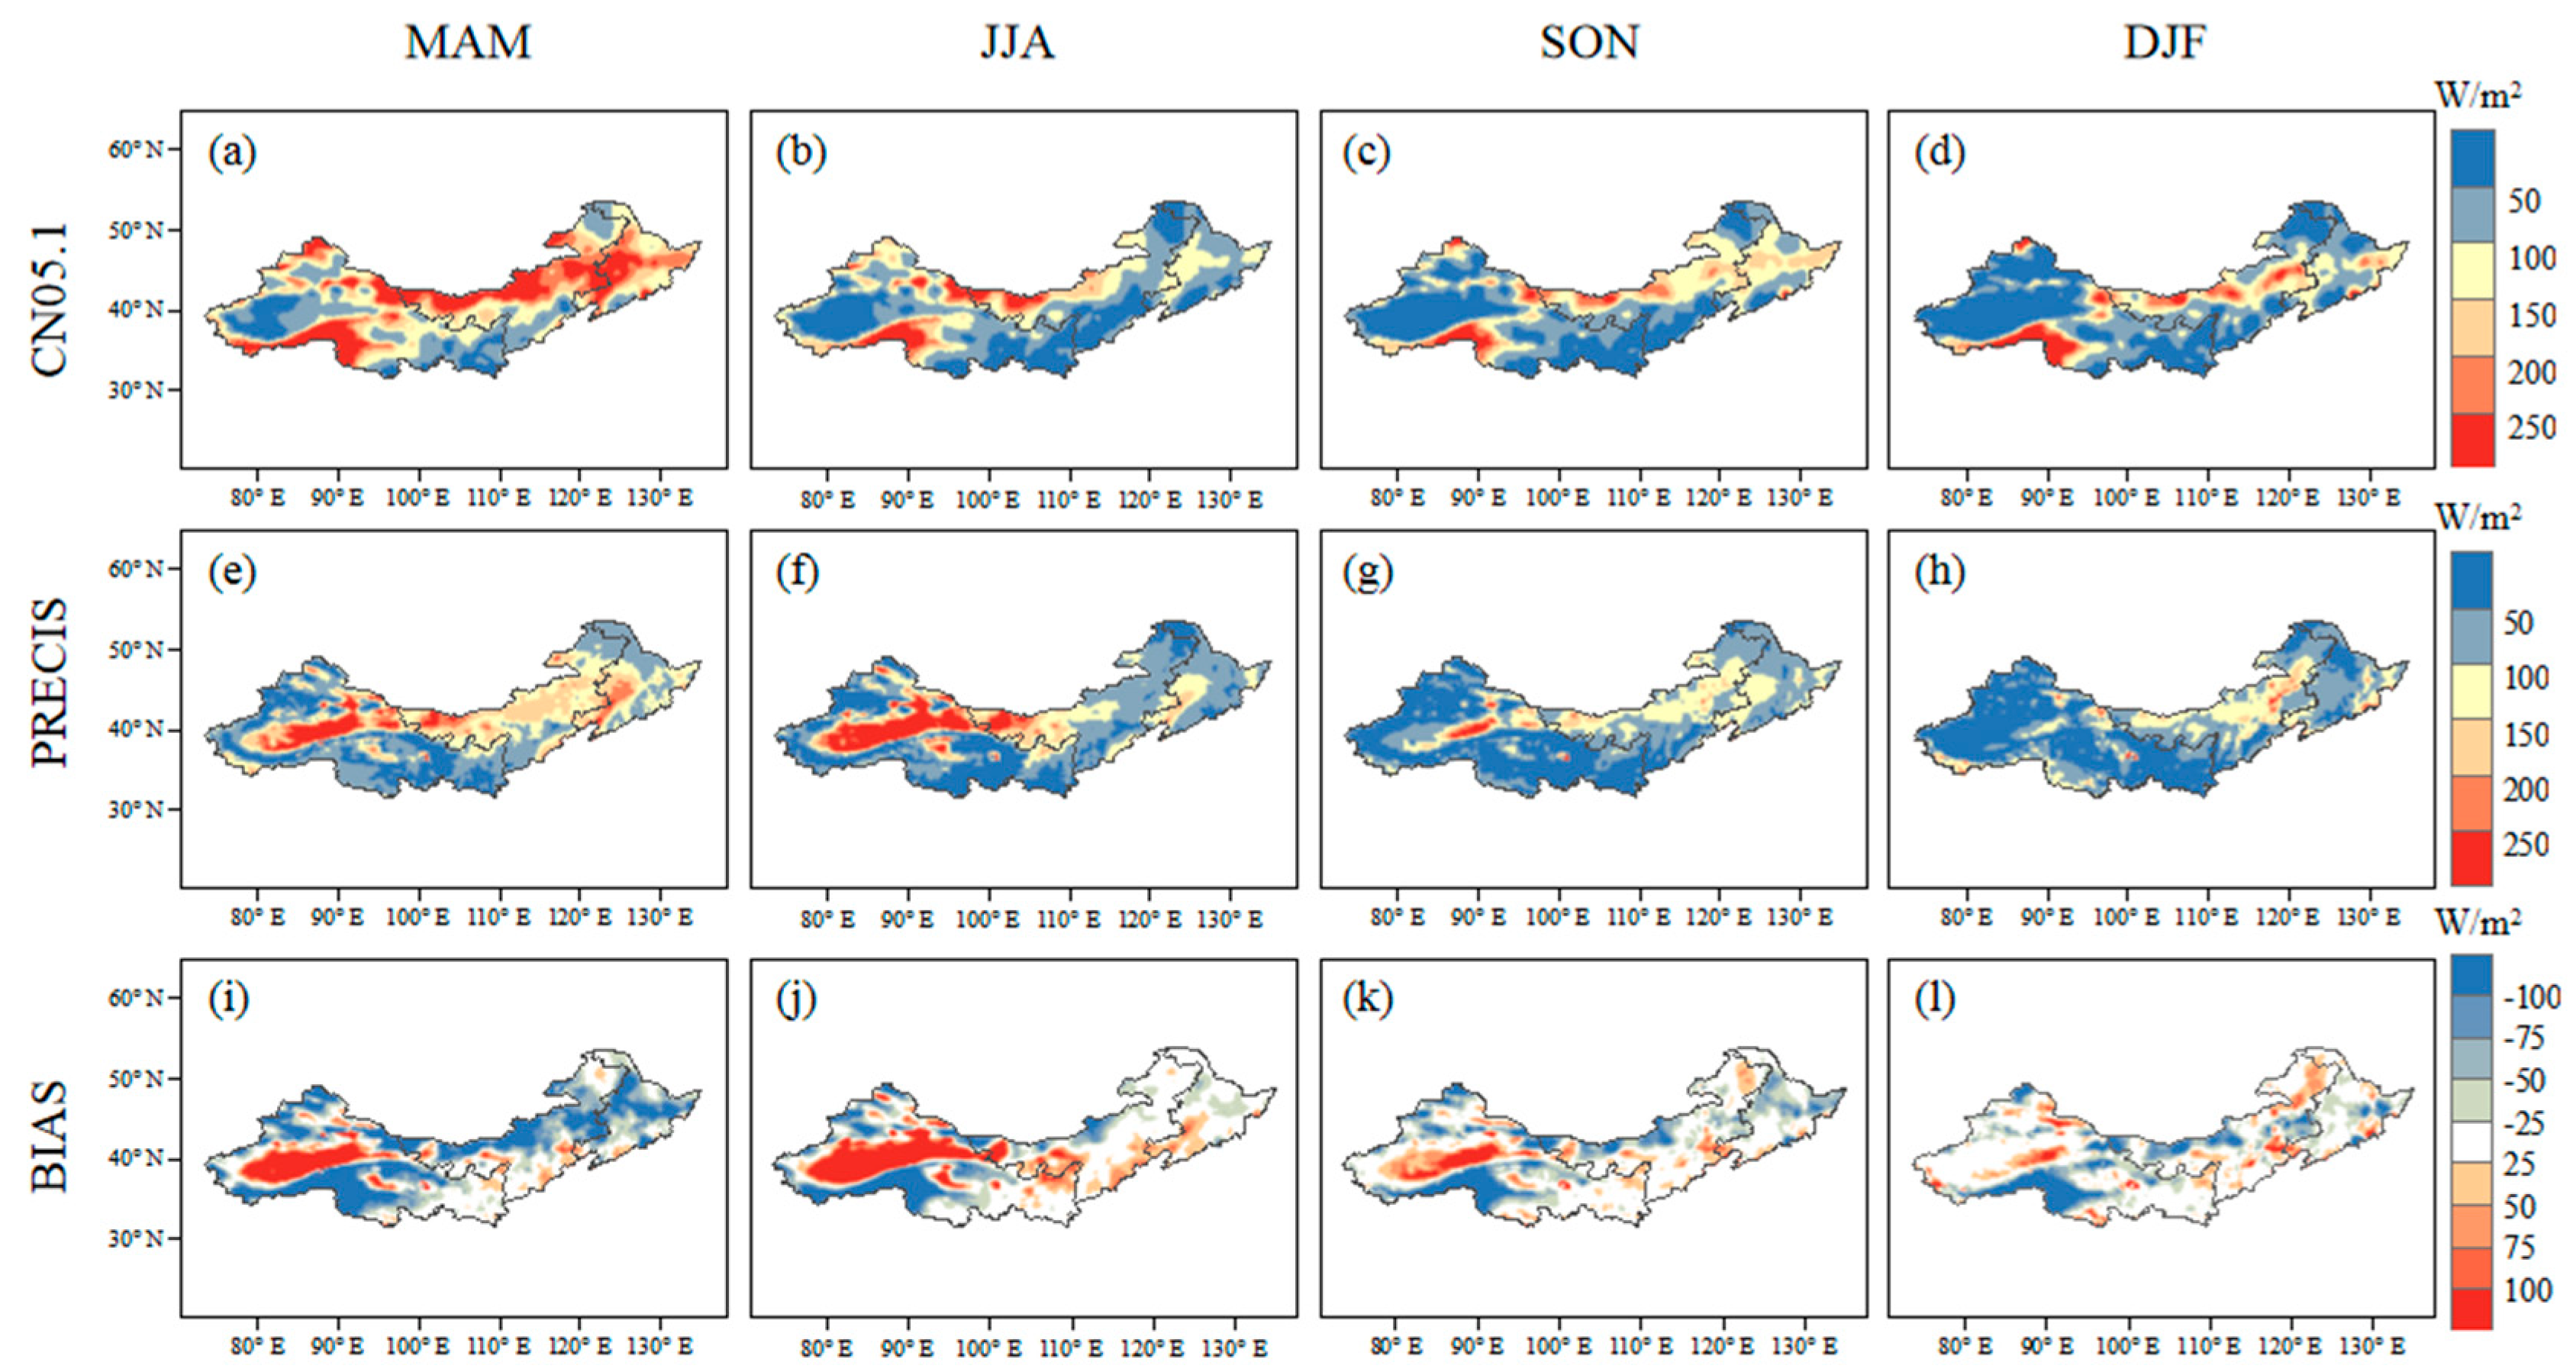
4.1. Historical Period
4.2. Future Changes of Wind Power Potential
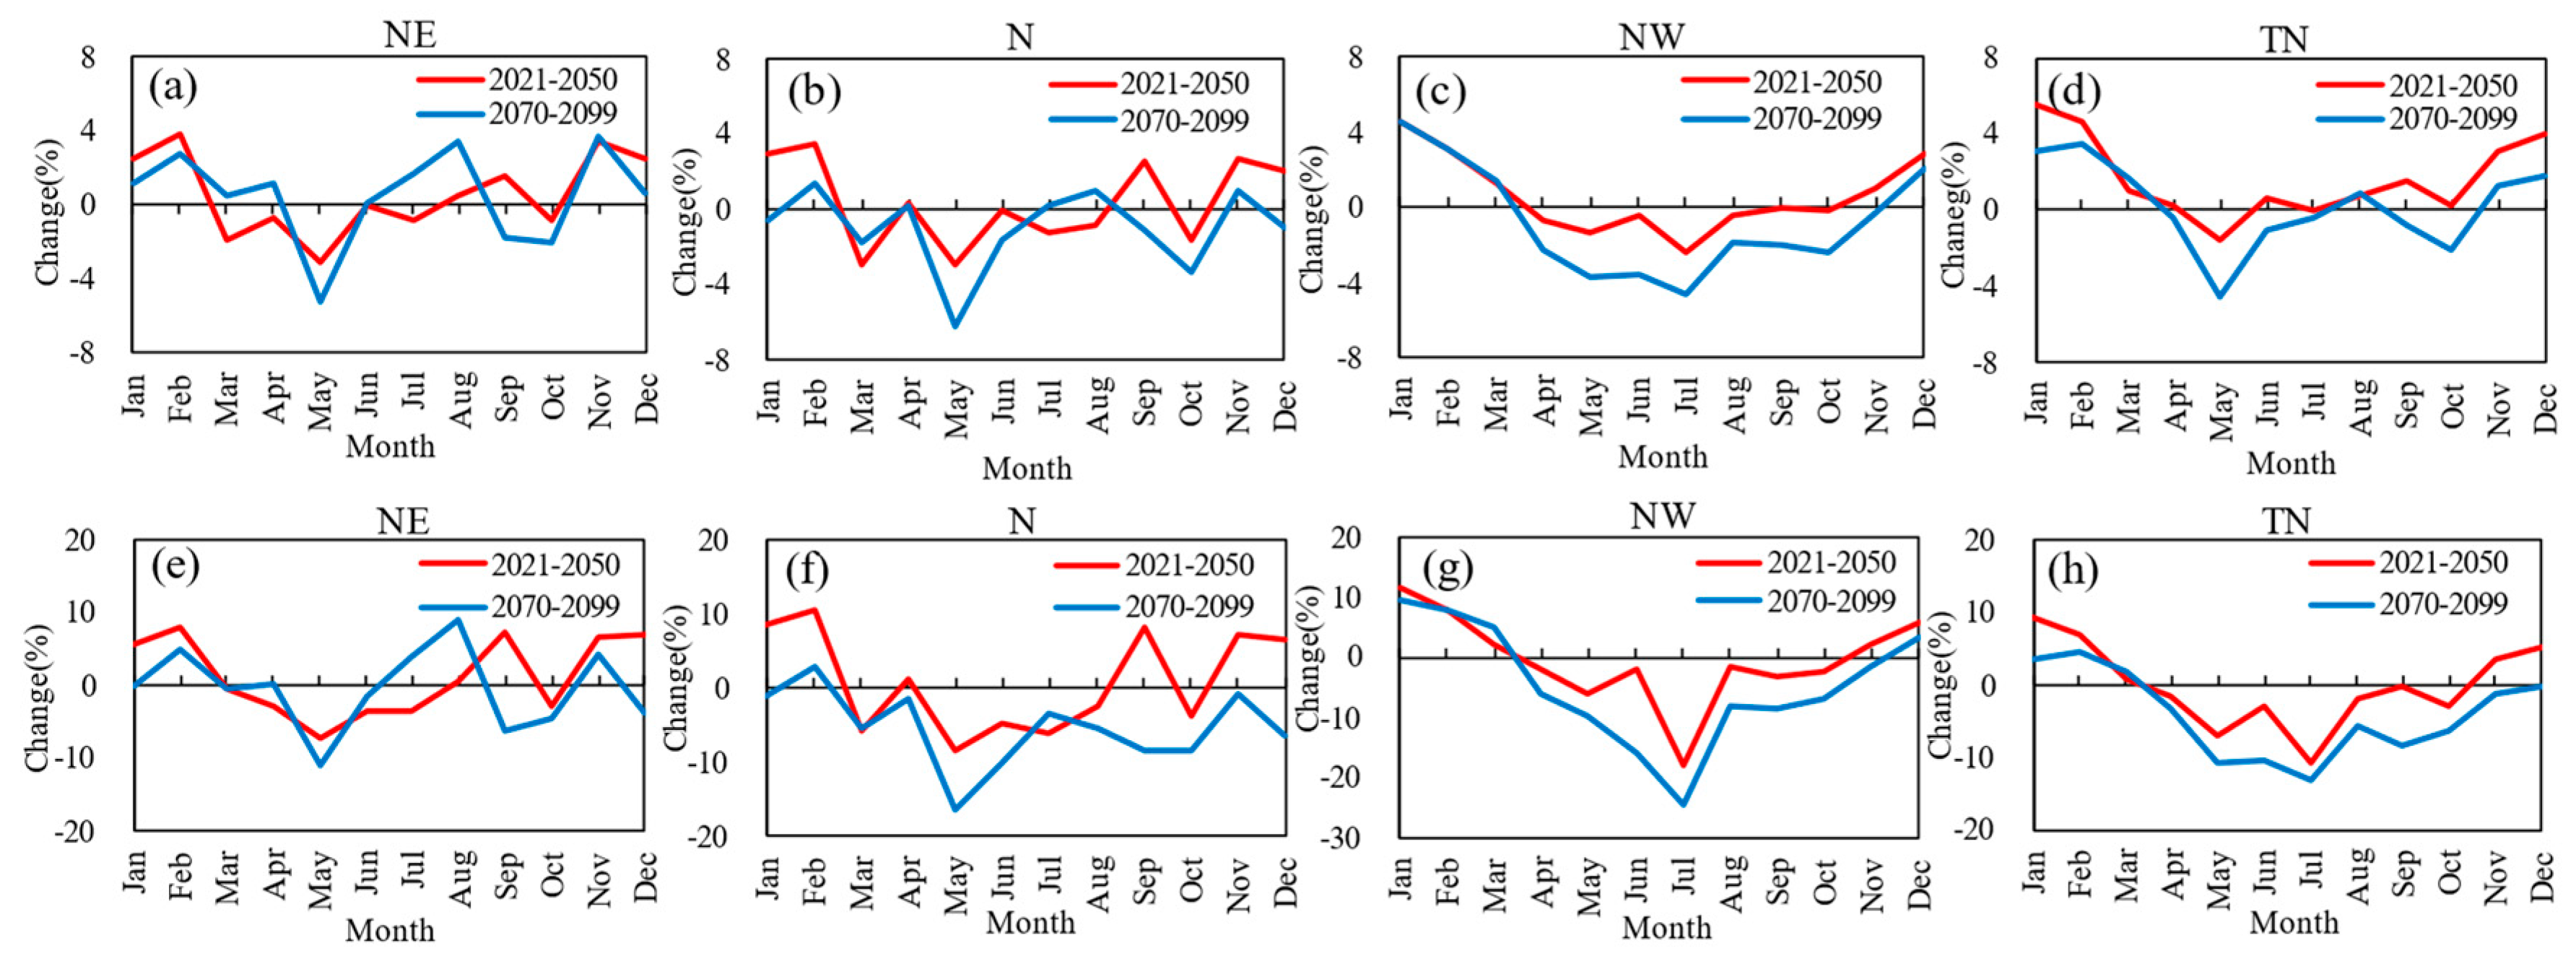
4.2.1. Changes in Annual Cycle
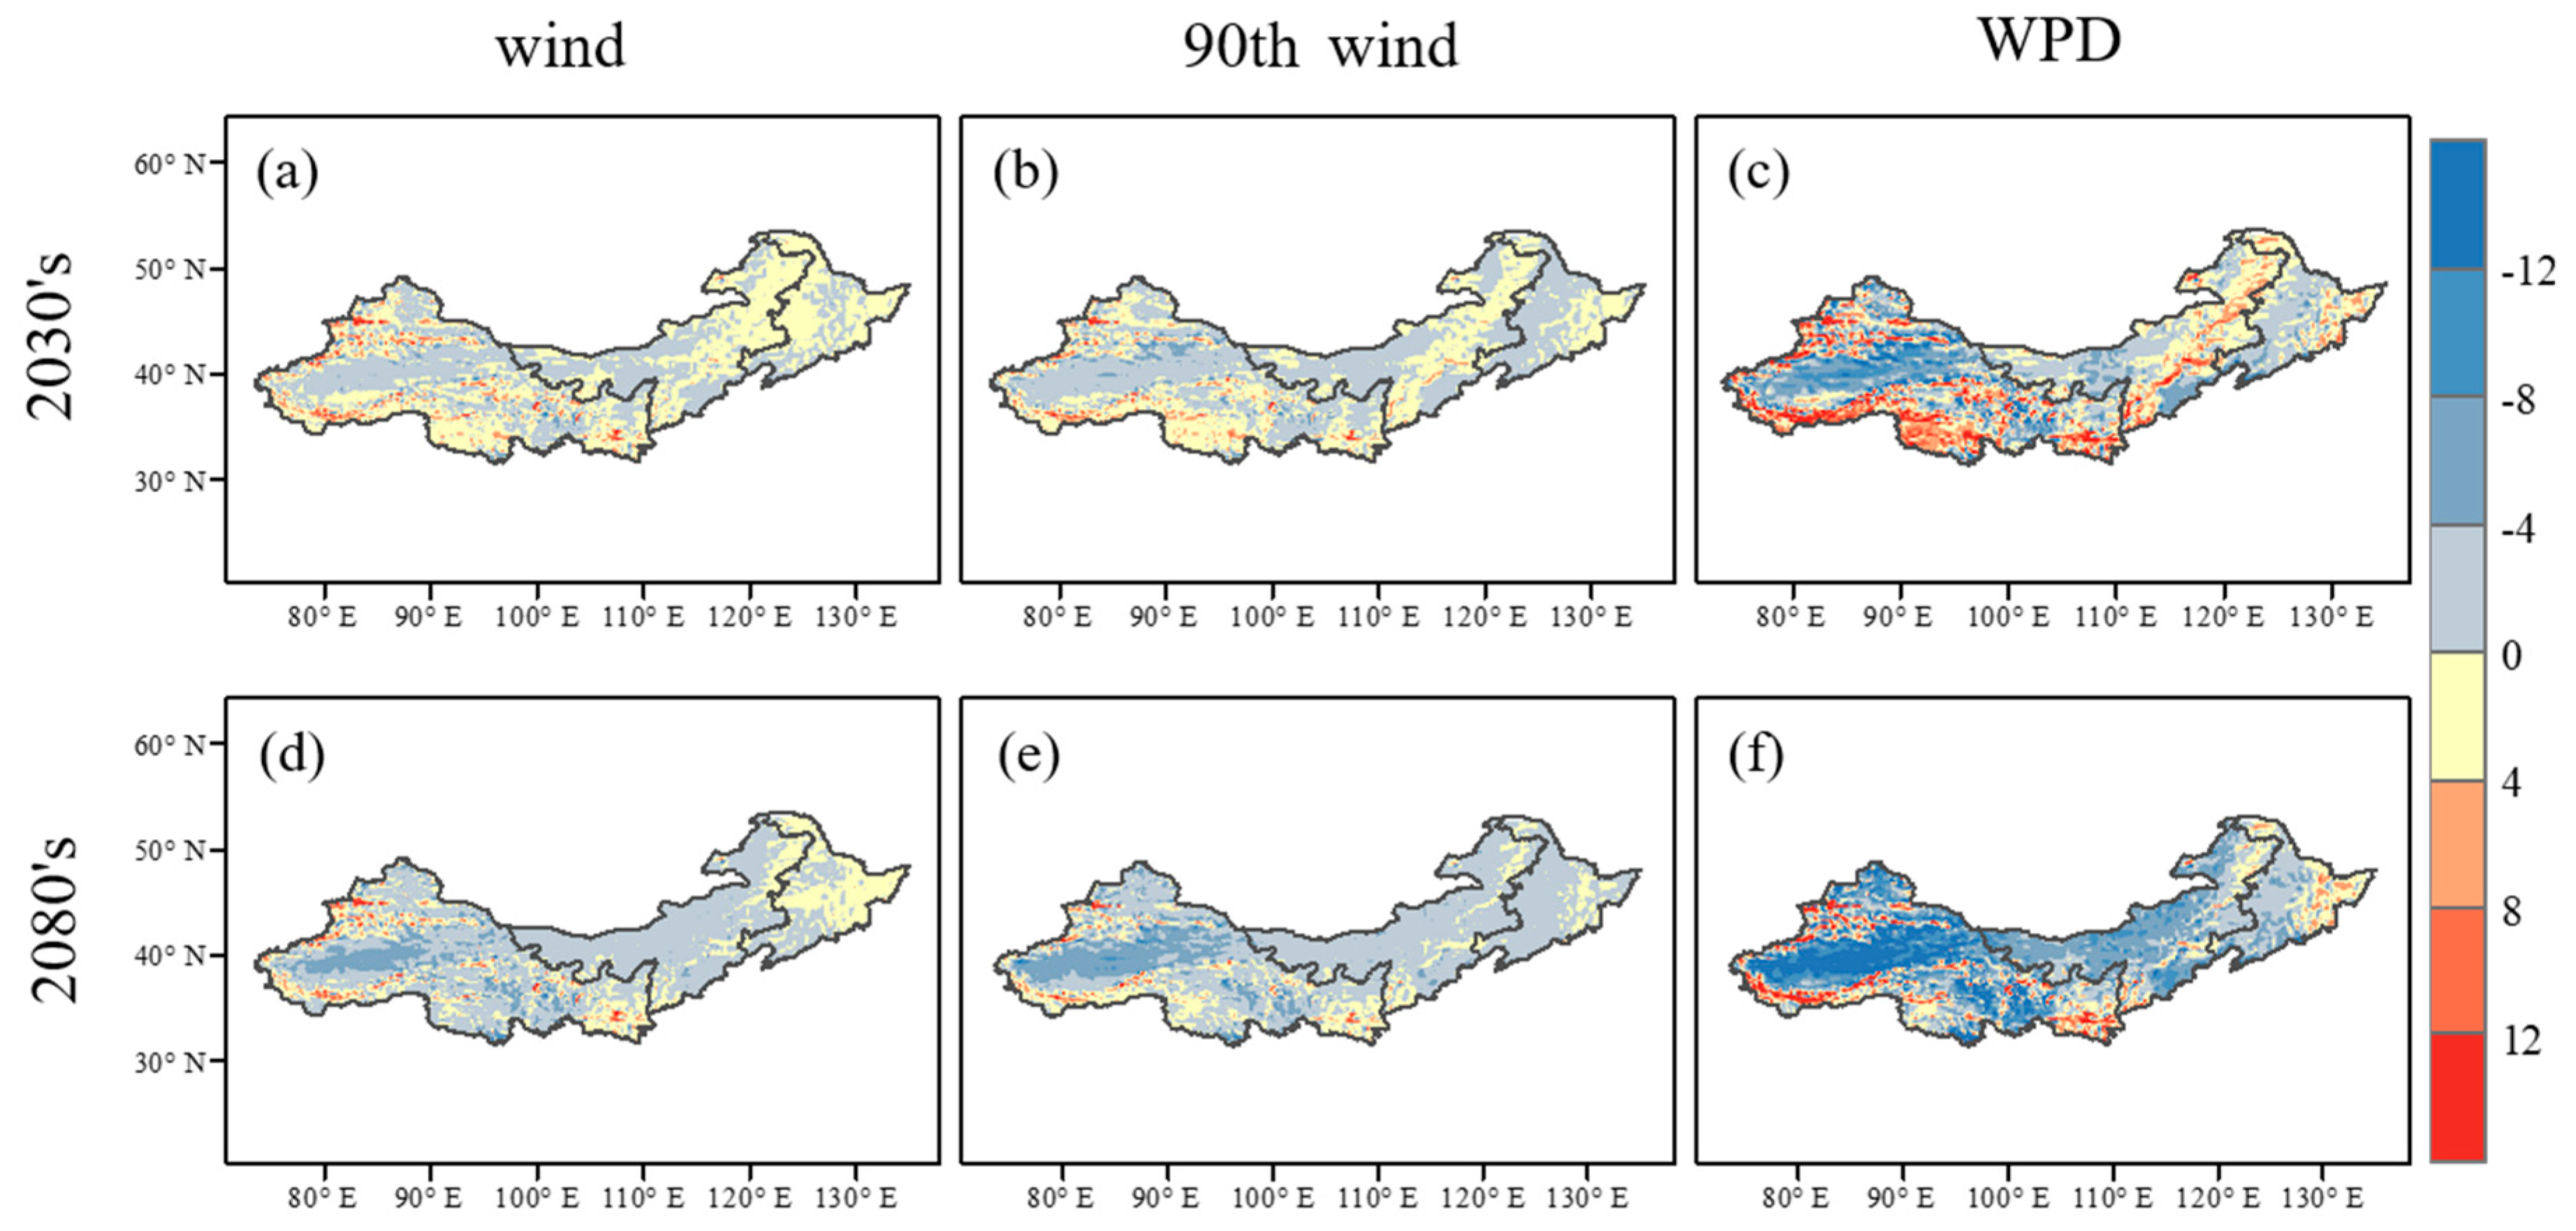
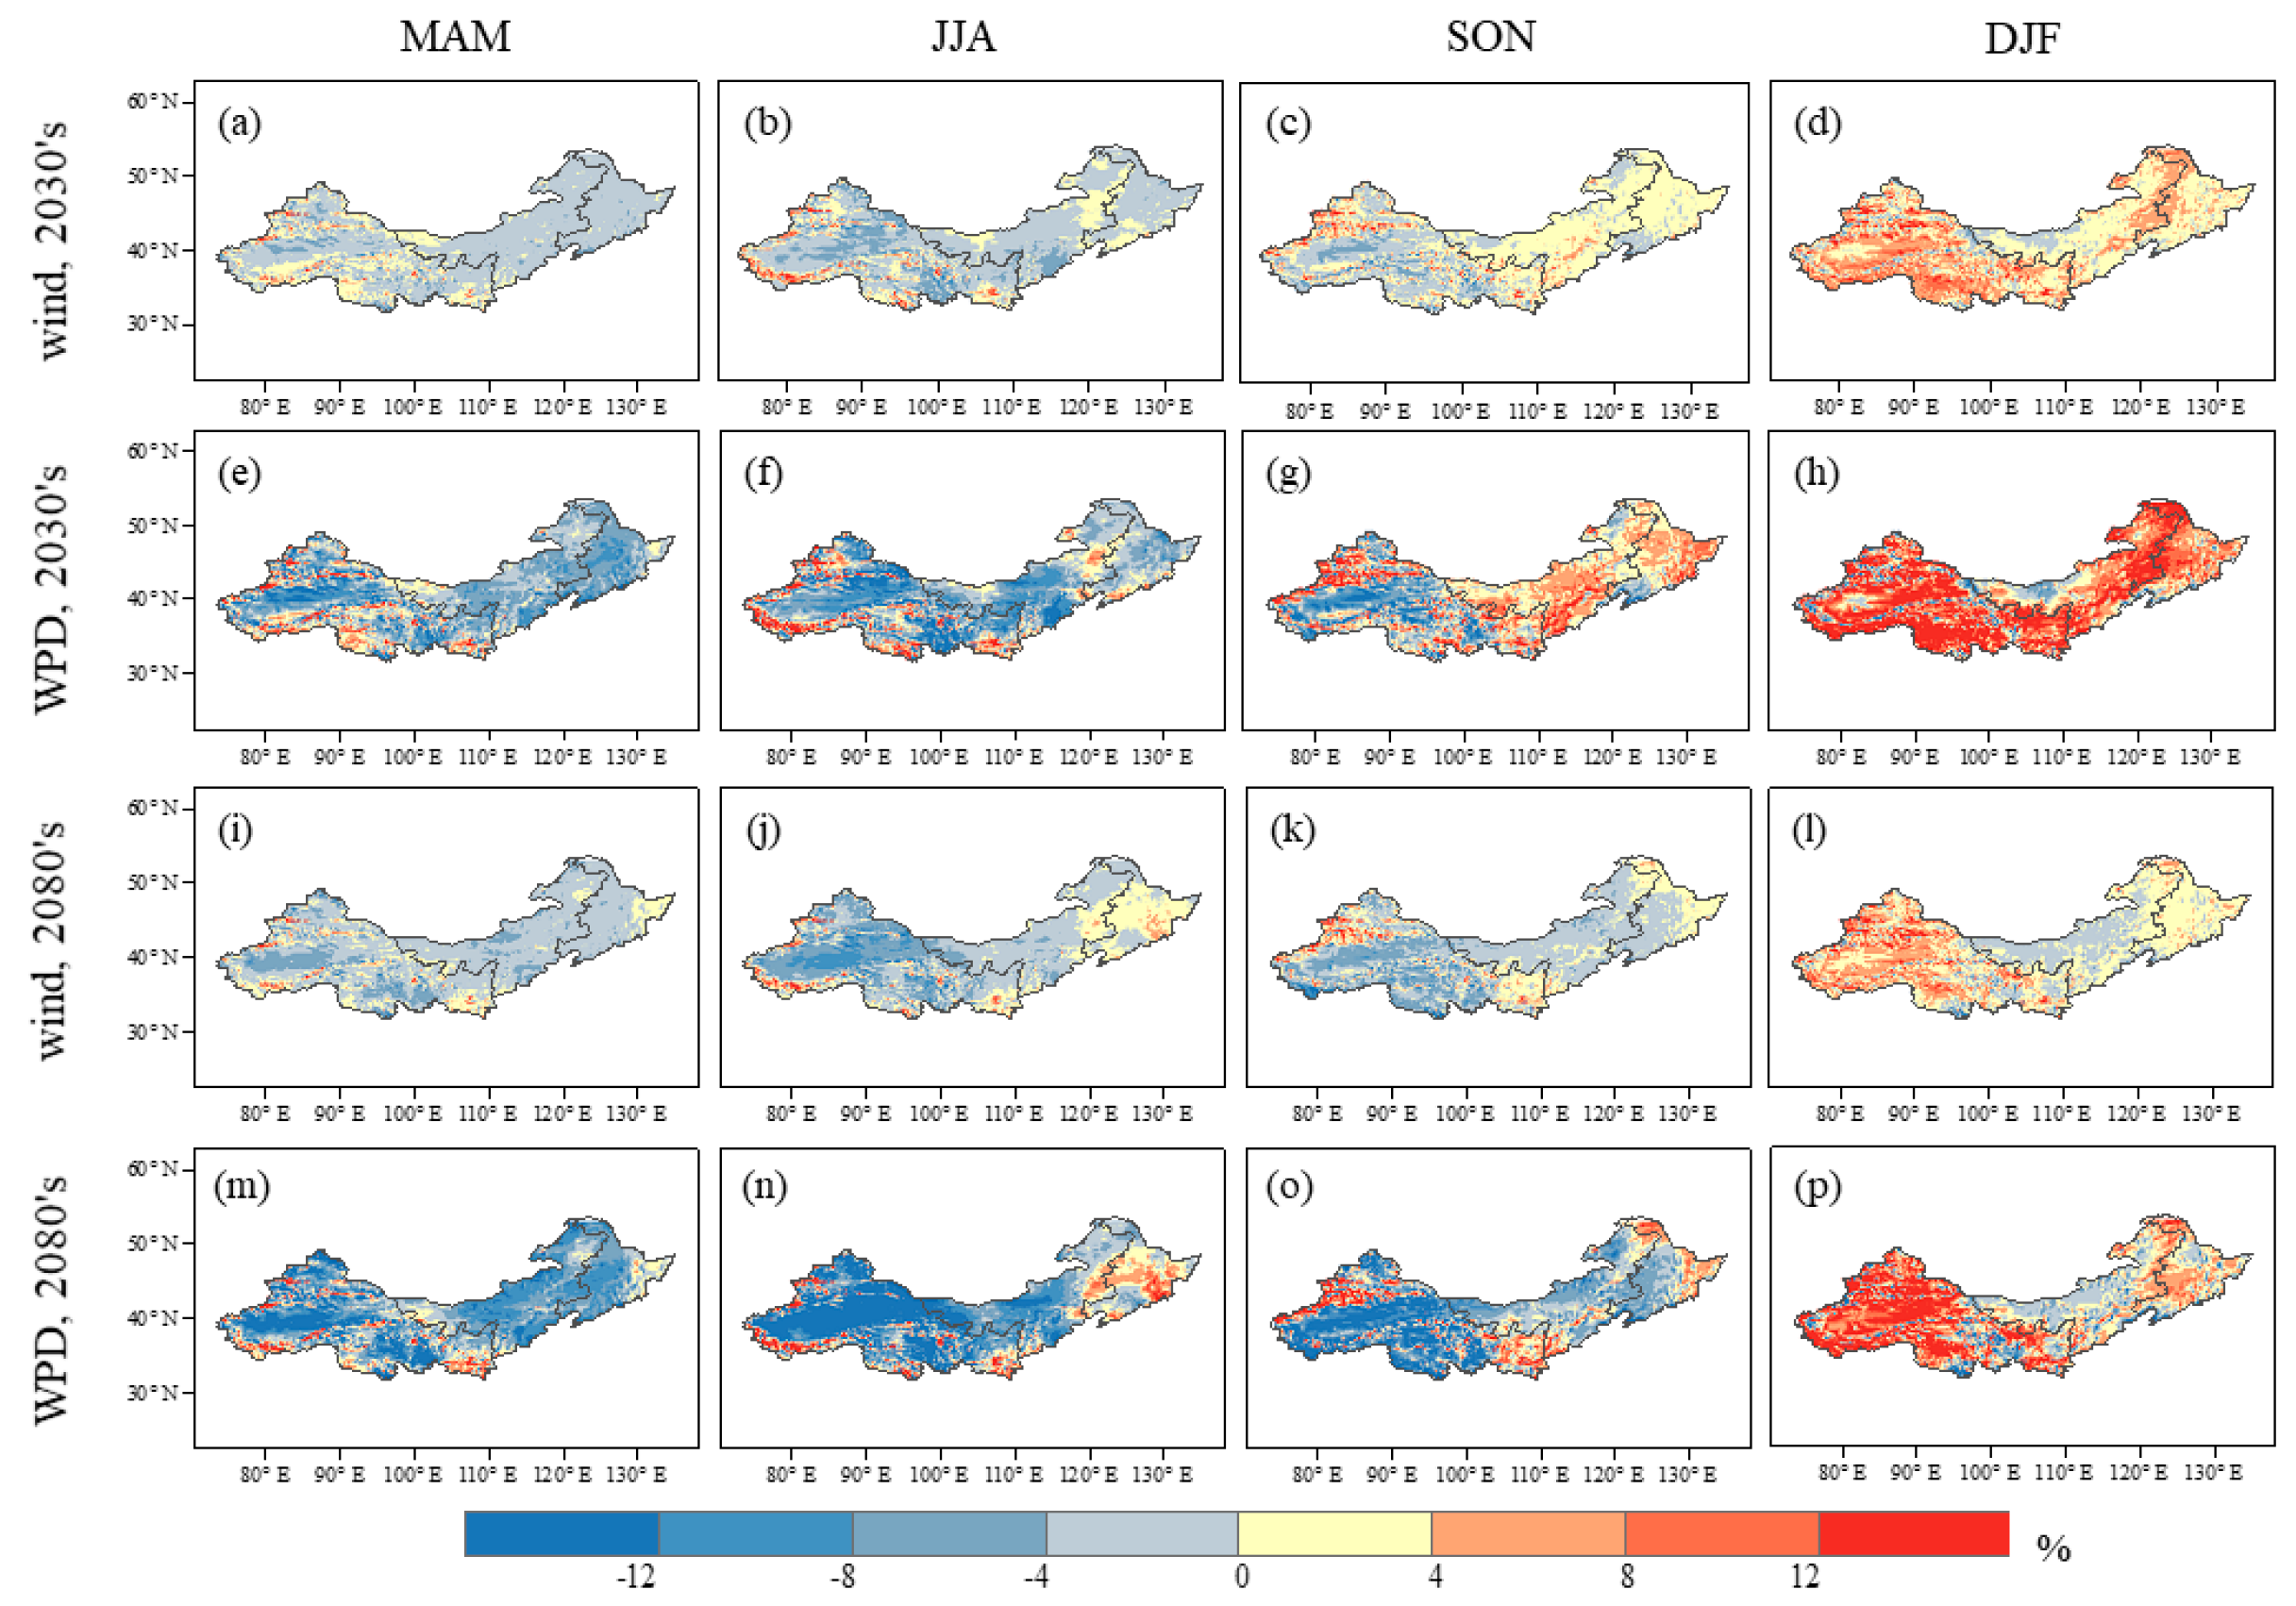
4.2.2. Changes in Spatial Distribution
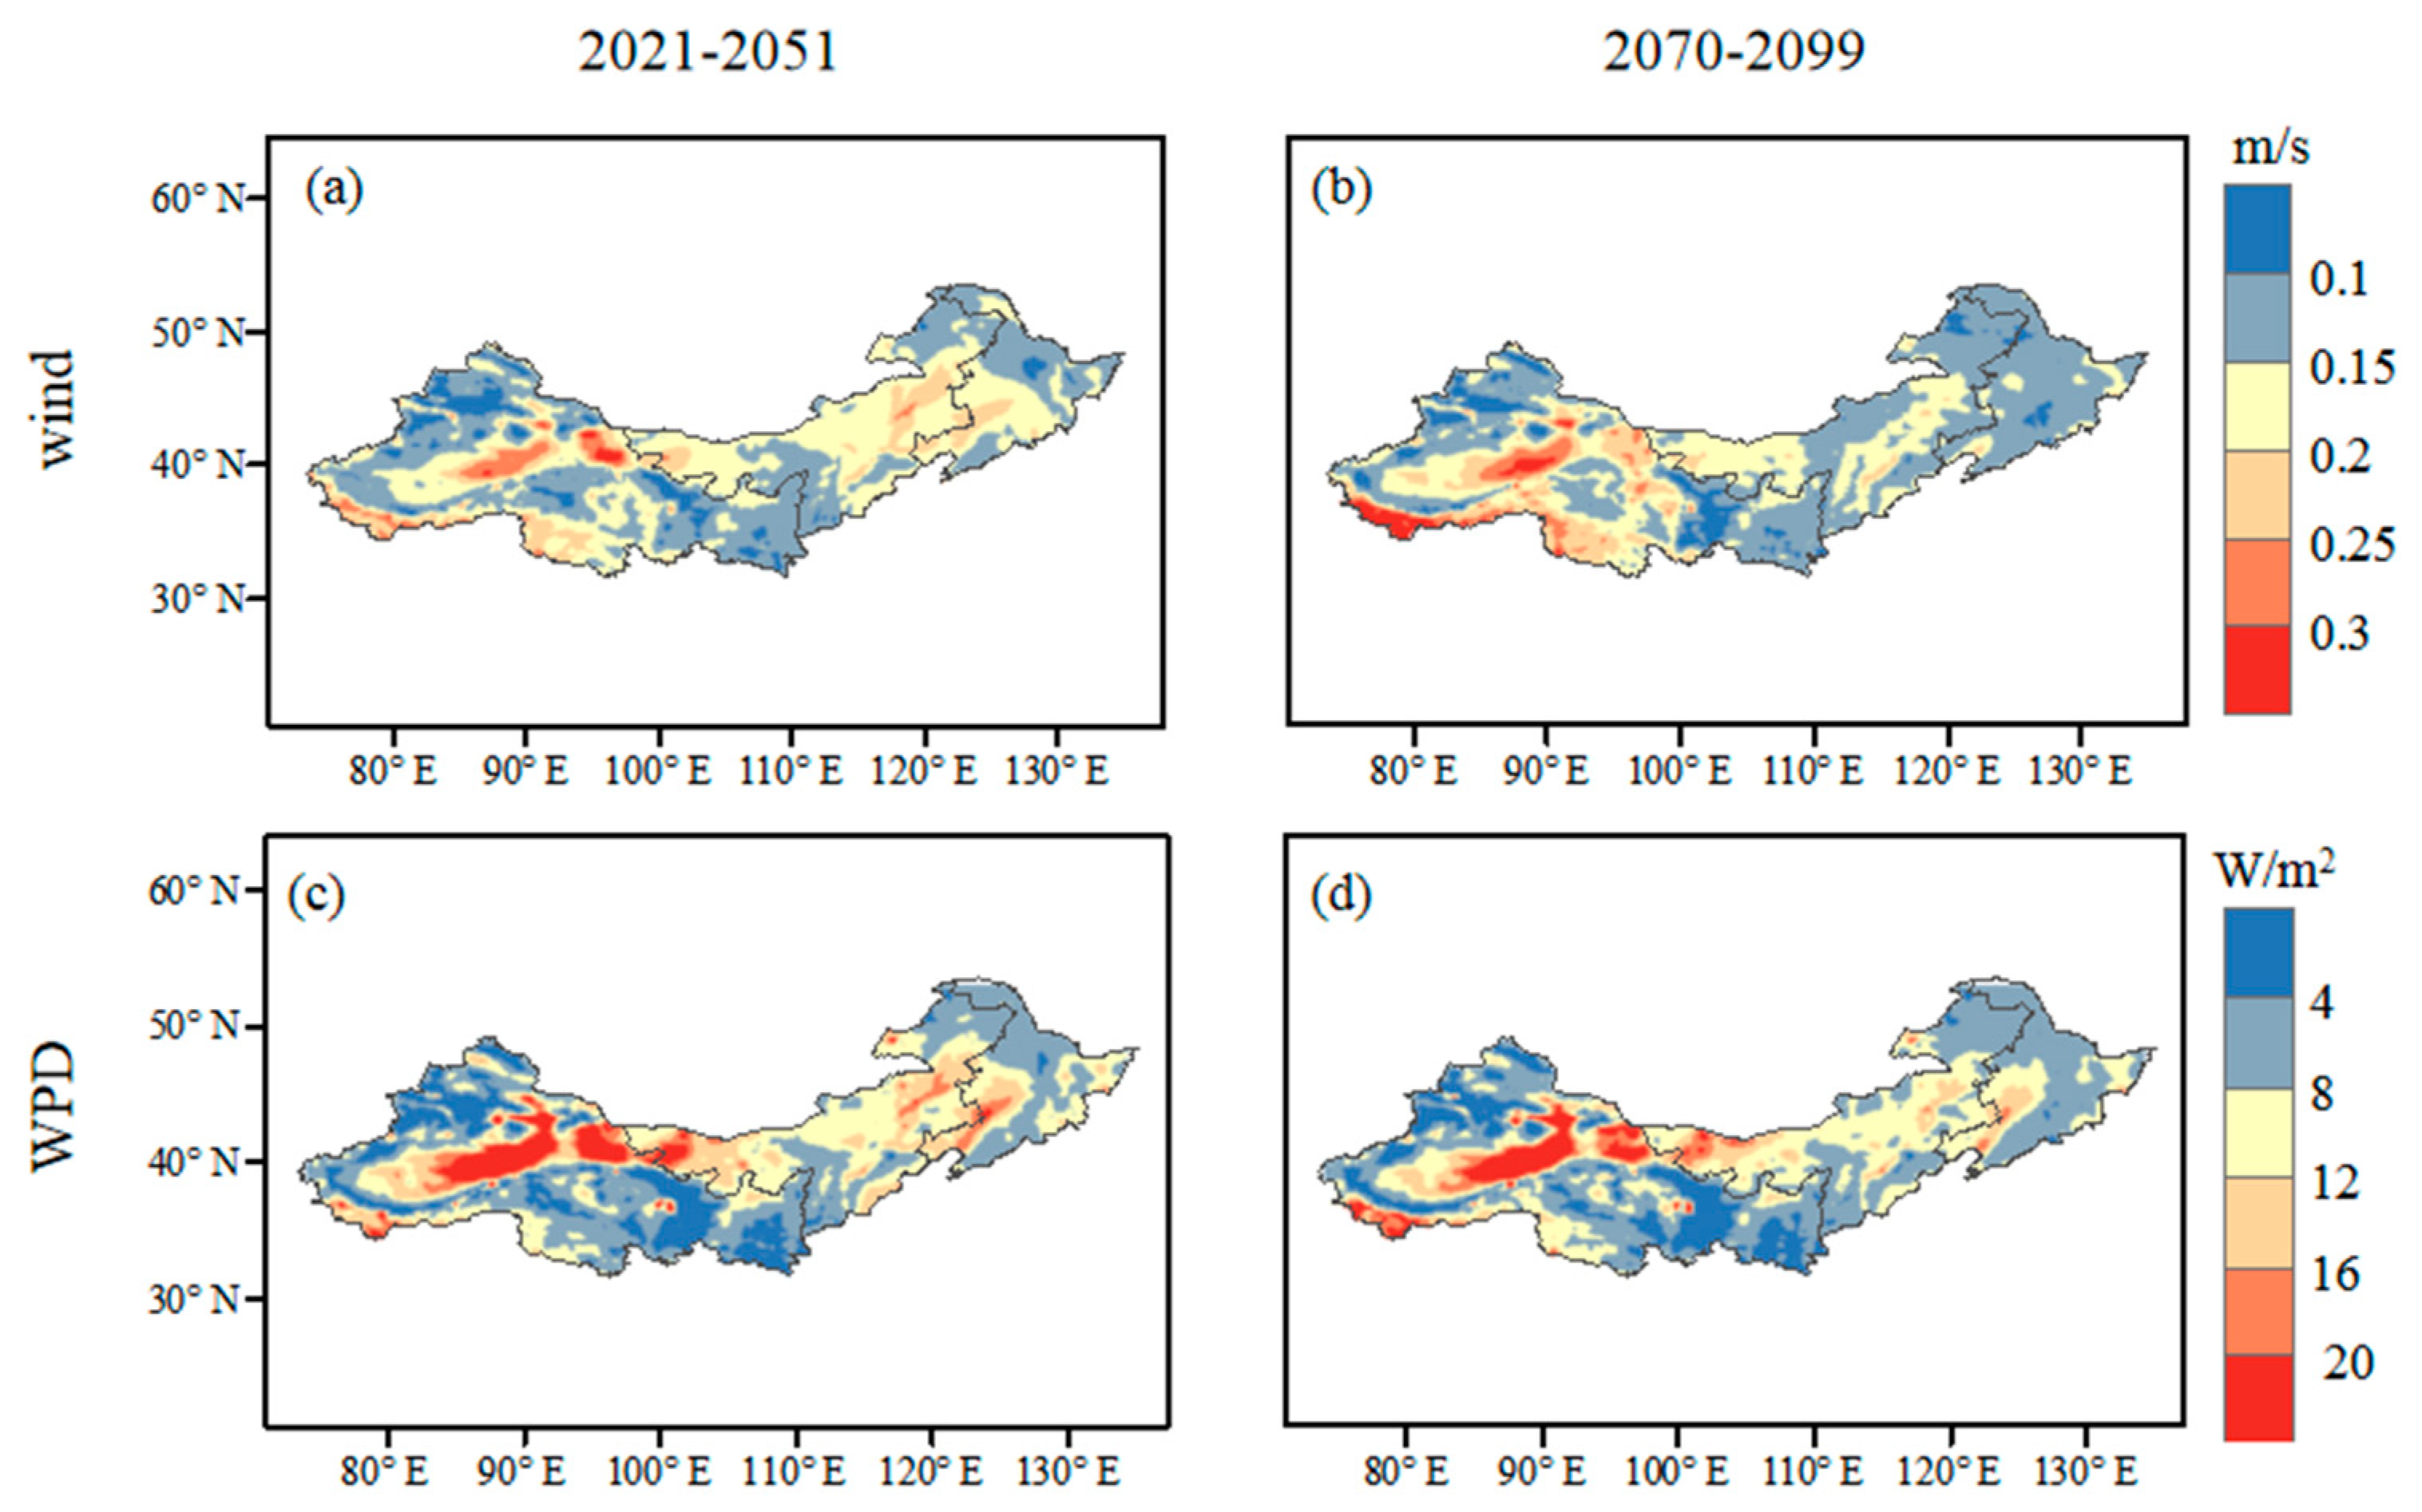
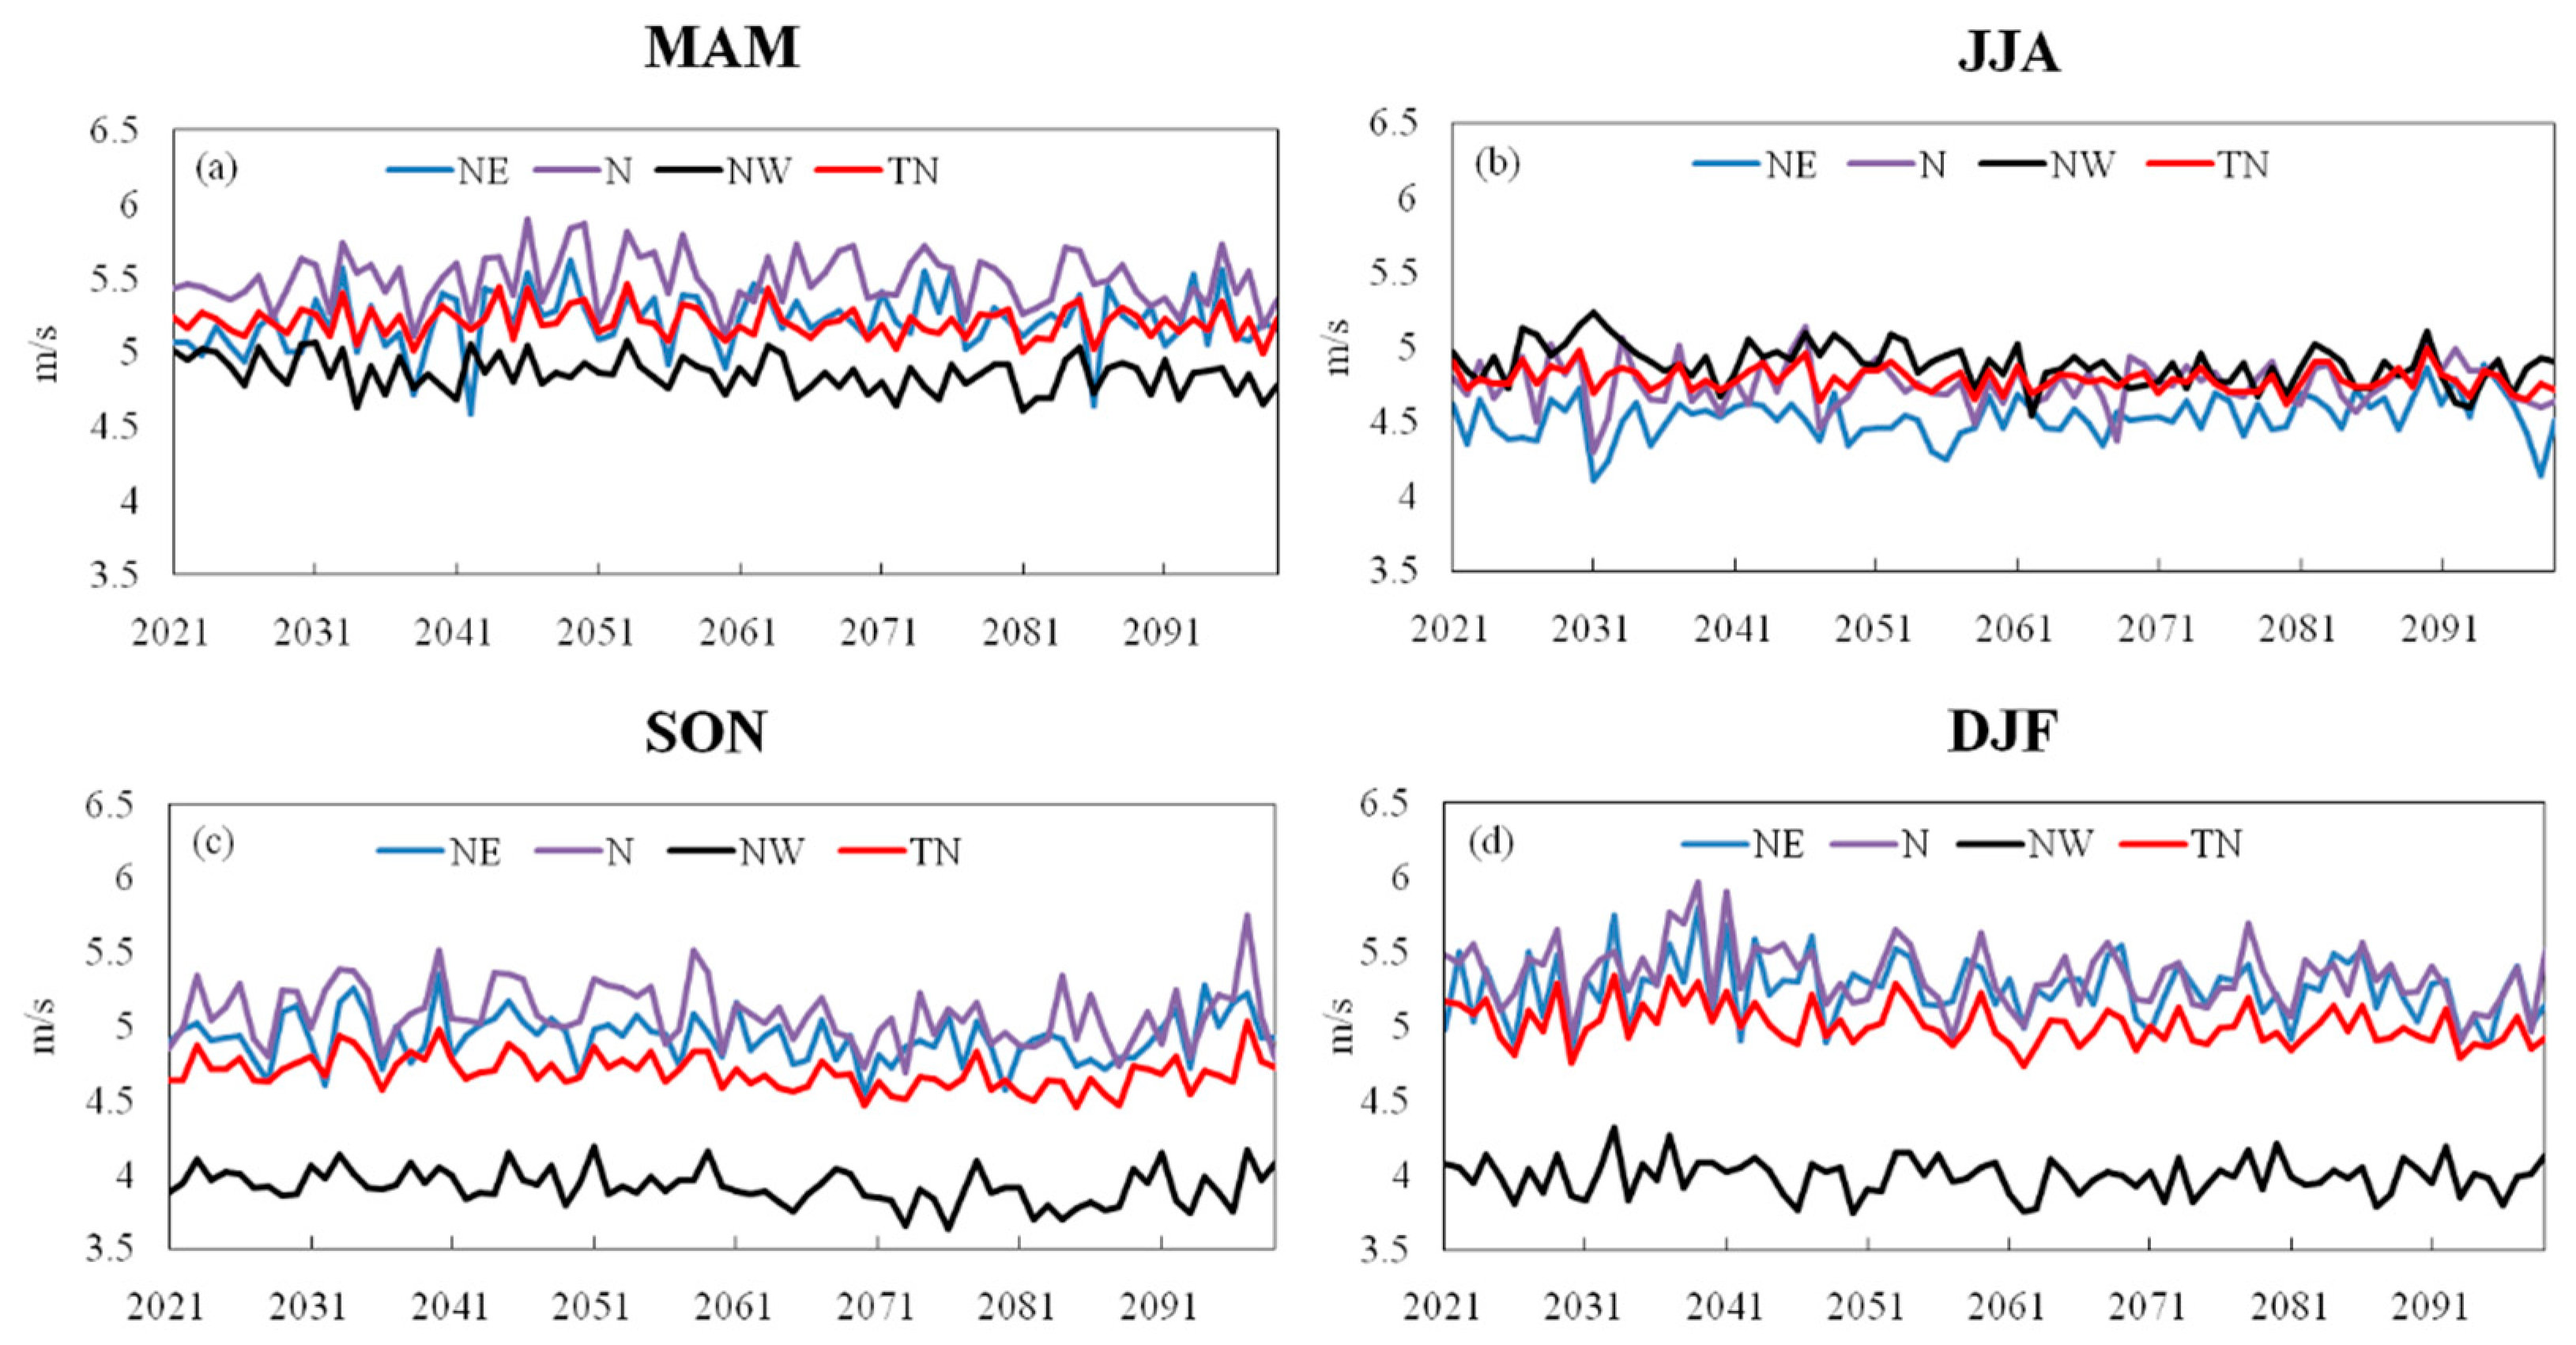
4.2.3. Interannual Variability in Future
5. Summary and Discussion
Author Contributions
Funding
Conflicts of Interest
References
- Tollefson, J. IPCC says limiting global warming to 1.5 °C will require drastic action. Nature 2018, 562, 172–173. [Google Scholar] [CrossRef] [Green Version]
- Luderer, G.; Vrontisi, Z.; Bertram, C.; Edelenbosch, O.Y.; Pietzcker, R.C.; Rogelj, J.; De Boer, H.S.; Drouet, L.; Emmerling, J.; Fricko, O.; et al. Residual fossil. CO 2 emissions in 1.5–2 °C pathways. Nat. Clim. Chang. 2018, 8, 626–633. [Google Scholar] [CrossRef] [Green Version]
- Schiermeier, Q. European Union moves to strengthen renewable-energy goals. Nature 2018. [Google Scholar] [CrossRef]
- Zhang, D.; Wang, J.; Lin, Y.; Si, Y.; Huang, C.; Yang, J.; Huang, B.; Li, W. Present situation and future prospect of renewable energy in China. Renew. Sustain. Energy Rev. 2017, 76, 865–871. [Google Scholar] [CrossRef]
- Bandoc, G.; Prăvălie, R.; Patriche, C.V.; Degeratu, M. Spatial assessment of wind power potential at global scale. A geographical approach. J. Clean. Prod. 2018, 200, 1065–1086. [Google Scholar] [CrossRef]
- Barthelmie, R.; Pryor, S. Potential contribution of wind energy to climate change mitigation. Nat. Clim. Chang. 2014, 4, 684–688. [Google Scholar] [CrossRef]
- Yuan, J. Wind energy in China: Estimating the potential. Nat. Energy 2016, 1, 16095. [Google Scholar] [CrossRef]
- Shi, P.-J.; Zhang, G.-F.; Kong, F.; Ye, Q.; Pei-Jun, S.; Gang-Feng, Z.; Feng, K.; Qian, Y. Wind speed change regionalization in China (1961–2012). Adv. Clim. Chang. Res. 2015, 6, 151–158. [Google Scholar] [CrossRef]
- Sherman, P.; Chen, X.; McElroy, M.B. Wind-generated electricity in China: Decreasing potential, inter-annual variability and association with changing climate. Sci. Rep. 2017, 7, 16294. [Google Scholar] [CrossRef] [Green Version]
- Yu, L.; Zhong, S.; Bian, X.; Heilman, W.E. Climatology and trend of wind power resources in China and its surrounding regions: A revisit using Climate Forecast System Reanalysis data. Int. J. Climatol. 2016, 36, 2173–2188. [Google Scholar] [CrossRef]
- Craig, M.T.; Cohen, S.M.; Macknick, J.; Draxl, C.; Guerra, O.J.; Sengupta, M.; Haupt, S.E.; Hodge, B.-M.; Martinez-Anido, C.B. A review of the potential impacts of climate change on bulk power system planning and operations in the United States. Renew. Sustain. Energy Rev. 2018, 98, 255–267. [Google Scholar] [CrossRef]
- Tobin, I.; Vautard, R.; Balog, I.; Bréon, F.-M.; Jerez, S.; Ruti, P.M.; Thais, F.; Vrac, M.; Yiou, P. Assessing climate change impacts on European wind energy from ENSEMBLES high-resolution climate projections. Clim. Chang. 2015, 128, 99–112. [Google Scholar] [CrossRef]
- Chen, L.; Pryor, S.; Li, N. Assessing the performance of Intergovernmental Panel on Climate Change AR5 climate models in simulating and projecting wind speeds over China. J. Geophys. Res. Atmos. 2012, 117. [Google Scholar] [CrossRef] [Green Version]
- Carvalho, D.; Rocha, A.; Gómez-Gesteira, M.; Santos, C.S. Potential impacts of climate change on European wind energy resource under the CMIP5 future climate projections. Renew. Energy 2017, 101, 29–40. [Google Scholar] [CrossRef]
- Hueging, H.; Haas, R.; Born, K.; Jacob, D.; Pinto, J.G. Regional Changes in Wind Energy Potential over Europe Using Regional Climate Model Ensemble Projections. J. Appl. Meteorol. Climatol. 2013, 52, 903–917. [Google Scholar] [CrossRef] [Green Version]
- Pryor, S.; Barthelmie, R. Assessing climate change impacts on the near-term stability of the wind energy resource over the United States. Proc. Natl. Acad. Sci. USA 2011, 108, 8167–8171. [Google Scholar] [CrossRef] [PubMed] [Green Version]
- Johnson, D.L.; Erhardt, R.J. Projected impacts of climate change on wind energy density in the United States. Renew. Energy 2016, 85, 66–73. [Google Scholar] [CrossRef]
- Jiang, Y.; Luo, Y.; Zhao, Z. Projection of wind speed changes in China in the 21st century by climate models. Chin. J. Atmos. Sci. 2010, 34, 323. [Google Scholar]
- Mo, H.; Hong, H.; Fan, F. Estimating the extreme wind speed for regions in China using surface wind observations and reanalysis data. J. Wind Eng. Ind. Aerodyn. 2015, 143, 19–33. [Google Scholar] [CrossRef]
- Jiang, Y.; Luo, Y.; Zhao, Z. Maximum wind speed changes over China. Acta Meteorol. Sin. 2013, 27, 63–74. [Google Scholar] [CrossRef]
- Mei, S.; Yaxu, Z.; Xuguang, H. Status and Development Suggestions of Wind Heating in Northern China. Energy Procedia 2017, 142, 105–110. [Google Scholar] [CrossRef]
- Liu, F.; Sun, F.; Liu, W.; Wang, T.; Wang, H.; Wang, X.; Lim, W.H. On wind speed pattern and energy potential in China. Appl. Energy 2019, 236, 867–876. [Google Scholar] [CrossRef]
- Yang, J.; Liu, Q.; Li, X.; Cui, X. Overview of Wind Power in China: Status and Future. Sustainability 2017, 9, 1454. [Google Scholar] [CrossRef] [Green Version]
- Xu, Y.; Gao, X.; Shen, Y.; Xu, C.; Shi, Y.; Giorgi, F. A daily temperature dataset over China and its application in validating a RCM simulation. Adv. Atmos. Sci. 2009, 26, 763–772. [Google Scholar] [CrossRef]
- Wu, J.; Gao, X. A gridded daily observation dataset over China region and comparison with the other datasets. Chin. J. Geophys. 2013, 56, 1102–1111. [Google Scholar]
- Jones, R.; Noguer, M.; Hassell, D.; Wilson, S.; Jenkins, G.; Mitchell, J. Generating High Resolution Climate Change Scenarios Using PRECIS; Met Office Hadley Centre: Exeter, UK, 2004; p. 40.
- Xu, Y.; Zhang, Y.; Lin, E.; Lin, W.; Dong, W.; Jones, R.G.; Hassell, D.; Wilson, S. Analyses on the climate change responses over China under SRES B2 scenario using PRECIS. Chin. Sci. Bull. 2006, 51, 2260–2267. [Google Scholar] [CrossRef]
- Wang, X.; Huang, G.; Lin, Q.; Nie, X.; Liu, J. High-resolution temperature and precipitation projections over Ontario, Canada: A coupled dynamical-statistical approach. Q. J. R. Meteorol. Soc. 2015, 141, 1137–1146. [Google Scholar] [CrossRef]
- Guo, J.; Huang, G.; Wang, X.; Li, Y.; Lin, Q. Dynamically-downscaled projections of changes in temperature extremes over China. Clim. Dyn. 2018, 50, 1045–1066. [Google Scholar] [CrossRef]
- Jones, C.D.; Hughes, J.K.; Bellouin, N.; Hardiman, S.C.; Jones, G.S.; Knight, J.; Liddicoat, S.; O’connor, F.M.; Andres, R.J.; Bell, C.; et al. The HadGEM2-ES implementation of CMIP5 centennial simulations. Geosci. Model Dev. 2011, 4, 543–570. [Google Scholar] [CrossRef] [Green Version]
- Chen, W.; Castruccio, S.; Genton, M.G.; Crippa, P. Current and Future Estimates of Wind Energy Potential Over Saudi Arabia. J. Geophys. Res. Atmos. 2018, 123, 6443–6459. [Google Scholar] [CrossRef]
- Jiang, Y.; Luo, Y.; Zhao, Z. Projections of wind changes for 21st century in China by three regional climate models. Chin. Geogr. Sci. 2010, 20, 226–235. [Google Scholar] [CrossRef]
- Salvação, N.; Bernardino, M.; Soares, C.G. Assessing mesoscale wind simulations in different environments. Comput. Geosci. 2014, 71, 28–36. [Google Scholar] [CrossRef]
- Karnauskas, K.B.; Lundquist, J.K.; Zhang, L. Southward shift of the global wind energy resource under high carbon dioxide emissions. Nat. Geosci. 2018, 11, 38–43. [Google Scholar] [CrossRef]
- Jiang, Y.; Xu, X.; Liu, H. Projection of surface wind by CMIP5 and CMIP3 in China in the 21st century. J. Meteorol. Environ. 2018, 34, 8. [Google Scholar]
- Gao, Y.; Ma, S.; Wang, T. The impact of climate change on wind power abundance and variability in China. Energy 2019, 189. [Google Scholar] [CrossRef]
- Guo, H.; Xu, M.; Hu, Q. Changes in near-surface wind speed in China: 1969–2005. Int. J. Climatol. 2011, 31, 349–358. [Google Scholar] [CrossRef]
- Guo, J.; Huang, G.; Wang, X.; Xu, Y.; Li, Y. Projected changes in wind speed and its energy potential in China using a high-resolution regional climate model. Wind Energy 2019, 23, 471–485. [Google Scholar] [CrossRef]


| Region | Season | R | Bias (%) | RMSE |
| NE | MAM | 0.57 | −12.50 | 1.15 |
| JJA | 0.56 | −2.29 | 0.64 | |
| SON | 0.37 | −2.77 | 0.88 | |
| DJF | 0.43 | 10.33 | 0.91 | |
| ANN | 0.47 | −2.57 | 0.82 | |
| N | MAM | 0.73 | −5.81 | 0.95 |
| JJA | 0.51 | 4.21 | 0.78 | |
| SON | 0.72 | 7.10 | 0.73 | |
| DJF | 0.62 | 10.72 | 0.85 | |
| ANN | 0.69 | 3.46 | 0.72 | |
| NW | MAM | 0.02 | −23.42 | 2.80 |
| JJA | −0.13 | −13.93 | 2.70 | |
| SON | 0.24 | −21.96 | 2.30 | |
| DJF | 0.68 | −21.02 | 2.05 | |
| ANN | 0.19 | −20.07 | 2.35 | |
| TN | MAM | 0.30 | −14.33 | 2.04 |
| JJA | 0.18 | −7.69 | 1.90 | |
| SON | 0.36 | −4.59 | 1.64 | |
| DJF | 0.63 | −1.51 | 1.59 | |
| ANN | 0.38 | −7.46 | 1.69 |
| Period | Season | Wind (%) | WPD (%) | ||||||
|---|---|---|---|---|---|---|---|---|---|
| NE | N | NW | TN | NE | N | NW | TN | ||
| 2030s | MAM | −2.08 | −1.77 | −0.52 | −1.02 | −5.67 | −4.92 | −2.51 | −2.71 |
| JJA | −0.39 | −0.71 | −1.11 | −0.49 | −2.36 | −3.91 | −3.27 | −2.65 | |
| SON | 1.35 | 1.29 | 0.25 | 0.47 | 3.80 | 4.20 | −1.21 | 1.04 | |
| DJF | 2.67 | 2.79 | 4.13 | 2.91 | 7.77 | 8.70 | 12.53 | 9.77 | |
| ANN | 0.33 | 0.34 | 0.47 | 0.39 | 0.07 | 0.46 | −0.06 | 0.70 | |
| 2080s | MAM | −1.41 | −2.63 | −2.17 | −2.08 | −4.67 | −7.68 | −5.86 | −4.74 |
| JJA | 1.39 | −0.41 | −3.58 | −1.23 | 1.60 | −3.81 | −10.5 | −4.83 | |
| SON | −0.02 | −1.03 | −1.95 | −1.71 | −1.40 | −2.40 | −7.42 | −5.17 | |
| DJF | 1.64 | 0.22 | 4.05 | 1.30 | 0.46 | 1.25 | 11.60 | 5.40 | |
| ANN | 0.30 | −1.04 | −1.23 | −1.06 | −1.23 | −3.69 | −5.18 | −3.32 | |
© 2020 by the authors. Licensee MDPI, Basel, Switzerland. This article is an open access article distributed under the terms and conditions of the Creative Commons Attribution (CC BY) license (http://creativecommons.org/licenses/by/4.0/).
Share and Cite
Chen, Z.; Li, W.; Guo, J.; Bao, Z.; Pan, Z.; Hou, B. Projection of Wind Energy Potential over Northern China Using a Regional Climate Model. Sustainability 2020, 12, 3979. https://doi.org/10.3390/su12103979
Chen Z, Li W, Guo J, Bao Z, Pan Z, Hou B. Projection of Wind Energy Potential over Northern China Using a Regional Climate Model. Sustainability. 2020; 12(10):3979. https://doi.org/10.3390/su12103979
Chicago/Turabian StyleChen, Zhuo, Wei Li, Junhong Guo, Zhe Bao, Zhangrong Pan, and Baodeng Hou. 2020. "Projection of Wind Energy Potential over Northern China Using a Regional Climate Model" Sustainability 12, no. 10: 3979. https://doi.org/10.3390/su12103979