Article

How Vulnerable Are Urban Regeneration Sites to Climate Change in Busan, South Korea?

1
Research Department, Site Planning Co. Ltd., Busan 48505, Korea
2
Water and Land Research Group, Korea Environment Institute, Sejong 30147, Korea
3
Department of Landscape Architecture, Gangneung-Wonju National University, Gangneung 25457, Korea
*
Author to whom correspondence should be addressed.
Sustainability 2020, 12(10), 4032; https://doi.org/10.3390/su12104032
Submission received: 21 April 2020 / Revised: 12 May 2020 / Accepted: 12 May 2020 / Published: 14 May 2020

Abstract

:
Research on the risks of climate change to urban regeneration projects has been insufficient to date. Therefore, this study aims to compare and analyze the degree of risk of climate change impact on areas with and without urban regeneration projects (for Eup, Myeon, and Dong regional units) in Busan, South Korea. In this study, (1) climate change risk indicators were extracted based on the concept of risk (hazard, vulnerability, and exposure), (2) a spatial analysis was performed using a graphic information system (GIS), and (3) the primary influencing factors were derived through a logistic regression analysis. The principal results show that urban regeneration areas have a higher risk of climate change impact than other areas. The results indicate that urban regeneration areas have a higher population density per area and more impermeable or flooded areas can increase the risk of climate change impacts. We also discuss strategies to develop resilient cities and climate change adaptation policies for future urban regeneration projects.

1. Introduction

1.1. Background

Urban regeneration projects attract researchers and policy makers globally because of the positive social, cultural, environmental, and physical impacts of these projects on declining urban areas [1,2,3,4,5]. However, urban regeneration projects have not focused on the resilience of these declining urban areas, which includes their response to mitigating the impacts of climate change on their residents. The most important reason for researching the impacts of climate change on urban regeneration projects is related to the infrastructure in these areas. Declining urban areas are concentrated in old apartment buildings, multi-family houses, and commercial business buildings and are vulnerable to the effects of climate change [6]. Additionally, old urban infrastructure is the primary cause of greenhouse gas emissions [7]. Therefore, if urban regeneration projects fail to prevent or manage the response to climate change, damage and negative impacts on people are expected in urban regeneration sites that are vulnerable to climate change.
How cities develop is part of the climate problem, but it can also be part of the solution. Many cities and regions facing a two-way relationship between climate change and urban development need measures to fight or adapt to climate change in the urban sector (e.g., urban planning, urban regeneration) [8]. Climate change adaptive cities are not individual solutions to spatial and physical infrastructure facilities, but require comprehensive and systematic adaptation measures [9]. Thus, in the case of various cities, the types of damage from climate change (e.g., heat waves, floods, droughts) are distinguished in connection with the physical space at the city level, and appropriate urban planning techniques are applied [10,11,12].
The response to climate change can be subdivided into direct climate change mitigation to reduce the carbon footprint, the primary cause of greenhouse gas emissions, and climate change adaptation to minimize the effects of climate change [13]. The mitigation of and adaptation to climate change might be perceived as opposing concepts but will likely complement each other. These concepts should be approached and considered in an integrated manner; however, various green city projects related to urban regeneration projects have considered only carbon reduction [6]. Additionally, various legal regulations related to climate change responses, such as urban and residential environmental improvement regulations, only include general environmental plans related to open green space, landscaping, energy supply, and waste disposal. Thus, it is difficult to build a system that can effectively respond to climate change [14].
Researchers who have observed this problem [7,14,15,16] agree that the application of climate change response indicators is necessary to proceed with urban regeneration projects. However, research related to climate change adaptation has rarely considered urban areas, and urban regeneration studies have mostly focused on specific areas in the form of case studies. Therefore, limited information is available for making suggestions to improve urban planning and policy regarding climate change.
The aims of this study were to investigate climate change adaptation indicators in urban regeneration areas and to compare and analyze the degree of risk for climate change effects among areas with and without urban regeneration. This study contributes to improving the future resilience of urban regeneration areas by identifying which factors are most vulnerable to climate change.

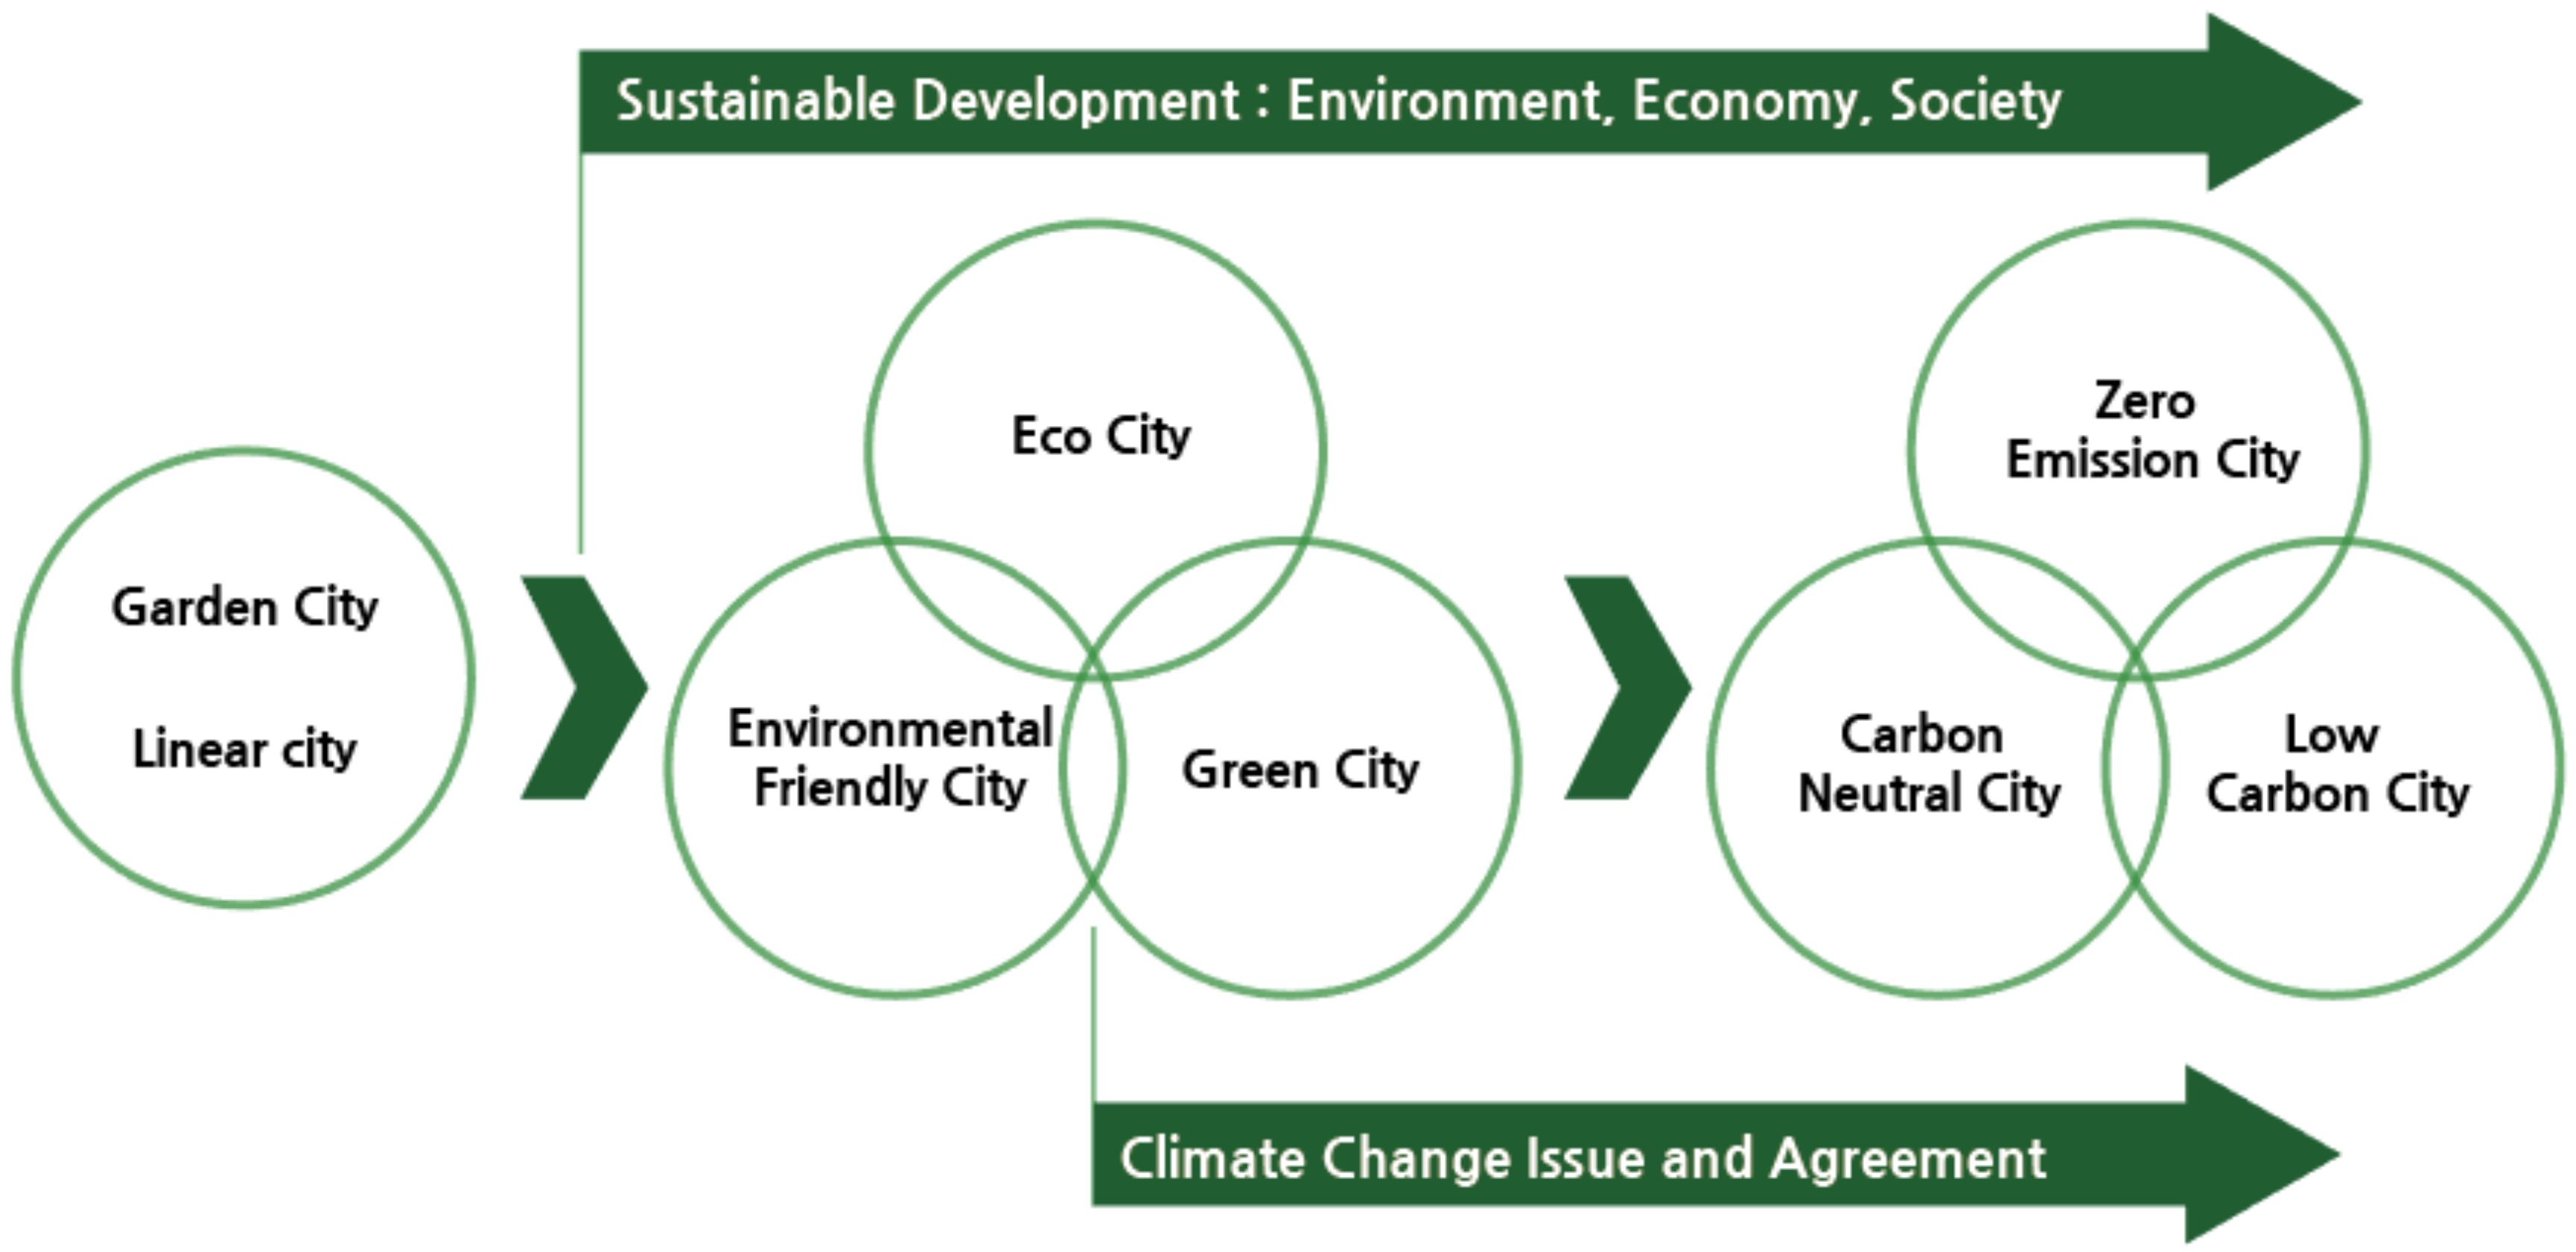
1.2. Paradigm of Climate Change Adaptation in Urban Planning in South Korea

Global urban planning for environmentally friendly development is not a new subject. Compact cities, new urbanism, smart growth, and urban growth management contain the same context regarding eco-friendly urban development processes [17]. The purpose of environmentally friendly development is to be a sustainable city. The applicability of sustainability includes three elements of life: nature, people, and business [18], which can be interpreted as the environment, society, and the economy. Cities could pledge to apply sustainable development by solving urban problems such as dense population, urban sprawl, pollution, and community disintegration. Many cities are working on adaptation and planning strategies. Following this trend, the Netherlands, Germany, and other countries emphasize the importance of spatial adaptation and are creating cities that can fight or adapt to climate change by strengthening climate- and water-related resilience, establishing long-term plans for spatial adaptation, and strengthening sustainable resilience [19].
The concept of urban planning in terms of the environment (climate change adaptation) in South Korea has developed from the garden city and linear city to the eco-city, environmentally friendly city, green city, zero emission city, carbon neutral city, and low carbon city (Figure 1). In order to achieve sustainable cities and address climate change issues, the Korean government had to strictly implement environmental plans in the 1990s. After the 2000s, the projects of the Climate Change City Model, Green Energy Town, and Eco-Sustainable City were implemented. These projects targeted short-term energy savings to alleviate climate change issues. Recently, many government projects in South Korea have targeted regenerating old buildings and vulnerable areas under the title of urban regeneration. Although these urban regeneration projects do not mandate climate change adaptation plans, some recent urban regeneration projects have aimed to solve the problem of climate change and reduce the increasing fine dust concentrations. Similar to the trend shown in Figure 1, as the impact of climate change increases in urban areas, environmental consideration in urban planning will increase [20,21], and urban planning and regeneration strategies for climate change adaptation should be a focus.

1.3. Previous Studies on Climate Change Risk Assessment

Previous studies on urban regeneration have focused more on the aspects of regional development and population inflow [22,23], which have resulted in the commercialization of many urban regeneration sites or the departure of local residents [24,25]. This is a result of development focused on appearance rather than housing stability and environmental sustainability for local residents. Korkmaz and Balaban [26] criticized existing urban regeneration projects and insisted that future projects should sufficiently reflect environmental sustainability. Urban regeneration projects proposed as alternatives to existing urban development require a more delicate approach. To differentiate these projects from existing urban development, “voluntary participation of residents [27,28]”, “proper government intervention [29]”, “equal gain distribution [22]”, and “environmental sustainability [30,31]” have been proposed in urban regeneration planning and projects. Above all, environmental sustainability, which can improve the livability and resilience of a site and is closely related to enhancing climate change adaptation at urban regeneration sites, needs to be prioritized. Many existing studies [6,7,14,32] state that urban regeneration sites are very vulnerable to climate change, but there is a lack of practical research that proves this statement or compares the sites.
Climate change risks are defined as events caused by climate change that have undesirable results and the probability that these events will occur [33,34,35,36]. As per Climate Change 2014 of the Fifth Assessment Report by the Intergovernmental Panel on Climate Change (IPCC) [36], risk is defined as “the potential for consequences where something of value is at stake and where the outcome is uncertain, recognizing the diversity of values”. This concept of risk is further described as the interaction among hazard, vulnerability, and exposure [36]. Risk is also carefully considered in the global climate change adaptation plan because a climate risk assessment is critical for minimizing the impacts of climate change [37,38,39,40].
Previous studies on the spatial analysis of climate change risks can be divided into two categories. One category consists of studies that derive indicators to assess risk and compare each area relatively (i.e., assessing the overlap of risk indicators to determine the intensity of climate change risks). Son (2013) [41] used an evaluation indicator to understand flood risk by evaluating the resilience level and standard flooding of an urban environment in Seoul, South Korea. From the perspective of organizing the steps to manage risk, Bar et al. (2015) [42] determined the vulnerability level of agricultural water by applying the Driver → Pressure → State → Impact → Response (DPSIR) approach. This approach enables us to systematically understand the occurrence of and response processes for climate change risks. The other category consists of studies that determine the thresholds of climate change risks in targeted areas. Aerts et al. (2011) [43] described the flood insurance problems in the Netherlands and analyzed the risk values used for estimating flood insurance. Park et al. (2012) [44] evaluated the level of drought risk via a statistical analysis of climatic and socioeconomic factors. Terzi et al. (2019) [45] pointed out the limitations of single-risk assessments and reviewed various methods for addressing multiple climate change risks. Specifically, they compared Bayesian networks, agent-based models, system dynamic models, event and fault trees, and hybrid models for climate multi-risk assessment in mountainous regions.
The studies that analyzed climate change risks from a spatial perspective are considered useful as the basis for future spatial planning. However, these risk assessment results derived for specific regions are still insufficient for a direct application to other regions. In addition, in many countries, it may be meaningful to provide a plan of action to reduce climate change risks that focus on regeneration projects in targeted areas that can be directly improved when the projects are implemented.
Therefore, this study aimed to link climate change risk assessment results to urban regeneration projects and to compare the results in different regions in order to directly incorporate these results in the urban regeneration planning process.

1.4. Hypothesis

This study attempted to prove the following two hypotheses based on previous studies [6,7,14,32], which showed that urban regeneration sites are more vulnerable to climate change.
H1. 
There is a strong correlation between the core indicators of sites that need urban regeneration and the indicators of sites at risk for climate change impacts.
This hypothesis clarifies the relationship between the current framework for evaluating urban regeneration sites and that for evaluating climate change risks to improve the evaluation framework for urban regeneration projects.
H2. 
Sites that are currently implementing urban regeneration projects will have a higher risk of climate change impacts (heat wave, heavy precipitation, and sea level rise) than sites without urban regeneration projects.
This hypothesis is a direct comparison between sites where urban regeneration projects have been carried out for years and other sites without these projects. Hence, the results can contribute to urban regeneration project guidelines to minimize climate change risks.

2. Materials and Methods

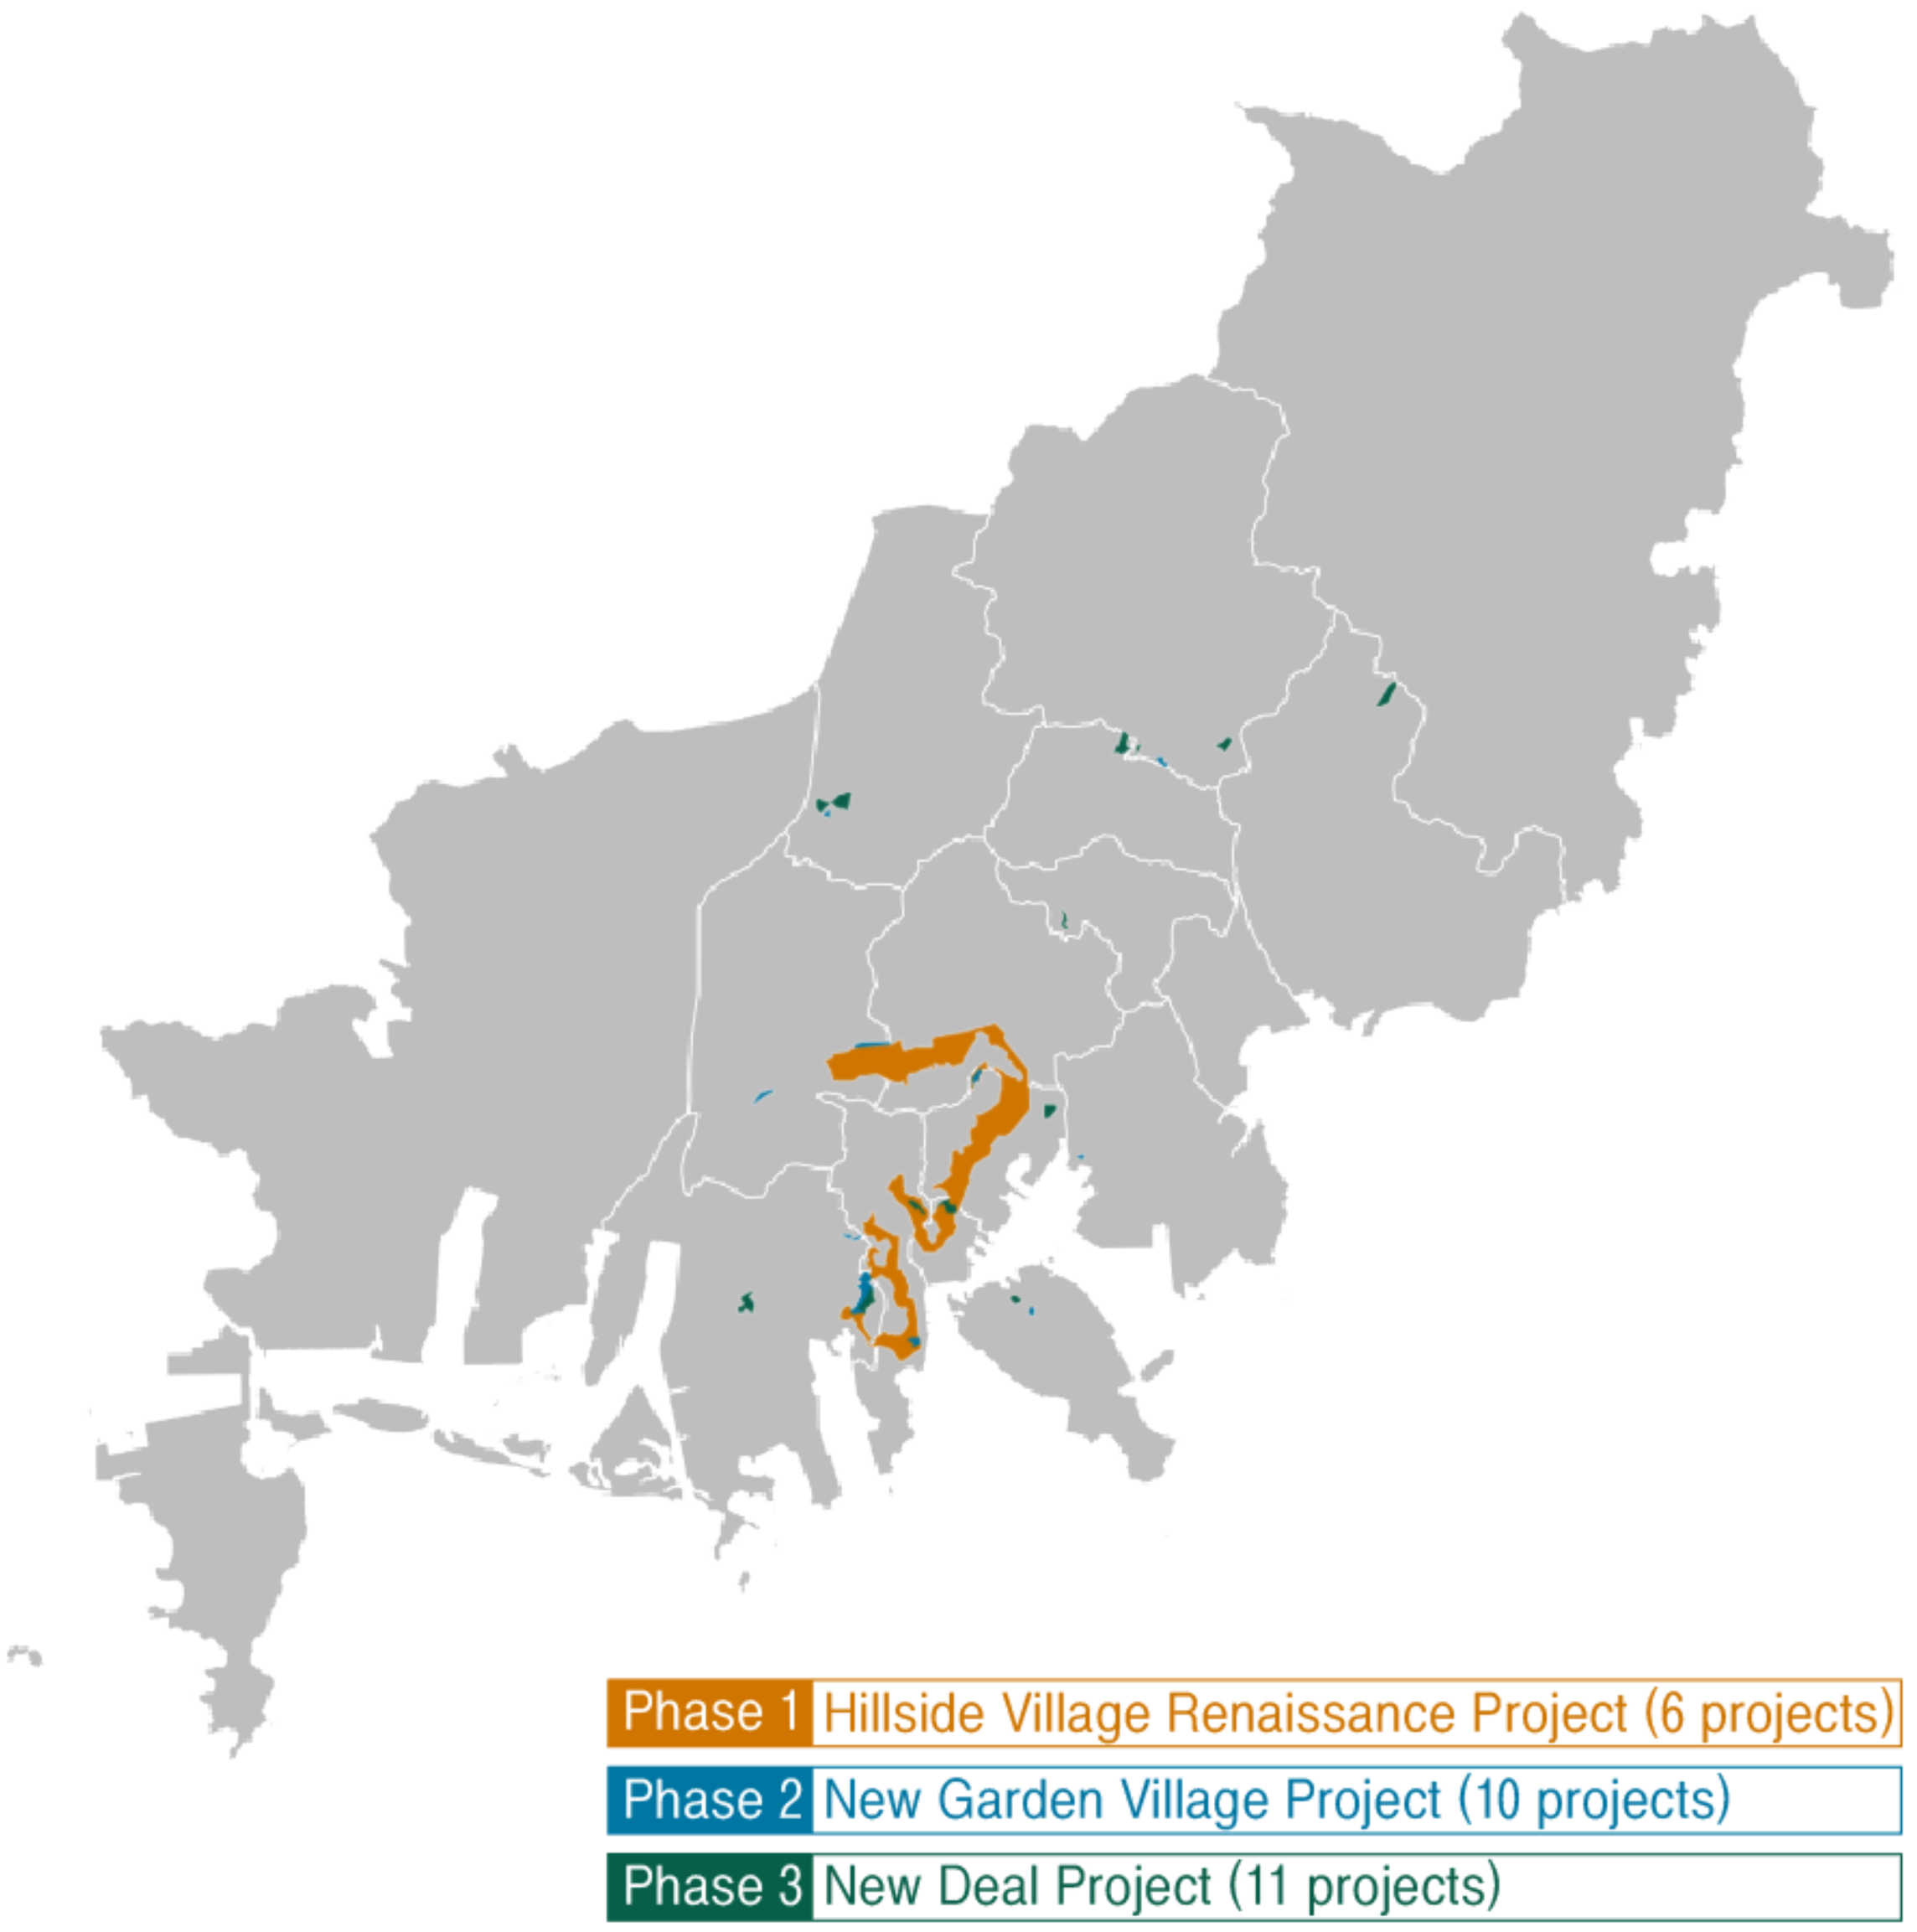
2.1. Distribution of the Research Areas

After the Korean War, the population density increased in downtown Busan. The high-density downtown area deteriorated the living environment and led to urban sprawl. An urban regeneration project was required to solve the problems of increasingly dilapidated dwellings and lack of urban infrastructure caused by the downtown decline and urban sprawl. The city government has designed and implemented the “Hillside Village Renaissance Project”, “Happy Village Project”, and “Urban Revitalizing Project” since 2010. After 2015, the Busan Urban Regeneration Support Agency was established to mediate among citizens, experts, and the government. The increasing role of these professional organizations has given momentum to diverse community-based urban regeneration projects. With the nation-led New Deal project since 2017, four sites in 2017 and seven in 2018 were selected that promote the physical, social, and economic regeneration of decayed residential areas.
In this study, 27 urban regeneration projects were analyzed, with 6, 10, and 11 projects in the first, second, and third phases, respectively (Table 1, Figure 2). These sites are mostly distributed near the old downtown area. The Hillside Village Renaissance project links hillside districts such as Saha-Gu, Sea-Gu, Dong-Gu, Busanjin-Gu, and Sasang-Gu. As these 27 urban regeneration projects span multiple administrative districts, the final analysis based on the administrative districts had 47 Dong sites in this study.

2.2. Selection Process for Urban Regeneration Indicators Considering Climate Change Risk

The final derived indicators of climate change adaptation and urban regeneration to be used as urban regeneration indicators that consider climate change risk in this study are listed below (Table 2). For this analysis, we selected common indicators from related existing studies [6,7,46,47,48,49,50,51,52].
Urban regeneration indicators were divided into “population and society”, “industry and economy”, and “physical environment”, which are also the standard divisions for assessing sites in Korean government-led urban regeneration projects. The indicators regarding climate change risks are “heat wave”, “heavy precipitation”, and “sea level rise.” These are the primary climate change impacts [36,50] that were further divided into “hazard”, “exposure”, and “vulnerability”, according to the climate change risk components [36]. Here, hazard is the probability of a climate change risk referring to [36]. In previous studies, extreme climatic conditions such as annual precipitation and heat wave days [49,50] and risk-prone areas [53]—which were usually affected by climate change in the past—have been proposed as indicators for measuring climate change hazards. Natural hazards are predominantly affected by natural events, processes, and phenomena [54]. We adopted climatic conditions as our final hazard indicators depending on each heat wave, heavy precipitation, and sea level rise event. Exposure to a climate change risk can be defined as the assets in risk-prone areas [36]. If an asset that can be damaged is classified in detail, it can be divided into human and natural systems related to infrastructure required for human life [36]. In this study, population density was used as the primary exposure indicator limited to the human system. According to the IPCC [36], “vulnerability defines the extent to which a system is susceptible to, or unable to cope with, adverse effects of climate change, including climate variability and extremes.” As this concept is comprehensive, the adaptive capacity to cope with climate change as well as sensitivity has been emphasized. Therefore, vulnerability has been measured in consideration of the adaptive capacity, hazard, and sensitivity [55,56]. However, because this study is not an analysis focused on vulnerability, the indicators were selected by limiting them to physical conditions with difficult climate change responses [57]. Vulnerability assessments can be performed using various available indicators depending on regional conditions or data availability [52]. This concept has been limited to “social vulnerability” [53,58] or has been applied in consideration of sociodemographic variables and built environment variables [59] in many existing studies.
Lastly, the final 18 indicators were selected in consideration of the above review process and data acquisition. All indicators in this study were collected in the Eup (town), Myeon (town), and Dong (town) regional units.

2.3. Spatial and Statistical Analyses

A spatial analysis was conducted to identify areas of high risk for climate change impacts, and statistical analyses were performed to demonstrate the risk differences between the sites with and without urban regeneration sites for heat waves, heavy precipitation, and sea level rise. For the spatial analysis, the risk attribute values of each regional unit (Eup, Myeon, and Dong) were input and visualized with a geographic information system (GIS) (QGIS 3.14). The data values standardized the hazard, vulnerability, and exposure value in each regional unit. The data values were standardized to perform a relative comparison for each indicator. The standardization formula is as follows:
Z   = X m σ
Each standardized score was summed to classify the risk into five levels. As a result, the GIS maps show the risk classified from Grade 1 to Grade 5 (Grade 5 in red is the highest risk, and Grade 1 is the lowest risk).
Pearson’s correlation statistical significance was used to compare the urban regeneration indicators and climate change risk indicators derived in this study, and a logistic regression analysis was used to determine the indicators that affect the climate change risk score. Specifically, logistic regression sets the urban regeneration sites to 1 and the sites without urban regeneration to 0 to determine the significant variables of the total risk analysis and the risk analysis of each climate change impact. The following equation applies the natural logarithm by applying odds (probability that a specific event does or does not occur) to a logistic regression function. It functions as a linear function through the following logit transformation and enables us to analyze the significant independent variables depending on whether a site is an urban regeneration site.
In P Y = 1 | X = x 1 , , x p 1 p Y = 1 | X = x 1 , , x p = β 0 + x 1 β 1 + + x p β p
Correlation and logistic regression were performed using the SPSS 16 and R programs.

2.4. Research Process

This study aims to identify the relationship between urban regeneration indicators and climate change risk indicators. First, maps were generated for each area to show the degree of risk for flooding, urban heat, and rising sea level in each regional unit. The maps describe the hazards, exposure, and vulnerability of climate change risks. Additionally, by analyzing these maps, the areas where people are strongly affected by natural disasters such as heat waves, heavy precipitation, and sea level rise can be easily determined.
Next, a correlation analysis was performed between the urban regeneration indicators and climate change risk indicators. Five urban regeneration indicators and 13 indicators of climate change risk were used for Pearson’s correlation.
Lastly, Pearson’s correlation test was performed to analyze the climate change risks between the urban regeneration areas and sites without urban regeneration. Forty-seven urban regeneration sites and 167 sites without urban regeneration were used to compare the degree of risk for climate change impacts. The results of this comparison analysis can be used to develop the climate change adaptation process.

3. Results

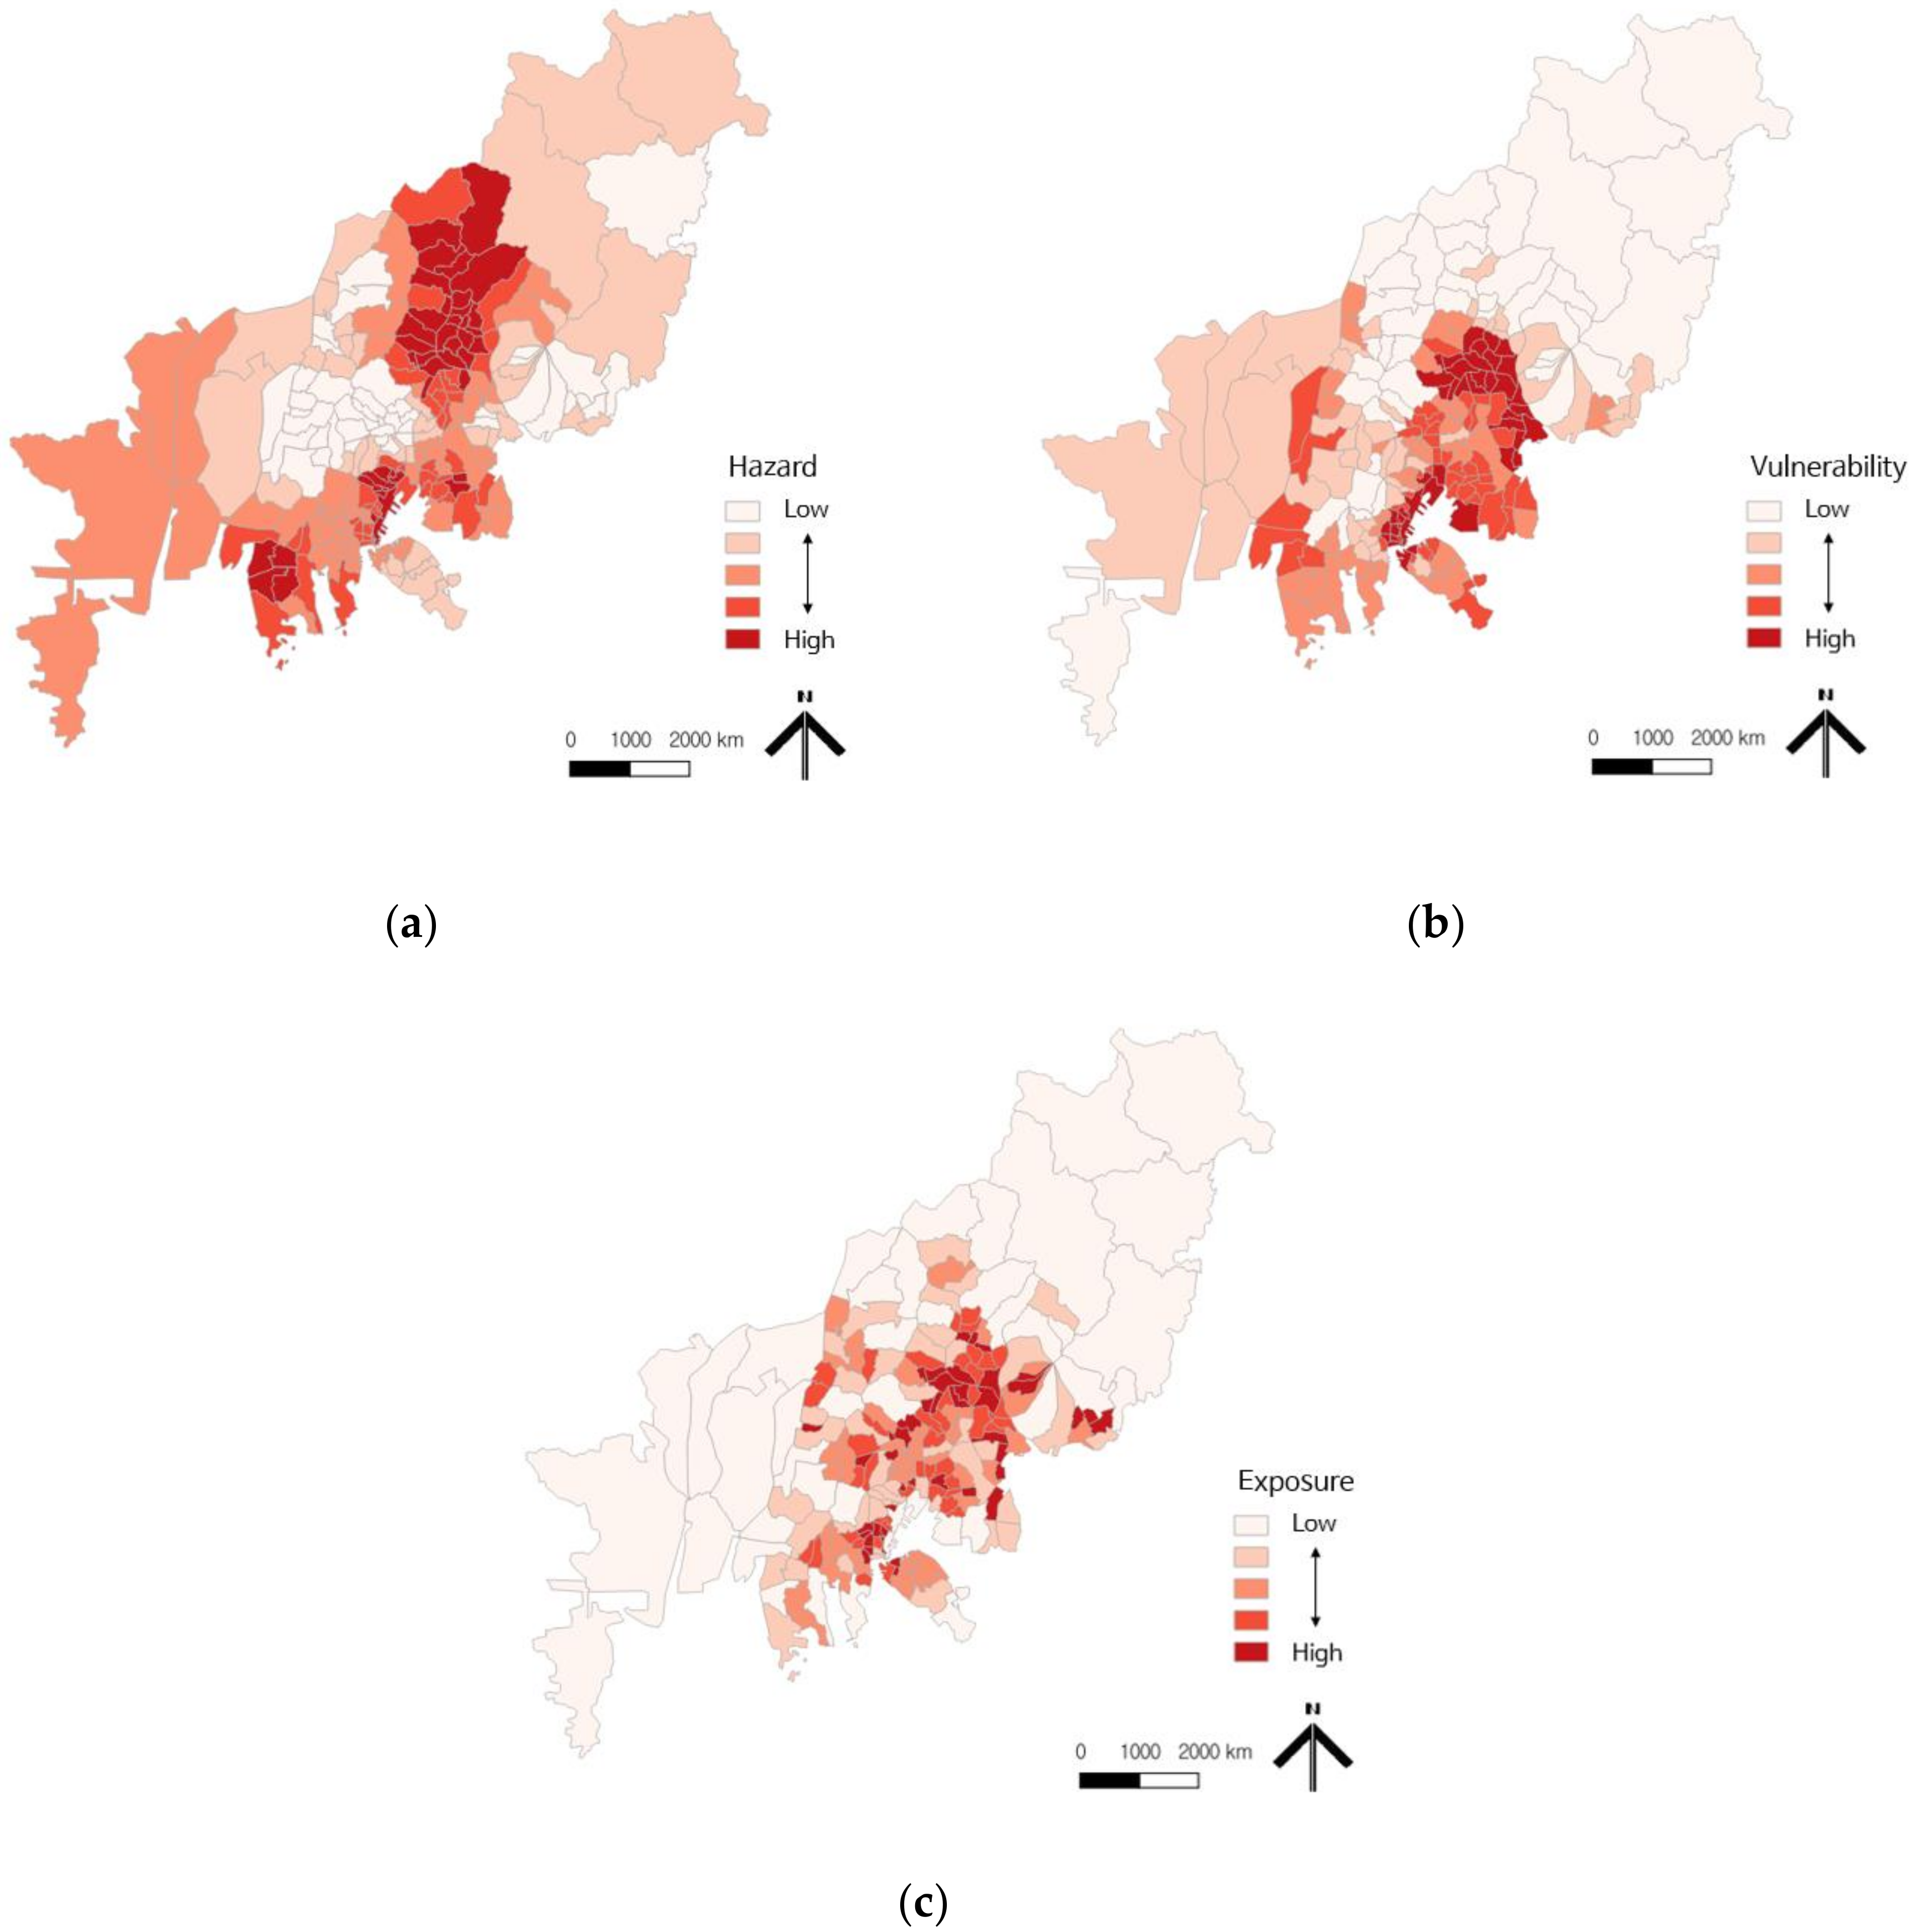
3.1. Climate Change Risk Assessment by Regional Unit (Eup, Myeon, and Dong)

In this section, climate change risk maps (generated with GIS) by regional units are compared for heavy precipitation, heat waves, and sea level rise. The figures below show these maps further divided into hazards, vulnerabilities, and exposure; regions with colors closer to red have a higher risk. The detailed results are as follows:

3.1.1. Heat Wave

Heat wave maps were generated using GIS based on the indicator value affecting the heat wave risk, as described above (Figure 3). The hazard values of several sea-side and central areas were high. Areas with high heat wave hazards were Myeongryun-dong, Boksan-dong, and Sazick 3-dong with high year-round annual maximum temperatures over 33 °C, and Sinpyeong 1-dong and Yeongju 1-dong with “tropical nights.” Particularly, a temperature of 33 °C or higher had a substantial effect on the overall heat wave hazard value. Additionally, most urban regeneration sites have a relatively high number of “tropical nights.” In contrast to areas vulnerable to heavy precipitation, those vulnerable to heat waves were concentrated in the center of the study area. For example, Beomil 5-dong is one of the urban regeneration sites with the highest vulnerability value based on the “average altitude” score. This site also has a relatively high percentage of “impervious areas.” The heat wave exposure value correlates to the population density and is the same as the heavy precipitation result above. Specifically, Bugok 4-dong, Seo 2-dong, and Jwa 1-dong have the highest population densities in the area, and many urban regeneration sites also have a relatively high population density (e.g., Gaya 1-dong, Bosu-dong, Sujeong 1-dong, and Bugok 4-dong).

3.1.2. Heavy Precipitation

The regional distribution of heavy precipitation was concentrated in the central area close to the sea (Figure 4). In particular, Danggam 1-dong showed the highest precipitation exposure value in the study area, with 3.4 “days of precipitation over 80 mm.” Although there was no regional pattern of vulnerability for heavy precipitation, the value was relatively high at both edges of the study area. Gupo 3-dong had the highest vulnerability based on “flood damage area,” and Daejeo 2-dong had the highest vulnerability based on “low land area.” The exposure maps show the degree of population density, with high values in the relatively small area of the old town (mostly in urban regeneration sites). The details are the same as those of the heat wave exposure results.

3.1.3. Sea Level Rise

Sea level rise mapping, as described, was confined to regions near the sea (Figure 5). The sea level rise hazard results showed no regional characteristics, but relatively high hazard values occurred in the east coast region. Jangan-eup, located at the southern end of the East Sea, showed the highest hazard from both sea level rise height and sea temperature. Jung 1-dong and Jung 2-dong in Haeundae-gu also had high hazards based on the “sea temperature rise rate.” For the vulnerability maps, the results of Noksan-dong based on “urbanization rate within 1 km from coastline” and Yeongsun 2-dong based on “average slope of coastal area” were the highest vulnerability among the sites, and the values of the other regions were low overall. The value that primarily affected the vulnerability value was the coastal slope. Sea level rise exposures were high in the northern port areas of old neighborhoods.

3.2. Correlations between Urban Regeneration Indicators and Climate Change Risk Indicators

We analyzed the correlations between the five indicators used to select sites for urban regeneration projects in Korea and the climate change risk set. At the 95% confidence level and above, there were 14 significant relationships (Table 3), indicating that urban regeneration indicators and climate change risk indicators are highly correlated. In particular, the age index and proportion of old buildings were found to be highly correlated with most of the climate change indicators. For example, the positive correlations between the age index and annual average maximum temperature over 33 °C (r = 0.344, p = 0.000) and between the age index and the impervious area ratio (r = 0.358, p = 0.000) indicate the number of elderly people exposed to climate change risks. The positively significant correlation between old building rate and population density (r = 0.302, p = 0.000) also needs to be emphasized because a high population density at sites with dense old buildings means more exposure to climate change risks. This analysis primarily demonstrated that sites with a high potential for urban regeneration could be more vulnerable to climate change risks.

3.3. Differences in Climate Change Risk between Urban Regeneration Sites and Other Sites

The analysis results of the differences in climate change risks between areas with and without urban regeneration sites are given below. The standardized scores of hazard, exposure, and vulnerability based on two conditions (urban regeneration sites: 1, other sites: 0) were compared using a logistic regression model.
The Hosmer–Lemeshow test was performed to confirm the goodness of fit of the model. The test result was 0.890, indicating the suitability of the model. The Nagelkerke R square, which represents the variation explained by this model, was 0.325. That is, this model explains 32.5% of the variability in the dependent variable. The degree of accuracy of the model prediction was analyzed through classification predictiveness and showed a high goodness of fit of 79.0% (Table 4). The significant variables were exposure and vulnerability in the comparison between variables with and without urban regeneration sites as dependent variables and three risk type variables were independent variables. As the Exp(B) values of all the significant variables were one or higher, the urban regeneration sites had higher exposure and vulnerability (Table 5). Figure 6 compares the different degree of risk between urban regeneration sites and other sites.
Based on the above results, we determined which detailed variables for each climate change risk (heat wave, heavy precipitation, and sea level rise) explained the difference between urban regeneration sites and other sites.
First, in the heat wave model, the value of the Hosmer–Lemeshow test was 0.995, which is considered to be a good fit. The Nagelkerke R square of this model was 23.2%, which is also considered appropriate. The degree of accuracy of the model prediction showed a high goodness of fit of 79.0% (Table 6). Table 7 describes how the heat wave variables can be affected if the site is an urban regeneration site. In detail, the variables in the equations of this model that explained the significant variations are “annual average maximum temperature over 33 °C” (hazard) and “population density” (exposure). This finding can be interpreted to indicate that urban regeneration sites are exposed to higher summer temperatures and have a higher population density, indicating a higher potential for damage.
The following is a model analysis related to heavy precipitation. The fit of the Hosmer–Lemeshow test for this model was 0.307, and the Nagelkerke R square was 0.372, which was relatively high. The degree of accuracy of the model prediction indicated a high goodness of fit of 82.2% (Table 8). Focusing on the influence of the model (Table 9), the positive influences of both “days of precipitation over 80 mm” (hazard) and “flood damage area” (vulnerability) are significant. This finding means that the urban regeneration sites are impacted by heavy precipitation more than sites without urban regeneration; vulnerability from heavy precipitation is also high because of the existing flooded areas.
Unlike the other climate change risks, sea level rise was only analyzed for sites in the Eup, Myeon, and Dong regional units near the sea. The Hosmer–Lemeshow test result was 0.315 in this model, but the model explanation was insufficient at 0.046. Additionally, because the influence of all variables in the model equation was found to be insignificant, an interpretation for the data in Table 10 and Table 11 was not performed.

4. Discussion and Conclusion

4.1. Climate Change Risk in Urban Regeneration Sites

This study analyzed spatial differentiation and the degree of impact among climate change risk indicators from the perspective that urban regeneration sites could be more vulnerable to climate change risks. By demonstrating that urban regeneration sites are vulnerable to climate change, this study suggests improvements for future urban regeneration projects. The primary results of this study prove that urban regeneration sites have a higher risk of climate change impacts than sites without urban regeneration.
In the results of the study, it is important to emphasize that there were strong relationships between the urban regeneration indicators and climate change risk indicators (age index and annual average maximum temperature over 33 °C, age index, and impervious area). These results agree with a previous study [14]. Furthermore, future urban regeneration areas and current urban regeneration sites are likely to be vulnerable to climate change. Several studies [36,59,66] considered vulnerability, which may increase susceptibility to climate change, to be critical to consider when dealing with climate change adaptation strategies. The elderly population is especially vulnerable to climate change [36], and building shelters to avoid heat waves or heavy precipitation is required where the elderly population is concentrated. The comparison between the old building rate and climate change risk indicators (impervious area and average altitude) requires a different method of interpretation. The old buildings tend to be found at higher altitudes (r = 0.392, p = 0.000), and smaller flooded areas (r = −407, p = 0.000) are more likely a result of regional specificity than a low risk of climate change impact. The topography of Busan is typically surrounded by mountains, and residential areas are mostly located at the base of the mountains. Therefore, many old buildings in less developed areas are located at the base of the mountains. A high altitude is a factor that reduces the hazard of heat waves; but, in this case, it must be considered separately from housing convenience.
In this study, climate change risk was separated into hazard, vulnerability, and exposure. When comparing these three components of climate change risks between the sites with and without urban regeneration areas, only vulnerability and exposure were significant. This result means that urban regeneration sites have a higher vulnerability and higher exposure than the other sites. As the hazards of climate change risks are climate factors beyond our control, we must consider how vulnerability and exposure should be controlled and reflected in the spatial plan. In reference to previous studies, Mabon et al. (2019) [67] argued that increasing the greening rate and creating wind corridors could reduce heat waves. These green areas also enable us to cope with heavy precipitation. Park (2015) [50] showed that areas with a high risk of climate change impacts need to minimize exposure by, for example, migrating populations. As such, various planning methods for reducing climate change risks in urban regeneration sites need to be proposed, and urban regeneration planning and projects that can minimize the risk should be promoted by considering the results derived in this study. This process should reflect regional specificity and manage climate change risk components.
Finally, urban regeneration sites can be evaluated from cultural, social, and environmental perspectives. However, it should be emphasized that safety, including evaluating climate change risks, should be prioritized over basic needs for residents. Practical methods that prioritize safety in urban regeneration can be broadly divided into political methods and those that can be solved within the scope of urban regeneration projects. The political method is to establish the basic direction of cities by country, to diagnose climate change risks in advance in various high-level laws that implement land use planning, and to make environmentally friendly design guidelines mandatory. This is an extensive management direction that is different from selecting a disaster risk zone at the local government level and preparing a countermeasure. The other method is the preparation of indicators to evaluate the degree of climate change risk in addition to the physical or demographic characteristics of areas selected for urban regeneration projects at the national level. The climate change risk indicators specified in this study can also be reflected, and climate change adaptation strategies (Low Impact Development; LID, green roof, green wall, water proof, cool pavement, etc.) should be included in the analysis of urban regeneration master plans to minimize the risks in areas vulnerable to specific climate change risks.
Cities are declining and being replaced by new ones, and the paradigm of urban regeneration worldwide will continue to be of great concern to our society. The significance of this study is the identification of fundamental issues of urban regeneration, which is being implemented as an alternative to urban development.

4.2. Climate Change Adaptation Strategies and Policies Targeted at Urban Regeneration Sites

In addition to the overall comparison of climate change risks between sites with and without urban regeneration areas, this study specified the impact relationship for each climate change risk (heat wave, heavy precipitation, and sea level rise). Regarding heat waves, urban regeneration sites have a higher “annual average maximum temperature over 33 °C” and a higher “population density” in the exposure component. “Population density”, in particular, has been used to demonstrate the risk of climate change impacts in previous studies [50,57]. Urban regeneration sites in the study area are more likely to be vulnerable to heat wave effects, as residential areas are mostly clustered. Restricting the population inflow or migrating areas with high risks of climate change impact to new sites could be a strategy to reduce the risk. Regarding heavy precipitation, urban regeneration sites had more “days of precipitation over 80 mm” and more flood damage areas. This result means that both hazard and vulnerability are higher in urban regeneration sites than in sites without urban regeneration. Specifically, urban regeneration sites that have been flooded in the past can suffer similar damage in the future if precautions are not taken. The difference between sites with and without urban regeneration regarding sea level rise was not significant. This result indicates that there was no significant difference in the risk value (sea temperature rise rate and sea level rise) between the sites. Low sample numbers from confined ocean-facing sites could also be a major cause of this result. As a spatial strategy to reduce sea level rise risk, urban permeable surfaces, pilots, and raised buildings have been proposed [68]; however, the most fundamental alternative is to refrain from constructing new bridges and cities near the erosion-prone areas.
Spatial strategies to reduce the risk of climate change impacts are very important, but the links with policy should be emphasized [40,69]. Howarth et al. [40] demonstrated the relationship between adaptation policy and risk reduction, and Rivera and Wamsler [70] determined that climate change adaptation can be effectively reflected in their policies and frameworks, such as disaster risk reduction, environmental management, and urban planning. When considering the situation in South Korea, it is most reasonable to assess climate change risks before selecting the criteria for urban regeneration. The climate change risk indicators derived from this study could be used for this purpose. This study will support policy as a strategy to regenerate a declining city and assist in building a resilient city in response to climate change risks. Even if the preceding criteria are not met, it is necessary to mandate that climate change risk assessments be analyzed after sites are selected as urban regeneration projects. The degree of risk assessed in this way can contribute not only to risk reduction but also to a proper understanding of the characteristics of the region.

4.3. Limitations and Future Study

This study has several limitations. First, because the climate change risk maps derived in this study are a relative comparison between sites, it is impossible to identify the absolute value that needs to be addressed immediately. Therefore, an absolute value needs to be established for future climate change risks based on past risks from climate change impacts. Second, because we limited the indicator on exposure to “population density”, presenting detailed spatial strategies related to exposure was difficult. Future studies should reflect various indicators by classifying exposure to human and natural systems. Finally, the sample numbers were low when comparing sea level rise among the urban regeneration sites.
We will further develop our research by determining the absolute values for climate change risks, expanding the indicators of climate change risks, and specifying the policies that can be implemented to reduce the risk of climate change impacts based on the results of this study in the near future.

Author Contributions

Conceptualization, Y.K. and E.-J.K.; methodology, Y.K. and S.S.; validation, K.K. and J.J.; investigation, K.K. and J.J.; data curation, Y.K. and E.-J.K.; writing—original draft preparation, Y.K.; writing—review and editing, E.-J.K., K.K. and J.J.; visualization, S.S.; supervision, Y.K.; funding acquisition, Y.K. All authors have read and agreed to the published version of the manuscript.

Funding

This research was funded by a basic research program through the National Research Foundation of Korea (NRF) under the Ministry of Education (grant no. 2017R1D1A3B03032120). The APC was also funded by the NRF.

Conflicts of Interest

The authors declare no conflicts of interest.

References

  1. Omar, S.S.; Sakip, S.R.M.; Akhir, N.M. Bringing the new to the old: Urban regeneration through public arts. Procedia Soc. Behav. Sci. 2016, 31, 515–524. [Google Scholar] [CrossRef] [Green Version]
  2. Hurtado, S.D.G. Is EU urban policy transforming urban regeneration in Spain? Answers from an analysis of the Iniciativa Urbana (2007–2013). Cities 2017, 60, 402–414. [Google Scholar] [CrossRef]
  3. Ince, C.D.; Aslan, B. Monitoring the effects of land sizes on private property transformation in an urban regeneration project by regression analysis: Erenler Cedit case study, Kocaeli. Sustain. Cities Soc. 2019, 50, 101632. [Google Scholar] [CrossRef]
  4. Natividade-Jesus, E.; Almeida, A.; Sousa, N.; Coutinho-Rodrigues, J. A case study driven integrated methodology to support sustainable urban regeneration planning and management. Sustainability 2019, 11, 4129. [Google Scholar] [CrossRef] [Green Version]
  5. Bartocci, L.; Picciaia, F. Looking for new paths to realize cross-sector collaboration for urban regeneration: The case of Castel del Giudice (Italy). Sustainability 2020, 12, 292. [Google Scholar] [CrossRef] [Green Version]
  6. Yu, S.; Yeo, G. Development of urban regeneration indicators for climate change and selection of targeted areas for urban regeneration: Focused on Seoul-si. J. Korean Urban Manag. Assoc. 2015, 28, 77–99. [Google Scholar]
  7. Wang, G.; Lee, B.; Jung, Y.; Lee, J.; Yu, S.; Noh, G.; Min, G.; Ha, T. A Study on the Regulation Establishment Plan and Policy Issue for Climate Change Corresponding Urban Regeneration; KRIHS: Sejong, Korea, 2013. [Google Scholar]
  8. Kamal-Chaoui, L.; Alexis, R. Competitive Cities and Climate Change; OECD Regional Development Working Papers N° 2; OECD Publishing: Paris, France, 2009. [Google Scholar]
  9. Kim, J. The Analysis of planning method and case study for Model ‘Climate Change Adaptation City’. Kieae J. 2012, 12, 13–19. [Google Scholar] [CrossRef] [Green Version]
  10. BMVBS (Bundesministerium für Verkehr, Bau und Stadtentwicklung); BBR (Bundesamt für Bauwesen und Raumordnung). Folgen des Klimawandels: Gebaeude und Baupraxis in Deutschland; BBR-Online-Publikation: Bonn, Germany, 2008. [Google Scholar]
  11. NRW (Ministerium fuer Klimaschutz, Umwelt, Landwirtschaft, natur-und Verbraucherschutz des Landes Nordrhein-Westfalen). Handbuch Stadtklima; Mediatem Erftstadt: Dusseldorf, Germany, 2011.
  12. Birkmann, J.; Schanze, J.; Müller, P.; Stock, M. Anpassung an den Klimawandel durch Raeumliche Planung–Grundlagen, Strategien, Instrumente; E-Paper der ARL: Hannover, Germany, 2012. [Google Scholar]
  13. Xu, L.; Wang, X.; Liu, J.; He, Y.; Tang, J.; Nguyen, M.; Cui, S. Identifying the trade-offs between climate change mitigation and adaptation in urban land use planning: An empirical study in a coastal city. Environ. Int. 2019, 133, 105162. [Google Scholar] [CrossRef]
  14. Han, S. Disaster prevention urban planning for Busan urban regeneration area. Busan Dev. Forum 2015, 156, 107–111. [Google Scholar]
  15. Sanchez, F.; Solecki, W.D.; Batalla, C.R. Climate change adaptation in Europe and the United States: A comparative approach to urban green spaces in Bilbao and New York City. Land Use Policy 2018, 79, 164–173. [Google Scholar] [CrossRef]
  16. Naboni, E.; Natanian, J.; Brizzi, G.; Florio, P.; Chokhachian, A.; Galanos, T.; Rastogi, P. A digital workflow to quantify regenerative urban design in the context of a changing climate. Renew. Sustain. Energy Rev. 2019, 113, 109255. [Google Scholar] [CrossRef]
  17. Cho, S. The Study of Sustainable Development Considering Humanistic Environment. Master’s Thesis, Hongik University, Seoul, Korea, 2008. [Google Scholar]
  18. Mersal, A. Sustainable Urban Futures: Environmental Planning for Sustainable Urban Development. Procedia Environ. Sci. 2016, 34, 49–61. [Google Scholar] [CrossRef] [Green Version]
  19. Han, W.; Kang, K. Urban Planning Policy and implications for climate change in The Netherlands and Germany. Plan. Policy 2017, 433, 92–101. Available online: https://library.krihs.re.kr/dl_image2/IMG/05/000000022405/SERVICE/000000022405_01.PDF (accessed on 5 February 2020).
  20. Lin, Z. Ecological urbanism in East Asia: A comparative assessment of two eco-cities in Japan and China. Landsc. Urban Plan. 2018, 179, 90–102. [Google Scholar] [CrossRef]
  21. Fang, C.; Cui, X.; Li, G.; Bao, C.; Wang, Z.; Ma, H.; Sun, S.; Liu, H.; Luo, K.; Ren, Y. Modeling regional sustainable development scenarios using the Urbanization and Eco-environment Coupler: Case study of Beiging-Tianjin-Hebei urban agglomeration, China. Sci. Total Environ. 2019, 689, 820–830. [Google Scholar] [CrossRef] [PubMed]
  22. Kim, H.; Jang, Y. Lessons from good and bad practices in retail-led urban regeneration projects in the Republic of Korea. Cities 2017, 61, 36–47. [Google Scholar] [CrossRef]
  23. Serrano-Jimenez, A.; Lima, M.L.; Molina-Huelva, M.; Barrios-Padura, A. Promoting urban regeneration and aging in place: APRAM an interdisciplinary method to support decision-making in building renovation. Sustain. Cities Soc. 2019, 47, 101505. [Google Scholar] [CrossRef]
  24. Lim, H.; Kim, J.; Potter, C.; Bae, W. Urban regeneration and gentrification: Land use impacts of the Cheonggye Stream Restoration Project on the Seoul’s central business district. Habitat Int. 2013, 39, 192–200. [Google Scholar] [CrossRef]
  25. Pobric, A.; Robinson, G.M. Recent urban development and gentrification in post-Dayton Sarajevo, Bosnia and Herzegovina. Cities 2019, 89, 281–295. [Google Scholar] [CrossRef]
  26. Korkmaz, C.; Balaban, O. Sustainability of urban regeneration in Turkey: Assessing the performance of the North Ankara Urban Regeneration Project. Habitat Int. 2020, 95, 102081. [Google Scholar] [CrossRef]
  27. Cho, M.; Kim, J. Coupling urban regeneration with age-friendliness: Neighborhood regeneration in Jangsu Village, Seoul. Cities 2016, 58, 107–114. [Google Scholar] [CrossRef]
  28. Hong, Y. Resident participation in urban renewal: Focused on Sewoon Renewal Promotion Project and Kwun Tong Town Centre Project. Front. Archit. Res. 2018, 7, 197–210. [Google Scholar] [CrossRef]
  29. Cho, G.; Kim, J.; Lee, G. Announcement effects of urban regeneration plans on residential property values: Evidence from Ulsan, Korea. Cities 2020, 97, 102570. [Google Scholar] [CrossRef]
  30. Peng, Y.; Lai, Y.; Li, X.; Zhang, X. An alternative model for measuring the sustainability of urban regeneration: The way forward. J. Clean. Prod. 2015, 109, 76–83. [Google Scholar] [CrossRef]
  31. Al-Harami, A.; Furlan, R. Qatar National Musiem-Transit oriented development: The masterplan for the urban regeneration of a ‘green TOD’. J. Urban Manag. 2020, 9, 115–136. [Google Scholar] [CrossRef]
  32. Rosa, D.L.; Privitera, R.; Barbarossa, L.; Greca, P.L. Assessing spatial benefits of urban regeneration programs in a highly vulnerable urban context: A case study in Catania, Italy. Landsc. Urban Plan. 2017, 157, 180–192. [Google Scholar] [CrossRef]
  33. Brooks, N. Vulnerability, risk and adaptation: A conceptual framework. Tyndall Centre for Climate Change Research. Tyndall Cent. Clim. Change Res. Work. Pap. 2003, 38, 1–16. Available online: http://repositories.cdlib.org/ucias/breslauer/6 (accessed on 5 February 2020).
  34. Webb, J. Making climate change governable: The case of the UK climate change risk assessment and adaptation planning. Sci. Public Policy 2011, 38, 279–292. [Google Scholar] [CrossRef]
  35. Aven, T. The risk concept: Historical and recent development trends. Reliab. Eng. Syst. Saf. 2012, 99, 33–44. [Google Scholar] [CrossRef]
  36. IPCC (Intergovenmental Panel on Climate Change). Climate Change 2014: Impact, Adaptation, and Vulnerability. IPCC WG II; Cambridge University Press: Cambridge, UK, 2014. [Google Scholar]
  37. Dickson, E.; Baker, J.L.; Hoornweg, D.; Tiwari, A. Urban Risk Assessments: Understanding Disaster Climate Risk Cities; The World Bank: Washington, DC, USA, 2012. [Google Scholar]
  38. Lawrence, J.; Reisinger, A.; Mullan, B.; Jackson, B. Exploring climate change uncertainties to support adaptive management of changing flood-risk. Environ. Sci. Policy 2013, 33, 133–142. [Google Scholar] [CrossRef]
  39. Taylor, A.L.; Dessai, S.; Bruine de Bruin, W. Public perception of climate risk and adaptation in the UK: A review of the literature. Clim. Risk Manag. 2014, 4, 1–16. [Google Scholar] [CrossRef] [Green Version]
  40. Howarth, C.; Morse-Jones, S.; Brooks, K.; Kythreotis, A.P. Co-producing UK climate change adaptation policy: An analysis of the 2012 and 2017 UK climate change risk assessments. Environ. Sci. Policy 2018, 89, 412–420. [Google Scholar] [CrossRef]
  41. Son, M.; Park, J.; Kim, H. Urban Environmental Risk: Evaluating flooding risk indices of Seoul. Seoul Urban Res. 2013, 14, 127–140. [Google Scholar]
  42. Bar, R.; Rouholahnejad, E.; Rahman, K.; Abbaspour, K.C.; Lehmann, A. Climate change and agricultural water resources: A vulnerability assessment of the Black sea catchment. Environ. Sci. Policy 2015, 46, 57–69. [Google Scholar] [CrossRef]
  43. Aerts, J.C.J.H.; Botzen, W.J.W. Climate change impacts on pricing long-term flood insurance: A comprehensive study for the Natherlands. Glob. Environ. Change 2011, 21, 1045–1060. [Google Scholar] [CrossRef]
  44. Park, J.Y.; Yoo, J.Y.; Lee, M.; Kim, T. Assessment of drought risk in Korea: Focused on data-based drought risk map. J. Civ. Eng. 2012, 32, 203–211. [Google Scholar] [CrossRef] [Green Version]
  45. Terzi, S.; Torresan, S.; Schneiderbauer, S.; Critto, A.; Zebisch, M.; Marcomini, A. Multi-risk assessment in mountain regions: A review of modelling approaches for climate change adaptation. J. Environ. Manag. 2019, 232, 759–771. [Google Scholar] [CrossRef]
  46. Yoo, G.; Kim, I. Development and Introduction of Climate Change Vulnerability Assessment Indicators; Korea Environment Institute: Seoul, Korea, 2008. [Google Scholar]
  47. Shin, H.; Lee, S. Development of a Climate Change Vulnerability Index on the Health Care Sector. J. Environ. Policy 2014, 13, 69–93. [Google Scholar] [CrossRef]
  48. Kang, J.; Oh, K. Establishing flood vulnerability assessment indices for climate change adaptation and its application: The case of the Seoul metropolitan area. J. Korean Urban Manag. Assoc. 2014, 27, 43–67. [Google Scholar]
  49. Kim, S.; Park, C.; Byun, B. Urban Management Strategies based on Climate Change Risk Assessment. Geogr. J. Korea 2015, 49, 479–490. [Google Scholar]
  50. Park, C.S. Climate-Environmental Risk Outlook and National Strategy(II), 1st ed.; Korea Environment Institution: Sejong, Korea, 2015. [Google Scholar]
  51. Kim, J.; Oh, G. A study on the Evaluation and Selection of Proposed Site of Urban Regeneration through Urban Diagnostic Indicators and Qualitative Analysis. Archit. Inst. Korea 2018, 20, 51–58. Available online: https://www.earticle.net/Article/A326123 (accessed on 17 April 2020).
  52. Ryu, S.; Lim, N. An analysis of the urban regeneration priority regions project using quantitative evaluation indicators: In case study of Cheonan priority regions. J. Archit. Inst. Korea Plan. Des. 2019, 10, 83–90. [Google Scholar] [CrossRef]
  53. Koks, E.E.; Jongman, B.; Husby, T.G.; Botzen, W.J.W. Combining hazard, exposure, and social vulnerability to provide lessons for flood risk management. Environ. Sci. Policy 2015, 47, 42–52. [Google Scholar] [CrossRef]
  54. Nguyen, K.; Liou, Y.; Terry, J.P. Vulnerability of Vietnam to typhoons: A spatial assessment based on hazards, exposure, and adaptive capacity. Sci. Total Environ. 2019, 682, 31–46. [Google Scholar] [CrossRef]
  55. Hasan, M.K.; Kumar, L. Comparison between methorological data and farmer perceptions of climate change and vulnerability in relation to adaptation. J. Environ. Manag. 2019, 237, 54–62. [Google Scholar] [CrossRef]
  56. Neset, T.; Wirehn, L.; Opach, T.; Glaas, E.; Linner, B. Evaluation of indicators for agricultural vulnerability to climate change: The case of Swedish agriculture. Ecol. Indic. 2019, 105, 571–580. [Google Scholar] [CrossRef]
  57. Kang, Y.; Park, C.S.; Park, J.; Cho, D. Spatial differences in the heavy precipitation risk intensity in South Kroea. Hum. Ecol. Risk Assess. 2018, 24, 1579–1594. [Google Scholar] [CrossRef]
  58. Huynh, L.T.M.; Stringer, L.C. Multi-scale assessment of social vulnerability to climate change: An empirical study in coastal Vietnam. Clim. Risk Manag. 2018, 20, 165–180. [Google Scholar] [CrossRef]
  59. Houghton, A.; Castillo-Salgado, C. Analysis of correlations between neighborhood-level vulnerability to climate change and protective green building design strategies: A spatial and ecological analysis. Build. Environ. 2020, 168, 106523. [Google Scholar] [CrossRef]
  60. José, M.E.; Aiste, B.; Audrone, T. Multilevel analysis of climate change risk perception in Europe: Natural hazards, political contexts and mediating individual effects. Saf. Sci. 2019, 120, 813–823. [Google Scholar] [CrossRef]
  61. Osman, B. The Use of Indicators to Assess Urban Regeneration Performance for Climate-Friendly Urban Development: The Case of Yokohama Minato Mirai 21. Spat. Plan. Sustain. Dev. 2013, 91–115. Available online: https://www.researchgate.net/publication/260417890_The_Use_of_Indicators_to_Assess_Urban_Regeneration_Performance_for_Climate-Friendly_Urban_Development_The_Case_of_Yokohama_Minato_Mirai_21 (accessed on 7 February 2020).
  62. María, J.R.; Patricia, H.; Vincent, G.; Raquel, A.F. A simplified model to assess vulnerable areas for urban regeneration. Sustain. Cities Soc. 2019, 46. [Google Scholar] [CrossRef]
  63. Brooks, N.; Neil, A.; Mick, K. The Determinants of Vulnerability and Adaptive Capacity at the National Level and the Implications for Adaptation. Glob. Environ. Change 2005, 15, 151–163. [Google Scholar] [CrossRef]
  64. Sanchez, F.; Batalla, C.R. Indicators for Urban Regeneration a Vision from Climate Change Adaptation. REHABEND 2018 Congress. 2018, pp. 352–359. Available online: https://www.researchgate.net/publication/325273358_INDICATORS_FOR_URBAN_REGENERATION_A_VISION_FROM_CLIMATE_CHANGE_ADAPTATION (accessed on 14 February 2020).
  65. Sniffer. Differential Social Impacts of Climate Change in the UK. In Scotland and Northern Ireland Forum for Environmental Research; Project UKCC22; SNIFFER: Edinburgh, UK, 2009; pp. 1–32. [Google Scholar]
  66. He, C.; Zhou, L.; Ma, W.; Wang, Y. Spatial assessment of urban climate change vulnerability during different urbanization phases. Sustainability 2019, 11, 2406. [Google Scholar] [CrossRef] [Green Version]
  67. Mabon, L.; Kondo, K.; Kanekiyo, H.; Hayabuchi, Y.; Yamaguchi, A. Fukuoka: Adapting to climate change through urban green space and the built environment? Cities 2019, 93, 273–285. [Google Scholar] [CrossRef]
  68. Gargiulo, C.; Battarra, R.; Tremiterra, M.R. Costal areas and climate change: A decision support tool for implementing adaptation measures. Land Use Policy 2020, 91, 104413. [Google Scholar] [CrossRef]
  69. O’Donnell, T. Contrasting land use policies for climate change adaptation: A case study of political and geo-legal realities for Australian Coastal locations. Land Use Policy 2019, 88, 104145. [Google Scholar] [CrossRef]
  70. Rivera, C.; Wamsler, C. Integrating climate change adaptation, disaster risk reduction and urban planning: A review of Nicaraguan policies and regulations. Int. J. Disaster Risk Reduct. 2014, 7, 78–90. [Google Scholar] [CrossRef] [Green Version]
Figure 1. Evolution of the urban planning concept regarding the environment (modified after [7]).
Sustainability 12 04032 g001
Figure 2. Map of the urban regeneration projects in Busan, South Korea.
Sustainability 12 04032 g002
Figure 3. Heat wave risk by regional unit (a) Hazard, (b) Vulnerability, and (c) Exposure.
Sustainability 12 04032 g003
Figure 4. Heavy precipitation risk by regional unit (a) Hazard, (b) Vulnerability, and (c) Exposure.
Sustainability 12 04032 g004
Figure 5. Sea level rise by regional unit (a) Hazard, (b) Vulnerability, and (c) Exposure.
Sustainability 12 04032 g005
Figure 6. Differences in climate change risk between urban regeneration sites and other sites. (a) Hazard and exposure; (b) Hazard and vulnerability; (c) Vulnerability and exposure; The points on the plot show the relationships among hazard, vulnerability, and exposure and represent the risk scores of each of the study sites. The x- and y-axis values of the plot are derived by standardization among the detailed variables that compose the climate change risks.
Sustainability 12 04032 g006aSustainability 12 04032 g006b
Table 1. Major urban regeneration New Deal projects in Busan.
YearProjectsDistrict
Phase 1 (2011–2016)Hillside Village Renaissance ProjectJung-gu, Dong-gu,
Seo-gu, Saha-gu,
Dong-gu, Busanjin-gu
-
Maintenance and supply of road infrastructure
-
Building of tourism infrastructure
-
Community improvement
-
Village enterprise operation
Phase 2 (2015–2017)New Garden Village ProjectSeo-gu, Yeongdo-gu,
Saha-gu, Sasang-gu,
Dong-gu, Nam-gu,
Geumjeong-gu, Buk-gu
-
Maintenance of road infrastructure
-
Supply of basic living infrastructure
-
Creation of cultural and tourism infrastructure
-
Community improvement
-
Village enterprise operation
Phase 3 (2017–2018)New Deal ProjectDong-gu, Yeongdo-gu,
Buk-gu, Saha-gu,
Yeonje-gu, Dongnae-gu,
Geumjeong-gu
-
Maintenance of residential areas
-
Expansion of basic living infrastructure
-
Maintenance of road infrastructure
-
Supply of public rent housing
-
Creation of cultural and tourism infrastructure
-
Improvement of traditional market conditions
-
Support of start-up space
-
Construction of business center
-
Use of state-owned land
Table 2. Final assessment indicators for urban regeneration and climate change risk.
Subdivision (Code)Previous ResearchSourceYear
Urban RegenerationPopulationPopulation Change Rate (+)Kim and Oh (2018) [51]
Ryu and Lim (2019) [52]
Wang (2013) [7]
Urban Regeneration Information System
(https://www.city.go.kr/index.do)
2015
Age Index (+)Yu and Yeo (2015) [6]
Maria et al. (2019)
Jose Manuel Echavarren et al. (2019) [60]
2015
IndustryIndustry Rate (+)Kim and Oh (2018) [51]
Ryu and Lim (2019) [52]
Wang (2013) [7]
2014
Rate of Workers (+)Balaban, O. (2013) [61]
Yu and Yeo (2015) [6]
2014
PhysicalOld Building Rate (+)Kim and Oh (2018) [52]
Wang (2013) [7]
Maria et al. (2019) [62]
2016
Climate Change RiskHazard:
Heat wave
Annual Average Maximum Temperature over 33 °C (Day) (+)Kim (2015) [49]
Park (2015) [50]
Korea Meteorological Administration Global Atmosphere Watch
(http://www.climate.go.kr/home/)
2015
Tropical Nights (Day Minimum Temperature over 25 °C) (+)Shin and Lee (2014) [47]2015
Hazard:
Heavy precipitation
Annual Average Maximum Precipitation (+)Kang and Oh (2014) [48]
Kim (2015) [49]
Park (2015) [50]
2015
Days of Precipitation over 80 mm (+)Kim (2015) [49]
Park (2015) [50]
Shin and Lee (2014) [47]
2015
Hazard:
Sea level rise
Sea Temperature Rise Rate (°C/y) (+)Park (2015) [50]2015
Sea Level Rise Rate (mm/y) (+)Park (2015) [50]2015
ExposurePopulation Density (+)Brooks, N. (2005) [63]
Kim (2015) [49]
Park (2015) [50]
Urban Regeneration Information System2015
Vulnerability: Heat waveImpervious Area (+)Kang and Oh (2014) [48]Busan Metropolitan City
(www.busan.go.kr)
2018
Average Altitude (-)Kang and Oh (2014) [48]
Park (2015) [50]
Open Data Portal
(https://www.data.go.kr/)
2018
Vulnerability: Heavy precipitationFlood Damage Area (+)Kim (2015) [49]
Park (2015) [50]
Sanchez, F. (2018) [64]
Detailed Implementation Plan for the Climate Change Adaptation Plan of Busan Metropolitan City2016
Lowland Area/Housing Ratio under 10 m (+)Sniffer. (2009) [65]
Kang and Oh (2014) [48]
Park (2015) [50]
Shin and Lee (2013) [47]
2016
Vulnerability: Sea level riseUrbanization Rate within 1 km from Coastline (+)Yoo and Kim (2008) [46]2016
Average Slope of Coastal Area (+)Park (2015) [50]2016
Table 3. Pearson’s correlation between urban regeneration indicators and climate change risk indicators.
(a)(b)(c)(d)(e)(f)(g)(h)(i)(j)(k)(l)(m)
Population Change Rate (1)r−0.0010.0170.082−0.055−0.057−0.055−0.043−0.024−0.042−0.0520.114−0.073−0.014
Sig.0.9880.8100.2300.4210.4080.4200.5290.7300.5400.4500.0980.2880.840
Age Index (2)r0.344 **−0.267 **−0.1050.268 **0.0590.079−0.0910.358 **0.1420.124−0.064−0.0770.204 **
Sig.0.0000.0000.1250.0000.3920.2510.1850.0000.0370.0700.3520.2610.003
Business Rate (3)r0.112−0.0430.0750.121−0.088−0.0640.121−0.0840.092−0.137 *0.100−0.0970.091
Sig.0.1030.5270.2740.0770.1990.3500.0780.2200.1790.0460.1440.1580.183
Workers Rate (4)r0.087−0.040−0.0950.115−0.0120.0090.117−0.0380.144−0.0710.011−0.0280.043
Sig.0.2070.5590.1670.0930.8560.8940.0880.5780.0350.3040.8680.6840.535
Old Building Rate (5)r0.207 **−0.136 *0.146 *0.276 **−0.083−0.0660.302 **−0.0460.392 **−0.407 **0.106−0.254 **0.047
Sig.0.0020.0470.0330.0000.2290.3340.0000.5000.0000.0000.1210.0000.493
** p < 0.01, * p < 0.05; Urban Regeneration Indicators: (1) Population Change Rate, (2) Age Index, (3) Business Rate, (4) Workers Rate, and (5) Old Building Rate; Climate Change Risk Indicators: (a) Annual Average Maximum Temperature over 33 °C, (b) Tropical Nights, (c) Maximum Annual Average Precipitation, (d) Days of Precipitation over 80 mm, (e) Sea Level Rise, (f) Sea Temperature Rise Rate, (g) Population Density, (h) Impervious Area, (i) Average Altitude, (j) Low Land Area, (k) Flood Damage Area, (l) Urbanization Rate within 1 km from Coastline, (m) Average Slope of Coastal Area.
Table 4. Classification between urban regeneration sites and other sites.
ObservedPredicted
01Percentage Correct
Step 1Type0166199.4
14436.4
79.0
Table 5. Variables in equations for hazard, exposure, and vulnerability.
VariableBS.EWalddfSig.Exp(B)95.0% C.I. for EXP(B)
LowerUpper
Step 1Hazard−0.0350.1830.03710.8480.9660.6751.382
Exposure0.50.1877.16910.007 **1.6491.1442.379
Vulnerability0.50.1916.81310.009 **1.6481.1332.399
Constant−1.3560.17858.35710.000 **0.258
** p < 0.01.
Table 6. Classification between urban regeneration sites and other sites (heat waves).
ObservedPredicted
01Percentage Correct
Step 1Type01561193.4
1341327.7
Overall percentage 79.0
Table 7. Variables in equations for heat wave variables.
VariableBS.EWalddfSig.Exp(B)95.0% C.I. for EXP(B)
LowerUpper
Step 1(a)2.4321.1284.64710.031 *11.3781.247103.811
(b)−0.0070.1660.00210.9670.9930.7171.376
(g)0.0000.0004.09410.043 *1.0001.0001.000
(h)−0.4001.3680.08510.7700.6700.0469.800
(i)−0.0120.0140.82210.3650.9880.9611.015
Constant−2.6431.5472.92010.0880.071
* p < 0.05; Heat Wave Risk Indicators: (a) Annual Average Maximum Temperature over 33 °C, (b) Tropical Nights, (g) Population Density, (h) Impervious Area, (i) Average Altitude.
Table 8. Classification between urban regeneration sites and other sites (heavy precipitation).
ObservedPredicted
01Percentage Correct
Step 1Type0166199.4
1371021.3
Overall percentage 82.2
Table 9. Variables in equations for heavy precipitation variables.
VariableBS.EWalddfSig.Exp(B)95.0% C.I. for EXP(B)
LowerUpper
Step 1(c)3.5151.4685.73610.01733.6271.894597.079
(d)0.0410.01211.75610.001 *1.0421.0181.066
(g)0.0000.0002.71410.0991.0001.0001.000
(j)0.0000.0000.09210.7621.0001.0001.000
(k)0.1120.0388.66010.003 **1.1191.0381.206
Constant−25.5017.33712.08110.0010.000 **
** p < 0.01, * p < 0.05; Heavy Precipitation Risk Indicators, (c) Maximum Annual Average Precipitation, (d) Days of Precipitation over 80 mm, (g) Population Density, (j) Low Land Area, (k) Flood Damage Area.
Table 10. Classification between the urban regeneration sites and other sites (sea level rise).
ObservedPredicted
01Percentage Correct
Step 1Type0410100.0
1700
Overall percentage 85.4
Table 11. Variables in equations for sea level rise variables.
VariableBS.EWalddfSig.Exp(B)95.0% C.I. for EXP(B)
LowerUpper
Step 1(e)0.0660.1890.12210.7271.0680.7371.548
(f)−2.74494.3930.00110.9770.0640.0001.431
(g)0.0000.0000.00110.9761.0001.0001.000
(l)0.0000.0010.08210.7751.0000.9981.001
(m)0.0660.0800.68410.4081.0680.9141.249
Constant−3.4994.7880.53410.4650.030 *
* p < 0.05; Sea Level Rise Risk Indicators, (e) Sea Level Rise, (f) Sea Temperature Rise Rate, (g) Population Density, (l) Urbanization Rate within 1 km from Coastline, (m) Average Slope of Coastal Area.

