Abstract
This paper investigates the historical and future trends in water balance components and their impacts on streamflow. The trend analyses were applied to the daily climatic and hydrologic variables from 109 subbasins in Korea during the historical period and future period obtained by a multimodel ensemble of 13 global circulation models (GCMs) of the Coupled Model Intercomparison Project, Phase 5 (CMIP5). A calibrated hydrologic model, the precipitation-streamflow modeling system (PRMS) model, was applied to obtain hydrologic data. The results revealed apparent trends in streamflow, with increases in spring and decreases in the other seasons during the historical period. The reduction (or increase) in the amount of streamflow was counterbalanced by the reduction (or increase) in precipitation, groundwater, and soil moisture, which was mainly impacted by the increase (or reduction) in actual evapotranspiration. However, opposite trends are projected for the future period for streamflow and water cycle components, in which spring and winter are projected to have increasing trends mostly counterbalanced by the decreasing trends in precipitation and groundwater. The reasons for the reduction in streamflow include elevated evapotranspiration compared to precipitation, reduced soil moisture, and a significant decrease in groundwater recharge. In addition, the results of the seasonal variability among basins revealed higher variability in summer for the historical period and in winter for the future period, with maximum variability in the Sumjin River basin, indicating that streamflow fluctuated more strongly in the Sumjin River basin during the historical and future periods.
1. Introduction
Water demand is increasing worldwide; however, a reliable water supply is not always available. This concern becomes more challenging based on the increasing water demand due to population growth and climate change. Recent studies reported almost negative effects on water resources [1,2]. Rivers provide more than 50% of water demands; however, their streamflow volume is highly impacted by precipitation and temperature variations [3]. Therefore, it is necessary to understand how the water cycle components affect streamflow or are expected to impact streamflow in the future to overcome probable water scarcity by intelligent water resource management.
There is general agreement regarding the increasing trend of temperature by using different climate change scenarios anywhere during the 21st century [3,4]. However, higher temperatures cause an increase in the capacity of water holding and therefore evaporation capacity in the atmosphere, leading to more significant precipitation and droughts [5]. Although an increase in temperature is reported for all seasons of the year, precipitation is projected to increase globally and in many basins; however, a decrease in precipitation is also expected in many other regions [6]. Therefore, climate change can result in significant changes (increase or decrease) in water cycle components due to changes in temperature and precipitation [7,8,9].
The investigation of streamflow variations is crucial for water resource management in each river basin to control floods and droughts. However, because of the impacts of climate change, water resource managers cannot rely on past statistics of streamflow [10]. For this reason, global circulation models (GCMs) are used to describe future climate change [11]. The new generation of GCMs participating in the Coupled Model Intercomparison Project, Phase 5 (CMIP5; Taylor et al., 2012) has advanced physical parametrization and increased horizontal resolution compared to the previous generation of models, such as the Fourth Assessment Report (AR4) [12,13]. For the Fifth Assessment Report (AR5), emission scenarios are denoted as representative concentration pathways (RCPs) [14].
Meehl et al. [15] showed that there is almost consensus regarding the projected changes in temperature between GCMs rather than precipitation. GCM projections are subject to significant sources of uncertainty, such as the structure of the climate models, downscaling methods, and climate internal variability [16], which can impact the projected future scenarios and the results of hydrological impact studies [17]. Therefore, multimodel ensembles (MMEs) of the series of GCM scenarios can improve the accuracy of projections by reducing the uncertainties related to selecting an individual GCM model [18,19].
This climate variability is strongly impacted by the complex geographic conditions in Korea [20], since the climate in Korea has mainly been affected by both the continent and the ocean and exhibits seasonal variability [21]. The results of recent studies showed that the increase in temperature in the Korean Peninsula is approximately two or three times higher than the global average, which may correspond to higher urbanization in this region [21]. The results of previous studies regarding annual precipitation showed a significant increasing trend over Korea for the period 1906–1997 [22]. However, in another study, the annual precipitation and streamflow during the period 1968 to 2001 revealed increasing trends in the northern part and decreasing trends in the southern part of Korea [23]. In addition, Jung et al. [24] showed that the increasing trend in annual precipitation mainly occurred due to aggregated precipitation during the summer season, while spring and winter showed decreasing trends over the period 1973–2005. This high seasonal variability caused significant streamflow variability in Korea [25]. Within this context, it is of interest to us to understand how the seasonal variability in streamflow and the main water cycle components will be changed by the impact of climate change. Therefore, this study assesses the recent and future trends of water cycle components in Korea resulting from the complex geographic and climatic conditions. The aims of this study are to investigate the linear trends in water cycle components, which include precipitation, actual evapotranspiration, soil moisture, groundwater, and streamflow, during historical and future periods. In addition, the Mann-Kendall test was performed to find the significant trends in water cycle components for all subbasins during the historical and future periods to understand how each subbasin changed or how it will change for water cycle components.
2. Data and Methods
2.1. Study Area
South Korea lies between latitudes 34° N and 38° N and longitudes 126° E and 130° E and includes five large river basins: the Han River basin, Nakdong River basin, Geum River basin, Sumjin River basin, and Youngsan River basin (Figure 1). These five large river basins are divided into 109 subbasins based on geographical characteristics (26 subbasins for the Han, 33 subbasins for the Nakdong, 21 subbasins for the Geum, 15 subbasins for the Sumjin, and 14 subbasins for the Youngsan River basins). South Korea has four distinct seasons: spring from March to May, summer from June to August, autumn from September to November, and winter from December to February. However, the climatic conditions vary significantly among the seasons and are dependent on both continental and oceanic effects. The temperature in summer ranges from 22–25 °C due to Pacific high pressure, while in winter, it ranges from −5 °C to −3 °C depending on the elevation. The mean annual precipitation generally increases from north to south with approximately 1500 mm in the middle of Korea [20]. Additionally, approximately 70% of the annual precipitation occurs during the summer, which is the rainy season in Korea; winter is the driest season and constitutes less than 10% of the total annual precipitation. Figure 2 shows the mean monthly values for the minimum temperature, maximum temperature, and precipitation in South Korea.
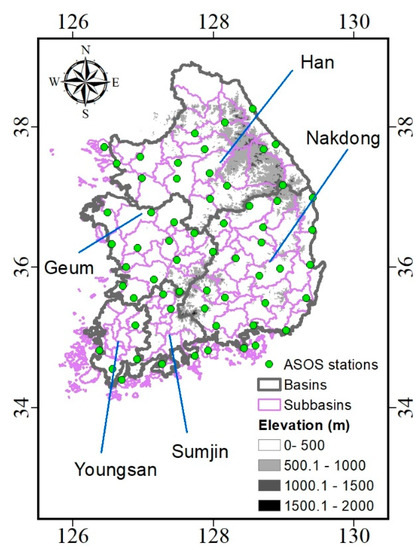
Figure 1.
Study area and locations of the major river basins in Korea.
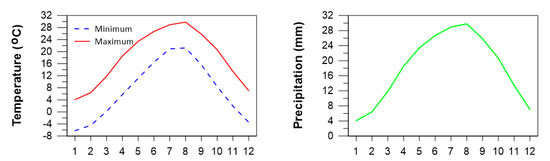
Figure 2.
Mean monthly maximum temperature, minimum temperature, and precipitation in the study area.
2.2. Climate and Hydrologic Data
Daily climate data were used to calibrate the model parameters as well as downscale the GCM scenarios. The observed climate data were extracted from the Ministry of Land, Infrastructure and Transport (MOLIT) and the Korea Meteorological Administration (KMA) from 1966 to 2016. Moreover, the observed daily dam inflow data were extracted from the Korean Water Management Information System (WAMIS) for the six gauged dam basins during the historical period from 1966 to 2016. In addition, the required GIS layers, such as the vegetation type, digital elevation models (DEMs), land use, and soil maps, were obtained from the WAMIS website.
2.3. Hydrologic Model
In this study, a semidistributed model, namely precipitation-streamflow modeling system (PRMS), was used. The minimum data of the PRMS model are daily precipitation, the maximum temperatures, and the minimum temperatures [26,27]. The PRMS model simulates the water and the energy balance for each hydrologic response unit (HRU). In fact, the basins were divided into HRUs according to physiographic characteristics, such as slope, elevation, land use, and geology [10]. The sum of the water and energy balance of the HRUs weighted by area defines the daily streamflow [23,25].
The water balance components in the PRMS model consist of precipitation, evapotranspiration, soil moisture, groundwater, and streamflow. In the PRMS model, the amount of precipitation for each HRU is adjusted by a monthly correlation factor. The potential evapotranspiration (PET) is computed by the Hamon method [28,29]. There are different methods for estimating PET; however; Hamon method is simple and only require the temperature as input and compare to other methods provide reliable estimation of PET [30,31,32,33]. The Hamon method is the temperature-based formula that uses the daily mean temperature () and total sunshine hours (Ld):
where is the saturated vapor pressure (mb), is the saturated vapor density (g/m3) at (°C), and is the monthly coefficient, which has a value of 0.0040 for July and August and a value of 0.0055 for other months, which was obtained using parameter estimation. Moreover, the actual evapotranspiration (AET) is calculated as a function of PET and soil moisture (SM) conditions, which depend on the soil type.
2.4. Climate Change Scenarios
In the present study, first we used 26 CMIP5 GCMs (Table 1) of RCP4.5 for the period between 1976 and 2099. The data of 26 GCMs were collected within 119° E–135° E and 29° N–43° N and clipped to the Korean peninsula to provide daily meteorological data under the same initial conditions of the observed period (from 1976 to 2005). Using the climate projections at the grid points of each GCM, three statistical downscaling methods were applied to downscale the climate projections into the 60 automated synoptic observing system (ASOS) stations as shown in Figure 1. These GCM scenarios were prepared for the Fifth Assessment Report (AR5), which was done by the APEC (Asia-Pacific Economic Cooperation) Climate Center and the Climate Change Adaptation for Water Resources (CCAW). The procedure for selecting 13 GCMs from 26 GCMs is shown in Figure 3. The 13 GCM scenarios of RCP 4.5 used in this study are CMCC-CM, CESM1-BGC, MRI-CGCM3, CNRM-CM5, HadGEM2-AO, HadGEM2-ES, INM-CM4, IPSL-CM5A-MR, CMCC-CMS, NorESM1-M, GFDL-ESM2G, IPSL-CM5A-LR, and CanESM2, which are the first 13 GCMs of Table 1. The description and characteristics of the mentioned GCMs are shown in Ghafouri-Azar and Bae [34]. More information about this procedure was explained in Cannon et al. [35] and Eum and Cannon [13].

Table 1.
Description of 26 GCMs of this study.
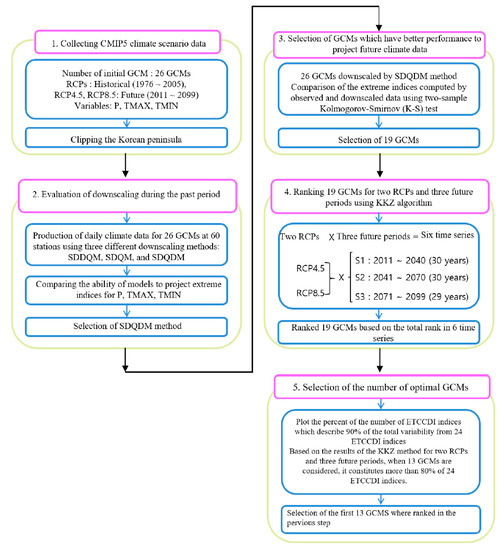
Figure 3.
The procedure for selecting the optimal GCMs.
2.5. Projecting the Hydrologic Data
The five main river basins were divided into 109 HRUs (subbasins) based on the Korean water resources unit map. In this study, we use the PRMS model, whose parameters for all 109 subbasins were calibrated and verified at six gauging stations referring to the statistics of long-term observed streamflow, and the results are shown in Bae et al. [23]. The hydrologic data for each subbasin were obtained by running the PRMS model using daily downscaled data for the period 1976 to 2099 of maximum temperature, minimum temperature, and precipitation. Then, the daily time series of precipitation (P), actual evapotranspiration (AET), soil moisture (SM), groundwater (GW), and streamflow (R) were calculated for the same period and for all 13 GCMs. Next, the multimodel ensemble (MME) of 13 GCMs was calculated by computing the average of the GCMs. Then, the MME was applied for further analysis. The analysis in the present study was performed for the historical period from 1976 to 2005 and the future period from 2071 to 2099. The absolute change in the mean temperature computed by subtracting the mean temperature of the future period from the historical period was compared to the reference period. The relative changes were computed as the percentage change (%) of the future period with respect to the historical period. The negative change revealed a decrease, and the positive change indicated an increase in the future period compared to the historical period.
2.6. Trend Analysis
The Mann-Kendall (MK) statistical test is a nonparametric test to analyze the significance of trends in time series and is mostly applied to identify trends in hydrological variables [36,37,38]. Kendall’s statistic S is calculated using Equations (4) and (5):
where n is the number of data points, Xj and Xi are sequential data (j > i), and Sgn () is a sign function that extracts the sign of . The statistic S is expected to be normally distributed with zero mean (E(S) = 0) and standard deviation, which is computed as (Hamed and Rao, 1998):
where m is the number of ties, t is the size of the ith tie, and Σ represents the summation of all ties. Additionally, the Mann-Kendall statistic Z is estimated using Equation (7):
where Z is the standard normal variable; a positive value of Z shows an increasing trend, whereas a negative value indicates a decreasing trend. Additionally, the null hypothesis H0 that Z with no significant trend is accepted if , where α is the significance level for the test and are the standard normal deviates.
The trend analysis was performed for the time series of water cycle components of all 109 subbasins for two separate periods, historical (1976–2005) and future periods (2071–2099).
3. Results and Analysis
3.1. Changes in Precipitation and Mean Temperature
Variation in temperature patterns caused by climate change could impact the temporal and spatial distribution of water resources [39]. The absolute changes in seasonal mean temperature of the future period compared to that of the historical periods for the five major river basins are shown in Figure 4. In fact, this figure shows the increase in mean seasonal temperature for all subbasins (26 subbasins for the Han, 33 subbasins for the Nakdong, 21 subbasins for the Geum, 15 subbasins for the Sumjin, and 14 subbasins for the Youngsan River basins) with respect to the reference period. The results showed that all basins during all seasons are expected to exhibit increased mean temperature by the impact of climate change. In addition, the higher increase in mean temperature is projected for autumn and winter compared to that of spring and summer. Moreover, the Han and Geum River basins revealed higher increases in mean seasonal temperature than that of the other basins.
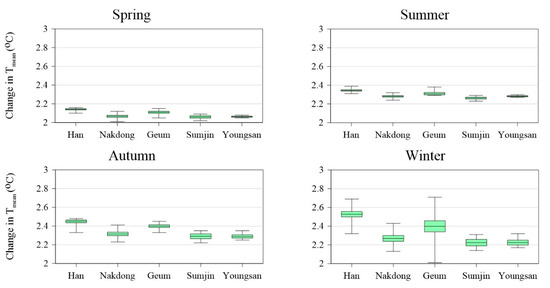
Figure 4.
Absolute changes in the seasonal mean temperature of the multimodel ensemble of 13 GCMS for the future period (2071–2099) with respect to the historical period (1976–2005).
3.2. Linear Seasonal Trends of Water Cycle Components
Table 2, Table 3, Table 4, Table 5 and Table 6 reveal the statistical analysis of the linear trends of the five major basins for the historical and future periods. Linear trends were performed for each water cycle component during the annual time series of each season for the period of 1976 to 2005 for the historical period and the annual time series of 2071 to 2099 for the future period. This analysis was performed separately for all five major river basins of South Korea, namely the Han, Nakdong, Geum, Sumjin, and Youngsan River basins. The positive value of slope (B) defines an increasing trend, and a negative B represents a decreasing trend in a time series. In addition, the standard deviation (SD) of the seasonal water cycle components are shown in Table 1, Table 2, Table 3, Table 4 and Table 5, which revealed the variability in the water cycle components over the seasonal time series.
Table 2.
Linear trends of seasonal precipitation for the historical period (1976–2005) and the future period (2071–2099) and the relative change in the future period compared to the reference periods for five major river basins in Korea.
Table 3.
Linear trends in seasonal actual evapotranspiration for the historical period (1976–2005) and the future period (2071–2099) and the relative change in the future period compared to the reference periods for five major river basins in Korea.
Table 4.
Linear trends in seasonal soil moisture for the historical period (1976–2005) and the future period (2071–2099) and the relative change in the future period compared to the reference period for five major river basins in Korea.
Table 5.
Linear trends in seasonal groundwater for the historical period (1976–2005) and the future period (2071–2099) and the relative change in the future period compared to the reference period for five major river basins in Korea.
Table 6.
Linear trends in seasonal streamflow for the historical period (1976–2005) and the future period (2071–2099) and the relative change in the future period compared to the reference period for five major river basins in Korea.
A comparison of the seasonal precipitation trends during the historical and future periods is shown in Table 2. The linear trend of mean seasonal precipitation during the historical period exhibits increasing trends in spring and decreasing trends in other seasons for all basins. However, different trends were projected for the future period in which spring and winter are projected to have decreasing trends and summer and autumn are expected to have increasing trends. Summer and autumn have the strongest decreasing trends for precipitation, and winter has the weakest trends for all basins. Moreover, SD showed higher variability for precipitation for summer in the historical period and winter in the future period, with maximum variability in the Sumjin River basin. In the present study, there are increasing trends for spring and decreasing trends for the other months, and a significant trend is only detected for summer in the Youngsan Basin. In a previous study (Bae et al., 2008), a decreasing trend in spring and an increasing trend in summer were reported for precipitation, and a significant trend was reported for spring in the Geum, Sumjing, and Youngsan river basins. The difference between the results is due to the different time periods, which are 1976 to 2005 in the present study and 1968 to 2001 for the previous study.
The standard deviation of precipitation for the future period shows extremely higher variability than that for the historical period. For example, SD for the winter in the Youngsan River basin exhibits SD = 15.79 mm for the historical period, while it is projected to be 236.84 mm for the future period, which shows almost 15 times higher variability than that in the historical period. This indicates that the degree of dispersion of precipitation in the winter during the considered time period and the higher seasonality of precipitation in the winter are due to the effects of climate change.
Table 3 shows the linear trend in mean seasonal actual evapotranspiration during the historical and future periods. The slope of the trend showed an increasing trend during the historical period for all seasons; however, spring and winter are projected to have decreasing trends during the future period for all basins. In addition, higher variability in AET was estimated during the summer for the historic period, while the variability in AET increased significantly for the future period, with a maximum in summer for all basins.
Table 4 shows the statistics regarding the linear trend in soil moisture for the historic and future periods. The slope of the time series of soil moisture during the historical period showed a decreasing trend for all seasons; however, during the future period, the Geum, Sumjin, and Youngsan River basins are projected to have an increasing trend in soil moisture.
Table 5 shows the mean seasonal linear trends in groundwater for the historical and future periods. The slope of the trend showed a decreasing trend for summer, autumn, and winter during the historical period, while opposite trends were projected for the future period, in which spring showed a decreasing trend and the other seasons revealed increasing trends.
A comparison of changes in mean seasonal soil moisture between two periods showed a slight decrease for the future period compared to the reference period. In fact, a higher increase in temperature caused higher evapotranspiration and therefore a decrease in soil moisture. However, the groundwater is projected to slightly increase from the historical period to the future period as a result of the increase in precipitation. The increase in groundwater was mainly caused by a precipitation rate higher than the evapotranspiration rate, which caused recharge of the water deficit rate and increased soil moisture and groundwater.
Table 6 shows the results of the seasonal linear trend in streamflow for the five basins during the historical and future periods. The linear trend in streamflow showed an increasing trend in spring and a decreasing trend in other seasons. However, spring and winter are projected to have downward trends, while summer and autumn are projected to have upward trends during the future period. Similar to precipitation and actual evapotranspiration, the SD showed higher variability in summer for the historical period and in winter for the future period, with maximum variability in the Sumjin River basin, indicating that streamflow fluctuated more strongly in the Sumjin River basin during the historical and future periods.
3.3. Indication of the Significant Trend in Seasonal Water Cycle Components
The MK test was performed to detect the significant seasonal trends in water cycle components to understand how the trends in water cycle components changed during the historical period (1976–2005) and how they are projected to change during the future period (2071 to 2099) by the impact of climate change. The analysis was performed for all 109 subbasins of the Korean river basins. The results are shown in Figure 3, Figure 4, Figure 5, Figure 6 and Figure 7.
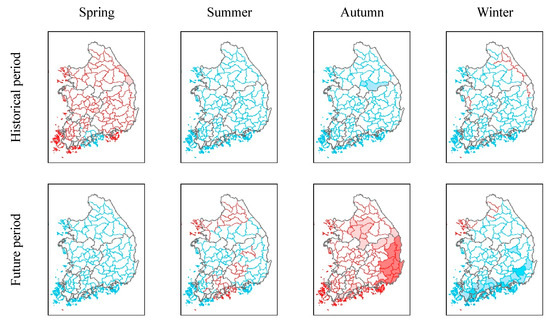
Figure 5.
The seasonal trends in precipitation for the historical period (1976–2005) and future period (2071–2099) were identified using the Mann-Kendall test. The analysis was performed for 109 subbasins. The basins bordered by red show an increasing trend, while the basins outlined by blue show a decreasing trend. The white color indicates no significant trends. Light and dark blue areas show decreasing trends at 90% and 95% confidence levels, respectively. The light and dark red areas show increasing trends at 90% and 95% confidence levels, respectively.
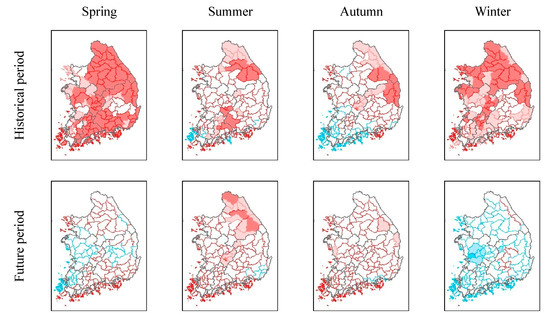
Figure 6.
The seasonal trends in actual evapotranspiration for the historical period (1976–2005) and future period (2071–2099) were identified using the Mann-Kendall test. The analysis was performed for 109 subbasins. The basins bordered by red show an increasing trend, while the basins outlined by blue show a decreasing trend. The white color indicates no significant trends. Light and dark blue areas show decreasing trends at 90% and 95% confidence levels, respectively. The light and dark red areas show increasing trends at 90% and 95% confidence levels, respectively.
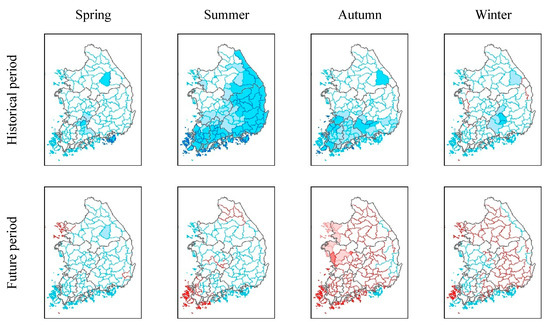
Figure 7.
The seasonal trends in soil moisture for the historical period (1976–2005) and future period (2071–2099) were identified using the Mann-Kendall test. The analysis was performed for 109 subbasins. The basins bordered by red show an increasing trend, while the basins outlined by blue show a decreasing trend. The white color indicates no significant trends. Light and dark blue areas show decreasing trends at 90% and 95% confidence levels, respectively. The light and dark red areas show increasing trends at 90% and 95% confidence levels, respectively.
3.3.1. Precipitation
The spatial distribution of the MK test for the seasonal precipitation trends in the historical and future periods are shown in Figure 5. The results of the trend test for the historical period revealed an increasing trend in precipitation during the spring with a significant increasing trend on the eastern coast. Other seasons showed a decreasing trend in precipitation with a significant decreasing trend for the two subbasins of the Han River during the autumn season. However, a different pattern is projected for the trend in precipitation for the future period. Opposite trends in precipitation are projected for spring and all basins affected by the overall decreasing trend in precipitation. During summer, both increasing and decreasing trends are projected, while autumn showed an increasing trend with a significant increasing trend in the eastern subbasins of Nakdong and the central basin of the Han River. Winter showed the same decreasing trend in precipitation with significant decreasing trends in the southern parts.
3.3.2. Actual Evapotranspiration
The trends in actual evapotranspiration are shown in Figure 6 for the historical and future periods. The results of the MK test revealed an increasing trend in actual evapotranspiration during all seasons except for some southern subbasins in summer and autumn. In particular, spring and winter in most of the subbasins revealed significantly increasing trends. Conflicting behavior was projected for spring and winter during the future period. Spring is projected to have increasing trends in the northern and southern subbasins and decreasing trends in the eastern and central subbasins. Winter is projected to have a decreasing trend in actual evapotranspiration in most of the basins, with significant decreasing trends in the southern part. An increasing trend in actual evapotranspiration indicates a reduction in the available water; however, the decreasing trend in actual evapotranspiration caused an increasing trend in the water availability.
3.3.3. Soil Moisture
The trend in soil moisture during the historical and future periods is shown in Figure 7. The decreasing trend in soil moisture, similar to that of evapotranspiration, revealed a reduction in the water availability in the system. The results of the trend test for the historical period revealed a decreasing trend for all seasons, with striking decreasing trends in summer for all subbasins except for the northern subbasin of the Han and Geum River basins, whose decreasing trends are not significant. Additionally, autumn revealed a significant decreasing trend for the southern subbasins (Nakdong, Sumjin, and Youngsan). The decreasing trend in soil moisture is projected for the future periods, which revealed that the amount of soil moisture still has a decreasing trend for these seasons; however, the amount of soil moisture in autumn is projected to increase for the future period. In winter, the central part of Korea is projected to have an increasing trend for soil moisture during 2071 to 2099; however, the western and eastern parts are expected to have reduced soil moisture.
The results of the study conducted by Jung et al. [40] showed that ET is affected by solar radiation or vapor pressure deficit (VPD) when there is enough soil moisture. However; when the soils are too dry, ET is mostly impacted by soil moisture and the lower amount of ET can cause to increase the atmospheric dryness. Moreover, reduction in soil water content leading to high evaporative demand and reduction of plant production, and possibly limiting the amount of water cycle [41].
3.3.4. Groundwater
Figure 8 shows the results of the MK test for the groundwater during the historical and future periods. The increasing trend in the groundwater during the historical period was only estimated in spring for the coastal areas, while other subbasins in spring and other seasons revealed decreasing trends. However, a significant decrease in soil moisture was detected for most of the subbasins in the eastern and northern parts and in winter for the southern subbasins. However, for the future period, opposite trends were projected for the groundwater, and the subbasins that showed a significant decreasing trend exhibited increasing trends in autumn and winter.
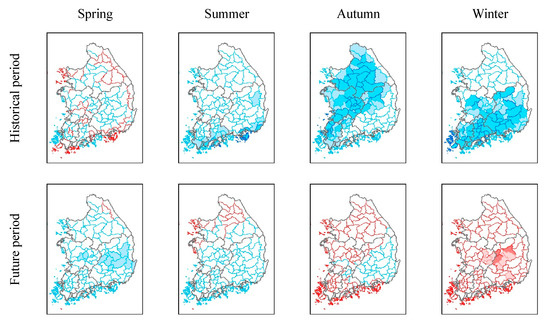
Figure 8.
The seasonal trends in groundwater for the historical period (1976–2005) and future period (2071–2099) were identified using the Mann-Kendall test. The analysis was performed for 109 subbasins. The basins bordered by red show an increasing trend, while the basins outlined by blue show a decreasing trend. The white color indicates no significant trends. Light and dark blue areas show decreasing trends at 90% and 95% confidence levels, respectively. The light and dark red areas show increasing trends at 90% and 95% confidence levels, respectively.
3.3.5. Streamflow
The historical and future trends in streamflow that revealed the combined impacts of all water cycle components are shown in Figure 9. The results of the MK test for the historical period exhibited increasing trends in 80 subbasins out of 109 subbasins for the spring season. However, other seasons revealed a decreasing trend in streamflow with a significant decrease in some catchments of Nakdong in summer, Han in autumn, and Geum, Sumjin, and Youngsan in winter.
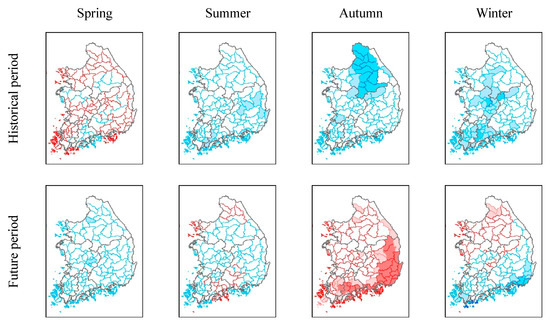
Figure 9.
The seasonal trends in streamflow for the historical period (1976–2005) and future period (2071–2099) were identified using the Mann-Kendall test. The analysis was performed for 109 subbasins. The basins bordered by red showed an increasing trend, while the basins outlined by blue show a decreasing trend. The white color indicates no significant trends. Light and dark blue areas show decreasing trends at 90% and 95% confidence levels, respectively. The light and dark red areas show increasing trends at 90% and 95% confidence levels, respectively.
However, the future period is expected to have different trends in streamflow. The increasing trend in spring for the historical period is expected to change to a decreasing trend for the future period, with a significant decreasing trend in some basins of the Nakdong and Geum River basins. Summer showed a decreasing trend in streamflow except for the northern subbasins. Autumn in the future period is expected to have increased streamflow except for the Nakdong River basin, which is projected to have a decrease in the amount of streamflow. Streamflow in all subbasins in Korea is expected to increase for the period 2071 to 2099, with a significant increase in the Nakdong River subbasins.
3.4. Relative Changes in Seasonal Water Cycle Components
Table 7 shows the relative change in MME projected by 13 GCMs for the future period relative to the historical period for water cycle components. The positive value of relative change revealed an increasing change rate, while the negative values showed a decreasing change rate compared to that of the historical period.
Table 7.
Relative changes in seasonal water cycle components for the future period (2071–2099) compared to the reference period for five major river basins.
The comparison of the mean seasonal change rate of precipitation of the future period with respect to the historical period showed the increasing change rate for all basins, with higher increases in spring and lower increases in winter. Additionally, the comparison of the mean seasonal change rate of the actual evapotranspiration of basins showed a higher change rate in winter for the Han, in autumn for the Nakdong, and in spring for the Geum, Sumjin, and Youngsan river basins. However, the lowest mean seasonal change rate of precipitation occurred in winter for the Nakdong, Sumjin, and Youngsan river basins. The comparison of the mean seasonal precipitation and actual evapotranspiration exhibited a higher change rate of precipitation than actual evapotranspiration during spring and summer seasons. However, the amount of actual evapotranspiration is higher in winter for all basins. In addition, the mean seasonal change rate of soil moisture during the historical and future period revealed that the amounts of soil moisture in all basins are expected to decrease in relation to the historic period, with a greater decrease in the autumn and winter except for the Han River basin, where the higher decrease in soil moisture is projected to be in summer and autumn.
The mean seasonal change rate of groundwater showed a decreasing change rate for spring and an increasing change rate for summer and autumn in all basins. Moreover, winter showed a decreasing change rate for groundwater in all basins except for the Han River basin. Additionally, Table 7 shows the change rate of precipitation relative to the reference period. The results of the mean seasonal change rate of the Han River basin exhibited a different tendency compared to that of the other basins. The Han River basin is expected to have the minimum change rate in spring and the maximum change rate in winter, while in other basins, the maximum change rate is projected to be in summer and autumn, with the lowest change rate in winter.
In general, the reason for the decreasing change rate for streamflow in the Han River basin during the spring occurs due to the almost similar amount of increasing change rate in precipitation and actual evapotranspiration, which cause a decrease in the amount of soil moisture and therefore streamflow. However, the change rate of streamflow in the Han River basin is projected to increase by 23.64%. This increasing change rate occurred due to the lower decrease in soil moisture and higher change rate of groundwater in this season. In contrast, the decreasing change rate of streamflow for the Youngsan River basin in winter occurred due to the elevated amount of actual evapotranspiration compared to precipitation, which caused reduced soil moisture and therefore decreased groundwater recharge. Additionally, the increase in the change rate of streamflow in summer for the Nakdong River basin (+15.90%) was mainly caused by a precipitation (+12.96%) change rate higher than the evapotranspiration change rate (+10.46%), which caused recharge of the water deficit rate and increased soil moisture and groundwater. Soil moisture has a strong influence on evapotranspiration and the amount of water that percolates into the underlying aquifer or contributes directly to surface streamflow, which causes an increase in the amount of streamflow.
4. Conclusions
In this study, the trends of water cycle components in the time series of precipitation, actual evapotranspiration, soil moisture, groundwater, and streamflow were analyzed using the multimodel ensemble of 13 GCMs of RCP 4.5 for two separate periods: the historical period from 1976 to 2005 and the future period from 2071 to 2099. The parameters of the hydrologic model were calibrated and verified to produce the hydrological variables. To assess the trends in the water cycle components, two statistical tests were applied: the linear trend and the Mann-Kendall test. Linear trend analysis was performed for five major river basins, and the Mann-Kendall test was performed for all 109 subbasins of the Korean river basins.
The results of the linear trend test during the historical period revealed both increasing and decreasing trends for water cycle components during seasons with similar tendencies among basins. During the historical period, the spring season showed increasing trends for streamflow, while other seasons showed decreasing trends mainly affected by similar trends in precipitation and groundwater.
Overall, the increasing or decreasing trend in streamflow occurs due to the combined effects of all water cycle components. For example, during the future period, a decreasing trend in streamflow during the spring season occurred due to a decreasing trend in precipitation and an increasing trend in actual evapotranspiration in the northern and southern parts, and a decreasing trend in soil moisture and groundwater caused a decreasing trend in streamflow. However, although the trend of precipitation is decreasing in winter for the future period, the decreasing trend in actual evapotranspiration, increasing trend for soil moisture (especially in the central subbasins), and increasing trend for groundwater caused an increasing trend for streamflow in this period. In general, the results of the trend analysis for the streamflow revealed opposite trends for streamflow in spring (increasing for the historical period and increasing for the future period), autumn (significant decreasing in the northern and southern subbasins for the historical period while increasing trend in the northern and southern part for the future period), and winter (decreasing for the historical and increasing for the future period).
Author Contributions
Conceptualization, M.G.-A.; Data curation, J.-B.K.; Formal analysis, M.G.-A.; Funding acquisition, D.-H.B.; Methodology, M.G.-A.; Project administration, D.-H.B.; Supervision, D.-H.B.; Visualization, M.G.-A.; Writing—original draft, M.G.-A.; Writing—review & editing, M.G.-A and D.-H.B. All authors have read and agreed to the published version of the manuscript.
Funding
This work was supported by KOREA HYDRO & NUCLEAR POWER CO., LTD. (No. H18S023000).
Acknowledgments
Authors would like to thank you Jeong-Bae Kim, for her contributing in creating the climate change projection and downscaling process.
Conflicts of Interest
The authors declare no conflict of interest.
References
- Hijioka, Y.; Lin, E.; Pereira, J.J.; Corlett, R.T.; Cui, X.; Insarov, G.E.; Lasco, R.D.; Lindgren, E.; Surjan, A. IPCC, Asia, in Climate Change 2014: Impacts, Adaptation, and Vulnerability, Part B: Regional Aspects. In Contribution of Working Group II to the Fifth Assessment Report of the Intergovernmental Panel on Climate Change; Cambridge University Press: Cambridge, UK, 2014; pp. 1327–1370. [Google Scholar]
- Bolch, T. Hydrology: Asian glaciers are a reliable water source. Nature 2007, 545, 161–162. [Google Scholar] [CrossRef] [PubMed]
- Anjum, M.N.; Ding, Y.; Shangguan, D. Simulation of the projected climate change impacts on the river flow regimes under CMIP5 RCP scenarios in the westerlies dominated belt, northern Pakistan. Atmos. Res. 2019, 227, 233–248. [Google Scholar] [CrossRef]
- Harrington, L.J.; Otto, F.E.L. Changing population dynamics and uneven temperature emergence combine to exacerbate regional exposure to heat extremes under 1.5 °C and 2 °C of warming. Environ. Res. Lett. 2018, 13, 034011. [Google Scholar] [CrossRef]
- Trenberth, K.E.; Dai, A.G.; Rasmussen, R.M.; Parsons, D.B. The changing character of precipitation. Bull. Am. Meteorol. Soc. 2003, 84, 1205–1217. [Google Scholar] [CrossRef]
- Kundzewicz, Z.W.; Mata, L.J.; Arnell, N.W.; Döll, P.; Kabat, P.; Jiménez, B.; Miller, K.A.; Oki, T.; Zekai, S.; Shiklomanov, I.A. Freshwater Resources and their Management. In Climate Change 2007: Impacts, Adaptation and Vulnerability. Contribution of Working Group II to the Fourth Assessment Report of the Intergovernmental Panel on Climate Change; Parry, M.L., Canziani, O.F., Palutikof, J.P., Van der Linden, P.J., Hanson, C.E., Eds.; Cambridge University Press: Cambridge, UK, 2007. [Google Scholar]
- Leta, O.T.; El-Kadi, A.I.; Dulai, H.; Ghazal, K.A. Assessment of climate change impacts on water balance components of Heeia watershed in Hawaii. J. Hydrol. Reg. Stud. 2016, 8, 182–197. [Google Scholar] [CrossRef]
- Rahman, A.S.; Ahmed, M.S.; Adnan, H.M.; Kamruzzaman, M.; Khalek, M.A.; Mazumder, Q.H.; Jahan, C.S. Modeling the changes in water balance components of the highly irrigated western part of Bangladesh, Hydrol. Earth Syst. Sci. 2018, 22, 4213–4228. [Google Scholar] [CrossRef]
- Zhang, Q.; Fan, K.; Singh, V.P.; Song, C.; Xu, C.-Y.; Sun, P. Is Himalayan-Tibetan Plateau “drying”? Historical estimations and future trends of surface soil moisture. Sci. Total. Environ. 2019, 658, 374–384. [Google Scholar] [CrossRef]
- Chang, H.; Jung, I.W. Spatial and temporal changes in streamflow caused by climate change in a complex large river basin in Oregon. J. Hydrol. 2010, 388, 186–207. [Google Scholar] [CrossRef]
- Karl, T.; Trenberth, K. Modern global change. Science 2003, 302, 1719–1722. [Google Scholar] [CrossRef]
- Taylor, K.E.; Stouffer, R.J.; Meehl, G.A. An overview of CMIP5 and the experiment design. Bull. Am. Meteorol. Soc. 2012, 93, 485–498. [Google Scholar] [CrossRef]
- Eum, H.I.; Cannon, A.J. Intercomparison of projected changes in climate extremes for South Korea: Application of trend preserving statistical downscaling methods to the CMIP5 ensemble. Int. J. Climatol. 2017, 37, 3381–3397. [Google Scholar] [CrossRef]
- Rogelj, J.; Meinshausen, M.; Knutti, R. Global warming under old and new scenarios using IPCC climate sensitivity range estimates. Nat. Clim. Chang. 2012, 2, 248–253. [Google Scholar] [CrossRef]
- Meehl, G.A.; Stocker, T.F.; Collins, W.D.; Friedlingstein, P.; Gaye, A.T.; Gregory, J.M.; Kitoh, A.; Knutti, R.; Murphy, J.M.; Noda, A.; et al. Global climate projections. In Climate Change 2007: The Physical Science Basis. Contribution of Working Group I to the Fourth Assessment Report of the Intergovernmental Panel on Climate Change; Solomon, S., Qin, D., Manning, M., Chen, Z., Marquis, M., Averyt, K.B., Tignor, M., Miller, H.L., Eds.; Cambridge University Press: Cambridge, UK, 2007; pp. 747–846. [Google Scholar]
- Kim, J.; Ivanov, V.Y.; Fatichi, S. Climate change and uncertainty assessment over a hydroclimatic transect of Michigan. Stoch. Environ. Res. Risk Assess. 2016, 30, 923–944. [Google Scholar] [CrossRef]
- Allen, M.R.; Ingram, W.J. Constraints on future changes in climate and the hydrologic cycle. Nature 2002, 419, 224–232. [Google Scholar] [CrossRef] [PubMed]
- Zhang, H.; Huang, G.H. Development of climate change projections for small watersheds using multi-model ensemble simulation and stochastic weather generation. Clim. Dyn. 2013, 40, 805–821. [Google Scholar] [CrossRef]
- Sa’adi, Z.; Shahid, S.; Chung, E.S.; Ismail, T. Projection of spatial and temporal changes of rainfall in Sarawak of Borneo Island using statistical downscaling of CMIP5 models. Atmos. Res. 2017, 197, 446–460. [Google Scholar] [CrossRef]
- Hwang, J.H.; Van, S.P.; Choi, B.J.; Chang, Y.S.; Kim, Y.H. The physical processes in the Yellow Sea. Ocean. Coast. Manag. 2014, 102, 449–457. [Google Scholar] [CrossRef]
- Youn, Y.H. The climate variabilities of air temperature around the Korean Peninsula. Adv. Atmos. Sci. 2005, 22, 575–584. [Google Scholar] [CrossRef]
- Chang, Y.S.; Yoon, M.B. Recent climate change and related factors observed in Korea. J. Korean Meteorol. Soc. 1999, 35, 309–318. [Google Scholar]
- Bae, D.H.; Jung, I.W.; Chang, H. Long-Term Trend of Precipitation and Streamflow in Korean River Basins. Hydrol. Process. 2008, 22, 2644–2656. [Google Scholar] [CrossRef]
- Jung, I.W.; Bae, D.H.; Kim, G. Recent trends of mean and extreme precipitation in Korea. Int. J. Climatol. 2011, 31, 359–370. [Google Scholar] [CrossRef]
- Jung, I.W.; Bae, D.H.; Lee, B.J. Possible change in Korean streamflow seasonality based on multi-model climate projections. Hydrol. Process. 2013, 27, 1033–1045. [Google Scholar] [CrossRef]
- Leavesley, G.H.; Lichty, R.W.; Restrepo, P.J.; Viger, R.J. A modular approach to addressing model design, scale, and parameter estimation issues in distributed hydrological modelling. Hydrol. Process. 2002, 16, 173–187. [Google Scholar] [CrossRef]
- Leavesley, G.H.; Lichty, R.W.; Troutman, B.M.; Saindon, L.G. Precipitation-Streamflow Modeling System-User’s Manual: U.S. Geological Survey Water-Resources Investigations Report 83-4238; U.S. Geological Survey: Reston, VA, USA, 1983; pp. 1–207.
- Hamon, W.R. Estimating potential evapotranspiration. Proceedings of the American Society of Civil Engineers. J. Hydraul. Div. 1961, 87, 107–120. [Google Scholar]
- Hamon, W.R. Computation of direct runoff amounts from storm rainfall. Int. Assoc. Sci. Hydrol. Pub. 1963, 63, 52–62. [Google Scholar]
- Lu, J.; Sun, G.; McNulty, S.G.; Amatya, D.M. A Comparison of Six Potential Evapotranspiration Methods for Regional Use in the Southeastern United States 1. JAWRA J. Am. Water Resour. Assoc. 2005, 41, 621–633. [Google Scholar] [CrossRef]
- Zhao, L.; Xia, J.; Xu, C.Y.; Wang, Z.; Sobkowiak, L.; Long, C. Evapotranspiration estimation methods in hydrological models. J. Geogr. Sci. 2013, 23, 359–369. [Google Scholar] [CrossRef]
- McCabe, G.J.; Hay, L.E.; Bock, A.; Markstrom, S.L.; Atkinson, R.D. Inter-annual and spatial variability of Hamon potential evapotranspiration model coefficients. J. Hydrol. 2015, 521, 389–394. [Google Scholar] [CrossRef]
- Lang, D.; Zheng, J.; Shi, J.; Liao, F.; Ma, X.; Wang, W.; Chen, X.; Zhang, M. A comparative study of potential evapotranspiration estimation by eight methods with FAO Penman-Monteith method in southwestern China. Water 2017, 9, 734. [Google Scholar] [CrossRef]
- Ghafouri-Azar, M.; Bae, D.H. Analyzing the Variability in Low-Flow Projections under GCM CMIP5 Scenarios. Water Resour. Manag. 2019, 33, 5035–5050. [Google Scholar] [CrossRef]
- Cannon, A.J. Selecting GCM Scenarios that Span the Range of Changes in a Multi model Ensemble: Application to CMIP5 Climate Extremes Indices. J. Clim. 2015, 28, 1260–1267. [Google Scholar] [CrossRef]
- Tabari, H.; Marofi, S.; Aeini, A.; Hosseinzadeh Talaee, P.; Mohammadi, K. Trend analysis of reference evapotranspiration in the western half of Iran. Agric. For. Meteorol. 2011, 151, 128–136. [Google Scholar] [CrossRef]
- Gocic, M.; Trajkovic, S. Analysis of trends in reference evapotranspiration data in a humid climate. Hydrol. Sci. J. 2014, 59, 165–180. [Google Scholar] [CrossRef]
- Ghafouri-Azar, M.; Bae, D.-H.; Kang, S.-U. Trend Analysis of Long-Term Reference Evapotranspiration and Its Components over the Korean Peninsula. Water 2018, 10, 1373. [Google Scholar] [CrossRef]
- IPCC. Fourth Assessment Report of the Intergovernmental Panel on Climate Change; Cambridge University Press: Cambridge, UK; New York, NY, USA, 2007. [Google Scholar]
- Jung, M.; Reichstein, M.; Ciais, P.; Seneviratne, S.I.; Sheffield, J.; Goulden, M.L.; Bonan, G.; Cescatti, A.; Chen, J.; De Jeu, R.; et al. Recent decline in the global land evapotranspiration trend due to limited moisture supply. Nature 2010, 467, 951–954. [Google Scholar] [CrossRef]
- Yuan, W.; Zheng, Y.; Piao, S.; Ciais, P.; Lombardozzi, D.; Wang, Y.; Ryu, Y.; Chen, G.; Dong, W.; Hu, Z.; et al. Increased atmospheric vapor pressure deficit reduces global vegetation growth. Sci. Adv. 2019, 5, eaax1396. [Google Scholar] [CrossRef] [PubMed]


© 2020 by the authors. Licensee MDPI, Basel, Switzerland. This article is an open access article distributed under the terms and conditions of the Creative Commons Attribution (CC BY) license (http://creativecommons.org/licenses/by/4.0/).