Abstract
The role of financial development (FD) in China’s environment has attracted extensive attention from scholars, but few studies involved the effect of FD on urban electricity consumption (EC). This paper constructs two spatial panel models to explore the interaction between FD and EC on the basis panel data of 278 cities in China from 2005 to 2016. The results show that electricity consumption of urban residents and industrial sector in China has obvious spatial correlation and unbalanced spatial distribution. Secondly, FD can promote urban industrial electricity consumption (IEC) and urban residential electricity consumption (REC), and it has a greater impact on REC than IEC. Thirdly, spatial heterogeneity is established, and the imbalance of REC and IEC among different regions and urban scales deserves more attention. FD is conducive to enhance REC and IEC in the eastern and western regions. Meanwhile, FD plays an important role in the increase of REC and IEC in small cities, large cities, and megacities of China. Considering the above results, this paper puts forward targeted policy recommendations.
1. Introduction
Electricity is an important energy source for ensuring the normal operation of the economy and society, which is clean, safe, and convenient. From 1978 to 2018, urban electricity consumption (EC) in China maintained a high growth rate with an average annual growth rate of 8.85%, and it has increased from 249.8 billion kWh in 1978 to 678.64 billion kWh in 2018. During the past few decades, China has become the world’s second-largest power consumer after the United States [1]. As shown in previous studies, there is a significant relationship between economic growth and EC [2,3]. Hence, as China is in the stage of industrialization and rapid urbanization, the demand for electricity is expected to be even stronger in the near future. At present, the Chinese government is exploring the mode of sustainable development actively. The 13th five-year plan for controlling greenhouse gas (GHG) emissions released by the Chinese government proposes to vigorously develop green finance and increase investment in energy conservation and emission reduction industries [4].
Financial development (FD) plays a critical role in economic growth [5,6,7,8,9,10]. The reform of the financial system promoted FD. As far as we know, FD can also influence social electricity demand through credit policies. Moreover, FD can also promote industrial structure improvement and technological innovation. FD can promote economic growth through these channels. It is well known that economic growth plays an important role in increasing EC. Hence, does FD have an impact on EC? Studies have found that ignoring FD variables in the energy consumption model will lead to incorrect inferences about energy demand. Therefore, it is reasonable to consider the impact of FD on EC.
The impact of FD on EC is mainly through the following ways: (1) For urban residential electricity consumption (REC), as the level of FD increases, urban residents can obtain loans more conveniently and at a lower cost, leading to an increase in urban residents’ purchase of durable consumer goods (such as housing, household appliances, and automobiles). The purchase and use of these products have increased the REC. (2) For urban industrial electricity consumption (IEC), on the one hand, companies can carry out debt financing at a lower cost when the credit market is developed, thereby expanding the scale of production and increasing IEC; on the other hand, the development of credit market has eased the financing difficulties of high-tech companies, and improved the electricity efficiency of the industrial sector. (3) In terms of industrial structure, FD provides financial support for technological innovation to promote the upgrading of industrial structure and reduce electricity intensity (EI). (4) In terms of investment and financing channels, FD can provide foreign high-tech companies with financing channels, thereby promoting urban technological innovation and improving electricity efficiency. (5) In terms of urban electricity structure, a developed financial market can provide financing support for green power projects. Through the green electricity credit policy, guide the flow of funds to the green electricity industry, thereby reducing EC’s dependence on fossil energy and promoting the upgrading of urban electricity structure.
The above content constitutes the entire impact of FD on EC. The impact of FD on IEC and REC may be different. Therefore, it is necessary to separately consider the impact of FD on IEC and REC. Moreover, we investigated the imbalance of urban power consumption in different regions and urban sizes. We aim to provide policy recommendations to ensure reasonable urban electricity demand and promote environmental sustainability.
The innovation and contribution of this paper are chiefly reflected in the following aspects. (1) There are few studies on the impact of FD on EC in energy economics. This paper summarizes the ways in which FD affects EC. On this basis, we comparatively analyzed the impact of FD on EC, IEC, and REC. (2) Spatial heterogeneity was established, and the imbalance of EC, IEC, and REC among different regions (Eastern China, Central China, Western China) and urban scales (small cities, medium cities, large cities, megacities) was investigated. (3) Investigate the spatial dependence of EC, IEC, and REC by using spatial economic methods. Ignoring spatial dependence may produce incorrect inferences on urban electricity demand [11,12,13]. As far as we know, this is the first time that the spatial dependence of EC, IEC, and REC in 278 cities in China has been studied.
2. Literature Review
When studying EC, ignoring the FD factor may lead to bias in the estimation results of the energy demand model. Sadorsky studied the impact of FD on energy consumption through the systematic generalized moment estimation method [6]. Coban and Topcu used systematic generalized moment estimation to study the impact of FD on energy consumption [14]. They found that FD promoted energy consumption. Chtioui found that there is a causal relationship between FD and energy consumption [15]. Shahbaz et al. constructed a comprehensive indicator system on FD and discussed the impact of FD on environmental quality in Pakistan [16]. Yue et al. used the panel smooth transition regression (PSTR) model to study the nonlinear relationship between FD and energy consumption [17]. Aslan et al. applied the panel cointegration method and found that the banking indicators in the Middle East have a long-term impact on energy consumption [18]. Abbasi and Riaz used the autoregressive distribution lagged (ARDL) model to study the impact of FD and economic growth on carbon emissions [19]. Ouyang and Li used generalized moment estimation and panel vector autoregressive models to study the interaction among energy consumption, FD and economic growth. Chang applied a threshold regression model to study the relationship among economic growth, FD, and energy consumption [20,21]. The research results show that there is a threshold effect between FD and energy consumption.
There is no consensus on the effect of FD on energy consumption so far. Some studies found that FD promotes energy consumption. Sadorsky demonstrated that FD can improve the access to financial resources and promote the demand for commodities and energy, and pointed out that FD can contribute to increasing savings, borrowing, and investment [22]. Additionally, consumers tend to buy consumer durables that increase energy demand with borrowing costs being low. Chang suggested that private and domestic credit can increase energy consumption in non-high-income countries, and stock trading volume or market trading volume can increase energy consumption in high-income countries [21]. Some other studies found that FD can help to reduce EC. According to Islam’s study, FD is conducive to the purchase of energy-saving appliances, thus reducing energy consumption. Farhaniet al. found that FD could reduce the energy demand of the United States from 1973 to 2014 [23]. Riti’s findings show that FD can promote the reduction of carbon dioxide emissions; especially, the effect of carbon emission reduction is more significant when M2/GDP is used as a FD indicator in three countries with different income levels from 1980 to 2014 [24]. A few studies found that FD has no effect on energy consumption. Furuoka’s study found that FD did not affect energy consumption by selecting 12 Asian countries to establish different types of groups to study the relationship between FD and energy consumption [25]. Additionally, there are some innovative studies worth thinking about. For example, Bekhet used the ARDL method to find a long-term equilibrium relationship between FD and energy consumption, economic growth, and export variables in Jordan from 1976 to 2011 [26]. Ahmed found a threshold effect between FD and energy consumption [27].
At present, there are few studies on the impact of FD on EC. Most scholars consider the relationship between FD and energy consumption. The main research methods include the Granger causality test, threshold regression model, ARDL method, panel cointegration, etc. There are few studies on the impact of FD on the spatial heterogeneity of EC. Based on this, we believe that the existing research has the following shortcomings. First of all, currently, few scholars have studied the impact of FD on EC, IEC, and REC. Second, there are few studies on the impact of FD on the spatial heterogeneity of EC, IEC, and REC. Third, for EC, IEC, and REC, there are few studies on whether there is spatial dependence.
Given this, it is necessary to study the influence of FD on EC, IEC, and REC. Meanwhile, the establishment of spatial heterogeneity, and the imbalance of EC, IEC, and REC among different regions and urban scales, was analyzed. This paper constructs two spatial economic models to fully reflect the spatial dependence of EC, IEC, and REC.
3. Methodology
This paper has applied the spatial econometric model to investigate the effects of FD on EC in China. In addition, the spatial weight matrix used in this paper was also introduced.
3.1. Spatial Correlation Test
The technique of global autocorrelation analysis was used to reveal the spatial characteristics of urban electricity consumption [28]. The global Moran’s I index has been utilized to identify spatial autocorrelation [29]. The equation for calculating global Moran’s I index was specified as follows:
where is the number of cities, and represent the observed values of city and city , and refers to the mean value of . indicates the spatial weight matrix. The global Moran’s I index value ranges between −1 and 1. If the global Moran’s I index value is greater than 0, it indicated that the urban electricity consumption between local and adjacent cities is spatially dependent. If the global Moran’s I index value is less than 0, it indicates that there is a significant spatial difference in urban electricity consumption between local and adjacent cities. If the value of global Moran’s I index is close to 0, it implies that there is no spatial autocorrelation in urban electricity consumption.
3.2. Spatial Econometrics Model
In order to explore the spatial effect of EC, the spatial panel model was constructed. The most commonly used spatial regression models are the spatial lag model (SLM) and the spatial error model (SEM). The spatial lag model (SLM) measures the impact of dependent variables in adjacent cities on dependent variables in local cities. The spatial error model (SEM) reflects the impact of the error terms in adjacent cities on dependent variables in local cities. These two types of spatial econometrics models are constructed as follows:
SLM:
SEM:
where is the spatial weight matrix; represents the direct coefficient for the independent variable; represents the spatial autoregressive coefficient; refers to the time-fixed effect; stands for the space-fixed effect; measures a random error vector, satisfying denotes the impact of error terms in adjacent cities on error terms in local cities. The is the electricity consumption indicator, represented alternatively by EC (urban electricity consumption), IEC (urban industrial electricity consumption), and REC (urban residential electricity consumption). The is a set of explanatory variables, representing FD (financial development), PGDP (economic growth), IS (industrial structure), EI (electricity intensity), and POP (population). Logarithmic forms are employed for variables on both sides of the equations to decrease the fluctuation of the data and eliminate the heteroscedasticity.
3.3. Economic Weight Matrix
The spatial weight matrix represents the interdependence of spatial elements. Adjacency or distance is often devoted to identifying the degree of spatial interaction between different spatial units [30]. The strength of the interaction between the two regions is the same in both matrix forms. However, it is generally believed that regions with high levels of economic development have stronger spatial spillover effects than regions with low levels of economic development. Therefore, this study used the economic distance matrix to describe the spatial interaction, which considers both geographical and economic factors [31].
Here, , ) is the geographic distance spatial weight matrix denoting the centroid distance among cities, and the latitude and longitude data were obtained from the national geographic information center of China; is the average value of the GDP during the observation period in city ; denotes the average value of all cities’ GDP levels from to . Moreover, the analytical framework of this study is shown in Figure 1.
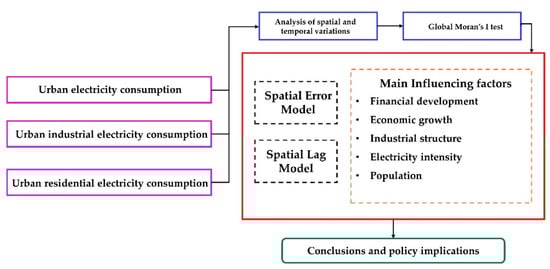
Figure 1.
Flowchart of the work progress.
4. Data
4.1. Electricity Consumption
Urban electricity consumption (EC): EC represents the total amount of electricity used by the whole society in a city, including electricity consumption by urban industrial sector, electricity consumption by urban residents, and other electricity consumption. Hence, this indicator is measured by the electricity consumption of the whole society in the city each year.
Urban industrial electricity consumption (IEC): The object of research is the electricity consumption of the urban industrial sector in China. It reflects the electricity consumption except for urban residents and represents the level of electricity consumption of the industrial sector in different cities.
Urban residential electricity consumption (REC): REC is used to measure the level of electricity consumption of urban residents in household life, including lighting, cooking, and household appliances, etc.
4.2. Financial Development
Financial development (FD): In China, the main channel for enterprises to obtain external financing is banks [32,33,34]. Since China’s financial system is dominated by banks, the indicators of FD should be related to banks. As loans are closely related to the activities of enterprises, this paper uses the proportion of bank loans to GDP to measure the level of FD. This is a common indicator used in previous studies [35,36,37,38,39,40].
4.3. Controlling Variable
According to previous studies, this study takes economic growth, industrial structure, population size, and electricity intensity as control variables.
Economic growth (PGDP): Real per capita GDP is often used to describe the economic development of a city, and to measure the standard of living of a city [41]. The level of urban economic development is highly correlated with EC [42]. Generally, the more prosperous the economy of a city, the higher the electricity consumption of the city [42,43]. The GDP of each city has been converted to 2005 constant prices.
Industrial structure (IS): The changes in the share of different industries in the total economic volume have an important impact on the EC [42]. China is at a critical stage in the process of economic transformation. Studying the impact of industrial structure upgrades on EC is in line with the policy of optimizing industrial structure advocated by the Chinese government at present [44]. This paper measures the industrial structure by the ratio of the economic output of the tertiary industry to the secondary industry.
Electricity intensity (EI): Electricity intensity is related to energy efficiency, which declines with the development of the economy and the progress of high technology [4]. The improvement of the production process and the progress of science and technology are conducive to the improvement of economic production efficiency and the reduction of electricity intensity in China [42]. The decline in electricity intensity, is the major reason for the decline in China’s electricity use. In this paper, electricity intensity is measured by the ratio of EC to urban GDP [42,43].
Population (POP): The urban population is the end user of EC. The growth of the urban population will lead to more EC [44]. Besides, the urbanization process has led to more people being concentrated in urban areas, which has led to higher electricity demand. Electricity is an important force supporting urbanization [45]. The urbanization process requires large-scale construction of urban infrastructure and housing and transportation systems, which will promote the rapid development of energy-intensive industries and increase electricity demand in the industrial, agricultural, and residential sectors [46]. In this paper, the urban population size is measured by the total population at the end of the year.
4.4. Data Source
In terms of the data availability, this study used a balanced panel dataset of 278 cities in China from 2005 to 2016. The data were taken from the China City Statistical Yearbook from 2006 to 2017. The year in which the data were lost is interpolated using the average of adjacent years. The descriptive statistics of the relevant variables are shown in Table 1.

Table 1.
Descriptive statistics of all variables used in this study.
5. Results and Discussion
5.1. Spatial Distribution Characteristics
Figure 2 reflects the spatial distribution of FD from 2005 to 2016 in China. Figure 2 indicates that the overall level of FD in China presented a significant upward trend, and FD in the North China Plain and the eastern coastal areas is significantly greater than that of the central and western regions. These results show that FD has the characteristics of spatial clustering and spatial heterogeneity in China.
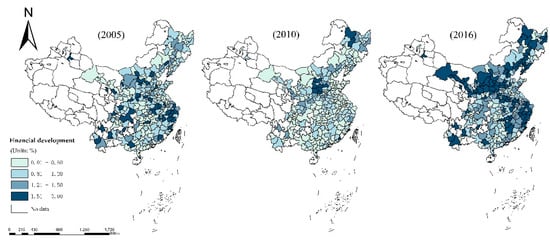
Figure 2.
Spatial pattern evolution of financial development.
Figure 3 reflects the spatial distribution of EC from 2005 to 2016 in China. Figure 3 indicates that the overall level of EC in China presented a significant upward trend, and EC in the eastern regions is significantly greater than that of the central and western regions. Figure 3 shows that EC has spatial agglomeration characteristics in economically developed cities along the eastern seaboard.
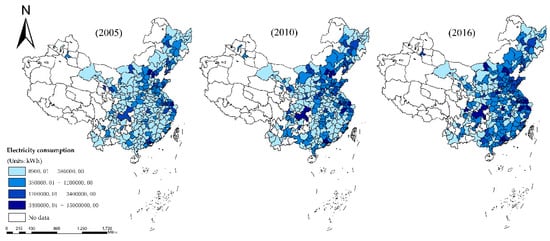
Figure 3.
Spatial pattern evolution of electricity consumption.
Figure 4 and Figure 5 reflects the spatial distribution of IEC and REC in China from 2005 to 2016. Figure 4 and Figure 5 show that the overall level of IEC and REC presented a significant upward trend, with IEC and REC in the eastern regions, central regions, and western regions decreasing sequentially. Figure 4 shows that the cities with high IEC are concentrated in the North China Plain and the eastern coastal areas of China. Figure 5 shows that REC has spatial agglomeration characteristics in the central regions and eastern coastal areas of China. These results show that REC and IEC have the characteristics of spatial clustering and spatial heterogeneity in China.
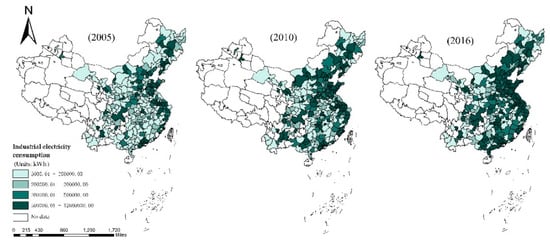
Figure 4.
Spatial pattern evolution of industrial electricity consumption.
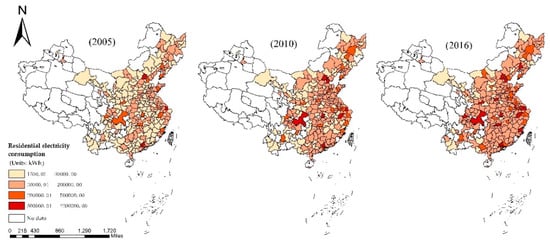
Figure 5.
Spatial pattern evolution of residential electricity consumption.
Therefore, in order to test whether EC, IEC, and REC are spatially dependent, we used global Moran’s I index to test the spatial autocorrelation characteristics of EC, IEC, and REC in the following chapters.
5.2. Global Spatial Autocorrelation
The positive spatial autocorrelation of EC, IEC, and REC have been exhibited in Table 2. The global Moran’s I index of EC, IEC, and REC have passed the significance test at the 1% significance level from 2005 to 2016, which indicates that EC, IEC, and REC are spatially dependent. That is, increasing the EC, IEC, and REC in surrounding cities can bring along EC, IEC, and REC in local cities. Under the economic distance matrix, the global Moran’s I index for EC, IEC, and REC generally presented an upward trend from 2005 to 2016, indicating that the spatial autocorrelation of EC, IEC, and REC have experienced an enhancement process. Hence, there is a positive spatial autocorrelation in EC, IEC, and REC, implying the necessity to taking spatial econometric model into consideration.
Table 2.
Test results of spatial autocorrelation.
5.3. Spatial Regression Analysis
The Moran’s I index tests confirm that there is an obvious spatial autocorrelation in the EC, IEC, and REC of China. In this case, the least squares linear (OLS) regression model may bias the estimated results. Thereby, it is necessary to introduce the spatial panel regression model.
Prior to the regression analysis, the LM (Lagrange multiplier) and Robust LM tests were performed to determine which model is better, the spatial lag model (SLM) or the spatial error model (SEM). The results show that the results of LM-lag and LM-error are significant at the significance level of more than 1%. Meanwhile, the test results of Robust LM-lag and Robust LM-error are significant at the significance level above 5%. Since the SLM has a higher goodness of fit for regression results, it indicates that the SLM model is a better choice. In addition, Hausman’s results suggest that fixed effects should also be selected. Based on the above test results, this paper finally selected the spatial lag model (SLM) under the fixed effect to study the impact of FD on EC, IEC, and REC in China. Table 3 shows the estimation results of SLM. Considering the robustness, the estimation results of SEM are also shown.
Table 3.
Estimation results of SLM and SEM at the national level.
Table 3 shows that the spatial autocorrelation coefficients of EC, IEC, and REC are significantly positive at the 1% significance level. This shows that China’s EC, IEC, and REC are spatially dependent. This is consistent with Moran I’s above conclusion. According to the estimation results of SLM, for every 1% increase in EC, IEC, and REC of adjacent cities, the EC, IEC, and REC in local cities increase by 0.065%, 0.076%, and 0.247%, respectively. Notably, REC has a greater spatial dependence than IEC. The reasons why the EC is spatially dependent can be explained as follows: (1) Local cities imitate and copy the economic development mode of neighboring cities. Therefore, EC has spatial dependence due to “imitation effect”. (2) Due to the continuous development of transportation systems, frequent trade, and similar consumption preferences between local cities and neighboring cities, the EC trend of local cities and neighboring cities is consistent. The reason for the spatial dependence of the IEC is that, due to the inter-regional industrial transfer and trade, IEC in local cities is inevitably affected by EC in surrounding cities. The reasons why the REC is spatially dependent can be explained as follows: (1) Local urban residents may be affected by the energy conservation awareness and green environmental protection behavior of residents among adjacent cities. (2) The spatial correlation of REC is also reflected in the strong dependence of some residents on the economic development of the surrounding cities. Urban residents in local cities may imitate the use of household appliances by urban residents in surrounding cities, resulting in the spatial autocorrelation of the REC. (3) The economic development of each city is closely linked. The economic development and energy policy of a city will also have an impact on neighboring cities. This estimation results provide a clear basis for the implementation of joint power-saving actions among cities.
In the results of SLM, the elasticity coefficients of FD to EC, IEC, and REC are 0.079, 0.061, and 0.244, respectively, which are significantly positive at the 1% significance level. The results show that FD is closely related to EC, IEC, and REC. From the perspective of the industrial sector, the main channel for Chinese enterprises to obtain external financing was bank loans for a long time [47]. Bank loans allow companies to build new production lines, buy large equipment, expand production, and carry out more production activities, thus increasing IEC. Hence, FD provides support for the industrial sector to obtain external financing and expand investment scale. From the perspective of urban residents, as the level of FD increases, urban residents can obtain loans more conveniently and at a lower cost, thereby promoting urban residents’ purchase of durable consumer goods (such as household appliances, housing, and automobiles). The empirical results show that FD plays a critical role in promoting the growth of EC in China. Therefore, FD should be taken into consideration when the Chinese government formulates the future EC plan.
In the SLM results, the elastic coefficients of economic growth (PGDP) to EC, IEC, and REC are 0.866, 0.914, and 0.534, respectively, which are significant at the 1% significance level. At present, urban economic development is increasingly dependent on EC, and the proportion of EC in the final energy consumption continues to rise. Overall, compared with other variables, PGDP has the greatest impact on EC, IEC, and REC. Therefore, from the perspective of economic development, supporting power supply is the foundation of economic development. At present, economic development still depends on energy consumption. To promote economic growth while reducing fossil energy consumption, green electricity (such as hydropower, wind power, solar photovoltaic cells, etc.) must be promoted and used to reduce dependence on fossil energy. Green electricity not only has the same effect as thermal power, but also helps to improve air quality and promote environmental sustainability.
The results of SLM, the elasticity coefficients of industrial structure (IS) to EC, IEC, and REC are −0.182, −0.229, and 0.084, respectively, which are significant at the 1% significance level. This indicates that the larger the ratio of tertiary industry to secondary industry, the less electricity China’s cities use. In China, the EC of different industries varies greatly [44]. From 2005 to 2016, the EC of the secondary industry was the largest, accounting for more than 70%, while that of other industries was less than 30%. The EC structure in the developed countries is more reasonable, with transportation, construction, and manufacturing each consuming about one third of the electricity. At present, the secondary industry is energy-intensive. Therefore, in terms of the experience of developed countries, through the upgrading of the industrial structure, specifically, vigorously develop the tertiary industry and reduce the development of the secondary industry, which promotes the reduction of electricity consumption [44].
Population size (POP) has a significant role in promoting EC, IEC, and REC. In the SLM results, for each 1% increase in population size, EC, IEC, and REC increased by 0.865%, 0.868%, and 0.871%, respectively. The urban population is the main end user. The growth of urban population will directly drive the growth of REC, which is in line with the reality. Electricity is an important force supporting the urbanization process [45]. The urbanization process requires the construction of large-scale urban infrastructure, housing, and transportation systems, which will promote the rapid development of energy-intensive industries, thus increasing the electricity consumption in the industrial and residential sectors [46]. In addition, the urbanization process has increased the urban population, making more people concentrated in the city, which promotes the increase in EC.
In the results of SLM, the elastic coefficients of electricity intensity (EI) on EC, IEC, and REC are 0.858, 0.987, and 0.045, respectively, which are significantly positive at the 1% significance level. This result shows that the reduction of EI can effectively inhibit the rapid growth of EC [48,49]. China’s energy endowment determines the energy structure dominated by fossil fuels, especially coal energy [50,51]. Efficient use of electricity can indirectly reduce coal consumption and further reduce pollutant emissions [44]. Notably, the impact of EI on IEC is greater than that of REC. Since China has set energy-intensity restriction targets in the “Eleventh Five-Year Plan” and “Twelfth Five-Year Plan”, various local governments have adopted measures to reduce EC per unit of GDP. For example, local governments have vigorously supported and developed low-energy enterprises and imposed rectification requirements and restrictions on high-energy enterprises. The secondary industry is an energy-intensive industry in China, which accounts for a large proportion compared with other industries. Therefore, the improvement of industrial electricity utilization efficiency promotes the reduction of IEC.
5.4. Region-Scale Analysis
China is a vast country with diverse natural environments and different levels of economic development in different regions. In order to compare the impact of FD on EC, IEC, and REC in different regions of China, this paper divided 278 prefecture-level cities into three regions: eastern, central, and western. There are 113 cities in the eastern regions, 108 in the central regions, and 57 in the western regions. Table 4, Table 5 and Table 6 reports the estimated results of the impact of FD on EC, IEC, and REC in different regions via SLM. Considering the robustness, the estimation results of the impact of FD on EC, IEC, and REC in different regions via SEM are also shown.
Table 4.
Estimation results of SLM and SEM for EC at the regional level.
Table 5.
Estimation results of SLM and SEM for IEC at the regional level.
Table 6.
Estimation results of SLM and SEM for REC at the regional level.
From the perspective of IEC: (1) Table 5 reflects that in eastern, central, and western China are 0.097, 0.248, and 0.084, respectively, which are significant at the 1% significance level. The estimated results reflect that IEC is spatially dependent in eastern, central, and western China. Moreover, Table 5 shows that IEC has a stronger spatial dependence in the central regions than in the eastern and western regions. (2) The impact of FD on IEC is heterogeneous in different regions of China. In SLM (1a) and SLM (3a), the elastic coefficients of FD on IEC are 0.073 and 0.306, respectively, which are significant at the 1% significance level. Table 5 reflects that FD can promote the IEC of cities in the eastern and western regions, which is similar to the conclusion of the national sample. Meanwhile, the effect of FD on IEC is not significant in the central regions. (3) The estimation results of the control variables are similar to the national sample.
From the perspective of REC: (1) Table 6 reflects that in eastern, central and western China are 0.122, 0.411, and 0.153, respectively, which are significant at the 1% significance level. The estimated results reflect that IEC is spatially dependent in eastern, central, and western China. Moreover, Table 6 shows that REC has a stronger spatial dependence in the central regions than that of the eastern and western regions. (2) The impact of FD on REC is heterogeneous in different regions of China. In SLM (1a), SLM (2a), and SLM (3a), the elastic coefficients of FD on REC are 0.260, 0.085, and 0.381, respectively, which are significant at the 1% significance level. Table 5 reflects that FD can promote the IEC in different regions, which is similar to the conclusion of the national sample. In particular, FD has a greater impact on REC in the western regions than in other regions. (3) Except for the indicators of IS and EI, the estimated results of the remaining control variables are similar to the national sample.
5.5. City-Scale Analysis
As a high-end service industry, the development of the financial industry depends on the city scale. The bigger the city, the more abundant the capital and the more diversified the market. In order to test the influence of FD on urban EC under a different city scale, the urban population at the end of the year is selected to represent the city scale. According to the population size in 2016 as the standard for dividing the city size, the city size is divided into four categories: megacities with a population of more than 2 million, large cities with a population of 1 million to 2 million, medium-sized cities with a population of 500,000 to 1 million, and small cities with a population of less than 500,000 [52]. There are 60 megacities, 93 large cities, 86 medium cities, and 39 small cities in China. Table 7, Table 8 and Table 9 report the estimated results of the impact of FD on EC, IEC, and REC in different urban sizes via SLM. Considering the robustness, the estimation results of the impact of FD on EC, IEC, and REC in different urban sizes via SEM are also shown.
Table 7.
Estimation results of SLM and SEM for EC at the city scale.
Table 8.
Estimation results of SLM and SEM for IEC at the city scale.
Table 9.
Estimation results of SLM and SEM for REC at the city scale.
From the perspective of IEC: (1) Table 8 reflects that in small cities, medium-sized cities, large cities, megacities are 0.259, 0.103, 0.145, and 0.166, respectively, which are significant at the 1% significance level. The estimation results reflect the spatial dependence of IEC in different urban sizes. Moreover, Table 8 shows that IEC has a stronger spatial dependence in small cities than in other types of cities. (2) The impact of FD on IEC is heterogeneous in different urban sizes of China. In SLM (1a), SLM (3a), and SLM (4a), the elastic coefficients of FD on REC are 0.081, 0.046, and 0.090, respectively, which are significant at the 10% significance level. Table 8 reflects that FD can promote IEC for small cities, large cities, and megacities, but not for medium-sized cities. In particular, FD has a greater impact on IEC in megacities than in other urban sizes. The reason is that there are more abundant financial services and resources in megacities. (3) The estimation results of the control variables are similar to the national sample.
From the perspective of REC: (1) Table 9 reflects that 𝜌 in small cities, medium-sized cities, large cities, and megacities are 0.667, 0.382, 0.528, and 0.106, respectively, which are significant at the 1% significance level. The estimation results reflect the spatial dependence of REC in different urban sizes. In particular, Table 9 shows that REC has a stronger spatial dependence in small cities than in other types of cities. (2) FD can promote REC in different urban sizes. The impact of FD on REC is heterogeneous in different urban sizes of China. In SLM (1a), SLM(2a), SLM (3a), and SLM (4a), the elastic coefficients of FD on REC are 0.29, 0.119, 0.352, and 0.279, respectively, which are significant at the 1% significance level. In particular, FD has a greater impact on REC in large cities than in other urban sizes. (3) Except for the indicators of IS and EI, the estimation results of the remaining control variables are similar to the national sample.
6. Conclusions and Policy Implications
6.1. Conclusions
Based on SLM and SEM under the economic distance spatial weight matrix, the research has adopted a city-level panel data of 278 cities from 2005 to 2016 to investigate the impacts of FD on IEC and REC in China. The estimation results summarized in this paper are as follows:
Firstly, FD, IEC, and REC keep a rising trend on the basis of the results of temporal and spatial patterns of FD, IEC, and REC in China from 2005 to 2016. There was a significant imbalance between FD and IEC (or REC) of different areas. Meanwhile, FD, IEC, and REC of the cities on the North China Plain and the eastern coast are larger than that in the central and western regions. The evolution of the time–space pattern of EC is similar to that of IEC and REC.
Secondly, IEC and REC are spatially dependent in national samples and different regions (or urban sizes). The estimation results show that the spatial dependence of REC is slightly stronger than that of IEC via the spatial economic model.
Thirdly, the regional level results indicate that FD has enhanced IEC in the eastern and western regions, whereas the impact of FD on IEC is insignificant in the central regions. The descending order of the impact of FD on REC is western, eastern, and central in China.
Fourthly, the urban size results show that the descending order of the impact of FD on IEC is megacities, small cities, and large cities in China. Meanwhile, the impact of FD on IEC in medium-sized cities is insignificant. The descending order of the impact of FD on REC is large cities, small cities, megacities, and medium-sized cities in China. The research also provides evidence for the increase in IEC and REC caused by FD in different regions and urban sizes.
Finally, per-capita GDP, electricity intensity, and population have a significantly positive relationship with IEC (or REC) in the national sample as well as FD indicator. Moreover, the upgrading of industrial structure is conducive to reducing IEC and REC.
6.2. Policy Implications
Based on the above conclusions, the policy implications in this paper are as follows:
Firstly, encourage cooperative development among cities and establish a power monitoring system and information sharing mechanism. IEC and REC are spatially dependent in China. Local governments need to formulate urban electricity consumption policies on the basis of the spatial distribution pattern of IEC and REC. This empirical result provides a clear basis for accurately predicting the growth of electricity consumption in urban residents and industrial sector.
Secondly, improve green electricity credit business. A developed financial market can provide financing channels for green electricity projects. From the perspective of the economic development, supporting power supply is the foundation of economic development. In order to reduce the dependence of economic growth on fossil energy, financial institutions should provide financing services for the development of green electricity (such as hydropower, wind energy, solar photovoltaic cells, etc.). Financial institutions should guide the flow of funds to the green electricity industry, leading to the upgrading of urban electricity consumption structure and promoting the sustainable development of the environment.
Thirdly, promote optimize industrial structure. The Chinese government should optimize industrial structure to reduce electricity consumption by actively developing the tertiary industry. Meanwhile, local governments should promote the upgrading of industrial structure through technological innovation, thereby optimizing the electricity structure.
Author Contributions
Concept, methodology, supervision and writing—review and editing, H.L.; Data curation, formal analysis, investigation, resources, software, validation, visualization and writing—original draft, S.L. All authors have read and agreed to the published version of the manuscript.
Funding
This study was funded by [Project of Tianjin Science and Technology Planning of China (grant No.: 18ZXSZSF00200)].
Conflicts of Interest
All the authors declare no conflict of interest.
References
- An, H.; Xu, J.; Ma, X. Does technological progress and industrial structure reduce electricity consumption? Evidence from spatial and heterogeneity analysis. Struct. Chang. Econ. Dynam. 2020, 52, 206–220. [Google Scholar] [CrossRef]
- Osman, M.; Gachino, G.; Hoque, A. Electricity consumption and economic growth in the GCC countries: Panel data analysis. Energy Policy 2016, 98, 318–327. [Google Scholar] [CrossRef]
- Iyke, B.N. Electricity consumption and economic growth in Nigeria: A revisit of the energy-growth debate. Energy Econ. 2015, 51, 166–176. [Google Scholar] [CrossRef]
- Guo, M.; Hu, Y.; Yu, J. The role of financial development in the process of climate change: Evidence from different panel models in China. Atmos. Pollut. Res. 2019, 10, 1375–1382. [Google Scholar] [CrossRef]
- Karanfil, F. How many times again will we examine the energy-income nexus using a limited range of traditional econometric tools? Energy Policy 2009, 37, 1191–1194. [Google Scholar] [CrossRef]
- Sadorsky, P. The impact of financial development on energy consumption in emerging economies. Energy Policy 2010, 38, 2528–2535. [Google Scholar] [CrossRef]
- Shahbaz, M.; Khan, S.; Tahir, M.I. The dynamic links between energy consumption, economic growth, financial development and trade in China: Fresh evidence from multivariate framework analysis. Energy Econ. 2013, 40, 8–21. [Google Scholar] [CrossRef]
- Kakar, Z.K. Financial development and energy consumption: Evidence from Pakistan and Malaysia. Energy Sources Part B-Econ. Plan. Policy 2016, 11, 868–873. [Google Scholar] [CrossRef]
- Ji, Q.; Zhang, D. How much does financial development contribute to renewable energy growth and upgrading of energy structure in China. Energy Policy 2019, 128, 114–124. [Google Scholar] [CrossRef]
- Baloch, M.A.; Meng, F. Modeling the non-linear relationship between financial development and energy consumption: Statistical experience from OECD countries. Environ. Sci. Pollut. Res. 2019, 26, 8838–8846. [Google Scholar] [CrossRef]
- Maddison, D. Environmental Kuznets curves: A spatial econometric approach. J. Environ. Econ. Manag. 2006, 51, 218–230. [Google Scholar] [CrossRef]
- Wang, K.M. The relationship between carbon dioxide emissions and economic growth: Quantile panel-type analysis. Qual. Quant. 2013, 47, 1337–1366. [Google Scholar] [CrossRef]
- Hao, Y.; Liu, Y.; Weng, J.; Gao, Y. Does the Environmental Kuznets Curve for coal consumption in China exist? New evidence from spatial econometric analysis. Energy 2016, 114, 1214–1223. [Google Scholar] [CrossRef]
- Coban, S.; Topcu, M. The nexus between financial development and energy consumption in the EU: A dynamic panel data analysis. Energy Econ. 2013, 39, 81–88. [Google Scholar] [CrossRef]
- Chtioui, S. Does economic growth and financial development spur energy consumption in Tunisia? J. Econ. Int. Financ. 2014, 4, 150–158. [Google Scholar] [CrossRef]
- Shahbaz, M.; Shahzad, S.J.H.; Ahmad, N.; Alam, S. Financial development and environmental quality: The way forward. Energy Policy 2016, 98, 353–364. [Google Scholar] [CrossRef]
- Yue, S.; Lu, R.; Shen, Y.; Chen, H. How does financial development affect energy consumption? Evidence from 21 transitional countries. Energy Policy 2019, 130, 253–262. [Google Scholar] [CrossRef]
- Aslan, A.; Apergis, N.; Topcu, M. Banking development and energy consumption: Evidence from a panel of Middle Eastern countries. Energy 2014, 72, 427–433. [Google Scholar] [CrossRef]
- Abbasi, F.; Riaz, K. CO2 emissions and financial development in an emerging economy: An augmented VAR approach. Energy Policy 2016, 90, 102–114. [Google Scholar] [CrossRef]
- Ouyang, Y.; Li, P. On the nexus of financial development, economic growth, and energy consumption in China: New perspective from a GMM Panel VAR Approach. Energy Econ. 2018, 71, 238–252. [Google Scholar] [CrossRef]
- Chang, S. Effects of financial developments and income on energy consumption. Int. Rev. Econ. Financ. 2015, 35, 28–44. [Google Scholar] [CrossRef]
- Sadorsky, P. Financial development and energy consumption in Central and Eastern European frontier economies. Energy Policy 2011, 39, 999–1006. [Google Scholar] [CrossRef]
- Farhani, S.; Solarin, S.A. Financial development and energy demand in the United States: New evidence from combined cointegration and asymmetric causality tests. Energy 2017, 134, 1029–1037. [Google Scholar] [CrossRef]
- Riti, J.S.; Shu, Y.; Song, D.; Kamah, M. The contribution of energy use and financial development by source in climate change mitigation process: A global empirical perspective. J. Clean. Prod. 2017, 148, 882–894. [Google Scholar] [CrossRef]
- Furuoka, F. Financial development and energy consumption: Evidence from a heterogeneous panel of Asian countries. Renew. Sustain. Energy Rev. 2015, 52, 430–444. [Google Scholar] [CrossRef]
- Bekhet, H.A.; Matar, A.; Yasmin, T. CO2 emissions, energy consumption, economic growth, and financial development in GCC countries: Dynamic simultaneous equation models. Renew. Sustain. Energy Rev. 2017, 70, 117–132. [Google Scholar] [CrossRef]
- Ahmed, K. Revisiting the role of financial development for energy-growth-trade nexus in BRICS economies. Energy 2017, 128, 487–495. [Google Scholar] [CrossRef]
- Messner, S.F.; Anselin, L.; Baller, R.D.; Hawkins, D.F.; Deane, G.; Tolnay, S.E. The Spatial Patterning of County Homicide Rates: An Application of Exploratory Spatial Data Analysis. J. Quant. Criminol. 1999, 15, 423–450. [Google Scholar] [CrossRef]
- Anselin, L. Local Indicators of Spatial Association—LISA. Geogr. Anal. 2010, 27, 93–115. [Google Scholar] [CrossRef]
- Yuan, H.; Zhang, T.; Feng, Y.; Liu, Y.; Ye, X. Does financial agglomeration promote the green development in China? A spatial spillover perspective. J. Clean. Prod. 2019, 237, 117808. [Google Scholar] [CrossRef]
- Zhang, J.; Chang, Y.; Zhang, L.; Li, D. Do technological innovations promote urban green development? — A spatial econometric analysis of 105 cities in China. J. Clean. Prod. 2018, 182, 395–403. [Google Scholar] [CrossRef]
- Gunji, H.; Yuan, Y. Bank profitability and the bank lending channel: Evidence from China. J. Asian Econ. 2010, 21, 129–141. [Google Scholar] [CrossRef]
- Tchamyou, V.S.; Asongu, S.A. Information sharing and financial sector development in Africa. J. Afr. Bus. 2017, 18, 24–49. [Google Scholar] [CrossRef]
- Allen, F.; Qian, J.; Qian, M. China’s financial system: Past, present, and future. SSRN Electron. J. 2007, 506–568. [Google Scholar] [CrossRef]
- Christopoulos, D.K.; Tsionas, E.G. Financial development and economic growth: Evidence from panel unit root and cointegration tests. J. Dev. Econ. 2004, 73, 55–74. [Google Scholar] [CrossRef]
- Liang, Q.; Teng, J. Financial development and economic growth: Evidence from China. China Econ. Rev. 2006, 17, 395–411. [Google Scholar] [CrossRef]
- Giuliano, P.; Ruizarranz, M. Remittances, financial development, and growth. J. Dev. Econ. 2009, 90, 144–152. [Google Scholar] [CrossRef]
- Wachtel, P.; Hasan, I.; Zhou, M. Institutional development, financial deepening and economic growth: Evidence from China. J. Bank. Financ. 2009, 33, 157–170. [Google Scholar] [CrossRef][Green Version]
- Baltagi, B.H.; Demetriades, P.O.; Law, S.H. Financial development and openness: Evidence from panel data. J. Dev. Econ. 2009, 89, 285–296. [Google Scholar] [CrossRef]
- Yuxiang, K.; Chen, Z. Financial development and environmental performance: Evidence from China. Environ. Dev. Econ. 2011, 16, 93–111. [Google Scholar] [CrossRef]
- Benjamin, N.I.; Lin, B. Influencing factors on electricity demand in Chinese nonmetallic mineral products industry: A quantile perspective. J. Clean. Prod. 2020, 243, 118584. [Google Scholar] [CrossRef]
- Fang, D.; Hao, P.; Hao, J. Study of the influence mechanism of China’s electricity consumption based on multi-period ST-LMDI model. Energy 2019, 170, 730–743. [Google Scholar] [CrossRef]
- Liu, X.; Sun, T.; Feng, Q.; Zhang, D. Dynamic nonlinear influence of urbanization on China’s electricity consumption: Evidence from dynamic economic growth threshold effect. Energy 2020, 196, 117187. [Google Scholar] [CrossRef]
- Lin, B.; Zhu, J. Chinese electricity demand and electricity consumption efficiency: Do the structural changes matter? Appl. Energy 2020, 262, 114505. [Google Scholar] [CrossRef]
- Sheng, P.; Guo, X. Energy consumption associated with urbanization in China: Efficient- and inefficient-use. Energy 2018, 165, 118–125. [Google Scholar] [CrossRef]
- Bakirtas, T.; Akpolat, A.G. The relationship between energy consumption, urbanization, and economic growth in new emerging-market countries. Energy 2018, 147, 110–121. [Google Scholar] [CrossRef]
- Zhang, Y. The impact of financial development on carbon emissions: An empirical analysis in China. Energy Policy 2011, 39, 2197–2203. [Google Scholar] [CrossRef]
- Ayres, R.U.; Turton, H.; Casten, T. Energy efficiency, sustainability and economic growth. Energy 2007, 32, 634–648. [Google Scholar] [CrossRef]
- Qi, S.; Peng, H.; Zhang, X.; Tan, X. Is energy efficiency of Belt and Road Initiative countries catching up or falling behind? Evidence from a panel quantile regression approach. Appl. Energy 2019, 253, 113581. [Google Scholar] [CrossRef]
- He, Y.; Guang, F.; Wang, M. The efficiency of electricity-use of China and its influencing factors. Energy 2018, 163, 258–269. [Google Scholar] [CrossRef]
- Xiong, W.; Wang, Y.; Mathiesen, B.V.; Lund, H.; Zhang, X. Heat roadmap China: New heat strategy to reduce energy consumption towards 2030. Energy 2015, 81, 274–285. [Google Scholar] [CrossRef]
- Fu, S.; Hong, J. Testing urbanization economies in manufacturing industries: Urban diversity or urban size? J. Reg. Sci. 2011, 51, 585–603. [Google Scholar] [CrossRef]


© 2020 by the authors. Licensee MDPI, Basel, Switzerland. This article is an open access article distributed under the terms and conditions of the Creative Commons Attribution (CC BY) license (http://creativecommons.org/licenses/by/4.0/).