Abstract
Case based reasoning is a knowledge discovery technique that uses similar past problems to solve current new problems. It has been applied to many tasks, including the prediction of temporal variables as well as learning techniques such as neural networks, genetic algorithms, decision trees, etc. This paper presents a geometric criterion for selecting similar cases that serve as an exemplar for the target. The proposed technique, called geometric Case Based Reasoning, uses a shape distance method that uses the number of sign changes of features for the target case, especially when extracting nearest neighbors. Thus, this method overcomes the limitation of conventional case-based reasoning in that it uses Euclidean distance and does not consider how nearest neighbors are similar to the target case in terms of changes between previous and current features in a time series. These concepts are investigated against the backdrop of a practical application involving the prediction of a stock market index. The results show that the proposed technique is significantly better than the random walk model at p < 0.01. However, it was not significantly better than the conventional CBR model in the hit rate measure and did not surpass the conventional CBR in the mean absolute percentage error.
1. Introduction
Traditionally, the prediction of stock markets has relied on statistical methods including multivariate statistical methods, autoregressive integrated moving average (ARIMA), and autoregressive conditional heteroscedasticity (ARCH) models. Recently, deep learning and other knowledge techniques have been extensively applied to the task of predicting financial variables. Case-based reasoning (CBR) is one of the most popular methodologies in knowledge-based systems. CBR solves a new problem by recalling and reusing specific knowledge from past experiences []. Research on stock prediction using the CBR technique is lacking, but CBR is used for both research and practical applications in many areas such as medical diagnosis, recommendation systems, cybersecurity detection, and others.
This paper shows how CBR can be applied to stock prediction using a geometric criterion for selecting similar cases to serve as an exemplar for the target. The proposed technique uses a shape distance method that uses the number of sign changes of features for the target case, especially when extracting nearest neighbors. Thus, this method overcomes the limitation of the conventional CBR in that it uses Euclidean distance and does not consider how nearest neighbors are similar to the target case in terms of changes between previous and current features in a time series. We investigated these concepts against the backdrop of a practical application involving the prediction of a stock market index.
The rest of this paper is organized into five sections. Section 2 reviews CBR as a knowledge discovery technique. Section 3 introduces the proposed technique, which is called geometric CBR. Section 4 presents the case study. Section 5 discusses the results of the study. Finally, the concluding remarks are presented in Section 6.
2. Literature Review
2.1. Case-Based Reasoning
Case-based reasoning (CBR) is an approach for solving a new problem by remembering a previous similar situation and reusing information from, and knowledge of, that situation []. This concept assumes that similar problems have similar solutions, so CBR is an appropriate method for a practical domain focused on using real cases rather than rules or knowledge to solve problems. A general CBR cycle was described by the following four processes by Aamodt and Plaza []:
- RETRIEVE the most similar case or cases.
- REUSE the information and knowledge in that case to solve the problem.
- REVISE the proposed solution.
- RETAIN the parts of this experience likely to be useful for future problem solving.
According to this process, CBR solves a problem by retrieving one or more previous cases, reusing them to solve the problem, revising the potential solution based on the previous cases, and retaining the new experience by incorporating it into the existing case-base [].
Conventional methods of prediction based on discrete logic usually seek the single best instance, or a weighted combination of a small number of neighbors in the observational space. An intelligent learning algorithm should therefore consider a “virtual” or composite neighbor whose parameters are defined by some weighted combination of actual neighbors in the case set. In this way, the algorithm can use the knowledge reflected in a larger subset of the case set rather than the immediate collection of proximal neighbors [,,,,,,,,]. The procedure for case reasoning using composite neighbors and the Euclidean distance method is presented in Figure 1.
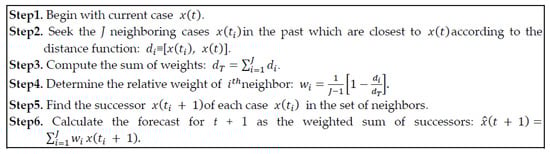
Figure 1.
Predictive procedure using a numerical distance.
One of the issues with using a conventional CBR is that many previously experienced cases must be retrieved. The conventional CBR technique tends to retrieve a fixed number of neighbors in observational space. Thus, it always selects the same number of neighbors irrespective of an optimal number of similar neighbors according to target cases. This fixed number of neighbors raises a problem when some target cases should consider more similar cases while others should consider fewer ones. A problem occurs with conventional CBR when there are too many cases equidistant to target cases. Thus, it does not guarantee optimal similar neighbors for various target cases, which leads to the weakness of lowering predictability due to deviation from desired similar neighbors. Chun and Park [] suggested a model to find the optimal neighbors for each target case dynamically. Park et al. [] suggested a new case extraction technique called statistical case-based reasoning (SCBR), which dynamically adapts the optimal number of neighbors by considering the distribution of distances between potential similar neighbors for each target case.
Conventional CBR using Euclidean distance does not consider how nearest neighbors are similar to the target case in terms of changes between previous and current features in time series. This paper proposes a new similarity measure called shape distance which compares how rise and fall signs between a target case and possible neighbors are similar to each other.
2.2. Case-Based Reasoning in Financial Area
CBR has been intensively exploited to solve problems in the domain of finance, including the predictions of corporate bond ratings [,,], business failure [,,,], financial distress [,,], bankruptcy [,,,,], financial risk [], real estate valuation [], cost estimation [], and prediction of the stock market [,,,].
Although recent research on stock prediction using the CBR technique is scarce, CBR is used in many areas such as medicine [,,,,,,], recommendation systems [,,], and cybersecurity [,].
3. Methodology
In this paper, we propose a shape distance method that selects nearest neighbors according to a slope similarity between two cases. In financial forecasting, hit rate in stock prediction may be an important decision tool for those who invest money in the stock market. Conventional CBR has focused on a numeric distance method and does not consider how possible cases can be similar to the target case in terms of features’ shapes. We developed Kim and Kang’s [] distance measurement method for retrieving neighbors. Before explaining shape similarity, we first introduce the concept of numeric distances, which are used in conventional CBR methods.
3.1. Numeric Distances
The numeric distance refers to the conventional approach for determining the distance between two cases. Numeric distance is based on the differences of multiple features (or instances) between the target case and other learning cases in a stored case box. If one scalar target case xi has m instances (or features), mi = {a1i, a2i, a3i, ..., ami}; then, the distance between xi and xj is given by Equation (1):
More specifically, if one vector target case Xi has n consecutive time series data and each consecutive datum has m features (or instances), then the feature distance between two cases xi and xj is given by Equation (2):
Distance metrics can be used, such as Manhattan distance or Gaussian distance. When the metric of choice is the standard Manhattan distance, the previous relationship becomes Equation (3):
In this paper, we use one vector target case xi, which has one day of stock information and has 4 features (or instances) such as open, high, low, and closed stock prices.
3.2. Shape Distance Method
Time series data may be characterized by their pattern of behavior in terms of rises and falls. Thus, when selecting neighbors, the slopes corresponding to two regional trajectories may be compared to assess the similarity between two cases. Signs such as rises and falls between previous and current stock prices can be a simple shape distance. To understand this new distance method, consider a scalar variable such as the price of a stock. For example, let xt denote the price of a stock at specific time t and m instances (or features), mt = {a1t, a2t, a3t, …, amt}. If we consider n consecutive time series data and each consecutive datum has m features (or instances), xt ≡ (xt-n + 1, …, xt-1, xt)T. Thus, we have a sequence of s consecutive time series data, St ≡ (signt-s +1(st-s*st-s + 1), ..., signt (xt-1*xt))T. Let st denote the sign for observation xt from the previous value xt-1. We denote a difference in successive observations as follows (Equation (4)):
If there are n cases in a stored case box and if xt is a target case, then the shape distance between two cases xt and xn is defined as follows (Equation (5)):
where U denotes the unit step function. The binary function U equals 1 if . and are both positive or both negative, and zero otherwise. When no matches in sign occur, the shape distance attains a maximum of . Conversely, the shape distance reaches its minimum of when all n pairs of slopes match. For simple analysis, we consider a one-day case as a target case. Thus, xt has one day of information (xt) and has only 4 instances: open, high, low, and closed stock prices. Figure 2 presents the procedure for selecting nearest neighbors using shape distance.
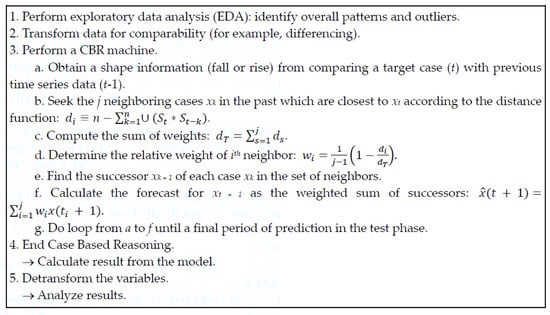
Figure 2.
Predictive procedure using a shape distance method.
4. Application to Stock Market Data
4.1. The Data
With this case study, we aimed to investigate the effect of the proposed technique’s predictive performance in forecasting a stock market index. The case study involved the prediction of the Dow Jones Industrial Average Index (DJI) for two experiments. The first experiment used a large data set for a learning phase which includes daily values starting from 29 January 1985. This is the largest possible dataset that can be obtained using Python from Yahoo Finance. The corresponding Python library is web.DataReader (‘^DJI’, ‘yahoo’, start=‘1985–01–29’, end=‘2020–03–20’). Therefore, for the first case study, the learning phase consisted of 8551 observations from 29 January 1985 to 31 December 2018, and the testing phase consisted of 307 observations from 2 January 2019 to 20 March 2020. The second experiment dealt with a relatively recent dataset beginning from 2006. The learning phase consisted of 3271 observations from 3 January 2006 to 31 December 2018, and the testing phase consisted of 307 observations from 2 January 2019 to 20 March 2020. The raw variables for DJI prediction were as follows:
- Opening value (Open). The value of the Dow Jones Industrial Average Index (DJI) at the beginning of the trading day.
- Daily high (High). The high value for the DJI.
- Daily low (Low). The low value for the DJI.
- Daily close (Close). The close value for the DJI.
4.2. Model Construction
An exploratory plot of the Dow Jones Industrial Average Index (DJI) is given in Figure 3. Other exploratory plots for the raw data series are shown in Figure 4, Figure 5 and Figure 6. Figure 4 depicts the trajectory of the opening value of the DJI. Figure 5 plots the high value of the DJI, and Figure 6 displays the low value of the DJI.
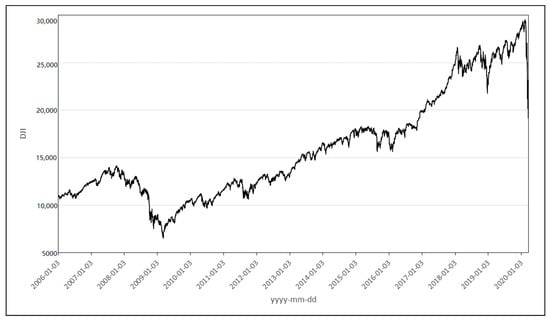
Figure 3.
History of the Dow Jones Industrial Average Index (DJI) from 3 January 2006 to 20 March 2020.
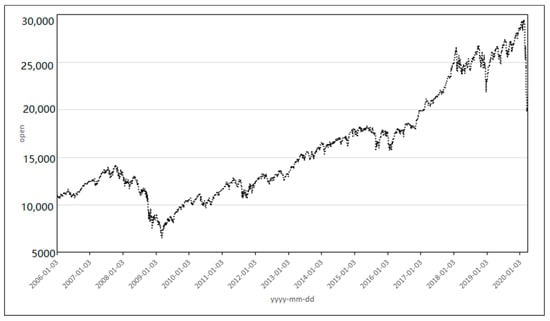
Figure 4.
Time series for the opening value for the Dow Jones Industrial Average Index (DJI) from 3 January 2006 to 20 March 2020.
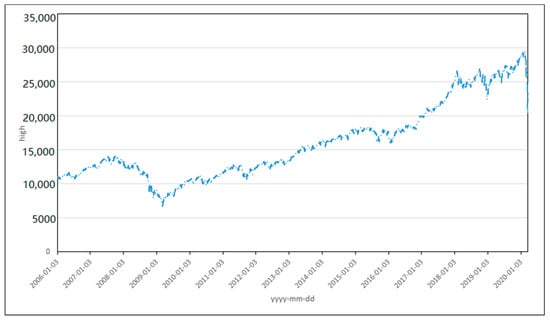
Figure 5.
Time series for the high value for the Dow Jones Industrial Average Index (DJI) from 3 January 2006 to 20 March 2020.
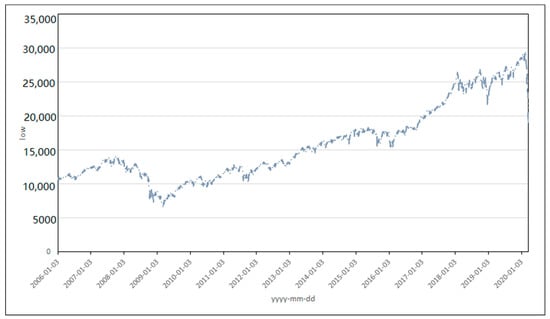
Figure 6.
Time series for the low value for the Dow Jones Industrial Average Index (DJI) from 3 January 2006 to 20 March 2020.
In constructing the predictive model for the DJI, the input variables were first transformed. For financial variables, stationarity can often be obtained through a logarithmic and a differencing operation []. However, because the data we used in the case study did not need to eliminate the effects of measurement units among variables, only a differencing procedure was performed. For example, opening value at t time (Opent) was transformed to be dOpent (Opent - Opent-1) through the differencing procedure. Other input variables such as Hight, Lowt, and Closet were transformed to be dHight, dLowt, and dCloset, respectively. As shown in Figure 7, these variables were used for the prediction engine of geometric CBR to produce the predicted value of dCloset. Then, finally, the predicted value of the closing price at t + 1 (pCloset + 1) was obtained from a de-transforming procedure by adding the predicted value of dCloset to the previous actual closing price at t (Closet). Figure 7 presents an overview of pre-processing and post-processing for producing prediction values by geometric CBR.
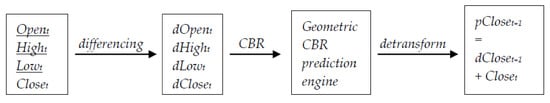
Figure 7.
Overview of preprocessing and postprocessing for geometric CBR prediction.
5. Results
For much of this century, the random walk model of stock prices has served as a pillar of accepted wisdom in financial economics. One implication of the random walk model is that obvious patterns in the economy are already incorporated in the valuation of stock prices and financial markets. This is the rationale behind technical analysis in forecasting stock prices based solely on variables pertaining to the market. The performance results among the predictive models such as the random walk (RW), a conventional CBR using the Euclidean distance method, and geometric CBR (GCBR) using a shape distance method are presented in Table 1 and Table 2.

Table 1.
Hit rate among the forecasting models for the test phase.
Table 2.
Mean Absolute Percentage Error (MAPE) * and pairwise ** t-tests.
Table 1 summarizes the hit rates (the proportion of correct forecasts) in the test data. Hit rates show how well the GCBR predicted the direction of price changes for the closing prices of the DJI. Table 1 indicates that GCBR seems to be significantly more accurate than the random walk model at p < 0.01. We also tested the null hypothesis H0, which states that the proposed GCBR does not produce more accurate performance than the conventional CBR method. Thus, the decision of Reject H0 in Table 1 represents the superior performance of GCBR over the conventional CBR.
When the dataset is small and relatively recent (2006+), GCBR is more accurate than CBR overall. However, the results showed that the outperformance of GCBR is statistically significant only for the case when there is one nearest neighbor. For all other experiments, GCBR was not significantly better than the conventional CBR method. However, when the dataset was large (1985+), GCBR did not perform better than the conventional CBR method. This is because when predicting with few similar incidents in the past, as the dataset becomes larger and when the distance is equal, the possibility increases of using older cases that may have lost their relevance. The results of the first experiment (1985+) implied that when the number of similar cases was in the range of 30 to 100, GCBR exhibited superior performance to CBR. With 75 nearest neighbors, GCBR performed better than CBR to a statistically significant degree, with p < 0.1.
In the second experiment (2006+), the performance of GCBR was most accurate when the number of nearest neighbors was 50; the hit rate of GCBR being 0.5570 and the hit rate of the random walk model being 0.4625. This result implied the possibility of GCBR being superior to a conventional CBR in terms of hit rate.
CBR performed better with the larger dataset (1985+) as it implements a numerical distance method in the learning phase. For GCBR, the first experiment implies that to enhance performance, the number of nearest neighbors must reach a certain level, in this case, 30. This further implies that when two relevant cases found through CBR have the same distance, optimizing using the most recent case will enhance performance.
Table 2 presents the results of MAPE and of the t-test for the difference in performance of the random walk, conventional CBR and GCBR methods, respectively. The GCBR model does not seem to surpass other models. When the number of neighbors was 300, the MAPE of GCBR was best at 0.853. With a large dataset, there are several models where the performance of GCBR was better than CBR, but the difference was insignificant. The two methods also did not exhibit significant performance differences in terms of MAPE. We originally intended to optimize the GCBR model using hit rates; thus, MAPE was expected to be lower. Such results further implied that shape-distance-based GCBR has the potential to enhance MAPE-based performance.
6. Concluding Remarks and Future Work
This paper proposed a shape distance method for selecting nearest neighbors in case-based reasoning. Concepts were investigated against the backdrop of a practical application involving the prediction of a stock market index. The results of the case study are summarized as follows:
- The proposed technique, GCBR, is significantly better than the random walk model at p < 0.01.
- Overall, GCBR is more accurate than conventional CBR models in terms of hit rate. However, the superiority was not statistically significant compared to conventional CBR models.
- The GCBR was not found to surpass a conventional CBR in terms of MAPE.
- GCBR outperformed a conventional CBR in terms of MAPE when the number of nearest neighbors was small and the dataset was recent and smaller.
- When the dataset was larger, GCBR performed significantly more accurately than CBR when the number of nearest neighbors was 75.
- The proposed method has the possibility to improve predictability. Thus, in future research, we propose implementing the shape distance method along with consecutive time series data in searching the nearest neighbors, which would improve GCBR though validating the predictability of GCBR. A promising direction for the future would involve finding optimal neighbors by combining the numeric distance and shape distance methods.
Author Contributions
Conceptualization, S.-H.C. and Y.-W.K.; methodology, S.-H.C.; software, S.-H.C. and Y.-W.K.; validation, S.-H.C. and Y.-W.K.; formal analysis, S.-H.C. and Y.-W.K.; investigation, Y.-W.K.; data curation, Y.-W.K.; visualization, Y.-W.K.; funding acquisition, S.-H.C. All authors have read and agreed to the published version of the manuscript.
Funding
This study was supported by the Research Program funded by the SeoulTech (Seoul National University of Science and Technology).
Conflicts of Interest
The authors declare no conflict of interest.
References
- Ince, H. Short term stock selection with case-based reasoning technique. Appl. Soft Comput. 2014, 22, 205–212. [Google Scholar] [CrossRef]
- Aamodt, A.; Plaza, E. Case-based reasoning: Foundational issues, methodological variations, and system approaches. AI Commun. Eur. J. Artif. Intell. 1994, 7, 39–59. [Google Scholar] [CrossRef]
- Kim, S.H.; Chun, S.H. Graded forecasting using an array of bipolar predictions: Application of probabilistic neural networks to a stock market index. Int. J. Forecast. 1998, 14, 323–337. [Google Scholar] [CrossRef]
- Chun, S.-H.; Kim, K.; Kim, S.H. Chaotic analysis of predictability versus knowledge discovery techniques: Case study of the Polish stock market. Expert Syst. 2002, 19, 264–272. [Google Scholar] [CrossRef]
- Chun, S.-H.; Kim, S.H. Impact of momentum bias on forecasting through knowledge discovery techniques in the foreign exchange market. Expert Syst. Appl. 2003, 24, 115–122. [Google Scholar] [CrossRef]
- Chun, S.-H.; Kim, S.H. Data mining for financial prediction and trading: Application to single and multiple markets. Expert Syst. Appl. 2004, 26, 131–139. [Google Scholar] [CrossRef]
- Chun, S.-H.; Kim, S.H. Automated generation of new knowledge to support managerial decision making: Case study in forecasting a stock market. Expert Syst. 2004, 21, 192–207. [Google Scholar] [CrossRef]
- Chun, S.-H.; Park, Y.-J. Dynamic adaptive ensemble case-based reasoning: Application to stock market prediction. Expert Syst. Appl. 2005, 28, 435–443. [Google Scholar] [CrossRef]
- Chun, S.-H.; Park, Y.-J. A new hybrid data mining technique using a regression case based reasoning: Application to financial forecasting. Expert Syst. Appl. 2006, 31, 329–336. [Google Scholar] [CrossRef]
- Park, Y.J.; Kim, B.C.; Chun, S.H. New knowledge extraction technique using probability for case-based reasoning: Application to medical diagnosis. Expert Syst. 2006, 23, 2–20. [Google Scholar] [CrossRef]
- Chun, S.-C.; Kim, J.; Hahm, K.-B.; Park, Y.-J.; Chun, S.-H. Data mining technique for medical informatics: Detecting gastric cancer using case-based reasoning and single nucleotide polymorphisms. Expert Syst. 2008, 25, 163–172. [Google Scholar] [CrossRef]
- Dutta, S.; Shekkar, S. Bond rating: A non-conservative application of neural networks. Int. Jt. Conf. Neural Netw. 1988, 2, 443–450. [Google Scholar]
- Shin, K.S.; Han, I.A. Case-based approach using inductive indexing for corporate bond rating. Decis. Support Syst. 2001, 32, 41–52. [Google Scholar] [CrossRef]
- Kim, K.; Han, I. Maintaining case-based reasoning systems using a genetic algorithms approach. Expert Syst. Appl. 2001, 21, 139–145. [Google Scholar] [CrossRef]
- Li, H.; Sun, J. Gaussian case-based reasoning for business failure prediction with empirical data in China. Inf. Sci. 2009, 179, 89–108. [Google Scholar] [CrossRef]
- Li, H.; Huang, H.-B.; Sun, J.; Lin, C. On sensitivity of case-based reasoning to optimal feature subsets in business failure prediction. Expert Syst. Appl. 2010, 37, 4811–4821. [Google Scholar] [CrossRef]
- Li, H.; Sun, J. Predicting business failure using an RSF-based case-based reasoning ensemble forecasting method. J. Forecast. 2013, 32, 180–192. [Google Scholar] [CrossRef]
- Yip, A.Y.N. Business failure prediction: A case-based reasoning approach. Rev. Pac. Basin Financ. Mark. Policies 2006, 9, 491–508. [Google Scholar] [CrossRef]
- Li, H.; Sun, J. Ranking-order case-based reasoning for financial distress prediction. J. Knowl. Based Syst. 2008, 21, 868–878. [Google Scholar] [CrossRef]
- Li, H.; Sun, J.; Sun, B.-L. Financial distress prediction based on OR-CBR in the principle of k-nearest neighbors. Expert Syst. Appl. 2009, 36, 643–659. [Google Scholar] [CrossRef]
- Li, H.; Sun, J. On performance of case-based reasoning in Chinese business failure prediction from sensitivity, specificity, positive and negative values. J. Appl. Soft Comput. 2011, 11, 460–467. [Google Scholar] [CrossRef]
- Bryant, S.M. A case-based reasoning approach to bankruptcy prediction modeling. Intell. Syst. Account. Financ. Manag. 1997, 6, 195–214. [Google Scholar] [CrossRef]
- Elhadi, M.T. Bankruptcy support system: Taking advantage of information retrieval and case-based reasoning. Expert Syst. Appl. 2000, 18, 215–219. [Google Scholar] [CrossRef]
- Park, C.S.; Han, I. A case-based reasoning with the feature weights derived by analytic hierarchy process for bankruptcy prediction. Expert Syst. Appl. 2002, 23, 255–264. [Google Scholar] [CrossRef]
- Ahn, H.; Kim, K.J. Bankruptcy prediction modeling with hybrid case-based reasoning and genetic algorithms approach. Appl. Soft Comput. 2009, 9, 599–607. [Google Scholar] [CrossRef]
- Yip, A.Y.N. Predicting business failure with a case-based reasoning approach. In Proceedings of the Knowledge-Based Intelligent Information and Engineering Systems: 8th International Conference, Wellington, New Zealand, 20–25 September 2004. [Google Scholar]
- Kapdan, F.; Aktas, M.G.; Aktas, M.S. Financial risk prediction based on case based reasoning methodology. In Proceedings of the 2019 Innovations in Intelligent Systems and Applications Conference (ASYU) Intelligent Systems and Applications Conference (ASYU), Izmir, Turkey, 31 October–2 November 2019. [Google Scholar]
- Yeh, I.-C.; Hsu, T.-K. Building real estate valuation models with comparative approach through case-based reasoning. Appl. Soft Comput. 2018, 65, 260–271. [Google Scholar] [CrossRef]
- Relich, M.; Pawlewski, P. A case-based reasoning approach to cost estimation of new product development. Neurocomputing 2018, 272, 40–45. [Google Scholar] [CrossRef]
- Lei, Z.; Yin, D. Intelligent generation technology of sub-health diagnosis case based on case reasoning. In Proceedings of the 2019 IEEE 3rd Advanced Information Management, Communicates, Electronic and Automation Control Conference (IMCEC), Chongqing, China, 11–13 October 2019. [Google Scholar]
- Elisabet, D.; Sensuse, D.I.; Al Hakim, S. Implementation of case-method cycle for case-based reasoning in human medical health: A systematic review. In Proceedings of the 2019 3rd International Conference on Informatics and Computational Sciences (ICICoS), Informatics and Computational Sciences (ICICoS), Semarang, Indonesia, 29–30 October 2019. [Google Scholar]
- Chowdhury, A.R.; Banerjee, S. Case Based reasoning in retina abnormalities detection. In Proceedings of the 2019 4th International Conference on Information Systems and Computer Networks (ISCON) Information Systems and Computer Networks (ISCON), Mathura, India, 21–22 November 2019. [Google Scholar]
- Lamy, J.-B.; Sekar, B.; Guezennec, G.; Bouaud, J.; Seroussi, B. Hierarchical visual case-based reasoning for supporting breast cancer therapy. In Proceedings of the 2019 Fifth International Conference on Advances in Biomedical Engineering (ICABME), Tripoli, Lebanon, 17–19 October 2019. [Google Scholar]
- Bentaiba-Lagrid, M.B.; Bouzar-Benlabiod, L.; Rubin, S.H.; Bouabana-Tebibel, T.; Hanini, M.R. A case-based reasoning system for supervised classification problems in the medical field. Expert Syst. Appl. 2020, 150, 113335. [Google Scholar] [CrossRef]
- Lamy, J.-B.; Sekar, B.; Guezennec, G.; Bouaud, J.; Séroussi, B. Explainable artificial intelligence for breast cancer: A visual case-based reasoning approach. Artif. Intell. Med. 2019, 94, 42–53. [Google Scholar] [CrossRef]
- Silva, G.C.; Carvalho, E.E.O.; Caminhas, W.M. An artificial immune systems approach to case-based reasoning applied to fault detection and diagnosis. Expert Syst. Appl. 2020, 140, 112906. [Google Scholar] [CrossRef]
- Sun, J.; Zhai, Y.; Zhao, Y.; Li, J.; Yan, N. Information acquisition and analysis technology of personalized recommendation system based on case-based reasoning for internet of things. In Proceedings of the 2018 International Conference on Cyber-Enabled Distributed Computing and Knowledge Discovery (CyberC), Zhengzhou, China, 18–20 October 2018. [Google Scholar]
- Supic, H. Case-based reasoning model for personalized learning path recommendation in example-based learning activities. In Proceedings of the 2018 IEEE 27th International Conference on Enabling Technologies: Infrastructure for Collaborative Enterprises (WETICE), WETICE Enabling Technologies: Infrastructure for Collaborative Enterprises (WETICE), Paris, France, 27–29 June 2018. [Google Scholar]
- Corrales, D.C.; Ledezma, A.; Corrales, J.C. A case-based reasoning system for recommendation of data cleaning algorithms in classification and regression tasks. Appl. Soft Comput. 2020, 90, 106180. [Google Scholar] [CrossRef]
- Nunes, R.C.; Colomé, M.; Barcelos, F.A.; Garbin, M.; Paulus, G.B.; Silva, L.A.D.L. A case-based reasoning approach for the cybersecurity incident recording and resolution. Int. J. Softw. Eng. Knowl. Eng. 2019, 29, 1607–1627. [Google Scholar] [CrossRef]
- Abutair, H.; Belghith, A.; AlAhmadi, S. CBR-PDS: A case-based reasoning phishing detection system. J. Ambient. Intell. Humaniz. Comput. 2019, 10, 2593–2606. [Google Scholar] [CrossRef]
- Kim, S.H.; Kang, D.S. A new geometric criterion for case based reasoning in time series prediction. Spring Conf. Proc. Korean Inst. Ind. Eng. 1997, 4, 191–194. [Google Scholar]
© 2020 by the authors. Licensee MDPI, Basel, Switzerland. This article is an open access article distributed under the terms and conditions of the Creative Commons Attribution (CC BY) license (http://creativecommons.org/licenses/by/4.0/).