Abstract
High-tech zones (HTZs), as important economic growth poles, have played a key role in China’s economic boom. A method based on multi-criteria decision-making (MCDM) and particle swarm optimization (PSO) is proposed to evaluate economic benefits of HTZs. MCDM involves analytic hierarchy process (AHP) and technique for order preference by similarity to an ideal solution (TOPSIS) as they are easy and simple to calculate. AHP is used to construct judgment matrix. Then, the judgment matrix is converted to a constraint optimization problem. PSO is adopted to optimize the problem and get weights of indicators. TOPSIS is used to make the evaluation. The results from 2012 to 2016 of 105 HTZs are obtained and hierarchical clustering analysis is applied to cluster results. The results have demonstrated that the rankings of Zhongguancun Technology Park and Wuhan East Lake HTZ have always been at the forefront, and the ranking of Kunshan New District has risen rapidly, while Shenyang HTZ has dropped significantly. According to the results, some targeted suggestions have been proposed for the development of HTZs.
1. Introduction
1.1. Background of the HTZs
As an important institutional arrangement for the promotion of research, development and innovation, and technology transfer, high-tech zones (HTZs), or science parks, have aroused increasing attention worldwide. HTZs concept originated in the 1950s. Founded by a Stanford University professor, the Stanford research institute is the first science and technology park in the world. Since then, a number of countries have implemented these types of parks to develop and revitalize regions, boost high-tech industry sectors, foster greater industry–academia interaction, support new technology-based firms, and encourage academic spin-offs [1], especially in emerging countries such as China.
In order to promote the commercialization of science & technology (S&T) achievements, the industrialization of R&D results, and the internationalization of high-tech industries, China launched the “863 program” and the Torch Program successively in the late 1980s [2]. HTZs were the most visible accomplishment of the Torch Program. HTZs were created to assist firms develop and commercialize technology-based innovations in a designated high-tech concentrated or clustered geographic area. At the beginning of the program, HTZs were established in major cities building on the existing intelligence and industrial base. Until 2000, HTZs were built in major cities like Beijing, Shanghai, or in provincial capitals and other fast-developing urban areas [2]. With the constant development, HTZs have become the internal impetus for economic development in China. Nowadays, HTZs have been given new missions to lead China’s industrial upgrading and to help maintain the country’s steady economic growth [3]. Until 2017, 156 HTZs had been established [4].
However, as the number of national HTZs has surged from 54 to 156, many problems emerged. Bai [5] pointed that the technical efficiencies of both production sectors and R&D sectors were low in most Chinese National HTZs. Furthermore, a considerable number of HTZs are not clear about their own function positioning and lack the awareness of the new trend in economic development [6]. Therefore, it is necessary to select appropriate indicators and methods to evaluate their performances. Most studies about HTZs are based on qualitative analysis and limit themselves to fields such as comparing the performances of new technology-based firms in and outside HTZs, the survival rate, the relationship between enterprises and scientific research institutions, and innovative capabilities and operational efficiency [5,7,8]. Among them, innovation ability is the main driving force for promoting the rapid development of a zone. Zhang and Gu [9] used an innovation capacity index as a first-grade index and 19 second-grade indices to analyze 56 NHTZs’ innovation abilities through the way of principal component analysis. Based on Porter’s model for the innovation orientation of national industrial cluster, Lai and Shyu [10] proposed a new model to analyze the science parks in innovation capacity across the Taiwan Strait. For another, operational efficiency is a significant indicator to measure the development quality and technical level of HTZs. Li [11] took the operational efficiency as the starting point, and explored the key factors that affect its development, so as to promote the further development of HTZs. Ma and Goo [3] studied the relative efficiency and total factor productivity (TFP) change of the zones in China with the data envelopment analysis (DEA) and Malmquist productivity index (MPI). In addition, some scholars evaluated the park from the perspective of urban eco-industrial system [12] and the degree of intensive land use [13]. A new framework based on the combination of the dynamic DEA, meta-frontier analysis theory, and truncated regression model was proposed, which focused on the efficiency evaluation of regional high-tech industries in China [14]. DEA was used to generate quantitative indices for national HTZs comparisons [15]. Xiao [16] set up the evaluation index system from three aspects, namely innovation input, incubating ability, and innovation output to evaluate the innovation ability of 54 national HTZs. Li [11] conducted in-depth research on the operating efficiency and decomposition index of 27 national HTZs in 2011, 2014, and 2017 with the DEA method.
1.2. The Research Topic
HTZs are of great importance to the development of China economy. Currently, there are relatively few studies about economic benefits of HTZs. It mainly uses the factor analysis method and data envelope analysis (DEA), and also adopts the improved algorithm, which provides a reference for the research of this paper. Zhao and Niu [17] used the factor analysis method to evaluate the economic benefit of 115 HTZs in China. The results of various HTZ score and ranking show that the rapid development of China’s HTZs has a driving effect, and there is also the problem of imbalanced development between the east and the west. Ge and Xiong [18] applied the method based on “difference drive” theory from both transverse and lengthwise analysis to dynamically evaluate the economic returns of 53 HTZs from 1998 to 2000. The conclusion showed that HTZs should have a clear development position, and came up with early warning and countermeasures for the imbalance in economic benefits and economic strength of some HTZs. Liu [19] used DEA method to carry out the comprehensive evaluation of economic returns of 30 HTZs. Also, through the projection analysis, the improvement direction of non-DEA available HTZ for the future is found, and the countermeasures and suggestions are advanced. Hao [20] proposed the improved neural networks evaluation model (using the adaptive learning rate, momentum factor), which can simulate evaluation made by the experts and avoid subjective mistakes. To sum up, the current research mainly uses a single method for evaluation, and the number of HTZs involved is relatively small, and the years are earlier. Therefore, it is necessary to expand the sample size of HTZs and analyze it with recent data, which is our motivation.
Generally, the main procedure of evaluation methods involves: Establishing the index system, and then adopting multi-criteria decision-making (MCDM) approaches to make the assessment. Nowadays, there are various MCDM methods, such as analytic hierarchy process (AHP), vlsekriterijumska optimizacija ikompromisno resenje (VIKOR), technique for order preference by similarity to ideal solution (TOPSIS), TODIM (an acronym in Portuguese of interactive and multiple attribute decision making), and so on. AHP is simple and has the capacity of utilizing experts’ experience. The working hypotheses is that these experts are rational. VIKOR behaves well at the situation of criterion conflict but compromises the solution. Furthermore, the computational process of VIKOR is complex when dealing with terse data while TOPSIS is very easy to implement and understand. It has no any restriction on sample size and index quantity. As TODIM has the ability to reflect DMs’ behavioral characteristics, it is widely used in uncertain environment [21]. By comparisons, AHP and TOPSIS are adopted to make assessments of HTZs. As relative weights among index system are not equal, it is necessary to solve weights. Different from the conventional weight solving methods, the problem of solving weights is converted to a typical constraint optimization problem (COP). PSO algorithm is adopted to solve the COP as PSO has superior performances. Therefore, AHP framework, PSO, and TOPSIS are combined together to evaluate HTZs, which is very novel.
Based on the above discussion, the main contributions of the paper are as follows:
- An index system of HTZs economic benefits is put forward, including number of enterprises, number of employees, total income, gross industrial output value, tax, net profit, and exports.
- An evaluation approach based on AHP, PSO, and TOPSIS is proposed. AHP is used to construct the judgment matrix, PSO is applied to solve weights of indicators, and TOPSIS is used to make evaluations.
- 105 HTZs are evaluated based on the proposed method and index system. The results are clustered by hierarchical clustering analysis (HCA).
2. Research Methodology
This section is a description of the research methodology after the research theme has been identified. In this section, we mainly introduce the research framework of the paper, the construction of the index system, and the specific content of each research method, including AHP, PSO, TOPSIS, and HCA.
As the evaluation HTZs involves different indicators, MCDM can be adopted to solve the problem. MCDM models are considered as the potential tools in judging various alternatives and helping to analyze complex problems. Generally, MCDM models contain a suite of methods, e.g., AHP, VIKOR, TOPSIS, TODIM, and so on. By analyzing the advantages and disadvantages between these various methods, AHP and TOPSIS are selected to make evaluations. Wang [22] has proved the results of sensitivity analysis confirmed that the combination of AHP and TOPSIS was reasonable and practicable. AHP is capable of utilizing experts’ experiences and simple to use. At the same time, TOPSIS is also easy to use and understand, even has no restriction on sample size and index quantity. In detail, AHP is applied to establish pairwise comparison matrix. Then, solving the pairwise comparison matrix is converted to a COP. PSO is used to solve weights, which is different from the conventional method. The conventional method is based on AHP itself. As last, these weights are further used in TOPSIS to rank the economic benefit of HTZs.
In order to better illustrate the research framework, the steps involved in this research are presented in Figure 1. The whole process is divided into four phases. In the first phase, the main purpose was to identify criteria. A total of 105 alternative HTZs were selected from the data that were collected in this paper. After listing alternative HTZs, according to the principle of index selection, the evaluation index system was constructed, which is the key step in the phase. Then, starting from the research problems, a decision hierarchy was constructed correspondingly. In the second phase, some experts from the field of HTZs were invited and they were asked to give their opinions about the relative importance of these criteria by AHP theory. Then, combined with experts’ opinions together, a judgment matrix was constructed. Then, the problem was transformed into the COP, which was optimized by PSO algorithm. In the third phase, the TOPSIS method was used to evaluate HTZs and get the final ranking. In the final phase, cluster analysis was performed on the total score calculated in the previous stage of TOPSIS, and the results were analyzed and some useful suggestions were provided to the development of HTZs.
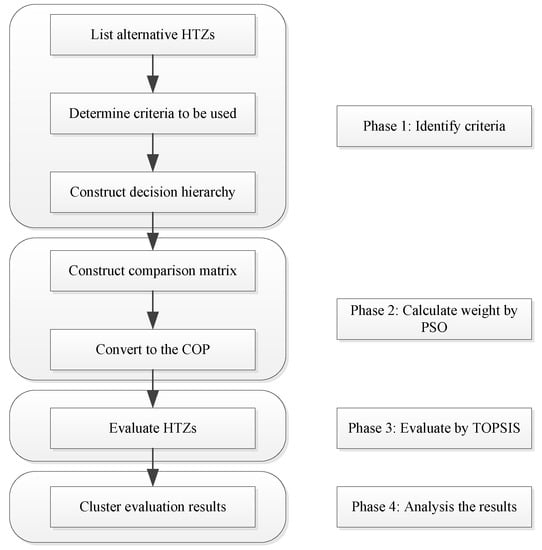
Figure 1.
Research framework.
2.1. Construct the Evaluation Index System
In the United States, the evaluation system for HTZs and science park includes the following eight indicators: (1) Mobility of researchers; (2) efficiency of transformation of scientific research results; (3) the development of entrepreneurship; (4) service and environmental quality of park facilities; (5) service and environmental quality of park facilities; (6) the level of support from local governments; (7) public financial support for scientific research; and (8) international openness [23]. On the basis of the evaluation index system, researchers and the hypermobility of capital are the main characteristic of science and technology parks [24]. As the first country to establish a science park, its index system has a certain reference value.
In China, the ministry of science and technology has issued the evaluation index system of national HTZs likewise, which consists of four first-level indicators: (1) Knowledge creation and technological innovation ability (30%); (2) industrialization and structural optimization ability (30%); (3) internationalization and participation in global competition ability (20%); and (4) sustainable development ability of HTZs (20%) [25]. It has shown that the country attaches great importance to the innovation ability and industrial structure of HTZs.
Similarly, scholars have also adopted various methods and selected corresponding indicators to construct indicator systems. Based on the factor analysis, combined with the data of the 2012 China torch statistical yearbook, Zhao selected 13 indicators such as technical income, sales revenue, number of enterprises, and funds for science and technology activities as the evaluation indicators for the comprehensive development level of the HTZ [23]. Using the same method, Zhao and Fan built the evaluation system with 8 indicators like operation revenue, gross industrial output value, net profit, and so on to analyze the economic benefit of national HTZ [17]. Wu used AHP to construct the basic framework of the evaluation index system of science and technology parks in China from three aspects: Technological innovation ability, institutional innovation ability, and supporting innovation ability [24].
This paper refers to the data in the national high-tech Zone comprehensive development and data analysis report from 2012 to 2016 issued by Torch High Technology Industry Development Center, Ministry of Science and Technology, and sorted them out. Combining the principles of scientificity, accessibility, and clarity of index selection [17,26], the index system was finally constructed by selecting seven indicators including number of enterprises, number of employees, total income, gross industrial output value, taxes, net profit, and export [27,28,29,30,31]. Table 1 depicts the detailed definitions of the various indexes.

Table 1.
The evaluation index system of high-tech zones (HTZs).
2.2. AHP
AHP is perhaps the most popular methodology that has been used in various MCDM problems, which can be successfully applied to qualitative as well as quantitative data. The main advantages of this methodology are as follows. First of all, it is a systematic analysis method, which can transform a complex and multi-criteria problem into a hierarchical structure [32]. Secondly, the methodology requires simple and minimal mathematical calculations [33]. At last, it requires less quantitative information as compared to other MCDM methods. The general steps of AHP are to establish an evaluation index system according to the target and influencing factors, construct a judgment matrix for quantitative processing, calculate the relative theoretical weight of each factor, and check the consistency.
Let be a set of alternatives and be a set of criteria. Making pairwise comparison among n criteria, a judgment matrix of criteria is formed in which each component , represents the comparison value of each criterion.
where the value of is determined by decision makers subjectively. The judgment matrix is established to calculate the importance of the criteria in each unit, by using numbers 1 through 9 and their reciprocals as a scale to obtain matrix .
Equation (1) can be converted to Equation (2) when the matrix is completely consistent.
However, it is very hard to meet the condition that the matrix is completely consistent in real applications. Then, Equation (2) can be converted to the following expression:
This is the constraint optimization problem. The objective function is Equation (3), and the constraint is Equation (4). It can be optimized by evolutionary algorithms (EAs). Now, there are various EAs available, such as PSO, genetic algorithm (GA), and so on. They are available to optimize constraint optimization problems. As the performance of PSO is attractive, it is adopted to solve the COP. The approach is different from the conventional solving weights method, which is directly based on AHP itself.
2.3. PSO
As a kind of swarm intelligence algorithms, PSO imitates human social behavior, which is proposed by Kennedy and Eberhart in 2001. In PSO, a swarm consists of m individuals (called particles) that fly around in an n-dimensional search space. Suppose that we have an optimization problem that is defined over a continuous domain of d dimensions. We also have a population of N candidate solutions, denoted as . Furthermore, suppose that each individual is moving with some velocity through the search space.
The position of the th particle at the th iteration is used to evaluate the particle and represent the candidate solution for the optimization problem. It can be represented as , where is the position value of the th particle with respect to the th dimension . During the search process, the position of a particle is guided by two factors: The best position visited by itself denoted as , and the position of the best particle found so far in the swarm denoted as . The new velocity (denoted as ) and position of particle i at the next iteration are calculated according to:
where is the inertia weight, are respectively the cognitive and social learning parameters, and are random numbers between (0, 1). Based on the above equations, the particle can fly through search space toward and in a navigated way [34].
The main procedure of PSO can be depicted by Figure 2. Of course, Equation (3) can be optimized by PSO.
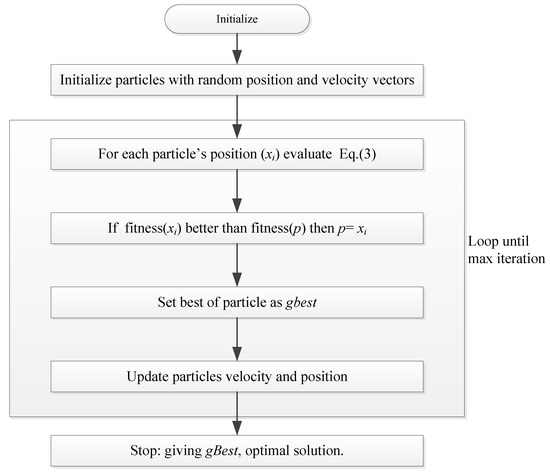
Figure 2.
The flowchart of particle swarm optimization (PSO).
2.4. TOPSIS
As one of the famous MCDMs, TOPSIS was first presented by Hwang and Yoon in 1981. Its aims to evaluate the distance from the evaluated object to the positive ideal solution and the negative ideal solution so that the evaluated object is closer to the positive ideal solution and farther away from the negative ideal solution [22]. TOPSIS is a popular method for ranking the alternatives in MCDM problems because it is capable of ranking the best alternatives quickly. Furthermore, TOPSIS makes the best use of data information and the calculation is simple and feasible. Furthermore, TOPSIS is usually amalgamated with other methods to solve decision-making problems. Generally, TOPSIS can be operated in six distinct steps.
Let be a set of alternatives to be evaluated and let be a collection of evaluation indicators, which constitutes the evaluation matrix . represents the value of th evaluation indicator of th alternative.
Step 1: Process the evaluation index in the same trends
The step aims to convert the cost type index into the benefit type index.
Step 2: Normalization of the same trend matrix.
Step 3: Determine the positive ideal solution () and the negative ideal solution (), respectively.
Step 4: Compute the separation distance between each evaluation alternative and the optimal scheme, respectively. Similarly, the distance between each evaluation alternative and the worst scheme is calculated as well. For the weighted TOPSIS method, the weight is solving by PSO.
where is the relative importance among indicators and is calculated by the PSO algorithm in Section 2.3.
Step 5: Compute the relative closeness coefficient to the ideal solutions.
Step 6: Based on the value, namely the relative closeness coefficient, the evaluation alternatives are ranked. The larger the value is, the better the comprehensive benefit is.
2.5. Hierarchical Cluster Analysis (HCA)
Hierarchical clustering is a kind of systematic clustering method, which is the task of grouping a set of objects in such a way that objects in the same group, called a cluster, are more similar in some sense to each other than to those in other clusters. Hierarchical clustering is divided into agglomerative hierarchical clustering and divisive hierarchical clustering [35]. Usually, the former method is used, whose calculation principle is as follows [33,34,35,36].
Step 1: Treat all n variables as different classes.
Step 2: Merge the two classes closest to each other into one class.
Step 3: Find the two closest classes from the rest (n − 1) class and merge them.
Step 4: In a similar fashion, until all variables are merged into one category.
In short, the algorithm determines the similarity between each category and all categories by calculating the distance between them. The HCA mainly uses the Euclidean Distance as follows.
Equation (14) shows the Euclidean Distance from the point (, to the point (, in two dimensions. The smaller the distance is, the higher the similarity is, and the two categories are closer to each other. The agglomerative algorithm is shown in Figure 3.
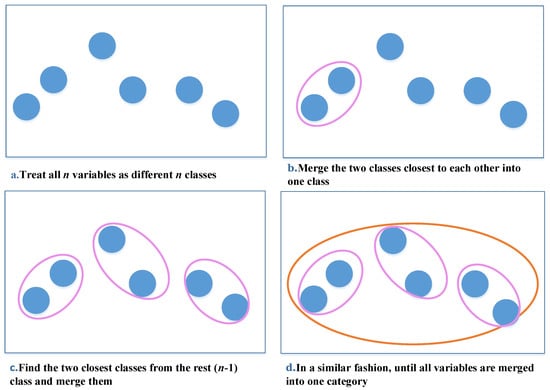
Figure 3.
Graphical representation of hierarchical cluster analysis (HCA) algorithm process.
The characteristic of HCA is that it does not need to determine the number of clusters in advance, but finds the hierarchical relationship between classes through similarity calculation. In addition, because the similarity can be defined by the distance formula, the method has fewer restrictions when used.
2.6. The Evaluation Procedure
Summarizing the above analysis, we come up with the evaluation procedure as follows:
Step 1: Analyze the evaluation problem and determine the set of alternatives . Let be a collection of evaluation indicators, which constitutes the matrix . represents the value of th indicator of alternative th.
Step 2: According to the framework of AHP and PSO algorithm, the weight of the indicators can be obtained by Equation (3) when the information about weight is known.
Step 3: Normalize the matrix based on the nature of indicators according to Equations (7) and (8), respectively.
Step 4: Determine the positive ideal solution () and the negative ideal solution () by Equations (9) and (10), respectively.
Step 5: Calculate the distance and between each evaluation object and the optimal scheme respectively by Equations (11) and (12), respectively.
Step 6: Compute the closeness coefficient of each alternative by Equation (13).
Step 7: Cluster the results based on hierarchical cluster analysis.
Step 8: Sensitivity analysis.
3. Empirical Study
In this section, we mainly apply the above theory to practice, evaluate the economic benefits of 105 HTZs, and discuss the results.
One hundred and five HTZs were selected around China, including Zhongguancun Technology Park, Wuhan East Lake HTZ, and so on. A secondary dataset of indexes was collected from Statistical Yearbook and urban statistical yearbook from 2012 to 2016. In order to elaborate the whole procedure, the evaluation of 2012 was taken as an example.
3.1. Evaluate HTZs in 2012
Based on the data that were collected, the proposed method was applied into the case study to gain the ranking of HTZs among 105 cities. The detailed process is as follows:
Step 1: Let the set of alternatives , be a collection of evaluation indicators. Zhongguancun Technology Park; Tianjin HTZ; …, Changji HTZ. = Number of Enterprises; Year-End Number of Employees; = Total Income; = Gross Industrial Output Value; = Tax Submitted; = Net Profit; = Exports.
Step 2: Compute weights. The evaluation indicators of HTZs are classified into different grades by decision makers. The judgment matrix A of economic benefit of HTZs can be obtained below.
Based on Equation (3), solving weights of seven indicators is converted to the following Equations (16) and (17).
Equation (16) can be optimized by PSO algorithm. The results are listed in Table 2. It can be found that total income (C3) is given the most weight. Decision makers attach more importance on this indicator. In addition, it can be seen from Table 3 that Number of Enterprises (C1) is highly correlated with Number of Employees (C2) and Total Income (C3), and Exports (C7) is relatively low with Number of Enterprises (C1) and Tax (C5). This implies that there may be a synergistic effect between Number of Enterprises (C1), Number of Employees (C2), and Total Income (C3).
Table 2.
The weights obtained.
Table 3.
Correlation matrix.
Step 3: Normalize the matrix based on the nature of indicator according to Equations (7) and (8), respectively. As seven indicators are benefit criteria, they can be normalized the same way. The matrix has 105 rows and 7 columns. Due to the large amount of data, only the results of the previous 10 and the last 10 HTZs are displayed in Table 4.
Table 4.
The normalized matrix of the previous 10 and the last 10 HTZs.
Step 4: Determine the positive ideal solution () and negative ideal solution (), respectively.
According to Equation (9), the positive ideal solution consists of the maximum values of each column. Similarly, the negative ideal solution is calculated as well Equation (10). The results are listed below.
0.8853, 0.7283, 0.7881, 0.3727, 0.7501, 0.6834, 0.0218)
= (0.0008, 0.0035, 0.0018, 0.0034, 0.0006, −0.0015, 0.0001)
Step 5: Using Equations (11,12), distances from the positive and negative ideal solutions () are calculated for alternatives, which are displayed in Table 5.
Table 5.
The final rank of the previous 10 and the last 10 HTZs in 2012.
Step 6: The values are computed using Equation (13) for all alternatives using the and values. For the sake of presentation, Table 4 only shows the detailed results of the previous 10 and the last 10 HTZs in 2012, which are demonstrated in Table 5.
Step 7: Hierarchical cluster analysis (HCA)
As HCA has the characteristics of no need for pre-classification and easy to use, it is used to conduct clustering analysis on the comprehensive scores of HTZs. Since has been standardized, the steps of standardization are not included in the follow-up operation. Figure 4 is produced to show the clustering situation of HTZs, so as to better analyze the development and change of HTZs over the years and the underlying reasons.
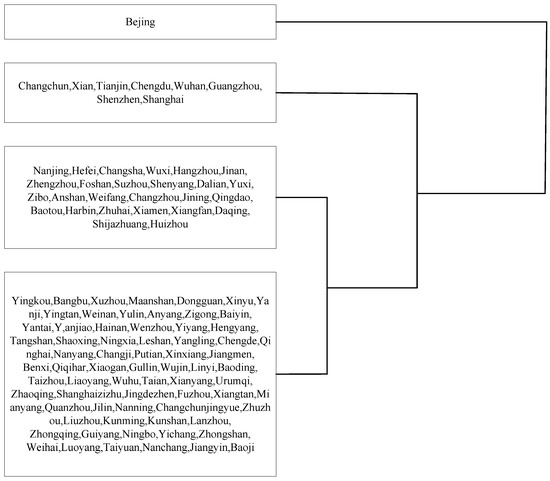
Figure 4.
Clustering results.
Following the above procedure, the final evaluation results can be obtained and are depicted in Figure 5.
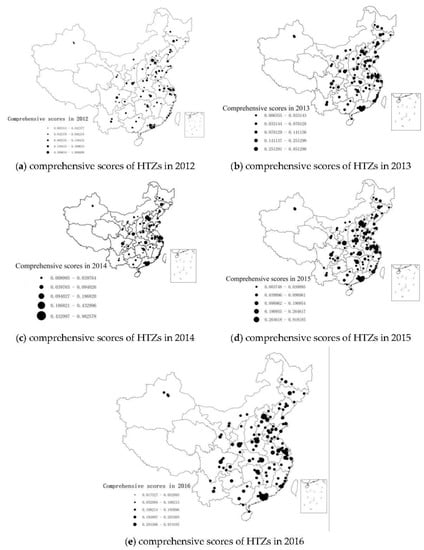
Figure 5.
Comprehensive scores of HTZs from (a) 2012, (b) 2013, (c) 2014, (d) 2015 to (e) 2016.
Step 8: Sensitivity Analysis
Due to the subjectivity in the calculation of weights, a sensitivity analysis is performed to assess the influence of the weights on the final rank. Considering the impact of exports on the future economic benefits of HTZs, that is, the export is the “second venture” of HTZs, we set the export as the highest weight, and adjust the original highest-weight total income to the third largest weight, second to net profit. Details are shown in Table 6. Using the adjusted weights to re-evaluate and rank HTZs, the results show that the ranking of each high-tech zone only changes by 1 to 2 units, and the overall change is very small, which also validates the reliability of the research method.
Table 6.
The adjusted weights.
3.2. Discussion
Summarizing and analyzing the rankings over the years, it can be observed that these HTZs that have a larger rise and fall and have always been in the forefront. The results have shown that Zhongguancun, Tianjin, Shanghai Zhangjiang, and Wuhan HTZs are ranked far higher than other HTZs. The rankings of Kunshan and Dongguan HTZs have increased rapidly. However, the rankings of HTZs in Shenyang, Anshan, Tangshan, and Qinghai have fallen sharply and need to be improved. In the following, several typical parks are selected for detailed analysis. Finally, we analyze the development of the HTZ in the eastern, central, and western regions from the whole.
3.2.1. Zhongguancun Technology Park
Figure 6 has shown that although there is some fluctuation in the comprehensive score of Zhongguancun, the average score is above 0.9, and the overall ranking always ranks the first. The reason can be explained from the following aspects. First, as the first established science and technology park in China, it has a long history of development and solid foundation. Second, it is located as the political center of the country and enjoys more policy supports. Third, as China’s Silicon Valley, it has gathered a large number of innovative talents and high-tech enterprises at home and abroad, with top domestic universities as talent reserves. Furthermore, the park actively invests in industry–university–research cooperation to promote the transformation of scientific research results and helps the further development of the park. Finally, it gives full play to the role of the capital market in driving the industrial economy through capital market financing business.
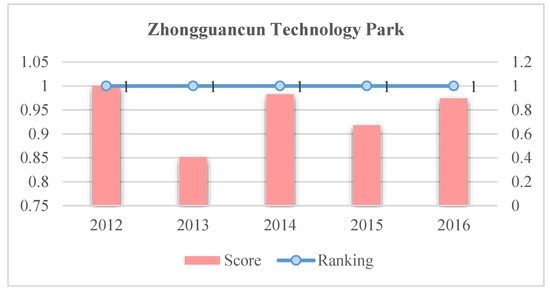
Figure 6.
Zhongguancun Technology Park Ranking and Score (2012–2016).
3.2.2. Wuhan East Lake HTZ
Figure 7 depicts a changing trend in Wuhan East Lake HTZ. Overall, its ranking has been maintained at the forefront, and has made steady progress. First of all, the East Lake HTZ has a large number of universities, scientific research institutions, and a pool of scientific research talents, which has laid a solid foundation for the technological innovation and development. Secondly, after years of development, various scientific and technological achievements continue to emerge, and the strength of scientific and technological innovation is increasing gradually. Third, the rapid development of finance has provided strong support for international development. Fourth, the geographical environment is superior, and the agglomeration effect of industrial clusters is prominent. In the end, with the strong policy support, the entrepreneurial environment is constantly optimized.
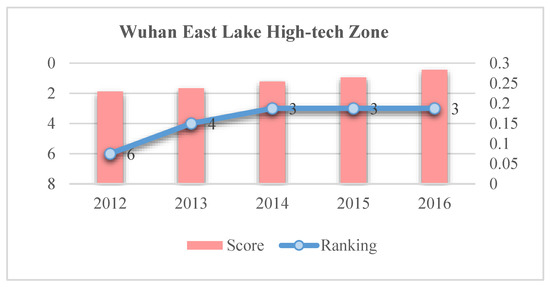
Figure 7.
Wuhan East Lake HTZ Ranking and Score (2012–2016).
3.2.3. Kunshan New District
As shown in Figure 8, Kunshan New District has experienced a relatively large upward phase, and has entered a stable development phase. The reason for its rapid rise is mainly due to the concept of talent science and technology as the core and a strong independent innovation and entrepreneurship system. Kunshan New District focuses on industrial foundation, pays much attention to the improvement and derivation of the industrial chain, and the upgrading and transformation of the value chain, and gradually strengthens its own advantageous industrial clusters. Furthermore, the park unswervingly follows the path of independent innovation under open conditions, gathers and integrates innovative resources, formulates and implements a series of policies and measures to encourage the rapid development of emerging industries, and guides and supports enterprises to innovate independently.
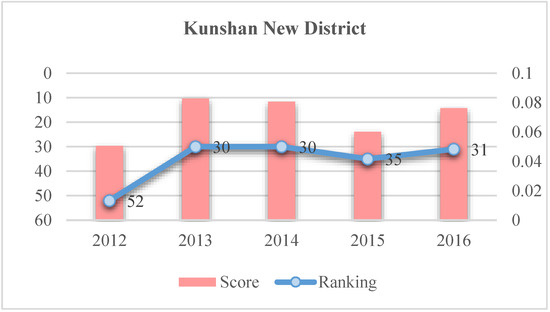
Figure 8.
Kunshan New District Ranking and Score (2012–2016).
3.2.4. Shenyang HTZ
It can be clearly seen from Figure 9 that the Shenyang HTZ has gone through a process of sharp decline in rankings, manifested as insufficient development stamina. The reasons for this change are mainly caused by the following aspects. In terms of economic environment, insufficient investment is a major bottleneck restricting in scientific research funding of Shenyang HTZ. In terms of technological innovation, the HTZ lacks awareness of innovation, and has a weak ability to innovate. In terms of social environment, there is a shortage of high-tech talents, short-term behavior of talent support policies is serious, and the atmosphere of entrepreneurial environment is insufficient. In terms of government services, the government has not paid enough attention to HTZs, and its policies have not been implemented properly.
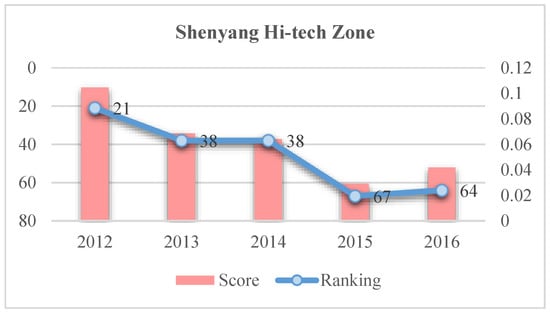
Figure 9.
Shenyang HTZ Ranking and Score (2012–2016).
3.2.5. Development of HTZs in the Eastern, Central and Western
These HTZs are divided into three categories according to their locations in Table 7. We can see that the average score ranking of each zone is in order of Eastern, Northeast, Central, and Western, and the score of the east is much more than that of the west. It indicates that there are regional differences in the development of HTZs, which is specifically manifested as an imbalance between the Middle, the East, and the West. HTZs with good economic benefits are mainly concentrated in the eastern coastal open areas and economically developed areas. Among them, the Pearl River Delta and the Yangtze River Delta are the top priorities for rapid economic development. The inconvenient transportation and backward infrastructure in the central and western regions directly influence the economic benefits of its HTZs.
Table 7.
The average score of HTZs in each region.
4. Suggestion
Based on the analysis of the rankings of the above-mentioned HTZs over the years, and combined with their experiences and problems in the development process, we have made corresponding suggestions for HTZs with different development situations in order to make the reform proposals more applicable.
4.1. HTZs in the Forefront
These HTZs include Zhongguancun Technology Park, Tianjin HTZ, Shanghai Zhangjiang HTZ, Wuhan East Lake HTZ, Guangzhou HTZ, Shenzhen HTZ, and so on. The most important thing for these HTZs is to maintain its original advantages. First, we must continue to expand our talent pool. Talent is the key to technological innovation and the blood of high-tech enterprises. Specifically, speed up the introduction of internationally advanced returnees and top domestic talents, and cultivate composite talents who have technology and good management so as to gather the high-level talents in the HTZ. Then, support enterprises to cooperate with colleges and universities to establish post-doctoral mobile stations, joint laboratories, and scientific research bases. Second, continue to strengthen the scientific research and innovation capabilities of HTZs. At the same time, optimize the allocation of innovation resources. Finally, we must pay attention to the role of capital market financing and use financial means to inject new vitality into the development of HTZs.
4.2. HTZs in the Rising Stage
These HTZs include Kunshan New District, Dongguan HTZ, Ningbo HTZ, Wuhu HTZ, Guiyang HTZ, and so on. For such HTZs, on the basis of making full use of policy support, we should strengthen links with other HTZs, especially the top-ranking HTZs. They should continue to focus on talent introduction and training. In addition, the zones must focus on increasing the attention and investment in scientific research and innovation capabilities. Because technological innovation is an inexhaustible motive force and necessary guarantee for the sustainable development of HTZs. We suggest that improve taxation and other innovation policies and services, in order to concentrate financial resources on supporting corporate technological innovation. In addition, invention patents, new products, and services are significant development output. Therefore, it is necessary to pay special attention to the trend of this output, and use policies to help improve them.
4.3. HTZs in the Declining Rank
These HTZs include Shenyang HTZ, Anshan HTZ, Tangshan HTZ, Kunming HTZ, Haikou HTZ, Qinghai HTZ, and so on. For such HTZs, the key is to clarify the leading industry and make good use of their core advantages. Leading industry is the basis for economic development and technological progress in HTZs. Each HTZ should start from its own advantages and follow the national development strategy closely, so as to determine the leading industry of the zone. Meanwhile, it is essential to establish a corresponding development system around the high-tech industry. Taking Yangling and Zhengzhou HTZs as examples, it is unadvisable for them to develop heavy industry technology due to geographical conditions and weather restrictions. However, through clear industrial positioning, they can develop agricultural high-tech and improve crop yield. Thus, they have decided to vigorously develop related industries, promoting scientific and technological innovation. Gradually, they have established a regional continuous innovation system. In addition, such parks also need to increase investment in scientific research funds and strengthen the policy of talent introduction.
5. Conclusions and Future Work
HTZs play an import role in the development of economy. In order to assess the economic benefits of HTZs in China, an evaluate framework is proposed. An index system is put forward, which includes number of enterprises, number of employees, total income, gross industrial output value, tax, net profit, and exports. AHP, PSO, and TOPSIS are combined together to assess the economic benefits of HTZs in China. AHP method is used to establish the judgement matrix. Then, the matrix is converted to a constraint optimization problem. PSO is applied to optimize the problem and solving weights among seven indicators. TOPSIS is used to make evaluations and hierarchical clustering analysis is to cluster results.
One hundred and five HTZs around China are evaluated according to the proposed method. The evaluation results have demonstrated that the comprehensive ranking of HTZs such as Zhongguancun Technology Park and Wuhan East Lake HTZ have always been at the forefront. The ranking of Kunshan New District has risen rapidly, and the development is rapid. Meanwhile, the ranking of the Shenyang HTZ has dropped significantly, and it needs to be actively adjusted and improved. Therefore, for HTZs at different development stages, we have put forward corresponding recommendations to provide useful references for the development of the park.
Finally, we must also highlight some limitations of this article in research and future work. The first is the inevitable subjectivity problem when applying AHP method. Secondly, as this paper only collects data on HTZs until 2016, the timeliness of the data still needs to be improved. Lastly, in terms of calculating weights, based on the advantages of the goal programming model in solving multi-objective decision-making, we can try to compare the goal programming model with PSO method in order to better optimize our research method.
Author Contributions
conceptualization, X.Y.; methodology, X.Y.; software, X.W.; validation, X.Y., X.W. and T.H.; formal analysis, X.W.; investigation, X.W.; resources, X.Y.; data curation, X.W.; writing—original draft preparation, X.Y. and X.W.; writing—review and editing, X.Y. and X.W.; visualization, X.W.; supervision, T.H.; project administration, X.Y.; funding acquisition, X.Y. All authors have read and agreed to the published version of the manuscript.
Funding
This research was funded by the China Natural Science Foundation (No.71974100, No.71503134), Natural Science Foundation in Jiangsu Province (No. BK20191402), Major Project of Philosophy and Social Science Research in Colleges and Universities in Jiangsu province (2019SJZDA039), Qing Lan project (R2019Q05), Postgraduate research and innovation plan project (SJKY19_0983) in Jiangsu Province and National Undergraduate Training Program for Innovation and Entrepreneurship (201910300016Z).
Conflicts of Interest
The authors declare no conflict of interest.
References
- Henriques, I.C.; Sobreiro, V.A.; Kimura, H. Science and technology park: Future challenges. Technol. Soc. 2018, 53, 144–160. [Google Scholar] [CrossRef]
- Torch High-tech Industry Center Ministry of Science and Technology. China Torch Statistical Yearbook; China Statistics Press: Beijing, China, 2011; p. 67.
- Ma, Y.-F.; Goo, Y.-J. Technical Efficiency and Productivity Change in China’s High- and New-Technology Industry Development Zones. Asian Bus. Manag. 2005, 4, 331–355. [Google Scholar] [CrossRef]
- Torch High-tech Industry Development Center Ministry of Science and Technology. China Torch Statistical Yearbook; China Statistics Press: Beijing, China, 2017.
- Bai, X.-J.; Yan, W.-K.; Chiu, Y.-H. Performance evaluation of China’s Hi-tech zones in the post financial crisis era—Analysis based on the dynamic network SBM model. China Econ. Rev. 2015, 34, 122–134. [Google Scholar] [CrossRef]
- Chundong, G.; Ying, W.; Fengjun, J. Discussion on Development Orientation and Thinking of National High-tech Zone. China Adm. 2019, 405, 160–161. [Google Scholar]
- Huang, K.F.; Yu, V.M.J.; Seetoo, D.H. Firm innovation in policy-driven parks and spontaneous clusters: The smaller firm the better? J. Technol. Transf. 2012, 37, 715–731. [Google Scholar] [CrossRef]
- Albahari, A.; Barge-gil, A.; Perez-canto, S.; Modrego, A. The influence of science and technology park characteristics on firms’ innovation results. Mpra Pap. 2013, 48829. [Google Scholar] [CrossRef]
- Zhang, J.; Gu, X. Research on Innovation Capability of National High-tech Zones: Model Building and Empirical Analysis. In Advances in Intelligent Systems and Computing; Springer: Berlin/Heidelberg, Germany, 2014; pp. 117–129. [Google Scholar]
- Lai, H.-C.; Shyu, J.Z. A comparison of innovation capacity at science parks across the Taiwan Strait: The case of Zhangjiang High-Tech Park and Hsinchu Science-based Industrial Park. Technovation 2005, 25, 805–813. [Google Scholar] [CrossRef]
- Li, Q.; Umaier, K.; Koide, O. Research on post-Wenchuan earthquake recovery and reconstruction implementation: A case study of housing reconstruction of Dujiangyan City. Prog. Disaster Sci. 2019, 4, 100041. [Google Scholar] [CrossRef]
- Zhao, Y.; Shang, J.C.; Chen, C.; Wu, H.N. Simulation and evaluation on the eco-industrial system of Changchun economic and technological development zone, China. Environ. Monit Assess 2008, 139, 339–349. [Google Scholar] [CrossRef]
- Xiao, W.; Wei, Q. Intensive Land Use Evaluation of Urban Development Zones: A Case Study of Xi’an National Hi-Tech Industrial Development Zone in China; Springer: Berlin/Heidelberg, Germany, 2011; pp. 245–250. [Google Scholar] [CrossRef]
- Li, L.-b.; Liu, B.-l.; Liu, W.-l.; Chiu, Y.-H. Efficiency evaluation of the regional high-tech industry in China: A new framework based on meta-frontier dynamic DEA analysis. Socio Econ. Plan. Sci. 2017, 60, 24–33. [Google Scholar] [CrossRef]
- Han, C.; Thomas, S.R.; Yang, M.; Ieromonachou, P.; Zhang, H. Evaluating R&D investment efficiency in China’s high-tech industry. J. High Technol. Manag. Res. 2017, 28, 93–109. [Google Scholar] [CrossRef]
- Xiao, Y.H.; Zhang, X.W.; Wang, Q.W. Study on the Evaluation of Innovation Ability about National High-tech Zone Based on Hierarchy Analysis. Econ. Probl. 2012. [Google Scholar] [CrossRef]
- Zhao, Z.J.; Fan, N. Comprehensive Evaluation of Economic Benefit of High-tech Zone Based on Factor Analysis. Commer. Sci. Res. 2017, 24, 46–53. [Google Scholar]
- Qingming, G.; Wei, X. The Dynamic Comprehensive Evaluation of Economic Returns of High-new Tech Development Zone in China. Sci. Technol. Prog. Policy 2005, 4, 63–65. [Google Scholar]
- Liu, D.W.; Xiong, G.Q.; Diao, W.J. The Comprehensive Evaluation of Economic Returns of Hi-Tech Development Zone Using DEA Method in China. J. Xian Univ. Technol. 2004. [Google Scholar] [CrossRef]
- Hao, Y.H.; Wen-Bo, L.I.; Liang, Q.U. Comprehensive Evaluation of Economic Returns of State High-Technology Park. Econ. Geogr. 2008, 2, 261–264. [Google Scholar]
- Wu, Y.; Tao, Y.; Zhang, B.; Wang, S.; Xu, C.; Zhou, J. A decision framework of offshore wind power station site selection using a PROMETHEE method under intuitionistic fuzzy environment: A case in China. Ocean Coast. Manag. 2020, 184, 105016. [Google Scholar] [CrossRef]
- Wang, B.; Xie, H.-L.; Ren, H.-Y.; Li, X.; Chen, L.; Wu, B.-C. Application of AHP, TOPSIS, and TFNs to plant selection for phytoremediation of petroleum-contaminated soils in shale gas and oil fields. J. Clean. Prod. 2019, 233, 13–22. [Google Scholar] [CrossRef]
- Zhao, D.H.; Sun, F.Q.; University, H.U.; University, H.U. Based on the Factor Analysis Method Research of Tangshan National High-tech Development Zone Construction. J. Hebei United Univ. 2014, 14, 39–43. [Google Scholar]
- Wu Lin-hai, F.C.-l. Research on Evaluation Index System of Science and Technology Parks in China. Soc. Sci. 2001, 2, 49–54. [Google Scholar]
- Yu-Shan, C. Implementation Plan of Innovation-driven Strategy Promotion in National High-tech Industrial Development Zone. Dual Use Technol. Prod. 2013, 4, 6. [Google Scholar]
- Xia, W.; Lin, S.; Bing, G.; Xue, L. Evaluation of Industry-city Integration of High-Tech District Based on Factor Analysis and Cluster Analysis. Sci. Technol. Prog. Policy 2013, 30, 26–29. [Google Scholar]
- Xiang, C.L.L. 2015 National High-tech Zone Comprehensive Development and Data Analysis Report. Sci. Technol. Ind. China 2016. [Google Scholar] [CrossRef]
- Xiang, C.L.L. 2014 National High-tech Zone Comprehensive Development and Data Analysis Report. Sci. Technol. Ind. Parks 2015, 171, 22–27. [Google Scholar]
- Xiang, C.L.L. 2013 National High-tech Zone Comprehensive Development and Data Analysis Report. Sci. Technol. Ind. Parks 2014, 9, 43–61. [Google Scholar]
- Xiang, C.L.L. 2012 National High-tech Zone Comprehensive Development and Data Analysis Report. Sci. Technol. Ind. China 2013, 11, 42–49. [Google Scholar]
- Xiang, C.L.L. 2016 National High-tech Zone Comprehensive Development and Data Analysis Report. Sci. Technol. Ind. China 2017, 59–83. [Google Scholar] [CrossRef]
- Triantaphyllou, E.; Lin, C.-T. Development and evaluation of five fuzzy multiattribute decision-making methods. Int. J. Approx. Reason. 1996, 14, 281–310. [Google Scholar] [CrossRef]
- Javanbarg, M.B.; Scawthorn, C.; Kiyono, J.; Shahbodaghkhan, B. Fuzzy AHP-based multicriteria decision making systems using particle swarm optimization. Expert Syst. Appl. 2012, 39, 960–966. [Google Scholar] [CrossRef]
- Liang, J.J.; Qin, A.K.; Suganthan, P.N.; Baskar, S. Comprehensive learning particle swarm optimizer for global optimization of multimodal functions. IEEE Trans. Evol. Comput. 2006, 10, 281–295. [Google Scholar] [CrossRef]
- Yuan-wu, M. The Analysis of Data Based on the Hierarchical Clustering. Master’s Thesis, Anhui University, Hefei, China, 2013. [Google Scholar]
- Kai, L.I.; Wang, L. Research on cluster ensembles methods based on hierarchical clustering. Jisuanji Gongcheng Yingyong Comput. Eng. Appl. 2010, 46, 120–123. [Google Scholar] [CrossRef]


© 2020 by the authors. Licensee MDPI, Basel, Switzerland. This article is an open access article distributed under the terms and conditions of the Creative Commons Attribution (CC BY) license (http://creativecommons.org/licenses/by/4.0/).