Abstract
This study examines the effect of financial literacy, saving attitudes, social influence, and goal clarity on the retirement planning construct. In addition, it investigates how the public demographic profile moderates these relationships. The questionnaire approach was utilized to collect data by adopting and customizing the measurement scale from previous studies. A systematic random sampling approach was employed on 323 prospective respondents. The outcomes of this study illustrate that all relationships are significantly and positively associated with retirement planning using structural equation modeling (SEM). Furthermore, all moderator variables (gender, age, status, income, and education) moderated the relationships. The government should construct a holistic retirement planning model that is based on demographic characteristics.
1. Introduction
The Department of Statistics Malaysia announced that the number of employed people has been increasing from 5.2 million in 1982 to 14.99 million in June 2020 [1]. If this situation is maintained, the number of preretirees will increase in the future. The reality hits when most locals admit that they do not have sufficient savings for their retirement [2,3,4]. This financial problem is not only happening in Malaysia but also in other developed and developing countries. For example, the people in the United States rely on self-directed investment accounts [5]. Half of the retirement assets are independently deposited in those accounts [6,7]. Some employees appoint financial experts or consultants to allocate their savings into retirement accounts, but most of them make their own decisions. The majority of the employees do not know about financial management, which has led to the loss of savings because of nonperforming financial instruments.
In Malaysia, there are two most notable retirement schemes, known as the public pension scheme and the Employees Provident Fund (EPF). As the names suggest, the former scheme is provided for government servants only, based on a defined benefit plan, while the latter mainly caters to the private sector workforce and also those in the public sector who opt for the scheme after they are confirmed in their work positions; these employees comprise more than half of the total labor force in Malaysia. The EPF is a mandatory and defined contribution retirement savings scheme in Malaysia. Both employee and employer need to contribute to the scheme, where, currently, employees contribute 11% from their gross salary, while employers must put in a minimum of 12% for salaries more than RM5000 and 13% for salaries below that. Fortunately, from the individual point of view, this contribution is tax-deductible for up to RM6000 per year. This policy ensures that employees have sufficient income for their golden years.
Two financial plans are offered to cater to living maintenance after retirement in Malaysia, namely, the government pension plan and the EPF. The majority of employees who work in the public sector are more interested in choosing the government pension plan than the EPF. The reason for this choice is the government pensioner will receive half of his last drawn salary at the end of every month [4,8]. Therefore, government pensioners continue to receive a portion of their monthly income after retirement. In contrast, private employees have EPF accounts to support their living in the future. Every month, 11% of their monthly income is credited to their EPF account. Most employees feel that their retirement income is adequate, although this contradicts EPF reports. It was reported that 82% of EPF members officially failed to achieve the basic savings quantum according to their age group. Specifically, EPF members need at least RM228,000 in savings by the age of 55; it means that they are allowed to withdraw RM950 per month for the next 20 years after retirement [9,10]. The main concern is whether the amount saved in their EPF accounts will be adequate to cater to the pensioners’ needs for the next 20 years. The retirement income is necessary for food supply, transportation cost, home rent, and their children’s education [11].
It is an alarming issue when the EPF has highlighted that almost 65% of their members aged 54 years old, who would retire within the next year, had less than RM50,000 in their EPF accounts [9]. Furthermore, 50% of EPF members had depleted their retirement savings within just five years [12]. Ironically, a survey report from World Bank found that one-third of the Malaysian population believe that they are financially illiterate when, in fact, 92% of Malaysian people have only had deposit-based financial products instead of having these together with investment accounts [13]. Based on the current situation, many problems arise in preparing a retirement plan due to unpredictable macroeconomic events, an increase in medical costs, and family commitments. The living cost in Malaysia is quite high, which does not match salary increment, and this situation could become worse in subsequent years [14]. As a result, many retirees have blamed the board members and investment panel of the EPF for not giving them a good return, but should this issue be the responsibility of the EPF only? The EPF has strived to ensure that its members will have adequate savings for retirement since its inception. In recent times, economic changes have made a huge impact on how people invest, save, and manage risks to protect their standard of living in retirement [15,16]. Nonetheless, the majority of employees are unprepared for their retirement years. A study by Nielsen Malaysia showed that only 21% of Malaysians are prepared for their retirement years [17]. It can be concluded that Malaysians’ awareness of their retirement savings is quite low. Surprisingly, 69% of respondents plan to rely on their personal savings and investments as the primary source of income for their retirement years.
However, Habib [2] found that most people could not afford to retire because they had not saved enough money in their early life. Moreover, Hunt [18] contemplated that Malaysians have less confidence in preparing their retirement plan due to financial illiteracy. Therefore, the saving attitudes among Malaysians for their retirement are poor [2,3]. The younger generation believes that retirement planning is a burden because it is long-term planning. It is noted that Malaysia has the highest household debt to GDP in Asia [19,20]. According to Kenanga Investors [12], only 52% of Malaysians start saving for retirement at the age of 40, but the savings are insufficient due to the late preparation for retirement [2]. In addition, Habib (2007) [2] stated that less than 5% of Malaysians are ready for retirement, where the majority of them are above 40 years old. Retirement planning has been a major issue in Malaysia because it has direct consequences on social problems and personal wellbeing. This study is beneficial for society, especially in understanding the importance of retirement planning in life and identifying the potential factor that might affect the working individuals’ retirement planning behavior. Most of the working individuals have neglected retirement planning because they face difficulties in adjusting to retirement [21,22]. To ensure working individuals can retire comfortably, they must take early affirmative action before their retirement. Therefore, this study will provide a better understanding of the preparedness of working individuals below 40 years old when facing their retirement age in the future. Specifically, we have nine general hypotheses that consist of four exogenous constructs (financial literacy, social influence, saving attitude, and goal clarity) and 5 moderator variables (gender, age, income, marital status, and education). These effects are explained in detail in the following section.
2. Literature Review
The main challenge faced by aged Malaysians recently is the shortage of savings upon retirement. Therefore, it is important to prepare them with knowledge and awareness about saving for sustainable wellbeing in the future. The terms of sustainability are actually very broad across different areas such as human, social, economic, and environmental. Sometimes, researchers define sustainable wellbeing as sustainable happiness, which means the happiness that contributes to an individual, a community, or the world and does not exploit the happiness of others. Consequently, a critical discussion on this topic is suggested and how sustainability can be related to society. Aligned with this reason, “society” in the current study refers to the employees from the private sector and government companies in order to understand how they will sustain their living after retirement. This should include their lifestyle, food and beverage cost, and healthcare, given their age requirement. The symbolic interaction theory is very relevant to the current study as it aims to assess retirement planning behavior [23]. From that, a model has been modified by the inclusion of several important factors, namely, financial literacy and social influence as exogenous constructs, with public profiles considered as a moderator variable to provide more comprehensive findings. Each factor is discussed in the following section in detail.
2.1. Financial Literacy
Financial literacy is the ability to use knowledge and skills to manage financial resources effectively for a lifetime in terms of financial wellbeing [24]. Most previous studies have offered several insights into the reasons for not planning for retirement, which can help people in the future. The findings revealed that working individuals failed to develop any retirement savings plan [25,26]. The primary reason for this poor planning is financial illiteracy. Furthermore, most of them are unaware of fundamental economic concepts during their lifetime and old age. To gain better insight into this particular issue, Lusardi and Mitchell [27] found that a lack of confidence can lead a working individual to make a poor plan. This evidence is proven by Wong and Earl [21] and Kim, Kwon, and Anderson [11] regarding the confidence of an individual’s retirement.
Hypothesis 1 (H1).
Financial literacy has significant positive effects on retirement planning.
2.2. Social Influence
Beshears et al. [28] affirmed that the presence of peer information can influence the working individual’s decisions on retirement savings. People can get information and experience from others who have the potential to influence their decisions. Moorthy et al. [3] and Van Dalen [29] pointed out that parental effects and social influence have significant positive impacts on retirement planning. Growing empirical literature has revealed that peoplewith better social network tend to invest their savings [30,31,32,33]. Many studies have revealed that peer information can cause some individuals to become discouraged in contributing more to their retirement savings. Hence, this study intends to prove that peer effects can be another influence on people’s retirement planning decisions.
Hypothesis 2 (H2).
Social influences have a positive significant effect on retirement planning.
2.3. Saving Attitude
The majority of working individuals have trusted the EPF to decide on what or where to invest their contributions in, as long as their savings increase every year [4,34]. Some people are unwilling to face the complexity and difficulty of the investment system, and they are passive in making their investment choices [35]. People tend to get low investment returns since the EPF usually invests in safe investment options. Due to this fact, their retirement income is insufficient to cover their living maintenance for their golden years.
Hypothesis 3 (H3).
Saving attitude has a positive significant effect on retirement planning.
2.4. Goal Clarity
Retirement goal clarity is another psychological factor associated with planning practice in predicting saving tendencies [36]. Theoretically, six psychological scales were initially introduced in measuring saving strength, such as general self-efficacy, future time perspective, financial activation, retirement goal clarity, self-rated financial knowledge, and financial risk tolerance [37]. These factors are assessed to determine the clearness of working individuals in financial goals for retirement, which is highly associated with retirement saving behavior [38,39]. Nonetheless, retirement goal clarity is usually adopted in various disciplines [40,41].
Hypothesis 4 (H4).
Goal clarity has a positive significant effect on retirement planning.
2.5. Respondent’s Age
Retirement planning has received much attention from policymakers. Jacob-Lawson, Hershey, and Neukam [42] tested a comprehensive and integrative retirement planning model among a group of middle-aged working individuals. One popular view of financial planning, the successful aging perspective [43], was suggested to test the quality of decisions, which focuses on individuals above 50 years old. Baistaman et al. [44] also addressed the issue that people’s age can influence the impact of financial literacy and social influences. Therefore, this former model was redesigned and redevised by economists, sociologists, psychologists, and financial planning professionals to identify variables related to financial planning and saving tendencies that are suitable for individuals under 50 years old.
Hypothesis 5a (H5a).
Age moderates the relationships between financial literacy and retirement planning.
Hypothesis 5b (H5b).
Age moderates the relationships between social influence and retirement planning.
Hypothesis 5c (H5c).
Age moderates the relationships between saving attitude and retirement planning.
Hypothesis 5d (H5d).
Age moderates the relationships between goal clarity and retirement planning.
2.6. Gender
Over the past few years, many previous studies on retirement planning have examined the relationships of sociodemographic factors (e.g., age, education level, gender, marital status, and housing income) with retirement planning [34,45,46,47]. Financial literacy can be associated with mathematical skills because it depends on arithmetic capacity [39]. Females often outscored males, although people believe that men are better than women in mathematics skills [48,49,50]. Based on the meta-analysis of a previous study, there was no gender difference in terms of a deeper understanding of mathematical concepts and theory [51]. In terms of the retirement period, women tend to retire earlier than males because they want to provide direct care to their family members [52]. Meanwhile, men are less likely to retire because they have to continue providing financial support for their family members.
Hypothesis 6a (H6a).
Gender moderates the relationships between financial literacy and retirement planning.
Hypothesis 6b (H6b).
Gender moderates the relationships between social influence and retirement planning.
Hypothesis 6c (H6c).
Gender moderates the relationships between saving attitude and retirement planning.
Hypothesis 6d (H6d).
Gender moderates the relationships between goal clarity and retirement planning.
2.7. Status
Another possible explanation between financial literacy and retirement planning is spousal influence or marital status [29,53]. Spousal influence is a strong factor in retirement decision-making because the choice of a spouse should be supported by their partner. Retirement life without proper planning requires continuous work even though they have reached the retirement age [54]. The lack of retirement planning can cause family difficulties in the golden years [35].
Hypothesis 7a (H7a).
Marital status moderates the relationships between financial literacy and retirement planning.
Hypothesis 7b (H7b).
Marital status moderates the relationships between social influence and retirement planning.
Hypothesis 7c (H7c).
Marital status moderates the relationships between saving attitude and retirement planning.
Hypothesis 7d (H7d).
Marital status moderates the relationships between goal clarity and retirement planning.
2.8. Education
In addition, there are comprehensive studies that cover the factor of education levels. Most previous studies have found that education level is one of the essential factors that determine the behavior of pensioners when preparing for their retirement [37,55,56,57]. Joo and Pauwels [55] stated that individuals with higher education tend to be more knowledgeable and confident when planning their retirement income. A higher level of education is positively related to a higher probability of confidence in retirement planning. Therefore, a household with more wealth is positively linked with retirement preparedness.
Hypothesis 8a (H8a).
Education moderates the relationships between financial literacy and retirement planning.
Hypothesis 8b (H8b).
Education moderates the relationships between social influence and retirement planning.
Hypothesis 8c (H8c).
Education moderates the relationships between saving attitude and retirement planning.
Hypothesis 8d (H8d).
Education moderates the relationships between goal clarity and retirement planning.
2.9. Income
Income and age are correlated in retirement planning behavior [54,58]. Working individuals are motivated to take action for retirement when there is an increase in their age and income. This statement is supported by Hira, Rock, and Loibi [23] and Arano, Parker, and Terry [59], who stated that the planned retirement age is guided by different perceptions of income adequacy.
Hypothesis 9a (H9a).
Income moderates the relationships between financial literacy and retirement planning.
Hypothesis 9b (H9b).
Income moderates the relationships between social influence and retirement planning.
Hypothesis 9c (H9c).
Income moderates the relationships between saving attitude and retirement planning.
Hypothesis 9d (H9d).
Income moderates the relationships between goal clarity and retirement planning.
All association hypothesized and tested, presented in Figure 1.
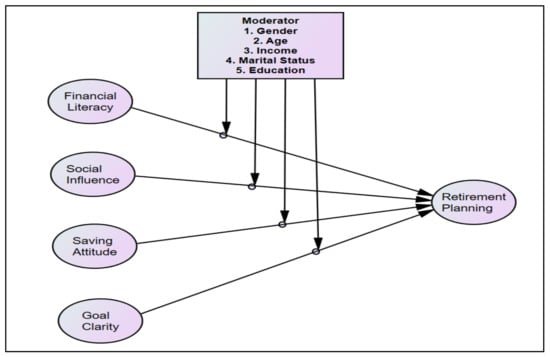
Figure 1.
Theoretical framework.
3. Research Methodology
3.1. Sample Size and Measures
This study used a questionnaire to obtain information from the respondents. The sampling frame was initially composed of 869 private companies, which had more than 10,000 working individuals. A large number of working individuals was identified, and this study used the systematic random approach in which every tenth company on the list was selected, contacted by telephone or email, and the corresponding worker asked to participate in the survey. The systematic random approach was chosen because it is one of the probability sampling techniques where each unit has an equal chance of probability to be selected. After approaching 63 companies, the enumerators contacted 625 prospective respondents who were under 40 years old. The enumerators were appointed based on their experiences in the fieldwork, and they were trained for one month before the data collection stage to ensure that they could provide informed responses. The respondents include junior and senior executives in business, officers, managers, and chief executive officers (CEOs). Nonetheless, 6 out of 63 companies were excluded from the study because they did not have workers under 40 years old, and another 15 companies declined the survey. Therefore, 42 companies agreed to participate, with a total of 378 prospective respondents. The questionnaires were given to the representatives from each company, and the respondents were asked to return them within one week. Finally, 335 responses were recorded, with a response rate of 88.62%. Only 43 questionnaires were not returned within a week. Then, 12 questionnaires were unusable due to incompleteness and double answers, which resulted in the final sample size of 323 respondents. The number of respondents met the minimum requirement of sample size using the Hair approach. According to Hair et al. [60], the number of sample size can be determined by the number of variables included in a model. Thus, we apply the 10-times rule to obtain the sample size. Using this approach, the total variables in this study is 36, which means that the minimum and maximum range of sample size is (36 × 5) 180 and (36 × 10) 360, respectively.
This study deals with multiple unidimensional constructs for retirement planning, as proposed by numerous researchers, such as the sets of financial literacy [26], saving attitude [61], social influence [62], and goal clarity [63]. This is a first-order construct, which is assessed by interdependent variables. Specifically, financial literacy and retirement planning were assessed by nine reflective indicator measures, whereas saving attitude, goal clarity, and social influence were measured by six reflective indicator measures. In the pilot study, the data were analyzed by exploratory factor analysis and Cronbach’s alpha to measure the suitability and reliability of items in the retirement planning behavior model.
3.2. Data Analysis Method
This study used covariance-based structural equation modeling (CB-SEM), which has gained prominence in various areas of tourism [64,65], management research [60], advertising [66], and other fields [67,68,69] for analyzing research model relationships. This study selected CB-SEM because the technique is confirmatory in nature [70] in order to test the existing theory. The hypotheses are grounded in causal estimation, where the model has high estimation accuracy. Moreover, the adequate sample size and the use of the probability approach for the sampling technique in the east coast region of Malaysia are comparatively proper. This study used the maximum likelihood estimator with the maximum number of 100 iterations in the CB-SEM algorithm settings. The normality of the data is achieved as the value of skewness is between 0.021 and 0.371, which is less than 3.0 [60]. In addition, the multivariate normality value is 2.150, lower than 50.0, which indicates that the data at hand are normally distributed and meet with maximum likelihood properties.
To further discuss this operationalization, the one-way interaction analysis was performed because the moderating effect becomes one of the main analyses to complement model estimation. This analysis was conducted after running the heterogeneity test (chi-square difference) for every moderator variable, which is also recognized as the prominent approach for moderation analysis [68]. The analysis procedure was set up by splitting the data from different groups of moderator variables and the significance of chi-square values that were obtained by different types of models (constrained and unconstrained models).
3.3. Assessment of Common Method Bias
The effects of common method bias have long been discussed in previous research [71]. The researcher defined the measurement process from the beginning phase, in which the content of the item, response format, instruction, the characteristics of examiners, the capability of respondents, and the respondents’ motivation are the factors of method bias. The threat of the effect of common method bias has long been discussed in previous research [71]. This study addresses the statistical issues by implementing the common latent factor using SEM to provide consistent results [72]. The results from the common latent factor indicate that there is no method bias in the data. To check the results’ robustness in terms of common method bias, this study used the alternative method of Harman’s single factor. This analysis indicates that a single factor explains 32.5% of the total variance, which is less than 50%. The result implies that the detrimental effect of method bias did not affect the results.
4. Findings
4.1. Descriptive Statistics
Table 1 shows the demographic representation of the prospective respondents. The data were analyzed using SPSS software to obtain the value of frequency and percent for each group of variables. The majority of the respondents were male, aged between 31–40 years old, and had a bachelor’s degree as their highest qualification, and the range of monthly income was between RM4001 and RM6500.

Table 1.
Descriptive analysis.
4.2. Inference Statistics
Table 2 summarizes the standardized loadings, average variance extracted (AVE), composite reliability (CR), mean, and standard deviation for each construct and item.
Table 2.
Validity and reliability.
4.3. Reliabilities and Validities
The internal reliability represented by CR values is consistently high, which fulfilled the recommended use of a 0.7 threshold value after deleting poor loadings from the measurement models. According to Nasir et al. [73], the acceptable standardized loading in the measurement model is at least 0.60. Specifically, five items from all measurement models have poor loading, in which one item each is from financial literacy, saving attitude, and goal clarity constructs, whereas two items are from the retirement planning construct. Therefore, all the retained indicators exhibit high standardized loadings, which yielded high average variance extracted (AVE) values above the 0.50 threshold, thus, supporting the convergent validity criterion. For discriminant validity testing, this study used the conventional approach as the Fornell and Larcker criterion, which has the best approach to assess discriminant validity in the CB-SEM. All the construct correlation values are lower than the square root function of AVE [67], thus, supporting the discriminant validity criterion shown in Table 3.
Table 3.
Discriminant validity.
4.4. Path Analysis
This study follows standard evaluation guidelines to analyze the first-order construct measurement models and the structural model [74]. The first phase assessed the measurement models that focus on exogenous construct measures of internal reliability, construct validity, convergent validity, and discriminant validity, as depicted in Table 2 and Table 3. Construct validity can be explained by the global fitness indices. This study used chi-square/df, RMSEA, CFI, IFI, and TLI to represent parsimonious, absolute, and incremental fit to evaluate the measurement of model fitness. The chi-square/df is deemed satisfied when the value is lower than 3.0, and RMSEA is below 0.08. CFI, IFI, and TLI are declared an excellent fit when the values estimated are above 0.95. The measurement models satisfied all the recommended threshold values (chi-square/df = 1.043, RMSEA = 0.011, CFI = 0.997, IFI = 0.997, and TLI = 0.996).
Lastly, the structural model was assessed to test the relationship between financial literacy, social influence, saving attitude, goal clarity, and retirement planning. The results in Table 4 and Figure 2 show the unstandardized and standardized estimates. Figure 2 also shows the result for R2 values, in which the model is explained by approximately 0.44 or 44%. For path coefficient estimates, it is revealed that financial literacy, saving attitude, goal clarity, and social influence have a positive and significant effect (p < 0.05) on retirement planning. This study concludes that all research hypotheses are supported.
Table 4.
Results of path coefficients.
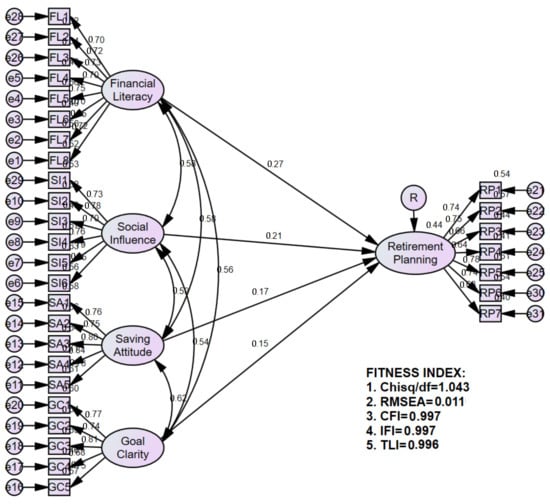
Figure 2.
Structural model.
4.5. Measurement Invariance
To assess measurement invariance, the analysis used Byrne’s (2010) procedure, namely, the heterogeneity test (chi-square difference) for metric invariance before testing the moderating effect. Configural invariance is established because chi-square/df, CFI, and RMSEA fulfilled the recommended values across two different groups (gender, age, income, status, and education). The procedure for metric invariance can be implemented by providing chi-square values from unconstrained (chi-square = 922.276, df = 848) and constrained models (chi-square = 954.686, df = 879). The chi-square difference yielded from those models is 32.41, and p-value = 0.397, which is above the recommended value of 0.05, thus concluding that the model has a partial measurement invariance. This study did not test the scalar invariance because full measurement invariance is unnecessary for a further test of invariance and it does not provide sufficient information [71]. The researcher can analyze the moderation effect to this path model by providing a chi-square value from each group of moderator variables, as shown in Table 5 and Table 6.
Table 5.
Moderation for the first group.
Table 6.
Moderation for the second group.
In CB-SEM, there are several approaches that were introduced to perform the multigroup analysis, such as user-defined estimand, the heterogeneity test, pairwise deletion, and the critical ratios for difference test. For this study, we used the heterogeneity test or chi-square difference test to assess the significance result for categorical moderators (gender, age, income, marital status, and education) as it is imperative to understand the significance effect on each group. Using this approach, the value of chi-square for each group is compared by constraining the path of interest to get the value of the chi-square difference test. According to Hair et al. [60], the moderator is statistically significant when the value of chi-square difference is above 3.84. The chi-square difference test is actually the same thing as the value of the z-score [72]. Thus, one can conclude that gender, age, income, marital status, and education were found to moderate the relationships between financial literacy, saving attitude, goal clarity, social influence, and retirement planning. Since both groups are found significant (as depicted in Table 5 and Table 6), thus, partial moderation has occurred.
4.6. Interaction Effect
The diagrams in Figures 3–22 present the effect of one-way interaction on the impact of four exogenous constructs (financial literacy, social influence, saving attitude, and goal clarity) on the retirement planning for different genders (men and women), age (21–30 and 31–40), status (single and married), education (high and low education), and income (high and low income). For the education variable, we recoded the Diploma and Other group as low education, while Bachelor and Master/PhD was considered high education. In addition, we also recoded the income variable by combining monthly income brackets of less than RM4000 as low income, whereas RM4001 and above is considered high income. We did this because the SEM method cannot handle more than two groups of categorical variables. The analysis of interaction was performed to investigate the role of each moderator variable on the proposed relationships.
Interaction Effect (Moderating Role of Gender)
Figure 3, Figure 4, Figure 5 and Figure 6 show that all results are fulfilled. The moderating role of gender has positive interaction in all the relationships on retirement planning. From a gender perspective, women are more interested in saving for their retirement compared to men, as shown in the results for the coefficient of determination (R2). The following results are more obvious for goal clarity and retirement planning: women have 0.3 of R2, and men have 0.167 of R2.
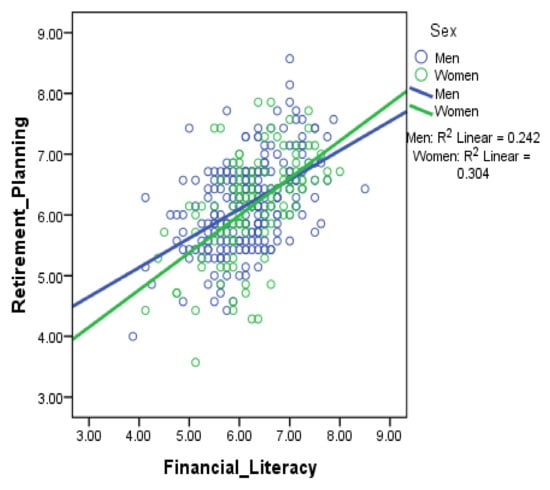
Figure 3.
Gender has an impact on financial literacy and retirement planning.
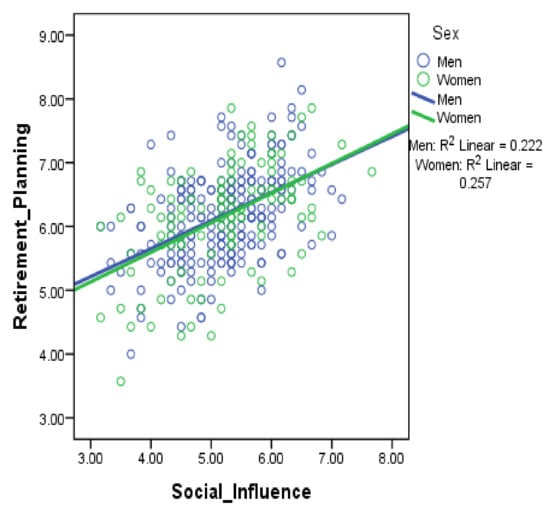
Figure 4.
Gender has an impact on social influence and retirement planning.
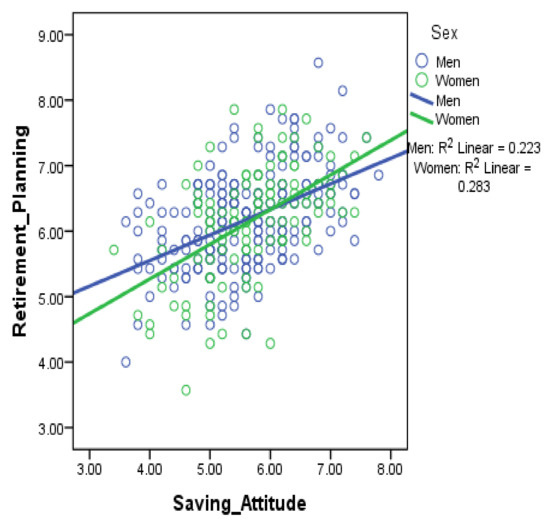
Figure 5.
Gender has an impact on saving attitude and retirement planning.
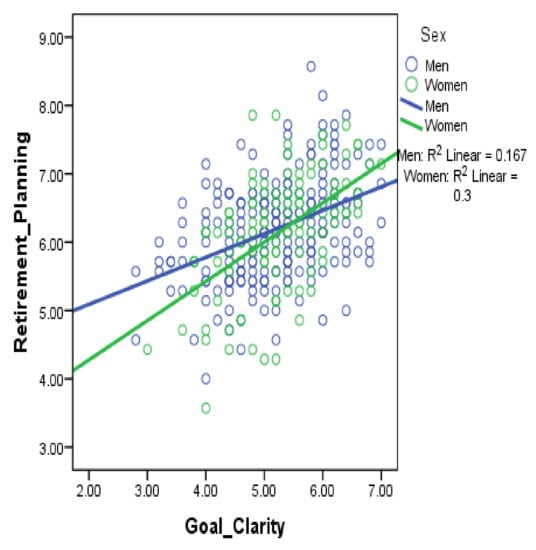
Figure 6.
Gender has an impact on goal clarity and retirement planning.
4.7. Interaction Effect (Moderating Role of Age)
The results from Figure 7, Figure 8, Figure 9 and Figure 10 are similar to previous studies, where the moderator variable of age has an interaction in all relationships. The participants are below 40 years old. Participants in the age range of 20–30 are more literate in finance, with better saving attitudes and goal clarity than those in the age range of 31–40. Therefore, it can be concluded that older participants have more influence in social relationships than young participants. Participants who are in the age range of 31–40 have more influence than participants from the age range of 20–30.
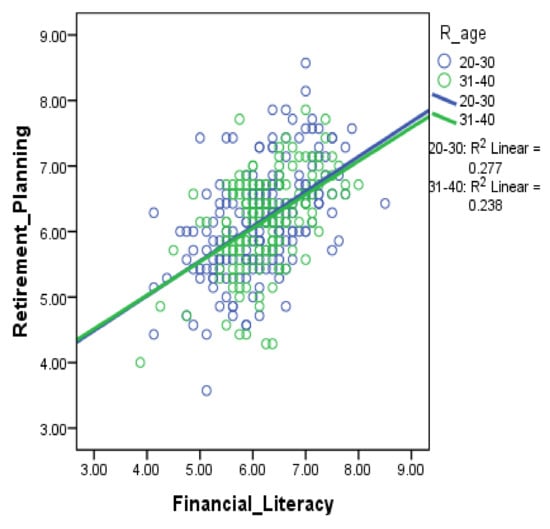
Figure 7.
Age has an impact on financial literacy and retirement planning.
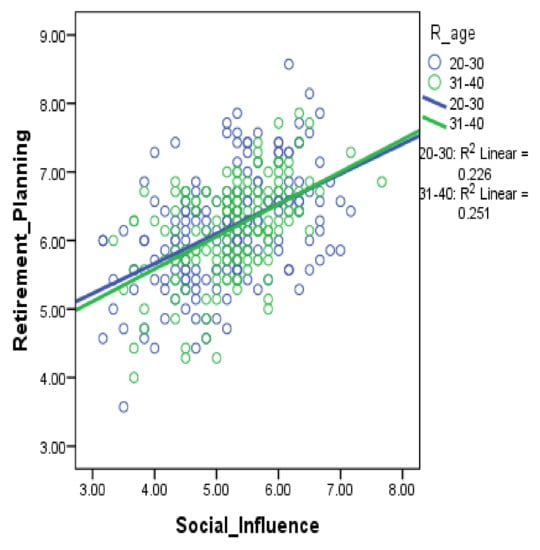
Figure 8.
Age has an impact on social influence and retirement planning.
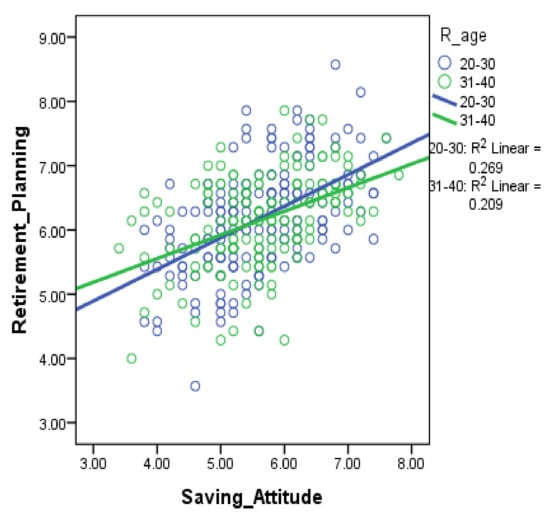
Figure 9.
Age has an impact on goal clarity, saving attitude, and retirement planning.
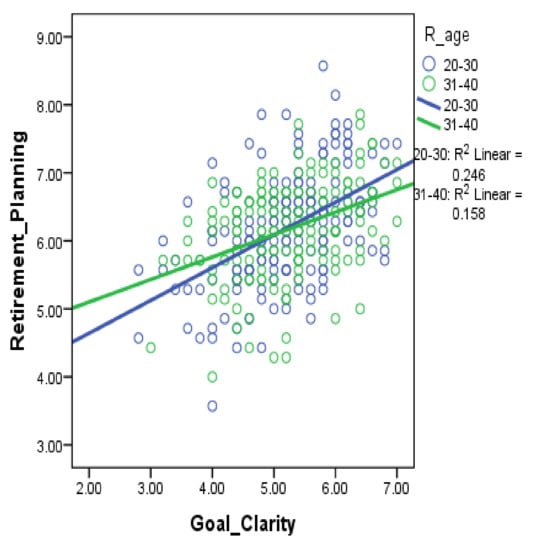
Figure 10.
Age has an impact on goal clarity and retirement planning.
4.8. Interaction Effect (Moderating Role of Status)
Figure 11, Figure 12, Figure 13 and Figure 14 show the result of marital status as a moderator variable. The participants from the singles group are ahead in goal clarity and financial literacy constructs. In contrast, married participants outperform the singles group in social influence and saving attitude. Married participants have more commitment and responsibility than the single participants, which led them to spend according to their needs.
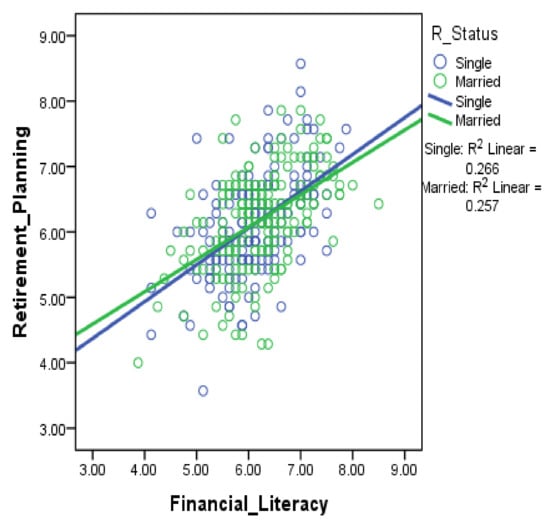
Figure 11.
Status has an impact on financial literacy and retirement planning.
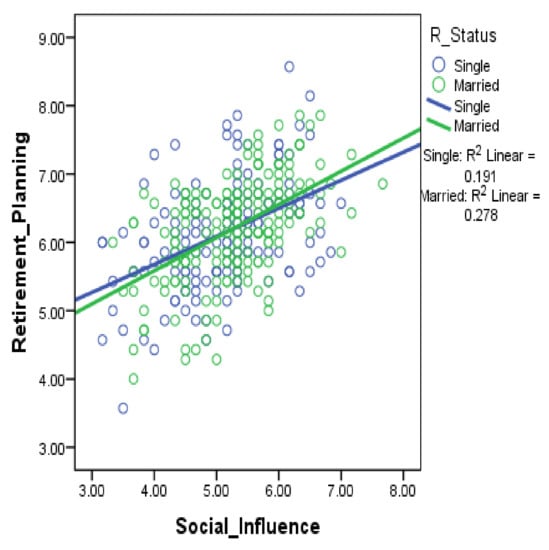
Figure 12.
Status has an impact on social influence and retirement planning.
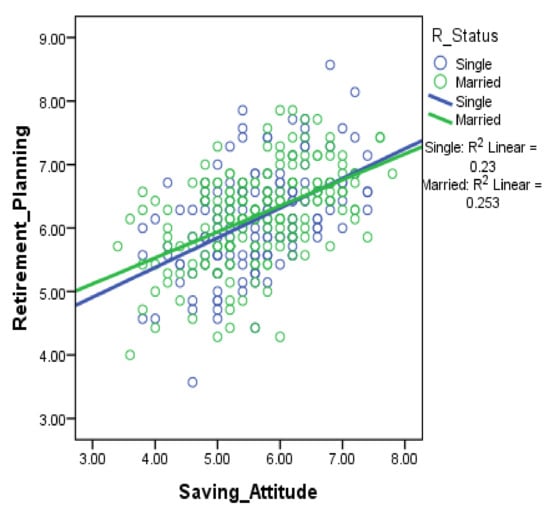
Figure 13.
Status has an impact on saving attitude and retirement planning.
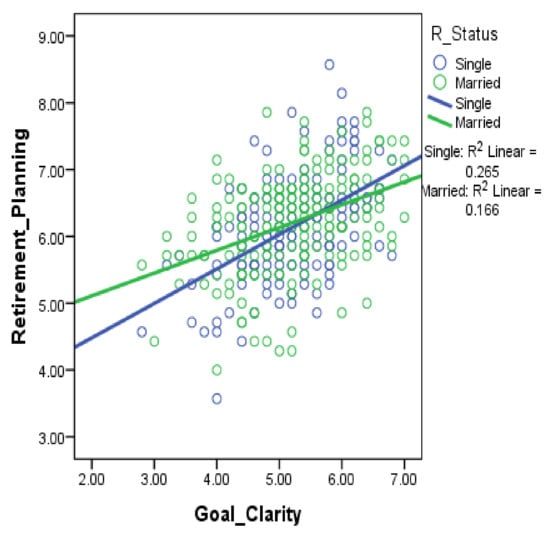
Figure 14.
Status has an impact on goal clarity and retirement planning.
4.9. Interaction Effect (Moderating Role of Education)
The moderation effects of education (see Figure 15, Figure 16, Figure 17 and Figure 18) occurred in all relationships. Participants with high education were more inclined towards financial literacy, social influence, goal clarity, and a saving attitude. The moderation results are similar to previous studies [25,75,76].
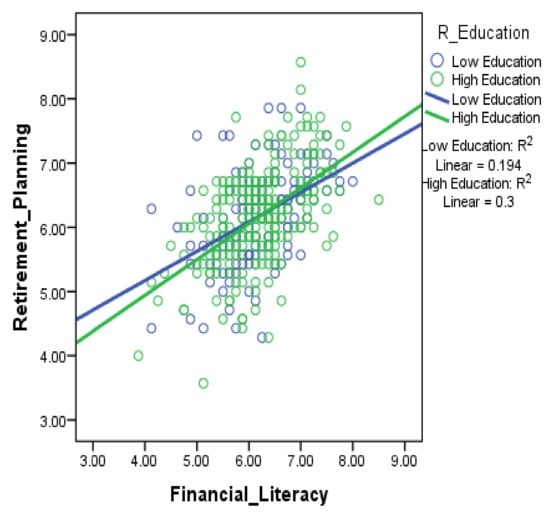
Figure 15.
Education has an impact on financial literacy and retirement planning.
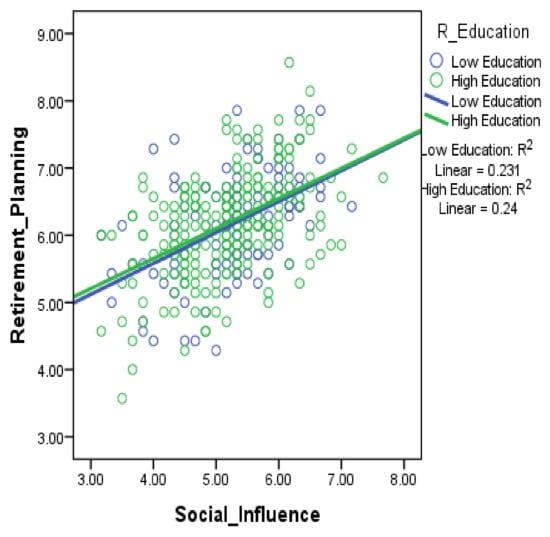
Figure 16.
Education has an impact on social influence and retirement planning.
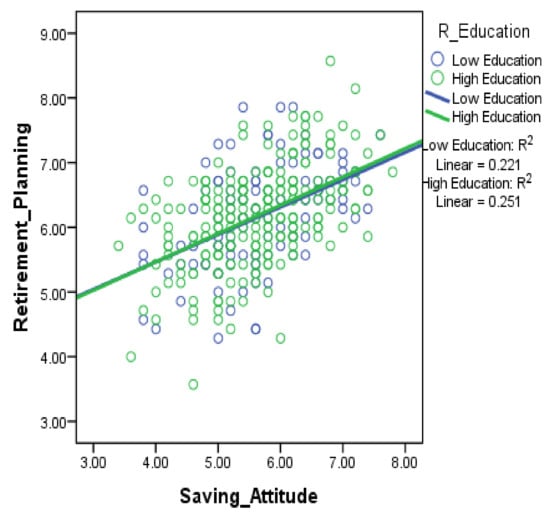
Figure 17.
Education has an impact on saving attitude and retirement planning.
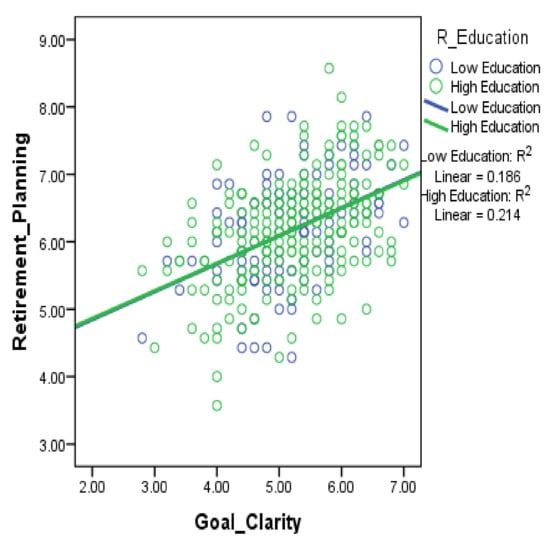
Figure 18.
Education has an impact on goal clarity and retirement planning.
4.10. Interaction Effect (Moderating Role of Income)
Participants with low income are better planners than participants with high income, as can be seen from the R2 results (see Figure 19, Figure 20, Figure 21 and Figure 22). Participants with high incomes are not concerned with retirement planning because they believe that their savings are sufficient for retirement. In summary, all moderator variables partially moderate the effect in a model because both groups (Table 5 and Table 6) have a highly significant effect.
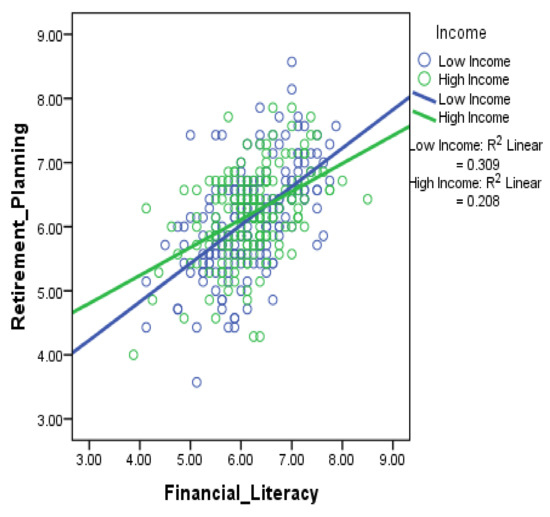
Figure 19.
Income has an impact on financial literacy and retirement planning.
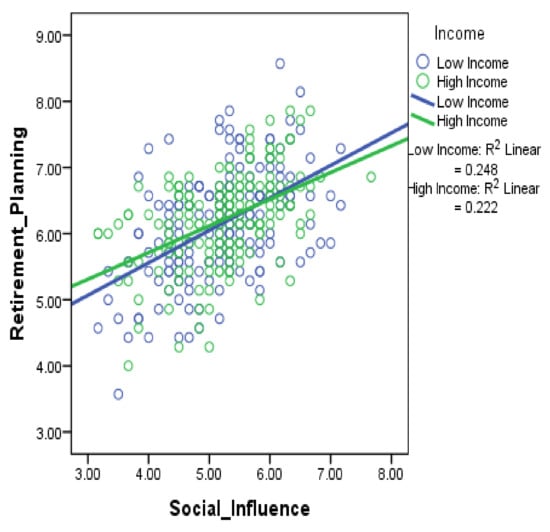
Figure 20.
Income has an impact on social influence and retirement planning.
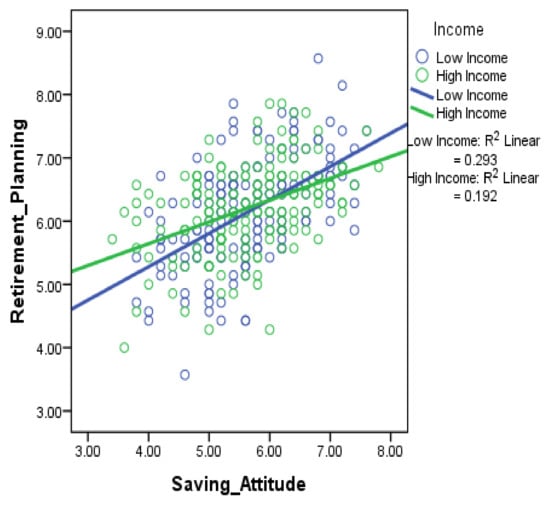
Figure 21.
Income has an impact on saving attitude and retirement planning.
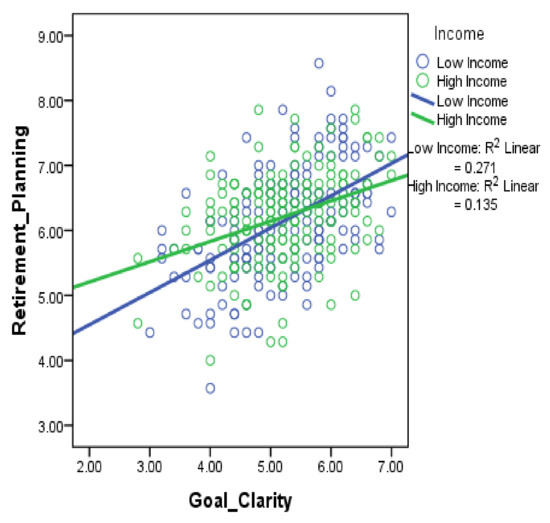
Figure 22.
Income has an impact on goal clarity and retirement planning.
5. Discussion
This study provides empirical insight into the direct and moderating effects of financial literacy, saving attitude, social influence, goal clarity, and retirement planning, with public demographic perspectives. This study complements the conceptual consideration by previous studies [27,77]. These constructs have a positive significant effect on retirement planning, which assumes that the public is aware of retirement issues. Further analysis of the moderating effect between public demographic and retirement planning using the heterogeneity test revealed a significant moderation effect. This study provides insight into the retirement planning model using in-depth analysis, which provides more information about this element.
These findings are stable across gender, age, income, status, and education samples. There is no significant difference between them in the model effects through the measurement invariance in SEM. These results support the generalizability for the findings across groups with distinct gender [77], age [78], income [75], marital status [79], and education [80]. The results suggest that the retirement planning behavior model is robust in terms of demographic differences, and the summary of the research hypotheses is shown in Table 7. On the other hand, the model was also verified by establishing the global fitness index, which implies the suitability of the indicator to assess the role of the constructs.
Table 7.
Summary of hypotheses testing.
Finally, the supplementary analyses support this conclusion, which indicates that the interaction effects in testing the moderating effect did not distort the results. This study also contributes to the methodological aspects by underlining the importance of supplementary analyses to determine that the researchers have obtained the information in more detail. This study concludes that single women at the age of 20–30, with high education and low income, have high financial literacy and goal clarity in preparing for their retirement savings, which is consistent with Sabri and Juen’s [14] findings. When assessing social influence on retirement planning, it is revealed that married women at the age of 31–40, with high education and low income, are more pronounced in these effects. Finally, married women at the age of 20–30, with high education and low income, are more obvious in the relationship between saving attitude and retirement planning. Overall, women are more ready than men to save for retirement.
6. Conclusions
This study has several implications, and it offers some recommendations for future research. It provides a foundation to further assess financial literacy, goal clarity, saving attitude, social influence, and retirement planning. Moreover, this study offers a mechanism to frame the causal effect relationship with public demographic properties in a model that is tested regularly, with no disturbance effect. Although the results revealed a significant moderating effect in all the relationships in a model, it is revealed that gender, age, income, education, and marital status variables only partially moderate those relationships. Hence, future research should focus on exploring those moderator variables.
Future studies should test these structural properties across different domains, for example, countries with different cultures and socioeconomic characteristics, rather than focusing on the east coast region of Malaysia. The model proposed from this study can be generalized to neighboring countries such as Indonesia, Thailand, and Singapore due to similar demographic characteristics such as culture and attitudes. This study has limitations. First, this study focused on working individuals under the age of 40 to examine their preparedness for retirement savings. Hence, people who are more than 40 years old were not considered in this study. Lastly, this study used a cross-sectional design, whereby the respondents’ decisions on their savings were only measured once throughout the study. In future research, the application of latent growth curve modeling or multilevel modeling is more suitable because it can estimate the respondents’ decisions more than once.
Author Contributions
A.A., N.R.Z., H.F., and Z.A. focused on conceptualization, methodology, resources, and writing—original draft preparation; A.A. and A.A.M. focused on conceptualization, methodology, and writing—review and editing. All authors have read and agreed to the published version of the manuscript.
Funding
This research received no external funding.
Conflicts of Interest
The authors declare no conflict of interest.
References
- Department of Statistics Malaysia. Key Statistics of Labour Force in Malaysia. June 2020. Available online: https://www.dosm.gov.my/v1/index.php?r=column/cthemeByCat&cat=124&bul_id=NXU1dHdlMFFDbm53V0NhYWxpNFE0UT09&menu_id=U3VPMldoYUxzVzFaYmNkWXZteGduZz09 (accessed on 22 August 2020).
- Habib, S. Counting on the Nest Egg. 2007. Available online: https://www.thestar.com.my/news/nation/2007/05/27/counting-on-the-nest-egg (accessed on 19 July 2013).
- Moorthy, M.K.; Durai, T.; Chelliah, L.; Sien, C.S.; Leong, L.C.; Kai, N.Z.; Teng, W.Y. A Study on the retirement planning behaviour of working individuals in Malaysia. Int. J. Acad. Res. Econ. Manag. Sci. 2012, 1, 54. [Google Scholar]
- Ibrahim, D.; Isa, Z.M.; Ali, N. Malaysian savings behavior towards retirement planning. In Proceedings of the 2012 International Conference on Economics Marketing and Management, Hong Kong, China, 5–7 January 2012. [Google Scholar]
- Lu, T.J.; Mitchell, O.; Utkus, S.; Young, J. Borrowing from the Future: 401 (k) Plan Loans and Loan Defaults (No. w21102); National Bureau of Economic Research: Cambridge, MA, USA, 2015.
- Munnell, A.H.; Hou, W.; Webb, A.; Li, Y. How Has the Shift to 401 (k) Plans Affected Retirement Income? 2017. Available online: https://crr.bc.edu/briefs/how-has-the-shift-to-401k-plans-affected-retirement-income/ (accessed on 21 August 2020).
- Samwick, A.A.; Skinner, J. How Will 401(k) Pension Plans Affect Retirement Income? Am. Econ. Rev. 2004, 94, 329–343. [Google Scholar] [CrossRef]
- Vaghefi, N.; Kari, F.B.; Talib, M.A. Poverty and Income Replacement Profile among EPF Retiree in Malaysia. Soc. Indic. Res. 2016, 132, 1065–1078. [Google Scholar] [CrossRef]
- EPF—Employees Provident Fund. EPF Sets RM228,000 as Minimum Target Savings at Age 55. 2016. Available online: https://www.kwsp.gov.my/en/-/epf-sets-rm228-000-as-minimum-target-savings-at-age-55 (accessed on 15 May 2020).
- Samad, S.A.; Mansor, N. Population ageing and social protection in Malaysia. Malays. J. Econ. Stud. 2017, 50, 139–156. [Google Scholar]
- Kim, J.; Kwon, J.; Anderson, E.A. Factors related to retirement confidence: Retirement preparation and workplace financial education. J. Financ. Couns. Plan. 2005, 16, 1–19. [Google Scholar]
- Kenanga Investors. 50% Retirees Exhausted Their Savings within Five Years of Retirement, How Can You Avoid This? 2015. Available online: https://www.kenangainvestors.com.my/KIB/KIB.Application.Web/KIBFundsAdmin/images/50_Retirees_Exhausted.pdf (accessed on 5 May 2020).
- World Bank. Financial Inclusion in Malaysia: Distilling Lessons for Other Countries. 2017. Available online: http://documents1.worldbank.org/curated/en/703901495196244578/pdf/115155-WP-PUBLIC-GFM08-68p-FIpaperwebversion.pdf (accessed on 12 May 2020).
- Sabri, M.F.; Juen, T.T. The Influence of Financial Literacy, Saving Behaviour, and Financial Management on Retirement Confidence among Women Working in the Malaysian Public Sector. Asian Soc. Sci. 2014, 10, 40. [Google Scholar] [CrossRef]
- Kock, H.; Folk, J.Y. Expected retirement age: A determinant of financial planning preparation in Malaysia. Afr. J. Bus. Manag. 2011, 5, 9370. [Google Scholar]
- Tan, H.K. Financial Planning for Post-Retirement among Urban Malaysians in Klang Valley. Ph.D. Thesis, University of Malaya, Kuala Lumpur, Malaysia, 2015. [Google Scholar]
- Sabri, M.F.; Falahati, L.F. Predictors of Financial Well-Being among Malaysian Employees: Examining the Mediate Effect of Financial Stress. J. Emerg. Econ. Islam. Res. 2013, 1, 61–76. [Google Scholar] [CrossRef]
- Hunt, L. Planning for retirement. The Star Online. 2009. Available online: https://www.thestar.com.my/business/business-news/2009/04/04/planning-for-retirement (accessed on 23 August 2020).
- Pai, Y. Comparing Individual Retirement Accounts in Asia: Singapore, Thailand, Hong Kong and PRC (China). 2006. Available online: http://documents1.worldbank.org/curated/en/922941468101940975/pdf/37432rev.pdf (accessed on 22 July 2020).
- Theong, M.J.; Osman, A.F.; Yap, S.F. Household Indebtedness: How Global and Domestic Macro-Economic Factors Influence Credit Card Debt Default in Malaysia. Inst. Econ. 2018, 10, 37–56. [Google Scholar]
- Wong, J.Y.; Earl, J.K. Towards an integrated model of individual, psychosocial, and organizational predictors of retirement adjustment. J. Vocat. Behav. 2009, 75, 1–13. [Google Scholar] [CrossRef]
- Topa, G.; Lunceford, G.; Boyatzis, R.E. Financial Planning for Retirement: A Psychosocial Perspective. Front. Psychol. 2018, 8, 2338. [Google Scholar] [CrossRef] [PubMed]
- Hira, T.K.; Rock, W.L.; Loibl, C. Determinants of retirement planning behaviour and differences by age. Int. J. Consum. Stud. 2009, 33, 293–301. [Google Scholar] [CrossRef]
- Hung, A.; Parker, A.M.; Yoong, J. Defining and Measuring Financial Literacy. Working Paper: Rand Labor and Population. 2009. Available online: https://www.rand.org/content/dam/rand/pubs/working_papers/2009/RAND_WR708.pdf (accessed on 9 May 2020).
- Lusardi, A.; Mitchell, O.S. Financial literacy and retirement preparedness: Evidence and implications for financial education programs. Bus. Econ. 2007, 42, 35–44. [Google Scholar] [CrossRef]
- Lusardi, A.; Mitchell, O.S. Financial literacy and retirement planning in the United States. J. Pension Econ. Financ. 2011, 10, 509–525. [Google Scholar] [CrossRef]
- Lusardi, A.; Mitchell, O.S. The Economic Importance of Financial Literacy: Theory and Evidence. J. Econ. Lit. 2014, 52, 5–44. [Google Scholar] [CrossRef]
- Beshears, J.; Choi, J.J.; Laibson, D.; Madrian, B.C.; Milkman, K.L. The Effect of Providing Peer Information on Retirement Savings Decisions. J. Finance 2015, 70, 1161–1201. [Google Scholar] [CrossRef]
- Van Dalen, H.P.; Henkens, K.; Schippers, J. How do employers cope with an ageing workforce? Views from employers and employees. Demogr. Res. 2010, 22, 1015–1036. [Google Scholar] [CrossRef]
- Bailey, J.J.; Nofsinger, J.R.; O’Neill, M. A Review of Major Influences on Employee Retirement Investment Decisions. J. Financial Serv. Res. 2003, 23, 149–165. [Google Scholar] [CrossRef]
- Duflo, E.; Saez, E. The Role of Information and Social Interactions in Retirement Plan Decisions: Evidence from a Randomized Experiment. Q. J. Econ. 2003, 118, 815–842. [Google Scholar] [CrossRef]
- Brown, J.R.; Kling, J.R.; Mullainathan, S.; Wrobel, M.V. Why don’t people insure late-life consumption? A framing explanation of the under-annuitization puzzle. Am. Econ. Rev. 2018, 98, 304–309. [Google Scholar] [CrossRef]
- Lerner, J.; Malmendier, U. With a Little Help from My (Random) Friends: Success and Failure in Post-Business School Entrepreneurship. Rev. Financial Stud. 2013, 26, 2411–2452. [Google Scholar] [CrossRef]
- Mansor, M.F.; Hong, C.C.; Abu, N.H.; Shaari, M.S. Demographic Factors Associated with Retirement Planning: A Study of Employees in Malaysian Health Sectors. Asian Soc. Sci. 2015, 11, 108–116. [Google Scholar] [CrossRef]
- Earl, J.K.; Bednall, T.C.; Muratore, A.M. A Matter of Time: Why Some People Plan for Retirement and Others Do Not. Work. Aging Retire. 2015, 1, 181–189. [Google Scholar] [CrossRef]
- Stawski, R.S.; Hershey, D.A.; Jacobs-Lawson, J.M. Goal Clarity and Financial Planning Activities as Determinants of Retirement Savings Contributions. Int. J. Aging Hum. Dev. 2007, 64, 13–32. [Google Scholar] [CrossRef]
- Hogarth, J.M.; Anguelov, C.E.; Lee, J. Why Don’t Households Have a Checking Account? J. Consum. Aff. 2005, 38, 1–34. [Google Scholar] [CrossRef]
- Hershey, D.A.; Jacobs-Lawson, J.M.; McArdle, J.J.; Hamagami, F. Psychological Foundations of Financial Planning for Retirement. J. Adult Dev. 2007, 14, 26–36. [Google Scholar] [CrossRef]
- Chou, K.-L.; Yu, K.-M.; Chan, W.-S.; Wu, A.M.; Zhu, A.Y.F.; Lou, V.W. Perceived retirement savings adequacy in Hong Kong: An interdisciplinary financial planning model. Ageing Soc. 2014, 35, 1565–1586. [Google Scholar] [CrossRef]
- Zacher, H. Older job seekers’ job search intensity: The interplay of proactive personality, age and occupational future time perspective. Ageing Soc. 2012, 33, 1139–1166. [Google Scholar] [CrossRef]
- Petkoska, J.; Earl, J.K. Understanding the influence of demographic and psychological variables on retirement planning. Psychol. Aging 2009, 24, 245–251. [Google Scholar] [CrossRef]
- Jacobs-Lawson, J.M.; Hershey, D.A.; Neukam, K.A. Gender Differences in Factors that Influence Time Spent Planning for Retirement. J. Women Aging 2004, 16, 55–69. [Google Scholar] [CrossRef]
- Wykle, M.L.; Whitehouse, P.J.; Morris, D.L. (Eds.) Successful Aging through the Life Span: Intergenerational Issues in Health; Springer Publishing Company: Berlin/Heidelberg, Germany, 2004. [Google Scholar]
- Baistaman, J.; Awang, Z.; Afthanorhan, A.; Rahim, M.Z.A. Developing and validating the measurement model for financial literacy construct using confirmatory factor analysis. Humanit. Soc. Sci. Rev. 2020, 8, 413–422. [Google Scholar] [CrossRef]
- Liebman, J.B.; Luttmer, E.F.P. Would People Behave Differently If They Better Understood Social Security? Evidence from a Field Experiment. Am. Econ. Journal: Econ. Policy 2015, 7, 275–299. [Google Scholar] [CrossRef]
- Croy, G.; Gerrans, P.; Speelman, C.P. The role and relevance of domain knowledge, perceptions of planning importance, and risk tolerance in predicting savings intentions. J. Econ. Psychol. 2010, 31, 860–871. [Google Scholar] [CrossRef]
- Lusardi, A.; Mitchell, O.S. Older Women’s Labor Market Attachment, Retirement Planning, and Household Debt. SSRN Electron. J. 2016. [Google Scholar] [CrossRef]
- Meisenberg, G. Gender Differences in School Achievement across Cultures: An Analysis of Results from PISA 2000–2012. Mank. Q. 2016, 57, 227–251. [Google Scholar] [CrossRef]
- Saw, G.K. Patterns and trends in achievement gaps in Malaysian Secondary Schools (1999–2011): Gender, ethnicity, and socioeconomic status. Educ. Res. Policy Pract. 2016, 15, 41–54. [Google Scholar] [CrossRef]
- Osman ME, T.; Al Khamisi, H.; Al Barwani, T.; Al Mekhlafi, A. EFL Reading Achievement: Impact of Gender and Self-efficacy Beliefs. Int. J. Learn. Teach. Educ. Res. 2016, 15, 54–73. [Google Scholar]
- Hyde, J.S.; Linn, M.C. Diversity: Enhanced: Gender Similarities in Mathematics and Science. Science 2006, 314, 599–600. [Google Scholar] [CrossRef]
- Talaga, J.A.; Beehr, T.A. Are there gender differences in predicting retirement decisions? J. Appl. Psychol. 1995, 80, 16. [Google Scholar] [CrossRef]
- Henkens, C. Retirement intentions and spousal support: A multi-actor approach. J. Gerontol. Ser. B 1999, 54, S63–S73. [Google Scholar] [CrossRef]
- Lee, W.K.M.; Law, K.W.-K. Retirement Planning and Retirement Satisfaction: The Need for a National Retirement Program and Policy in Hong Kong. J. Appl. Gerontol. 2004, 23, 212–233. [Google Scholar] [CrossRef]
- Joo, S.H.; Pauwels, V. Factors Affecting Workers’ Retirement Confidence: A Gender Perspective. J. Financ. Couns. Plan. 2002, 13, 1–10. [Google Scholar]
- Lusardi, A.; Mitchell, O.S.; Curto, V. Financial Literacy among the Young. J. Consum. Aff. 2010, 44, 358–380. [Google Scholar] [CrossRef]
- Faulkner, A.E. Financial Literacy Education in the United States: Library Programming versus Popular Personal Finance Literature. Ref. User Serv. Q. 2017, 56, 116. [Google Scholar] [CrossRef]
- Boisclair, D.; Lusardi, A.; Michaud, P.C. Financial literacy and retirement planning in Canada. J. Pension Econ. Financ. 2017, 16, 277–296. [Google Scholar] [CrossRef]
- Arano, K.; Parker, C.; Terry, R. Gender-based risk aversion and retirement asset allocation. Econ. Inq. 2010, 48, 147–155. [Google Scholar] [CrossRef]
- Hair, J.; Hollingsworth, C.L.; Randolph, A.B.; Chong, A.Y.L. An updated and expanded assessment of PLS-SEM in information systems research. Ind. Manag. Data Syst. 2017, 117, 442–458. [Google Scholar] [CrossRef]
- Kimiyagahlam, F.; Safari, M.; Mansori, S. Influential Behavioral Factors on Retirement Planning Behavior: The Case of Malaysia. J. Financ. Couns. Plan. 2019, 30, 244–261. [Google Scholar] [CrossRef]
- Jais, J.B.; Asokumar, A. Psychological Process, Social and Environmental Influence on Retirement Planning: Malaysian Energy Industry Perspective. Manag. Mark. Chall. Knowl. Soc. 2020, 15, 134–153. [Google Scholar] [CrossRef]
- Hassan, K.H.; Rahim, R.A.; Ahmad, F.; Zainuddin, T.N.A.T.; Merican, R.R.; Bahari, S.K. Retirement Planning Behaviour of Working Individuals and Legal Proposition for New Pension System in Malaysia. J. Polit. Law 2016, 9, 43. [Google Scholar] [CrossRef]
- Awang, Z.; Afthanorhan, A.; Mohamad, M.; Asri, M. An evaluation of measurement model for medical tourism research: The confirmatory factor analysis approach. Int. J. Tour. Policy 2015, 6, 29. [Google Scholar] [CrossRef]
- Afthanorhan, A.; Awang, Z.; Fazella, S. Perception of Tourism Impact and Support Tourism Development in Terengganu, Malaysia. Soc. Sci. 2017, 6, 106. [Google Scholar] [CrossRef]
- Henseler, J. Bridging Design and Behavioral Research with Variance-Based Structural Equation Modeling. J. Advert. 2017, 46, 178–192. [Google Scholar] [CrossRef]
- Aimran, A.N.; Ahmad, S.; Afthanorhan, A.; Awang, Z. The development of comparative bias index. In AIP Conference Proceedings; AIP Publishing: Melville, NY, USA, 2017; Volume 1870, p. 060008. [Google Scholar]
- Kashif, M.; Braganca, E.; Awang, Z.; De Run, E.C. You abuse but I will stay. J. Manag. Dev. 2017, 36, 899–914. [Google Scholar] [CrossRef]
- Bahkia, A.S.; Awang, Z.; Afthanorhan, A.; Ghazali, P.L.; Foziah, H. Exploratory factor analysis on occupational stress in context of Malaysian sewerage operations. In AIP Conference Proceedings; AIP Publishing: Melville, NY, USA, 2019; Volume 2138, p. 050006. [Google Scholar] [CrossRef]
- Aimran, A.N.; Ahmad, S.; Afthanorhan, A.; Awang, Z. The assessment of the performance of covariance-based structural equation modeling and partial least square path modeling. In AIP Conference Proceedings; AIP Publishing: Melville, NY, USA, 2017; Volume 1842, p. 030001. [Google Scholar]
- MacKenzie, S.B.; Podsakoff, P.M. Common Method Bias in Marketing: Causes, Mechanisms, and Procedural Remedies. J. Retail. 2012, 88, 542–555. [Google Scholar] [CrossRef]
- Lowry, P.B.; Gaskin, J. Partial Least Squares (PLS) Structural Equation Modeling (SEM) for Building and Testing Behavioral Causal Theory: When to Choose It and How to Use It. IEEE Trans. Dependable Secur. Comput. 2014, 57, 123–146. [Google Scholar] [CrossRef]
- Nasir, M.N.M.; Mohamad, M.; Ab Ghani, N.I.; Afthanorhan, A. Testing mediation roles of place attachment and tourist satisfaction on destination attractiveness and destination loyalty relationship using phantom approach. Manag. Sci. Lett. 2020, 10, 443–454. [Google Scholar] [CrossRef]
- Hoque, A.S.M.M.; Bin Awang, Z.; Muda, H.; Salleh, F. Ramification of crowdfunding on Bangladeshi entrepreneur’s self-efficacy. Accounting 2018, 4, 129–138. [Google Scholar] [CrossRef]
- Anderson, A.; Baker, F.; Robinson, D.T. Precautionary savings, retirement planning and misperceptions of financial literacy. J. Financ. Econ. 2017, 126, 383–398. [Google Scholar] [CrossRef]
- Xiao, J.J.; Porto, N. Financial education and financial satisfaction. Int. J. Bank Mark. 2017, 35, 805–817. [Google Scholar] [CrossRef]
- Topa, G.; Segura, A.; Perez, S. Gender differences in retirement planning: A longitudinal study among Spanish Registered Nurses. J. Nurs. Manag. 2018, 26, 587–596. [Google Scholar] [CrossRef]
- Kerry, M.J.; Embretson, S.E. An Experimental Evaluation of Competing Age-Predictions of Future Time Perspective between Workplace and Retirement Domains. Front. Psychol. 2018, 8, 2316. [Google Scholar] [CrossRef] [PubMed]
- Peisah, C.; Luscombe, G.; Earl, J.K.; Wijeratne, C. Aging women and men in the medical profession: The effect of gender and marital status on successful aging and retirement intent in Australian doctors. J. Women Aging 2017, 31, 95–107. [Google Scholar] [CrossRef] [PubMed]
- Kalmi, P.; Ruuskanen, O.-P. Financial literacy and retirement planning in Finland. J. Pension Econ. Finance 2017, 17, 335–362. [Google Scholar] [CrossRef]


Publisher’s Note: MDPI stays neutral with regard to jurisdictional claims in published maps and institutional affiliations. |
© 2020 by the authors. Licensee MDPI, Basel, Switzerland. This article is an open access article distributed under the terms and conditions of the Creative Commons Attribution (CC BY) license (http://creativecommons.org/licenses/by/4.0/).