Abstract
The prior research has partially addressed the full impacts of eco-packaging, mainly focusing on intention or attitude in a limited context. We attempt to investigate the actual consumer behavioral pattern to the eco-packaging appeals with revealed preference data. To test the diverse impacts on various product hierarchies, the sales of frequently purchased product category was applied. The scanner panel data availability in multi-category products enables us to test (1) the eco-packaging appeal impacts on Universal Product Code level sales, (2) the eco-packaging impacts on brand spillover effect, and (3) the linear or non-linear relationship between eco-packaging appeal and sales. Our results show that eco-packaging does contribute to its individual product sales. With regard to the brand spillover effect, our results reveal rather interesting results: brand spillover effect is present when eco-packaging intensity is high in the own product category, but not when the intensity is high in other product categories even if they both carry the same umbrella brand. Lastly, we discover an inverted U-shaped relationship between eco-packaging intensity within a brand and brand-level sales. It implies that adding eco-packaging appeal to products would actually increase the whole brand sales immediately, but after a peak point, the positive association transfer is weakened. Our results highlight that it is necessary to consider that ecologically sound packaging does induce market success.
1. Introduction
Although product packaging plays important strategic and tactical roles in marketing [1,2], recent publicity about waste derived from packaging has not been favorable. Anthropogenic debris is becoming a larger threat to ocean ecosystems as it is now listed as one of the main causes for the non-natural death of sea animals [3]. Social network services reveal this new threat through vivid photos of turtles with plastic straws up their nostrils and ever-increasing landfill space used for municipal solid waste.
It is disturbing to bear those phenomena with regard to the magnitude; the human population produces 348 million tons of plastic each year [4]. Making things worse for high-income and waste-exporting countries, China has banned the import of plastic waste since 2017. The government-level decision is particularly impactful since China imported 45% of the planet’s recyclables [5]. The aftermath of China’s decision triggered public policy implementations, such as charging a small fee and introducing partial or complete bans for single-use bags in some countries in Europe [6] and more awareness and behavioral response in the U.S. Notwithstanding this megatrend across the globe, the academic research on eco-friendly consumption in general has been scarce [7,8] and the financial efficacy and the mechanisms of eco-packaging sales are largely unknown [9].
Even if executed, the previous studies excessively investigate eco-packaging in the context of the European market [7,10,11] and firm-level investment sentiments [12,13], while the consumer-level purchasing behavior and the research context diversity are important. A number of authors call for more attention on and scrutiny of, including but not limited to, eco-packaging and market reactions, including its impacts on actual product choice [7,14] and testing a diverse range of products using a larger sample [10], such as a frequently purchased product category [8].
To extend and enrich the prior body of sustainability research focusing on eco-friendly packaging, we will first investigate the actual consumer behavioral reactions to the eco-packaging appeals in individual product-level sales in the context of a U.S. grocery store. A grocery store is selected due to its wide range of product categories and the scanner data availability from which actual purchase behavior can be evaluated. Secondly, we will address whether eco-friendly packaging positively impacts the brand-level sales (brand spillover effects). Lastly, we will respond to the long-standing debate [9] on the mechanisms of the eco-packaging return (linear return vs. curvilinear return) on brand-level sales. While most research in the context of curvilinear return apply firm-level financial performance (e.g., return on assets), investment reactions (e.g., stock market performance) [15], and firm valuation [16], there is, to the best of our knowledge, no empirical research on the product and brand level simultaneously. In sum, we aim to evaluate and elaborate the impacts of eco-friendly packaging on the most basic level of product hierarchy––identified by the Universal Product Code (UPC)—and its impacts on other regular products within the same brand as well as the rate of return mechanism in a fast-moving consumer goods (FMCG) context.
2. Literature Review
2.1. Eco-Packaging
Packaging plays an important role in marketing by providing physical protection throughout distribution, storage, sales, and usage [17], forming consumer perceptions and product positioning [18], enhancing brand awareness and certain associations through retrieval [19], communicating the subjective entity of the products at the point of purchase [2], influencing both the end consumers and other intermediaries in the value chain as a tool to enhance the product competitiveness [1], and satisfying ever-equipped modern consumers who seek trends as well as reliable information about the products [20]. Overall, it is one of the crucial marketing tools for FMCG success [2].
Eco-packaging, also known as green packaging, strives to maintain the traditional purpose of the packaging while minimizing rather negative impacts on the environment for years to come. There are numerous ways to execute and implement the eco-packaging practice as a science, art, and technology. Nevertheless, the core ideas of eco-packaging center around a few aspects: (1) the packaging itself is made from ecologically less harmful materials such as biodegradable and compostable substances which can be more easily and readily “broken down and assimilated by natural means back into common earth elements like carbon, oxygen and hydrogen” [21] (p. 8), (2) the packaging practice satisfies the ecological effectiveness by using less [22] or renewable and recycled materials [21], and (3) the packaging incorporates an environmentally sound lifestyle into its design and structure, such as avoidance of single usage [23]. The abovementioned claims, inevitably, should be communicated on the packaging directly and explicitly to consumers [24]. In sum, one can argue that the eco-packaging practice encourages and incorporates the closed loop, circular economy model throughout and amongst the entire value chain by intentional prolonging and spontaneous reverse-cycling of the materials and energy that are required otherwise.
A growing number of big and small brands implement this practice into their marketing plans. For instance, French cosmetic giant L’Oréal strives to minimize waste by offering to make all of their packaging rechargeable, refillable, recyclable, and compostable by 2025 [25]. The Coca-Cola Company is also reengineering their packaging by developing PlantBottle® packaging which contains plastic derived from sugar cane, not petroleum [7]. However, the firm-side enthusiasm cannot be justified without financial incentives due to their nature as profit-seeking organizations [26]. Fortunately, previous studies report the economic motivation of eco-packaging, such as cost saving through less shipping loads during transportation due to reduced packaging in volume [21]. For instance, General Mills’ decision to use less material in its granola bar packaging in 2010 resulted in saving 6.2 million pounds. Consumer-side reactions, one of the most important motivators of firm-level engagement in eco-packaging, are addressed in the following section.
2.2. Eco-Packaging and Market Reaction: Theoretical Frameworks
Some studies [10,27] apply Maslow’s [28] meta-motivations to explain consumers’ engagement in ethical consumption. That is, after satisfying one’s innate and psychological needs, meta-motivations can be pursued and individuals can devote themselves in a self-transcendent manner [27]. They desire to achieve something beyond themselves, such as knowledge, creativity, perfection, peace, and ecological concerns [10]. However, one of the assumptions of Maslow’s hierarchy of needs is that one can only move upward when all other previous steps are satisfied. This, in turn, predicts the inevitable niche nature of eco-friendly practice compared to other product traits which appeal to more basic needs (e.g., hunger and thirst).
Other than Maslow’s hierarchy theory, most studies in the context of sustainability utilize the theories of reasoned action [29] as the underpinning theoretical framework, where the linkage from positive attitudes—intention—then to behavior, are assumed [30]. Why consumers possess positive attitudes toward eco-packaging are largely two-fold: it satisfies self-interest and altruistic means. For instance, Scott and Vigar-Ellis [31] report that many respondents who preferred eco-packaging also believed it benefited their quality of life, emotional and physical condition, and even saved them money. On the other hand, the altruistic motives reside in environmental consciousness and moral values [8] as well as sustainable development [32].
Although some are reluctant to trade off eco-packaging appeal with more salient traits of the products, such as taste and price in the food category [11], other consumers, in a similar vein, might consider ecological aspects of the product only as a “tie-breaker” in which the eco-packaging is not the primary attribute in their decision making, however, it is still preferred over a regular product if all other conditions are the same [11]. In some extreme cases, eco-packaging could actually harm product success via sustainability liability. That is because functional features and ease of carrying can be sacrificed by less materials in packaging and possible breakage or leakage during transportation [33].
While some empirical studies postulate eco-packaging as one of the primary factors that form consumers’ final decisions [31,34,35], some also report disappointing sales trends [36]. The mixed results of eco-packaging add more complexity to the discussion of eco-packaging and its market success. We posit that eco-packaging analyses should be disaggregated into various levels and angles. We aim to measure the eco-packaging success on two levels: (1) individual product sales which are identified by UPC and (2) its impacts on brand-level sales (brand spillover effects). Increased sales provide the strong motivation to continue a certain marketing tool and strategy. However, brand spillover effects are also a powerful motive. Even though eco-packaging does not impact the individual product item success, if it helps the overall image (and therefore the sales) of the brand as a whole, one can argue an economic justification of eco-packaging practice. Furthermore, we will test the curvilinear mechanism between eco-packaging intensity and brand-level success. By doing so, we posit that this research has taken the contingency approach and answers the question of “when it pays to be green” [37].
2.3. Conceptual Background
2.3.1. UPC-Level Sales
In an attempt to decompose the financial efficacy of eco-packaging on various levels and angles, first, we aim to evaluate the impact of eco-packaging on individual product success. The previous literature on this matter has predominantly been positive, from attitude formation to final choice [38]. Packaging and labeling matter to consumers; sustainability appeal has a substantial influence on a consumer’s choice [24]. Rokka and Uusitalo reveal that consumers have shown a strongly positive attitude and choice to eco-packaging on the individual product level [24]. Other empirical studies also added to this ethical imperative on the product- = level via consumers’ high purchase intention [34] and even willingness to pay a price [8].
Due to the elevated level of attention and awareness of eco-packaging throughout traditional to consumer-generated media [10], one can logically assume that, on average, consumers’ belief toward eco-packaging is strong. This, in turn, will affect their attitude and, eventually, the final choice. This linkage among belief (strong belief about eco-packaging), attitude (one’s evaluative judgment about eco-packaging: predominantly positive according to the literature), and action (actual purchase of the eco-packaging) is expected to hold according to the theory of reasoned action [30]. Additionally, eco-packaging would be a more important criterion for FMCG, given the large quantities and the frequencies of the product purchase [8]. That is, if a product is often purchased in a large volume, then one is more likely to take responsibility through “perceived consumer effectiveness” (the perceived level on which one can make difference to the environment by purchasing eco-friendly products) [36], or otherwise justify the non-eco consumption as a rare incident or completely ignore the consequence without feeling any guilt. Thus, we hypothesize as follows:
Hypothesis 1:
Eco-packaging as one of the product attributes in fast-moving consumer goods positively affects the individual product-level (UPC-level) success.
Hypothesis 1 addresses the issue of eco-packaging impacts on UPC-level success. The following section will discuss its impacts on brand-level success (brand spillover effect).
2.3.2. Brand Spillover Effects
The previous studies reveal spillover effect in a sustainability context; the firm’s ethical engagement can have an impact not only to its own product but also to the other products carrying the same brand name [7,39]. With regard to the eco-packaging trait of the product, we posit that consumers’ nodes can be expressed as a matrix, comprising the tangible (e.g., biodegradable plastic) and intangible product attributes (e.g., sustainability). Those product attributes are transferable across different products within the same brand name [19,40]. That is, knowledge and features of a product in one’s memory can be linked to related products via priming [39]. Here, the bonds that connect two products are brand associations in consumers’ nodes in such a way that “other products with the same brand name make consumers aware of the performance bond at stake for the firm” [40] (p.5). Therefore, we assume that eco-packaging has a positive spillover effect on the sales of products within the same umbrella brand which would otherwise be unrelated. For instance, the traits of ecological accountability can be transferred to regular products if two products carry the same brand name (e.g., Sun Chips with and without biodegradable plant-based packaging). Thus, the following hypothesis is derived.
Hypothesis 2:
Eco-packaging has a positive brand spillover effect in that adding an eco-packaging feature to individual products can have positive impacts on brand-level sales within the same umbrella brand.
Here, we posit that there is a positive relationship between the existences of eco-packaging items and the brand-level sales even though not all products have eco-packaging in that specific brand. However, whether this brand-level spillover effect of eco-packaging is universally monotonic is yet unknown. Instead of a single positive linear model, we aim to evaluate the curvilinear model as well. The following section will discuss it in more depth.
2.3.3. Curvilinearity in Brand Spillover Effect
With regard to the sustainability and financial relationship, most assume the linear return. However, a growing number of studies are finding evidence of a more complex relationship between environmental and financial performance [12,15,41]. For this reason, numerous authors call on future researchers to investigate the divergent dynamics of eco-packaging and its financial efficacy in different situations and contexts [12]. Hypothesis 3 is our response to this gap in the literature. Thus, we will evaluate the relationship between within-brand eco-packing intensity and brand-level sales.
In terms of the specific mechanism of the return, we assume an inverted U-shaped nonlinear relationship between brand eco-packaging intensity and brand-level sales. That is, the eco-packaging spillover effect on brand-level sales has an optimal point where the eco-packaging intensity is not too little but also not too high. Consumers view the eco-packaging labeling as a positive sign, and it even influences how consumers select a certain brand [7]. It is possible since packaging is an important cue directly related to the brand, while there is a lack of the rest of the information at the point of purchase [42]. For this reason, consumers utilize packaging information to infer brand personality and the quality of food products [7]. However, this positive impact is not finite and investment in eco-packaging cannot promise a proportional increase in brand-level sales. First, consumers associate the brand with high eco-packaging intensity with a sign of opportunity costs for firms, allocating an excessive resource to extrinsic benefit (pro-ecological activity) in an exchange for intrinsic benefit (customer value) [43]. That is, the costs of the continuous managing and researching of eco-packaging through a series of line extensions can reduce the financial allocation to other business functions [44]. These costs, due to research on regulations and technologies (e.g., bio-degradable materials and plastic-alternative packaging), are various, including cash, time and effort, additional employment, and even a share in brand positioning. Second, consumers without any specific commitment toward the eco-lifestyle might interpret the eco-packaging as unnecessarily expensive or inferior in quality [36]. For instance, bottled water with less plastic is eco-friendly, but it reduces the durability of the product by causing leakage and deformation of the bottle and sacrifices the taste. Consumers could view this as a negative trait since taste is a non-negotiable product attribute for most consumers [11]. Similarly, consumers often assume there is a positive link between eco-packaging and a price premium [7]. Although some consumers show a high willingness to pay for eco-friendly products [8], the actual behavioral patterns of the vast majority of consumers do not seem to follow their intentions [36]. Since (1) the eco-packaging focuses more on extrinsic value (ecological impacts) rather than the intrinsic benefit (core product quality and competitive price) and (2) the eco-concerned lifestyle is not yet a mainstream consumer culture, it is inferred that the positive spillover effects are expected to decrease as the eco-packaging intensity increases. Thus, the following hypothesis is formed.
Hypothesis 3:
The relationship between the brand-level eco-packaging intensity and brand-level sales is expected to be curvilinear, specifically an inverted U shape.
3. Method
3.1. Research Design
The current study aims to evaluate the suggested hypotheses in the context of FMCG, which have a wide range of product categories. This way, we can reduce the social desirability bias which is one of the pervasive problems in ethical consumption studies using survey data [30]. That is, respondents feel pressure to answer favorably toward eco-consumption against their true wills or actual behaviors [11]. The availability of the scanner data is possible due to the collaboration of a large supermarket chain in the Southwest region of the U.S. The parent company owns more than 50 stores with different segmentation and targeting strategies. We specifically selected 10 stores due to their large assortments of eco-packaging appeal among their products.
3.2. Data Description
The original data comprise real-time transactions for a 106-week period in 2009–2010. Since the raw data were collected whenever a transaction occurred, appropriate aggregations were necessary. For instance, the data were aggregated by week, by store, and per UPC for Hypothesis 1. Further aggregations were made for Hypothesis 2 and 3 in terms of the brand level. The analysis includes at least three categories in each brand. A weekly increment allows for an optimal period-to-period comparison of sales since a typical promotion cycle is also weekly. For the particular grocery chain from which we obtained the data, the weekly cycle lasts from Wednesday to the following Tuesday. The first few days before week 1, Wednesday and the last few days after week 106, Tuesday were eliminated and so were other incomplete data with entry errors and unknown errors. As a result, the final data set contains a total of 3,525,537 and 1,434,917 unique identifiers for UPC- and brand-level analysis, respectively.
3.3. Dependent Variable
The dependent variable in the study is sales in United States Dollar (USD), which has two components of total units sold (volume) measured as the count of individual UPCs sold multiplied by unit price of the same UPC. Sales, units sold, and unit price are unique across weeks and stores due to a possible price promotion applied in each time frame and store location. The time frame ranges from 1 to 106 where each number indicates the specific week. Weekly sales are the net sales excluding returns per UPC (Hypothesis 1) and per brand (Hypothesis 2 and 3). For Hypothesis 2 and 3, we eliminated the product categories with less than three in each brand for the sake of comparison. For example, if a brand has two product categories and one of them has eco-packaging appeal, the eco-packaging ratio of the brand becomes 50%, preventing comparison with a brand with many product categories.
3.4. Independent Variables
Eco-packaging. A dummy variable is created, indicating that either a certain product has a feature of eco-packaging directly and explicitly in its outer packaging (1 = eco-packaging, 0 = otherwise). To identify a product’s sustainability and eco-friendliness, we followed the guideline from the Sustainable Packaging Coalition [45], which emphasizes the source of the materials that were used during the manufacturing process. Since neither the manufacturer nor the retailer maintains the eco-packaging as product information, one of the authors manually classified and identified the eco-packaging using a wireless UPC barcode scanner.
3.5. Control Variables
Featured advertisement. This variable indicates that a certain UPC is featured in a store-generated (yet often funded by the manufacturers) weekly flyer during the given week (1 = product item is featured in a flyer, 0 = otherwise). Independent of the eco-packaging or regular product, the effect of feature advertisement measures the financial efficacy of store-generated printed advertisements.
Price promotion and deletion. These variables refer to UPCs that have a temporary price deduction (price promotion) or a price deduction followed by removal from the shelf (deletion). Here, two price promotion variables are also treated as binary.
Holiday. A total of six holidays are included: Thanksgiving, Christmas, Independence Day, Labor Day, Columbus Day, and Martin Luther King Day. A typical model specification for the holiday effect is the indicator variable, “1” during the week of the holiday and “0” otherwise. Each indicator variable is repeated twice since the duration of data collection is two years.
3.6. Model Specification
We employ a fixed effect model to control for store and holiday effects. We control error correlation across weeks in each product to get unbiased estimates with clustered standard errors which often appear in large-scale scanner data [30]. We cluster standard errors by UPC product for Hypothesis 1 and brand for Hypothesis 2 and 3. Equation (1) represents the model specification for the effects of eco-packaging on product sales (Hypothesis 1):
where Y = UPC sales in USD, Eco = eco-packaging (dummy), i = the unique UPC, j = store, and t = week. The parameter is the efficacy of eco-packaging on UPC-level sales. The positive and significant coefficient indicates that eco-packaging indeed plays a role in consumer choice, supporting Hypothesis 1. Equation (2) aims to test brand spillover effects: the effects of eco-packaging intensity on brand-level sales. Notwithstanding the difficulty in data collection and analysis, many studies apply a multi-category analysis for brand spillover effects [40] since numerous firms embrace both line extensions (within the same product category) and brand extensions (across different product categories). Since a single-product model cannot holistically reflect the current market phenomena, we apply the multi-product category model. With this model, brand spillover effect can be measured by the following model:
in this equation, is the brand-level sales in USD in product category i, brand j, and week t.
The component represents the ratio of UPCs with eco-packaging in product category i, brand j, and week t. The coefficient is related to the brand spillover effect of eco-packaging from the own product category (line extension).
where i = product category, j = brand, and t = week.
, on the other hand, is the average ratio of UPCs with eco-packaging in other product categories, except for i, in brand j, and week t.
where i = product category, j = brand, and t = week.
For this reason, parameter explains the brand spillover effect of eco-packaging from other product categories (brand extension). The interaction term of and estimates the comprehensive brand spillover effect of eco-packaging: simultaneous introductions in line extension and brand extension. If the coefficients , and are positive and significant, Hypothesis 2 is supported: positive brand spillover effect of eco-packaging on brand-level sales. However, one should note that each parameter estimates a different type of brand spillover effect, that is, for brand spillover from line extension, for brand spillover from brand extension, for brand spillover from line and brand extension.
Besides, to test the curvilinearity of brand spillover effect (specifically an inverted U shape) postulated in Hypothesis 3, we form the following model with the linear and the quadratic variable of eco-packaging as follows:
where = the brand-level sales in USD in product category i, brand j, and week t and the variable = the ratio of UPCs with eco-packaging in product category i, brand j, and week t. If the coefficient is negative and significant, Hypothesis 3 will be supported: eco-packaging positively effects the overall sales of a brand with a peak point, but then decreases after.
4. Empirical Results
This section will reveal the statistical results of eco-packaging impacts on UPC-level sales and brand-level sales along with the curvilinearity test. The fixed models at UPC- and brand-level are estimated with a least square regression with robust standard errors for the sake of unbiased estimates of variance and covariance parameter estimation. Table 1 shows the effects of eco-packaging with respect to UPC level. The R2 of the model is 0.58 and the F-value is 6441, which is statistically significant at the 0.001 level.

Table 1.
The effect of eco-packaging on universal product code (UPC)-level sales.
The dependent variable is UPC-level USD sales. Eco-packaging is an indicator variable in terms of eco-packaging. Holiday is a dummy variable for holidays including Thanksgiving and post-Thanksgiving, Christmas, the Super Bowl, Independence Day, Labor Day, Columbus Day, and Martin Luther King Day. Manager denotes manager special in a store. Deletion is typically carried out with a 6-week price reduction prior to removing the item from inventory. Sales adv. includes the weekly flyers and in-store newspapers. Store is a fixed effect of 10 stores.
The eco-packaging appeal has a statistically significant and positive effect on UPC-level sales ( = 4.387, p = 0.003), supporting Hypothesis 1. This result can be interpreted as: when a product is featured with an eco-packaging appeal, the sales of the product increases by USD 4.3 on average. Indeed, the analysis justifies continuous development and research on sustainability marketing in retail settings, especially in the context of FMCG.
With regard to the control variables, the holiday week dummy variable does not show any significant effect on sales; this implies that eco-packaging is not specific to a season or a time of the year since our holiday control variable is spread across seasons (Independence Day in summer, Labor Day in early fall, Columbus Day, Thanksgiving, and post-Thanksgiving in fall, Christmas and Martin Luther King Day in winter, the Super Bowl in late winter). Unlike other products (e.g., hot chocolate during winter) or product features (e.g., pumpkin flavor during fall), eco-packaging does not have a seasonality and can be featured in a product all year round. From promotion activities, we find a positive and significant effect of sales advertisement such as weekly flyers and in-store newspaper advertisement, which has the highest effect of 68.313. The coefficient of manager specials, however, is negatively and significantly associated with UPC-level sales. One possible explanation might be reduced unit price; the price promotion increases number of units sold but decreases the overall revenue since unit price is significantly reduced. Unless the change in units sold exceeds the change in unit price, the overall effect remains negative.
With regard to Hypothesis 1 and the main variable (eco-packaging own effect on UPC-level sales), we observe evidence of a positive correlation between eco-packaging and product item-level financial performance. This will contribute to the sustainability appeal as a viable marketing tool, which previously has had mixed results (e.g., [31,36]).
In Hypothesis 2, we posit that eco-packaging will positively influence overall brand-level sales due to a brand spillover effect. To measure this rather complex phenomenon, we decompose the model into three parts: brand spillover effect from line extension, brand extension, and combined introduction. We illustrate the regression results in Table 2. Ep_ratio is the ratio of eco-packaging in brands by category (Equation (3)) and Ep_other is the average ratio of eco-packaging in all other product categories in the same brand (Equation (4)). The interaction term of Ep_ratio and Ep_other measures the spillover effect of eco-packaging appeal, where the line extension and brand extension strategy simultaneously exist in one brand.
Table 2.
Estimates of fixed effects by brand level.
The dependent variable is the brand–level sales in USD. Ep_ratio is the ratio of eco-packaging in a category of a brand. Ep_other is the average ratio of eco-packaging in other categories in the same brand. Holiday is a dummy variable for holidays including Thanksgiving and post-Thanksgiving, Christmas, the Super Bowl, Independence Day, Labor Day, Columbus Day, and Martin Luther King Day. Manager denotes manager special in a store. Deletion is typically carried out with a 6-week price reduction prior to removing the item from inventory. Sales adv. is anything in the weekly flyer and/or in-store newspaper. Store is a fixed effect of 10 stores.
Table 2 displays the spillover effect from three different sources. The coefficient Ep_ratio is positive and significant ( = v8.245, p = 0.032) and Ep_other is negative and significant ( = −10.538, p < 0.000). Ep_ratio refers to the spillover effect from line extension within the same product category (e.g., the impact of Sun Chips biodegradable plant-based packaging on total Sun Chips sales). The coefficient of Ep_ratio is positive and significant at 8.245, suggesting that if eco-packaging intensity in a product category increases by one percent, the brand-level sales within the same product category increase by USD 8.245. Ep_other captures the spillover effect from other product categories (e.g., the impacts of Dannon yogurt packaging with recycled materials on the sales of Dannon protein shakes). We find a negative spillover effect for eco-packaging with regard to the brand extension; the coefficient of Ep_other is negative and significant at −10.538. The negative parameter of Ep_other shows the substitution effects [40]. That is, the introduction of eco-packaging in one product category reduces the sales of other product category that carries the same umbrella brand name. Although the introduction of eco-packaging increases the own product category sales with the same brand name ( = 8.245, p = 0.032), the results reveal that consumers are not likely to extend that positive association (sustainability) to other product categories with the same brand.
The interaction term of Ep_ratio and Ep_other captures combined spillover effects in our model, that is, brand spillover from both line and brand extension. The interaction term Ep_ratio × Ep_other is negative and significant ( = −20.419, p < 0.006), indicating that as eco-packaging appeal is extended to its own and other product categories simultaneously with the same brand (concurrent line and brand extension), the brand-level sales of the own product category indeed decrease, showing a negative spillover effect (Figure 1).
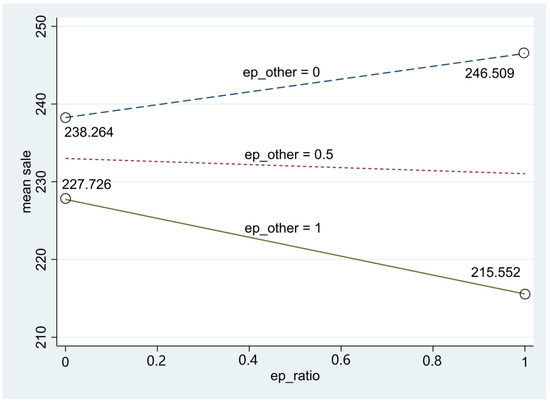
Figure 1.
The spillover effect of eco-packaging.
Four figures in Figure 1 are drawn with the estimates in Table 2 by setting the average sales at USD 217.957. For example, when both Ep_other and Ep_ratio are zero (no eco-packing in own category and other category), then the brand sales of own category are USD 238.264 (USD 217.957 + USD 20.307). When Ep_other is one and Ep_ratio is zero (the own category has no eco-packaging and 100% of products have eco-packaging in the other category with the same brand name), then the brand-level sale of own category becomes USD 227.726 (USD 217.957 + USD 20.307 -USD 10.538). Thus, when Ep_ratio is zero, the discrepancy of sales between Ep_other = 0 and Ep_other = 1 is USD 10.538. On the other hand, when Ep_other is zero and Ep_ratio is one (all products in own category have eco-packaging while no eco-packaging exists in other categories under the same umbrella brand), then the brand-level sales of own category becomes USD 246.509 (USD 217.957 + USD 20.307 + USD 8.245). Lastly, when both Ep_other and Ep_ratio are one, then the brand-level sales of own category becomes USD 215.552. Figure 1 indicates that as Ep_other is close to one, the negative spillover effect is escalated. In conclusion, Hypothesis 2 is partially supported. While the line extension of eco-packaging has a positive brand spillover effect, the brand extension shows a negative brand spillover effect.
Next, we investigate the non-linear effect of eco-packaging appeal and the regression results are shown in Table 3. For the multicollinearity issue of an eco-packaging variable, we centered the eco-packaging value in our model [46]. The coefficient of the centered eco-packaging is positive and statistically significant ( = 178.897, p < 0.0001). Besides, the coefficient of the squared term of centered eco-packaging is negative and statistically significant ( = 199.073, p < 0.0001). Consistent with our expectation in Hypothesis 3, we find an inverted U-shaped curvilinear relationship between eco-packaging intensity and brand-level sales. The brand level sales have a peak at the point of 0.447 of centered eco-packaging by derivatives. This result indicates that as the eco-packaging ratio increases, the brand-level sales increase and reach the peak of sales, and then decrease thereafter.
Table 3.
The non-linear relationship between eco-packaging and sales.
The dependent variable is the brand-level sales in USD. Eco-packaging center is the centered ratio of eco-packaging in a category of a brand to address the problem of multicollinearity. Holiday is a dummy variable for holidays including Thanksgiving and post-Thanksgiving, Christmas, the Super Bowl, Independence Day, Labor Day, Columbus Day, and Martin Luther King Day. Manager denotes manager special in a store. Deletion is typically carried out with a 6-week price reduction prior to removing the item from inventory. Sales adv. is anything in the weekly flyer and/or in-store newspaper. Store is a fixed effect of 10 stores.
5. Discussion
The objective of our study is to discover the relationship between eco-packaging appeal and financial performance on two levels of product hierarchy (UPC and brand) in an FMCG context. We also test it in two different product hierarchies, UPC and brand. To contribute to the body of knowledge on the brand spillover effect of eco-packaging, we further decompose brand spillover effect: those from the own product category (line extension) and those from other product categories (brand extension) with the same umbrella brand. Nonlinearity is also evaluated to address the rather complex mechanism of subject matter, which might otherwise misguide practitioners. What emerged from our empirical study is more complicated than the current literature has demonstrated. Like the prior literature, our results show that eco-packaging does contribute to its own product sales. This tells practitioners that sustainability is indeed preferred by general consumers in relatively low-involvement, frequently purchased product categories. This result appears to validate the findings and expectations of previous studies [8,34].
The test for brand spillover effect reveals rather interesting results: brand spillover effect is present when eco-packaging intensity is high in the own product category, but not when the intensity is high in other product categories even if they both carry the same umbrella brand. In other words, eco-packaging brand spillover effect comes from the line extension strategy, but not from the brand extension strategy. Our finding confirms finding from previous literature on reciprocal brand spillover effects [40,47] but extends knowledge to a diverse area of research: the sustainability in packaging strategy. While previous studies focus on the traditional traits of the core products in brand spillover effect, we devoted the study to packaging which was considered as rather peripheral and not a meaningful factor of purchase decisions [19]. An inverted U-shaped relationship between eco-packaging intensity within a brand and brand-level sales implies that adding eco-packaging appeal to products would actually increase the whole brand image immediately. However, consumers react to this sustainability appeal in a rather non-product-related way up to a certain point. After a peak point, the positive association transfer is weakened and consumers look for other traits in products. To the best of our knowledge, our study is the first to fully explore the phenomenon (nonlinearity of eco-packaging return on brand-level sales), measuring the actual behavioral pattern of consumers. Without this full understanding, scholars and practitioners might be misguided due to either underestimated or overestimated financial efficacy of eco-packaging appeal. Our results support the previous studies in the field of the theory of reasoned action [29] and its causal link of positive attitude → purchase intention → actual purchasing. While the first correlation has been extensively studied (attitude and intention), the last linkage has been largely ignored. The current study fills the gap in the literature. For practitioners, our study also provides some meaningful and useful normative guidelines on eco-packaging in own products, across products, and product development strategy.
Companies should acknowledge the full impact of excessive packaging on the environment, local and global communities, and animal wellbeing where the businesses are embedded. Firms can be proactive with regard to sustainability since it does financially pay and justify the expenses. We assume there is no conflict between product and brand managers since adding eco-packaging is financially rewarding at both levels, although disproportionately. Investors should be patient with a firm’s pro-ecological commitment since at a brand level, it requires more resources and research to realize increasing rewards. Practitioners should not interpret our results in an incorrect way in that simply adding a large assortment of eco-packaging appeal guarantees brand-level success. Rather, brand managers should focus on continuous innovation and manufacturing techniques to reduce price and improve quality of the core product to appeal to larger segments [36]. Furthermore, brand managers should conduct ongoing research to monitor sales so as not to extend past the peak where brand-level returns seem to decrease after a certain point.
6. Conclusions
The results of the study lead to a series of normative recommendations to various members in the value chain. First of all, brand managers could use this information to get an insight into own product and brand-level spillover effects of eco-packaging appeal. Packaging managers and designers could justify their efforts in eco-packaging and could encourage colleagues across different departments. Governments should consider providing an external benefit (e.g., tax credits) to firms showing eco-commitment via packaging for the collective benefit of society. For example, UK supermarket chain ASDA has introduced a system in which consumers can refill their laundry detergent and shampoo bottles [23]. Individual-level movement is still meaningful but the impact will be even larger when various value chain members participate in this social movement and thereby increase collective awareness. Applying eco-packaging on products should be engaged with caution due to a diminishing return of brand spillover effect. Rather than a huge umbrella brand approach, a multi-branding strategy in each product category is recommended since consumers seem to substitute the sustainability of a brand across different product categories.
As with any academic research, our study has some limitations that future authors might take into account. Although our study fills the gap in the literature, our data come from a single branch of a limited geographic market in the U.S. Due to reasons of secrecy, we could not access profitability data, but only weekly sales. Furthermore, our scanner data were collected during the time period of 2009–2010, when the global economic decline was taking place. Further studies would replicate our research, using a more up-to-date data set. Future research should also uncover more holistic analyses, taking profit into account, including the reduced expenses via product weight reduction and via using fewer raw materials. Lastly, future research might investigate eco-packaging practices and the impact on other members of the value chain (e.g., manufacturers to wholesalers). Returning to our research question, we can conclude that there is empirical evidence of a non-linear inverted U-shaped relationship between eco-packaging intensity and brand-level sales. Furthermore, our results highlight that it is necessary to consider that ecologically sound packaging does induce market success for own product sales; after all, green packaging attracts greenbacks.
Author Contributions
S.C. wrote the original draft and collected scanner data. S.L. analyzed UPC data to investigate three proposed hypotheses. All authors have read and agreed to the published version of the final manuscript.
Funding
This research received no external funding.
Conflicts of Interest
The authors declare no conflict of interest.
References
- Rundh, B. The role of packaging within marketing and value creation. Br. Food J. 2016, 118, 2491–2511. [Google Scholar] [CrossRef]
- Silayoi, P.; Speece, M. The importance of packaging attributes: A conjoint analysis approach. Eur. J. Mark. 2007, 41, 1495–1517. [Google Scholar] [CrossRef]
- Mascarenhas, R.; Santos, R.; Zeppelini, D. Plastic debris ingestion by sea turtle in Paraíba, Brazil. Mar. Pollut. Bull. 2004, 49, 354–355. [Google Scholar] [CrossRef] [PubMed]
- Zhang, Z.; Wu, H.; Peng, G.; Xu, P.; Li, D. Coastal ocean dynamics reduce the export of microplastics to the open ocean. Sci. Total. Environ. 2020, 713, 136634. [Google Scholar] [CrossRef] [PubMed]
- Brooks, A.L.; Wang, S.; Jambeck, J.R. The Chinese import ban and its impact on global plastic waste trade. Sci. Adv. 2018, 4, eaat0131. [Google Scholar] [CrossRef]
- Xanthos, D.; Walker, T.R. International policies to reduce plastic marine pollution from single-use plastics (plastic bags and microbeads): A review. Mar. Pollut. Bull. 2017, 118, 17–26. [Google Scholar] [CrossRef] [PubMed]
- Magnier, L.; Crié, D. Communicating packaging eco-friendliness. Int. J. Retail. Distrib. Manag. 2015, 43, 350–366. [Google Scholar] [CrossRef]
- Prakash, G.; Pathak, P. Intention to buy eco-friendly packaged products among young consumers of India: A study on developing nation. J. Clean. Prod. 2017, 141, 385–393. [Google Scholar] [CrossRef]
- Husted, B.W.; Russo, M.V.; Meza, C.E.B.; Tilleman, S.G. An exploratory study of environmental attitudes and the willingness to pay for environmental certification in Mexico. J. Bus. Res. 2014, 67, 891–899. [Google Scholar] [CrossRef]
- Pires, A.; Pires, A.; Portela, G.; Fonseca, M. Factors affecting consumers’ choices concerning sustainable packaging during product purchase and recycling. Resour. Conserv. Recycl. 2015, 103, 58–68. [Google Scholar] [CrossRef]
- Van Birgelen, M.; Semeijn, J.; Keicher, M. Packaging and proenvironmental consumption behavior: Investigating purchase and disposal decisions for beverages. Environ. Behav. 2009, 41, 125–146. [Google Scholar] [CrossRef]
- Barnett, M.L.; Salomon, R.M. Does it pay to be really good? Addressing the shape of the relationship between social and financial performance. Strat. Manag. J. 2012, 33, 1304–1320. [Google Scholar] [CrossRef]
- Dai, J.; Lu, C.; Qi, J. Corporate Social Responsibility Disclosure and Stock Price Crash Risk: Evidence from China. Sustainability 2019, 11, 448. [Google Scholar] [CrossRef]
- Rokka, J.; Uusitalo, L. Preference for green packaging in consumer product choices - Do consumers care? Int. J. Consum. Stud. 2008, 32, 516–525. [Google Scholar] [CrossRef]
- Barnett, M.L.; Salomon, R.M. Beyond dichotomy: The curvilinear relationship between social responsibility and financial performance. Strat. Manag. J. 2006, 27, 1101–1122. [Google Scholar] [CrossRef]
- Chen, R.C.Y.; Lee, C.-H. The influence of CSR on firm value: An application of panel smooth transition regression on Taiwan. Appl. Econ. 2016, 49, 3422–3434. [Google Scholar] [CrossRef]
- Singh, A.; Sharma, P.K.; Malviya, R. Eco friendly pharmaceutical packaging material. World Appl. Sci. J. 2011, 14, 1703–1716. [Google Scholar]
- Ampuero, O.; Vila, N. Consumer perceptions of product packaging. J. Consum. Mark. 2006, 23, 100–112. [Google Scholar] [CrossRef]
- Keller, K.L. Conceptualizing, measuring, and managing customer-based brand equity. J. Mark. 1993, 57, 1–22. [Google Scholar] [CrossRef]
- Wyrwa, J.; Barska, A. Packaging as a Source of Information About Food Products. Procedia Eng. 2017, 182, 770–779. [Google Scholar] [CrossRef]
- Dharmadhikari, S. Eco-friendly packaging in supply chain. IUP J. Supply Chain. Manag. 2012, 9, 7–18. [Google Scholar]
- Li, Z.J. Influence of the Environmental Packaging on Low-Carbon Logistics. Appl. Mech. Mater. 2012, 200, 42–47. [Google Scholar] [CrossRef]
- Holdway, R.; Walker, D.; Hilton, M. Eco-design and successful packaging. Des. Manag. J. (Former Ser.) 2010, 13, 45–53. [Google Scholar] [CrossRef]
- Kim, S.; Seock, Y.-K. Impacts of health and environmental consciousness on young female consumers’ attitude towards and purchase of natural beauty products. Int. J. Consum. Stud. 2009, 33, 627–638. [Google Scholar] [CrossRef]
- Treviño, J. The Rise of Eco-Friendly Packaging in Cosmetics. 2019. Available online: https://www.adweek.com/brand-marketing/the-rise-of-eco-friendly-packaging-in-cosmetics/ (accessed on 28 October 2020).
- González-Benito, Ó.; Martos-Partal, M. Role of Retailer Positioning and Product Category on the Relationship Between Store Brand Consumption and Store Loyalty. J. Retail. 2012, 88, 236–249. [Google Scholar] [CrossRef]
- Koltko-Rivera, M.E. Rediscovering the later version of Maslow’s hierarchy of needs: Self-transcendence and opportunities for theory, research, and unification. Rev. Gen. Psychol. 2006, 10, 302–317. [Google Scholar] [CrossRef]
- Maslow, A.H. Toward a Psychology of Being; John: New York, NY, USA, 1968. [Google Scholar]
- Ajzen, I.; Madden, T.J. Prediction of goal-directed behavior: Attitudes, intentions, and perceived behavioral control. J. Exp. Soc. Psychol. 1986, 22, 453–474. [Google Scholar] [CrossRef]
- Choi, S.; Lee, S.; Friske, W. The Effects of Featured Advertising and Package Labeling on Sustainability of Cause-Related Marketing (CRM) Products. Sustainability 2018, 10, 3011. [Google Scholar] [CrossRef]
- Moser, A.K. Thinking green, buying green? Drivers of pro-environmental purchasing behavior. J. Consum. Mark. 2015, 32, 167–175. [Google Scholar] [CrossRef]
- McDaniel, S.W.; Rylander, D. Strategic green marketing. J. Consum. Mark. 1993, 10, 4–10. [Google Scholar] [CrossRef]
- Ottman, J.A. Green Marketing: Opportunity for Innovation; Lincolnwood: Chicago, IL, USA, 1998. [Google Scholar]
- Schwepker, J.C.H.; Cornwell, T.B. An Examination of Ecologically Concerned Consumers and Their Intention to Purchase Ecologically Packaged Products. J. Public Policy Mark. 1991, 10, 77–101. [Google Scholar] [CrossRef]
- Scott, L.; Vigar-Ellis, D. Consumer understanding, perceptions and behaviours with regard to environmentally friendly packaging in a developing nation. Int. J. Consum. Stud. 2014, 38, 642–649. [Google Scholar] [CrossRef]
- Gleim, M.R.; Smith, J.S.; Andrews, D.; Cronin, J.J. Against the Green: A Multi-method Examination of the Barriers to Green Consumption. J. Retail. 2013, 89, 44–61. [Google Scholar] [CrossRef]
- Telle, K. “It Pays to be Green”—A Premature Conclusion? Environ. Resour. Econ. 2006, 35, 195–220. [Google Scholar] [CrossRef]
- Pickett-Baker, J.; Ozaki, R. Pro-environmental products: Marketing influence on consumer purchase decision. J. Consum. Mark. 2008, 25, 281–293. [Google Scholar] [CrossRef]
- Klein, J.; Dawar, N. Corporate social responsibility and consumers’ attributions and brand evaluations in a product–harm crisis. Int. J. Res. Mark. 2004, 21, 203–217. [Google Scholar] [CrossRef]
- Anderson, J.R. A spreading activation theory of memory. J. Verbal Learn. Verbal Behav. 1983, 22, 261–295. [Google Scholar] [CrossRef]
- Trumpp, C.; Guenther, T.W. Too Little or too much? Exploring U-shaped Relationships between Corporate Environmental Performance and Corporate Financial Performance. Bus. Strat. Environ. 2017, 26, 49–68. [Google Scholar] [CrossRef]
- Kauppinen-Räisänen, H. Strategic Use of Colour in Brand Packaging. Packag. Technol. Sci. 2014, 27, 663–676. [Google Scholar] [CrossRef]
- Ailawadi, K.L.; Neslin, S.A.; Luan, Y.J.; Taylor, G.A. Does retailer CSR enhance behavioral loyalty? A case for benefit segmentation. Int. J. Res. Mark. 2014, 31, 156–167. [Google Scholar] [CrossRef]
- Sun, W.; Yao, S.; Govind, R. Reexamining Corporate Social Responsibility and Shareholder Value: The Inverted-U-Shaped Relationship and the Moderation of Marketing Capability. J. Bus. Ethic 2019, 160, 1001–1017. [Google Scholar] [CrossRef]
- Coalition, S.P. Definition of Sustainable Packaging. Available online: https://sustainablepackaging.org/wp-content/uploads/2017/09/Definition-of-Sustainable-Packaging.pdf (accessed on 30 September 2020).
- Aiken, L.S.; West, S.G.; Reno, R. Multiple Regression: Testing and Interpreting Interactions; Sage: London, UK, 1991. [Google Scholar]
- Swaminathan, V.; Reddy, S.K.; Dommer, S.L. Spillover Effects of Ingredient Branding Strategies on Brand Choice: A Field Study. SSRN Electron. J. 2012, 23, 237–251. [Google Scholar] [CrossRef]

Publisher’s Note: MDPI stays neutral with regard to jurisdictional claims in published maps and institutional affiliations. |
© 2020 by the authors. Licensee MDPI, Basel, Switzerland. This article is an open access article distributed under the terms and conditions of the Creative Commons Attribution (CC BY) license (http://creativecommons.org/licenses/by/4.0/).