Article

Decreasing Cropping Intensity Dominated the Negative Trend of Cropland Productivity in Southern China in 2000–2015

1
Institute of Geographic Sciences and Natural Resources Research, Chinese Academy of Sciences, Beijing 100101, China
2
University of Chinese Academy of Sciences, Beijing 100049, China
*
Author to whom correspondence should be addressed.
Sustainability 2020, 12(23), 10070; https://doi.org/10.3390/su122310070
Submission received: 24 October 2020 / Revised: 27 November 2020 / Accepted: 30 November 2020 / Published: 2 December 2020

Abstract

:
As the country with the highest food consumption in the world, China’s food security has been drawing global attention. The inter-annual variability of agricultural productivity and its predominant driving factors play important roles in food security and sustainable agricultural development. Here, we used gross primary productivity (GPP), which was simulated using the vegetation photosynthesis model (VPM), to quantify the spatial-temporal heterogeneity of cropland productivity from 2000 to 2015. The results showed that the cropland GPP significantly increased in northern China and markedly decreased in southern China. Socioeconomic and climatic factors jointly promoted a rise in GPP in the Northeast region, Inner Mongolia and Great Wall region, Huang-Huai-Hai region, and Loess Plateau region, with contribution rates of 93.6%, 67.9%, 73.8%, and 78.1%, respectively. The negative GPP trend in southern China was mainly attributed to the decreasing cropping intensity, with direct contributions of 54.1%, 53.9%, and 48.7% for the Yangtze River region, Southwest region, and South China region, respectively. Despite the decline in cropping intensity, the policies of Cang-liang-yu-di and Cang-liang-yu-ji can help in ensuring food security in China.

1. Introduction

Global agriculture is facing unprecedented challenges and risks: since the 1980s, yield growth rates have slowed [1,2] and even stagnated in many regions [3,4]. For China, the most populated country in the world, providing enough food to its 1.3 billion people has been an ongoing challenge, and food security has been one of the highest priorities [5,6]. The crop production of China has significantly improved in the past decades [7], and 12 years of consecutive increases were achieved between 2004 and 2015. Crop production is directly determined by the harvested area and yield [8]. Understanding the influencing factors of Chinese crop production is critical to future food policy. To date, few studies have quantified the relative contributions of socioeconomic factors and climate to the cropland productivity trend.
In order to increase agricultural productivity, the Chinese government has taken a series of policy measures (Table S1), such as eliminating agricultural tax [9,10], increasing agricultural subsidies (e.g., direct grain subsidy, machinery subsidy) [11], and raising agricultural commodity prices [7]. The above policies have greatly improved grain production, which increased by 1.9% from 1978 to 2014 [7], and it is widely accepted that agriculture management, technological changes, and agricultural inputs have significantly improved crop yield [12,13,14]. Additionally, harvested area is another important factor that affects total cropland productivity [8]. The unprecedented growth of the population and economy has led to a decrease in the area of cropland over the past decades [15,16]. Fortunately, cropping intensity, which refers to the cropping frequency in a given cropland area per year, provides another promising opportunity to boost crop production [17], and multiple cropping is an important component of Chinese farming practices, especially in southern China, where intensive cropping has been widely deployed [18]. In the past decades, multiple cropping has played an especially important role in ensuring the food security of China [19]. Research has shown that part of south China experienced a marked decrease in cropping intensity [20], although these regions have the largest potential to increase their harvested area and have a strong irrigation infrastructure [8]. The socioeconomic factors that affect cropland productivity vary at field, regional, and global scales [21]. The amount of change in cropland productivity due to socioeconomic factors is still unknown, especially on large scales.
Additionally, cropland productivity has also been affected by climatic change [14,22]. To ensure the sustainable promotion of grain yield and achieve food security, it is necessary to evaluate the productivity of Chinese cropland and the factors that influence Chinese cropland. Understanding the influences of recent policies and changes in climatic factors is important for sustainable development not only in China but also in the rest of the world.
Gross primary productivity (GPP) quantifies the total amount of CO2 fixed by plants through photosynthesis and is an important indicator for monitoring the productivity of vegetation [23,24]. Terrestrial ecosystem productivity cannot be directly measured at the regional scale [25]. Therefore, with the rapid development of satellite technology in the past decades, remote sensing-driven models have been widely used to estimate terrestrial productivity [26,27,28,29,30,31]. Among these models, the vegetation photosynthesis model (VPM), a typical light use model [32,33], has been extensively used. Recent studies have indicated that the VPM has a superior performance in site-level validations of agricultural ecosystems [34,35,36] and a satisfactory performance at regional and global scales [37,38,39].
Here, the VPM was applied to examine the spatial and temporal changes in cropland productivity in China from 2000 to 2015. The objectives were to quantify the relative contributions of socioeconomic and climate change factors to the current cropland productivity trend, and to discover efficient sustainable management strategies for China cropland. We hypothesized that decreasing cropping intensity has caused a decline in cropland productivity in southern China, while agriculture management, technological changes, agricultural inputs, and other factors have jointly promoted an overall upward trend in China’s cropland productivity and can help in ensuring food security in China.

2. Materials and Methods
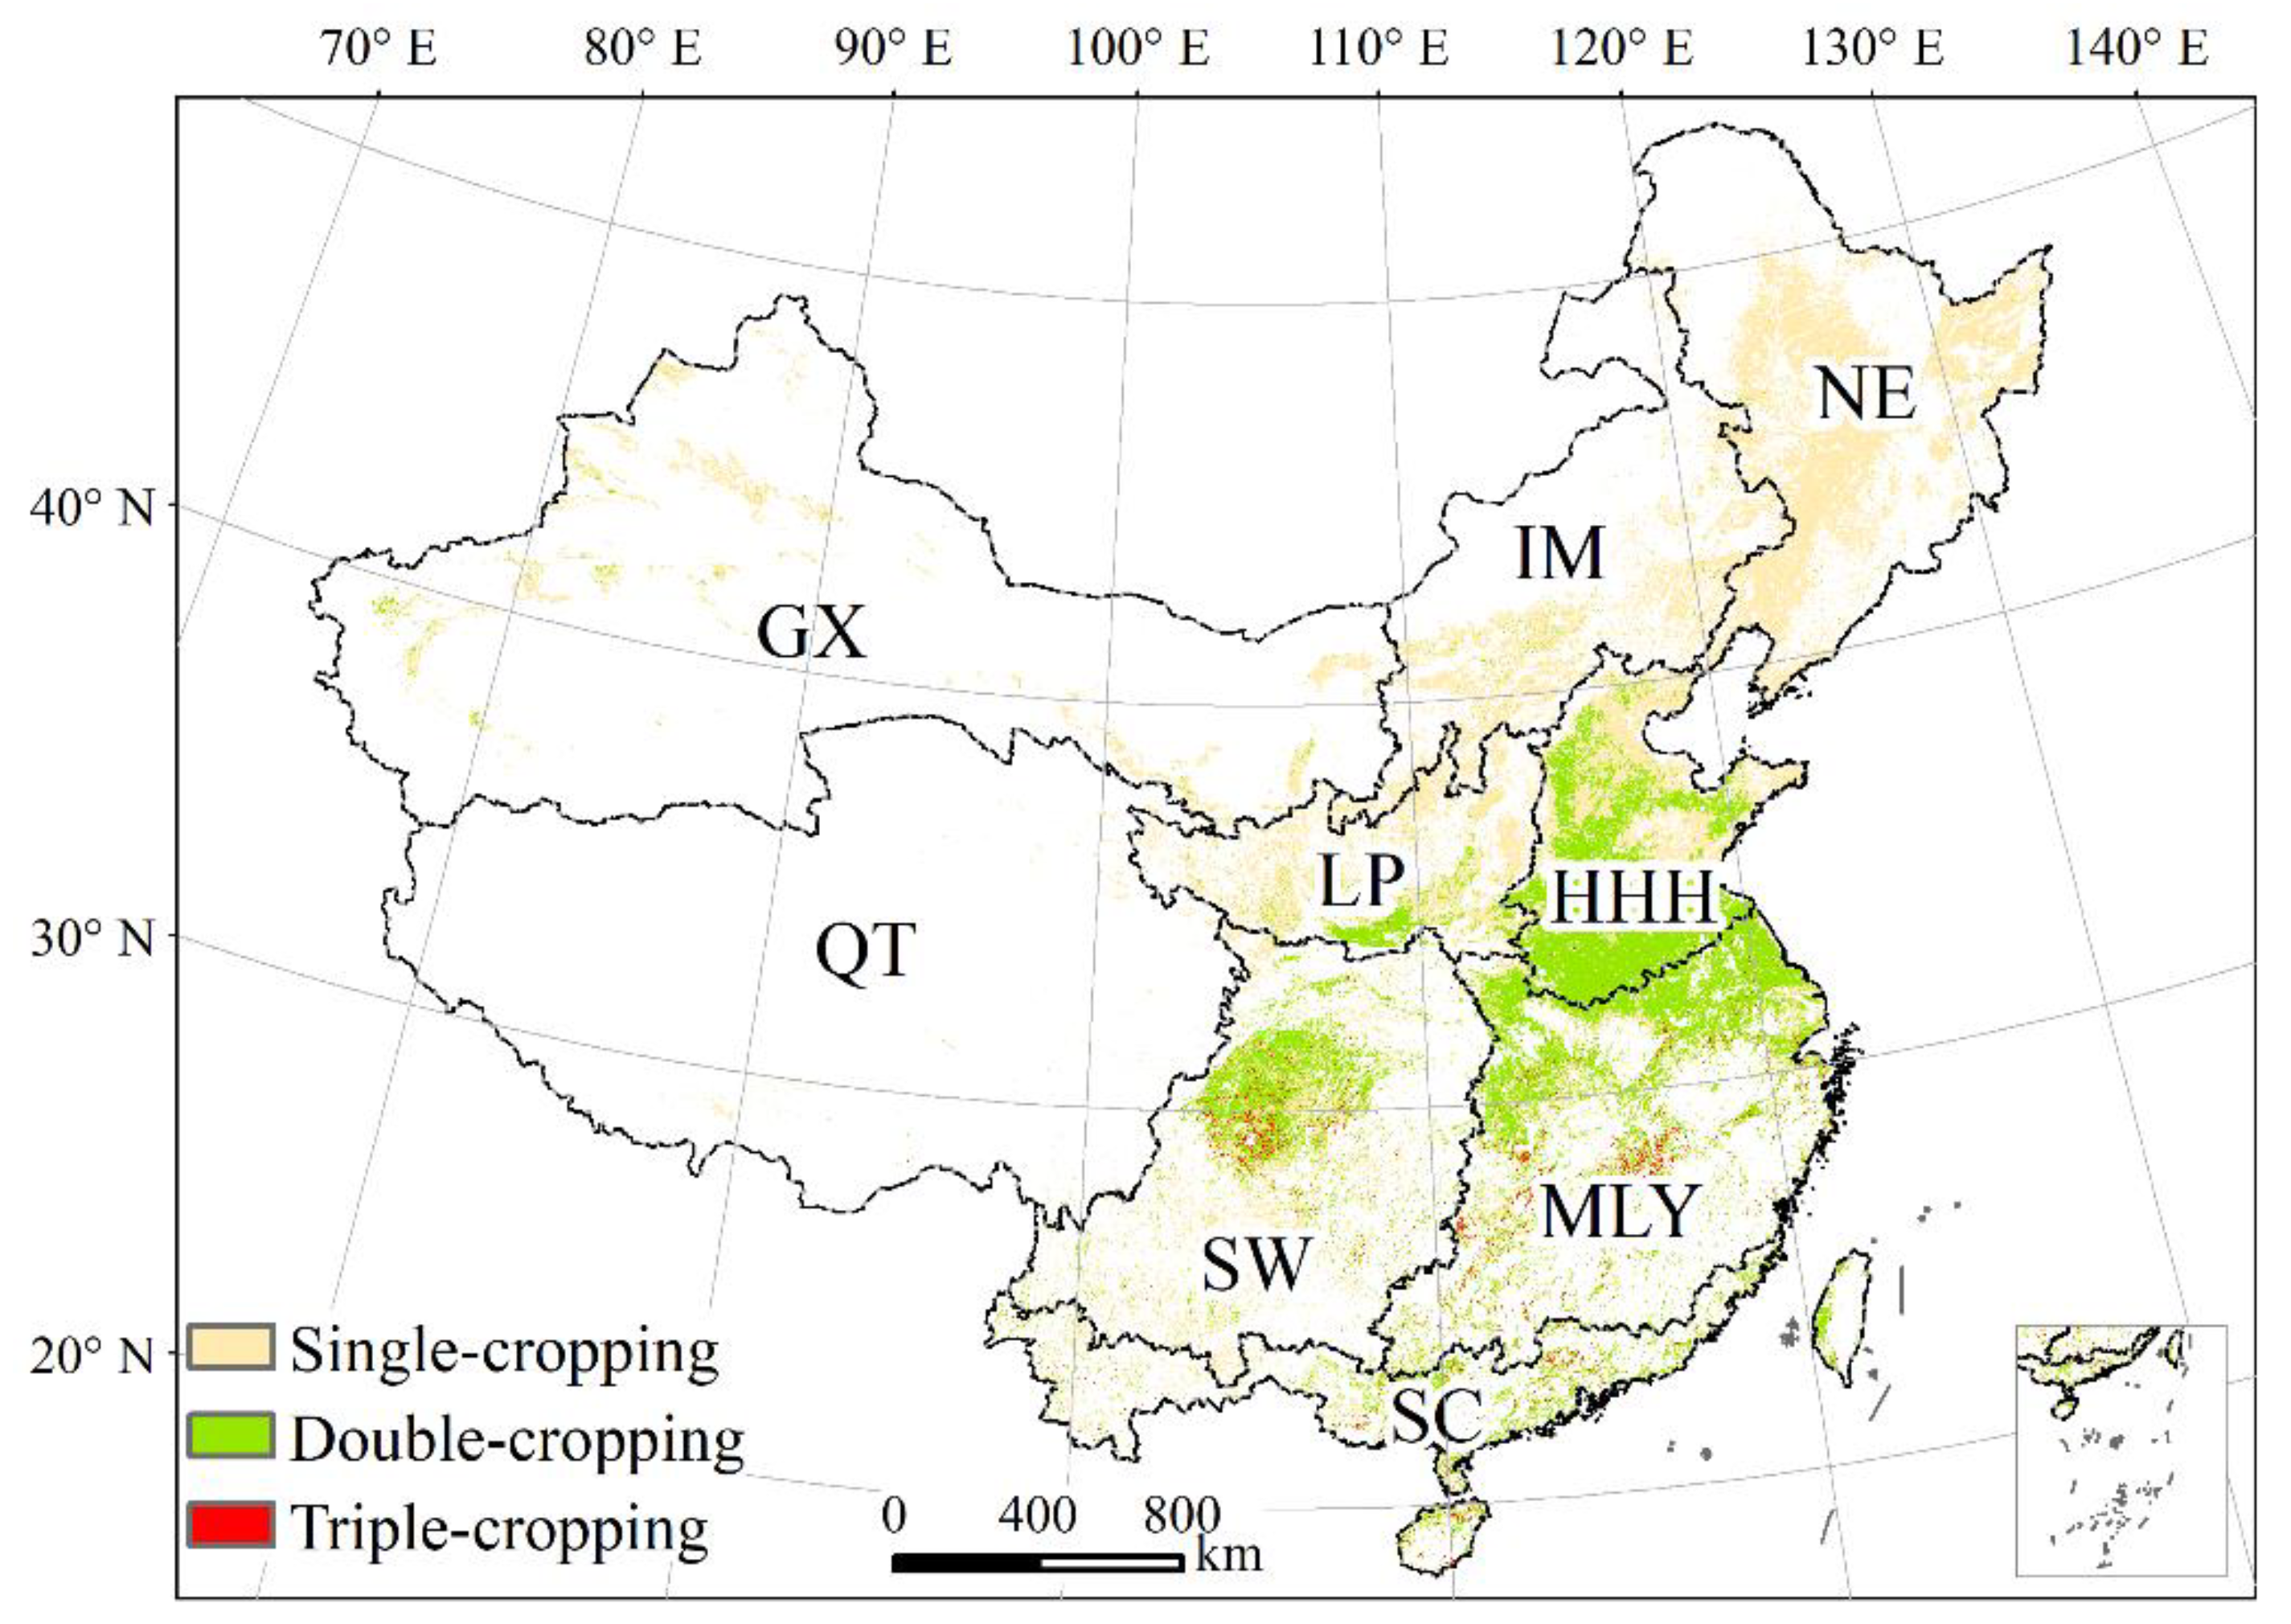
2.1. Study Area

This study focused on the cropland of the Chinese terrestrial ecosystem. The cropland data were extracted from China’s Land Use/Cover Dataset, which was developed by visual interpretation and digitalization at a spatial resolution of 1:10,000 based on Landsat TM/ETM data [40,41]. Using a map of the agricultural regions, we classified the country into nine areas (Figure 1). Table 1 showed the full name and abbreviations for each region. Cropland is mainly distributed in eastern China, MLY, HHH, NE, and SW regions totally accounted for more than 70% of the national whole cropland area.

2.2. Data

2.2.1. Cropping Intensity Data

The cropping intensity data were calculated from remote sensing enhanced vegetation index (EVI) data. Seasonal time-series EVI data can clearly reflect key crop phenology, including planting data, emergence data, and maturity data [42]. A rule-based algorithm was developed to identify and map the spatial distribution of cropping intensity in China using phenological data from in situ field observations and MODIS EVI time-series data [18]. The algorithm contained three procedures: smoothing the EVI time series, detecting the potential cropping cycle, and determining the appropriate peak values as the number of cropping cycles. The above algorithm was used to identify and generate the annual cropping intensity of China between 2000 and 2015 [20].

2.2.2. Agricultural Statistics Data

Annual statistics for effective irrigation area (IRR), consumption of fertilizers (FER), and quantity of agricultural machinery (MAC) were compiled from 2000 to 2015 using the National Bureau of Statistics of China (http://www.stats.gov.cn/tjsj/ndsj/). First, we determined the statistics of the IRR, FER, and MAC of each province, and then the IRR, FER, and MAC per unit area were calculated on the basis of the cropland area of each province.

2.2.3. Model Forcing Data

EVI and the land surface water index (LSWI) were used as input data for the satellite based VPM. Both were acquired from Moderate Resolution Imaging Spectroradiometer reflectance (MOD09A1 V05) product (http://ladsweb.nascom.nasa.gov/; the spatial resolution is 500 m, and the time resolution is 8 days). EVI was calculated from the red, blue, and near-infrared bands [43], while LSWI was calculated as the normalized difference between the near-infrared and short-infrared spectral bands [34,44].
The interpolated meteorological dataset (temperature and precipitation) was downloaded from the data resources service website of the Chinese Ecosystem Research Network (http://www.cnern.org.cn). The gridded meteorological data were generated from 1098 ground meteorological stations using ANUSPLIN Interpolation software [45].

2.3. Agricultural Productivity from the Satellite-Based Model

The VPM was built upon the conceptual partitioning of photosynthetically active vegetative parts and non-photosynthetically active vegetative parts. The latter has a significant effect on the fraction of photosynthetically active radiation at the canopy level [32]. The generated model can be defined as follows:
GPP = εg × FPARchl × PAR,
εg = ε0 × Tscalar × Wscalar × Pscalar,
where FPARchl is the fraction of photosynthetically active radiation (PAR) absorbed by leaf chlorophyll in the canopy and can be estimated as a linear function of the enhanced vegetation index (EVI) [34]; PAR is the photosynthetically active radiation (μmol photosynthetic photon flux density, PPFD); εg is the light use efficiency (μmol CO2/μmol PPFD); and ε0 is the maximum light use efficiency (μmol CO2/μmol PPFD). Here, we used the regression relationship between ε0 and the maximum EVI to determine the ε0 of each pixel [39]. Tscalar, Wscalar, and Pscalar are the scalars for the effects of temperature, water, and leaf phenology on the light use efficiency of vegetation, respectively [32,33]. To substantially improve the ability to model and evaluate the seasonal dynamics of productivity in intensified agricultural ecosystems, the modified VPM was used to identify the crop intensity (including crop calendar and multiple cropping) dynamics and assign appropriate light use efficiency to C3 and C4 crops [34].

2.4. Analysis Method

The temporal trend of total GPP was calculated by linear least square regression at the regional scale, and the same method was also used in each grid. To derive the relative importance of the influencing factors in determining the GPP trend, the Lindeman–Merenda–Gold (LMG) method was used to differentiate the contribution of different correlated regressors in a multiple linear regression model using R software version 3.6.1 with the package “relaimpo” [46]. The LMG method has been widely used in several previously published papers, including those in high-profile journals [47,48,49]. The method decomposes the coefficients of determination (R2) into non-negative contributions.

3. Results

3.1. Spatial Patterns of GPP in China’s Cropland

The spatial pattern of the mean annual GPP of China’s cropland for the period 2000–2015 is shown in Figure 2. Overall, the simulated GPP decreased in a gradient from southeast to northwest. At the regional level, the primary grain-producing areas of China, that is, HHH, MLY, NE, and SW, play important roles in the food security of China, with a total GPP value of 1750 Tg C year−1 (million tonnes C year−1, 530 Tg C year−1, 490 Tg C year−1, 390 Tg C year−1, and 350 Tg C year−1 for the HHH, MLY, NE, and SW regions, respectively) and account for 73.3% of the total GPP of the whole country (22.0%, 20.7%, 16.1%, and 14.5% for the HHH, MLY, NE, and SW regions, respectively). The HHH, MLY, NE, and SW regions also had higher average GPP, with values of 1540 g C m−2 year−1, 1410 g C m−2 year−1, 1270 g C m−2 year−1, and 1200 g C m−2 year−1, respectively. Warm temperature and abundant precipitation have favored vegetation growth in these areas. The LP, SC, IM, and GX regions had not only lower total GPP (ranging from 10 Tg C year−1 to 180 Tg C year−1) but also lower average GPP (ranging from 980 g C m−2 year−1 to 1110 g C m−2 year−1). Specifically, IM had the lowest average GPP (980 g C m−2 year−1), which can be primarily ascribed to a dry climate and relatively low temperature. In contrast, QT had the lowest total GPP, which accounted for 0.5% of the total GPP of the whole country (Figure 2).

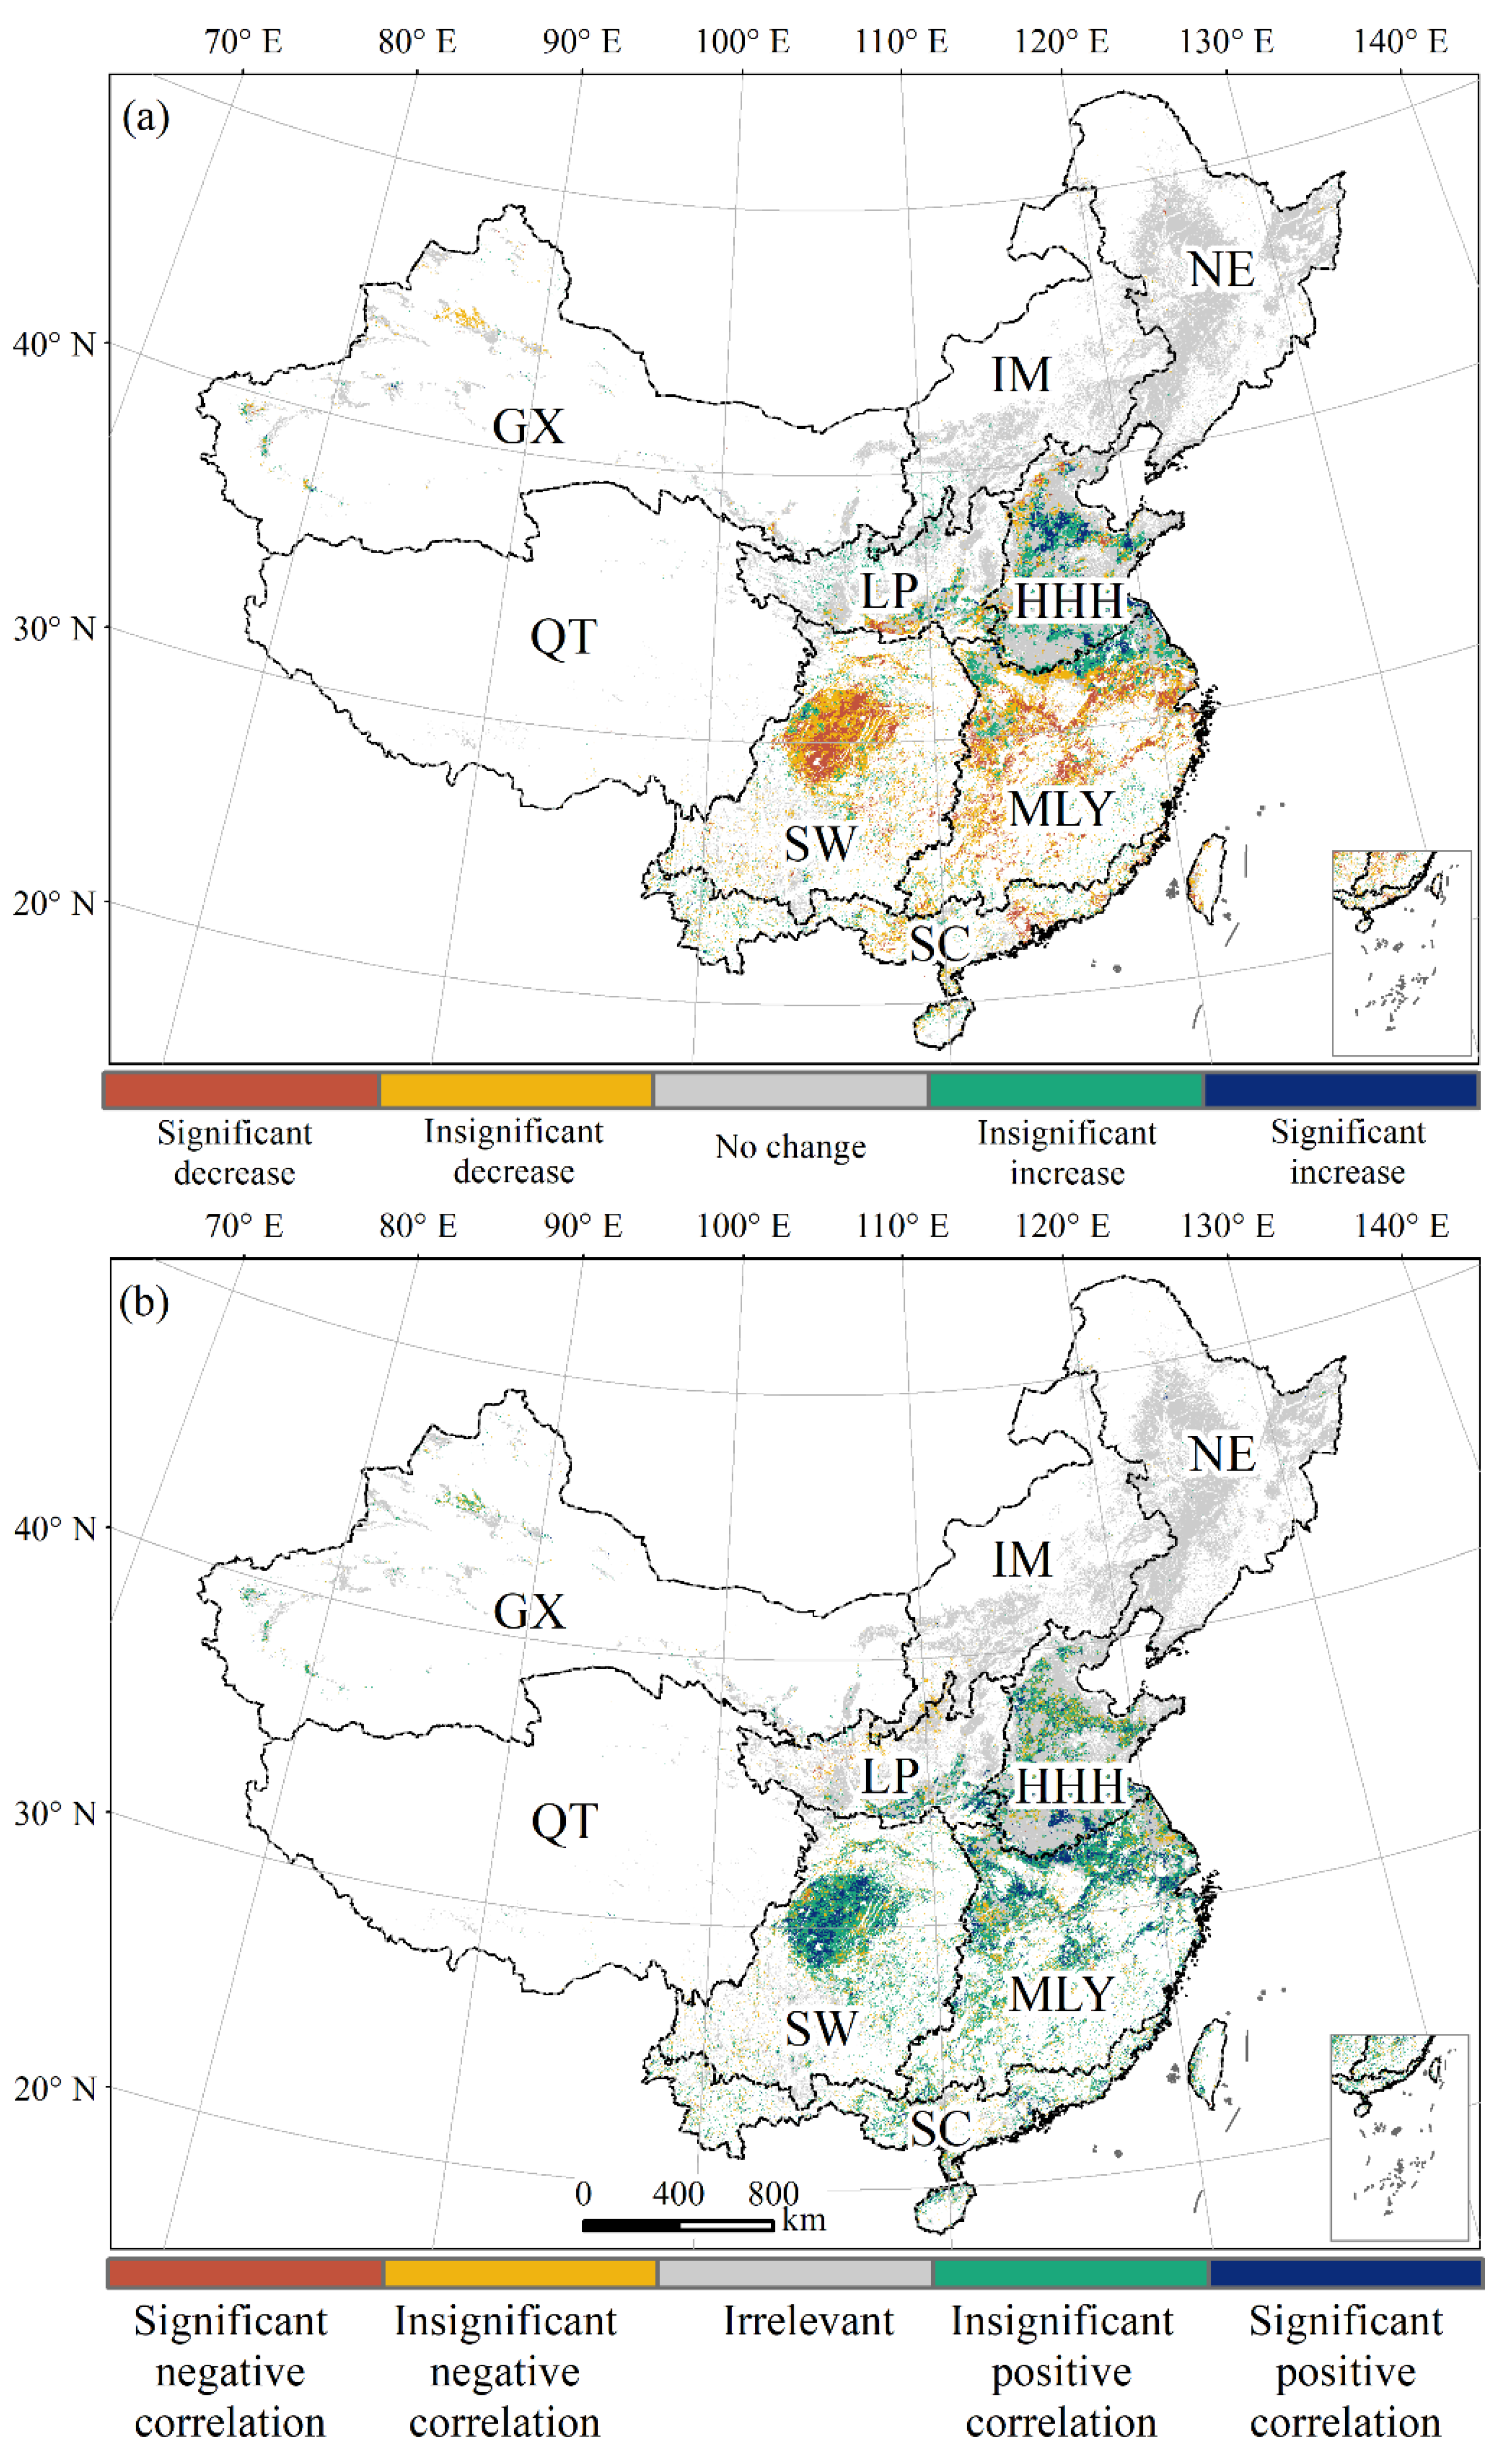
3.2. Annual GPP Trends

Total cropland GPP in China increased by 1.1 Tg C year−1 per year from 2000 to 2015. This change in cropland GPP differed by region (Figure 3a). The NE, IM, HHH, and LP regions had significantly increased GPP (p < 0.01). The largest increase in GPP was found in HHH, with an annual increase of 2.3 Tg C year−1, followed by NE (2.2 Tg C year−1), LP (1.8 Tg C year−1), and IM (1.0 Tg C year−1). After normalizing the trends by their mean annual GPP, LP showed the highest rate of increase at 1.0% per year, followed by IM (0.7%), NE (0.6%), and HHH (0.4%). In contrast, the MLY, SW, and SC regions experienced significant decreases in GPP (p < 0.05), with an annual decrease of 3.1 Tg C year−1, 2.3 Tg C year−1, and 1.1 Tg C year−1, respectively. No significant trends in cropland GPP were observed in the remaining regions.
The trend of GPP across the whole country presented a markedly heterogeneous geographical pattern (Figure 3b). Overall, GPP increased in northern China, while the trend was the opposite in southern China. In particular, about 58.5% of the total cropland had a positive GPP trend, and approximately 23.9% experienced a significant increase (p < 0.05), of which 71.0% was distributed in NE, HHH, and LP. About 14.9% had a significant (p < 0.05) decrease in GPP, of which approximately 79.8% was located in the MLY, SW, and SC regions.

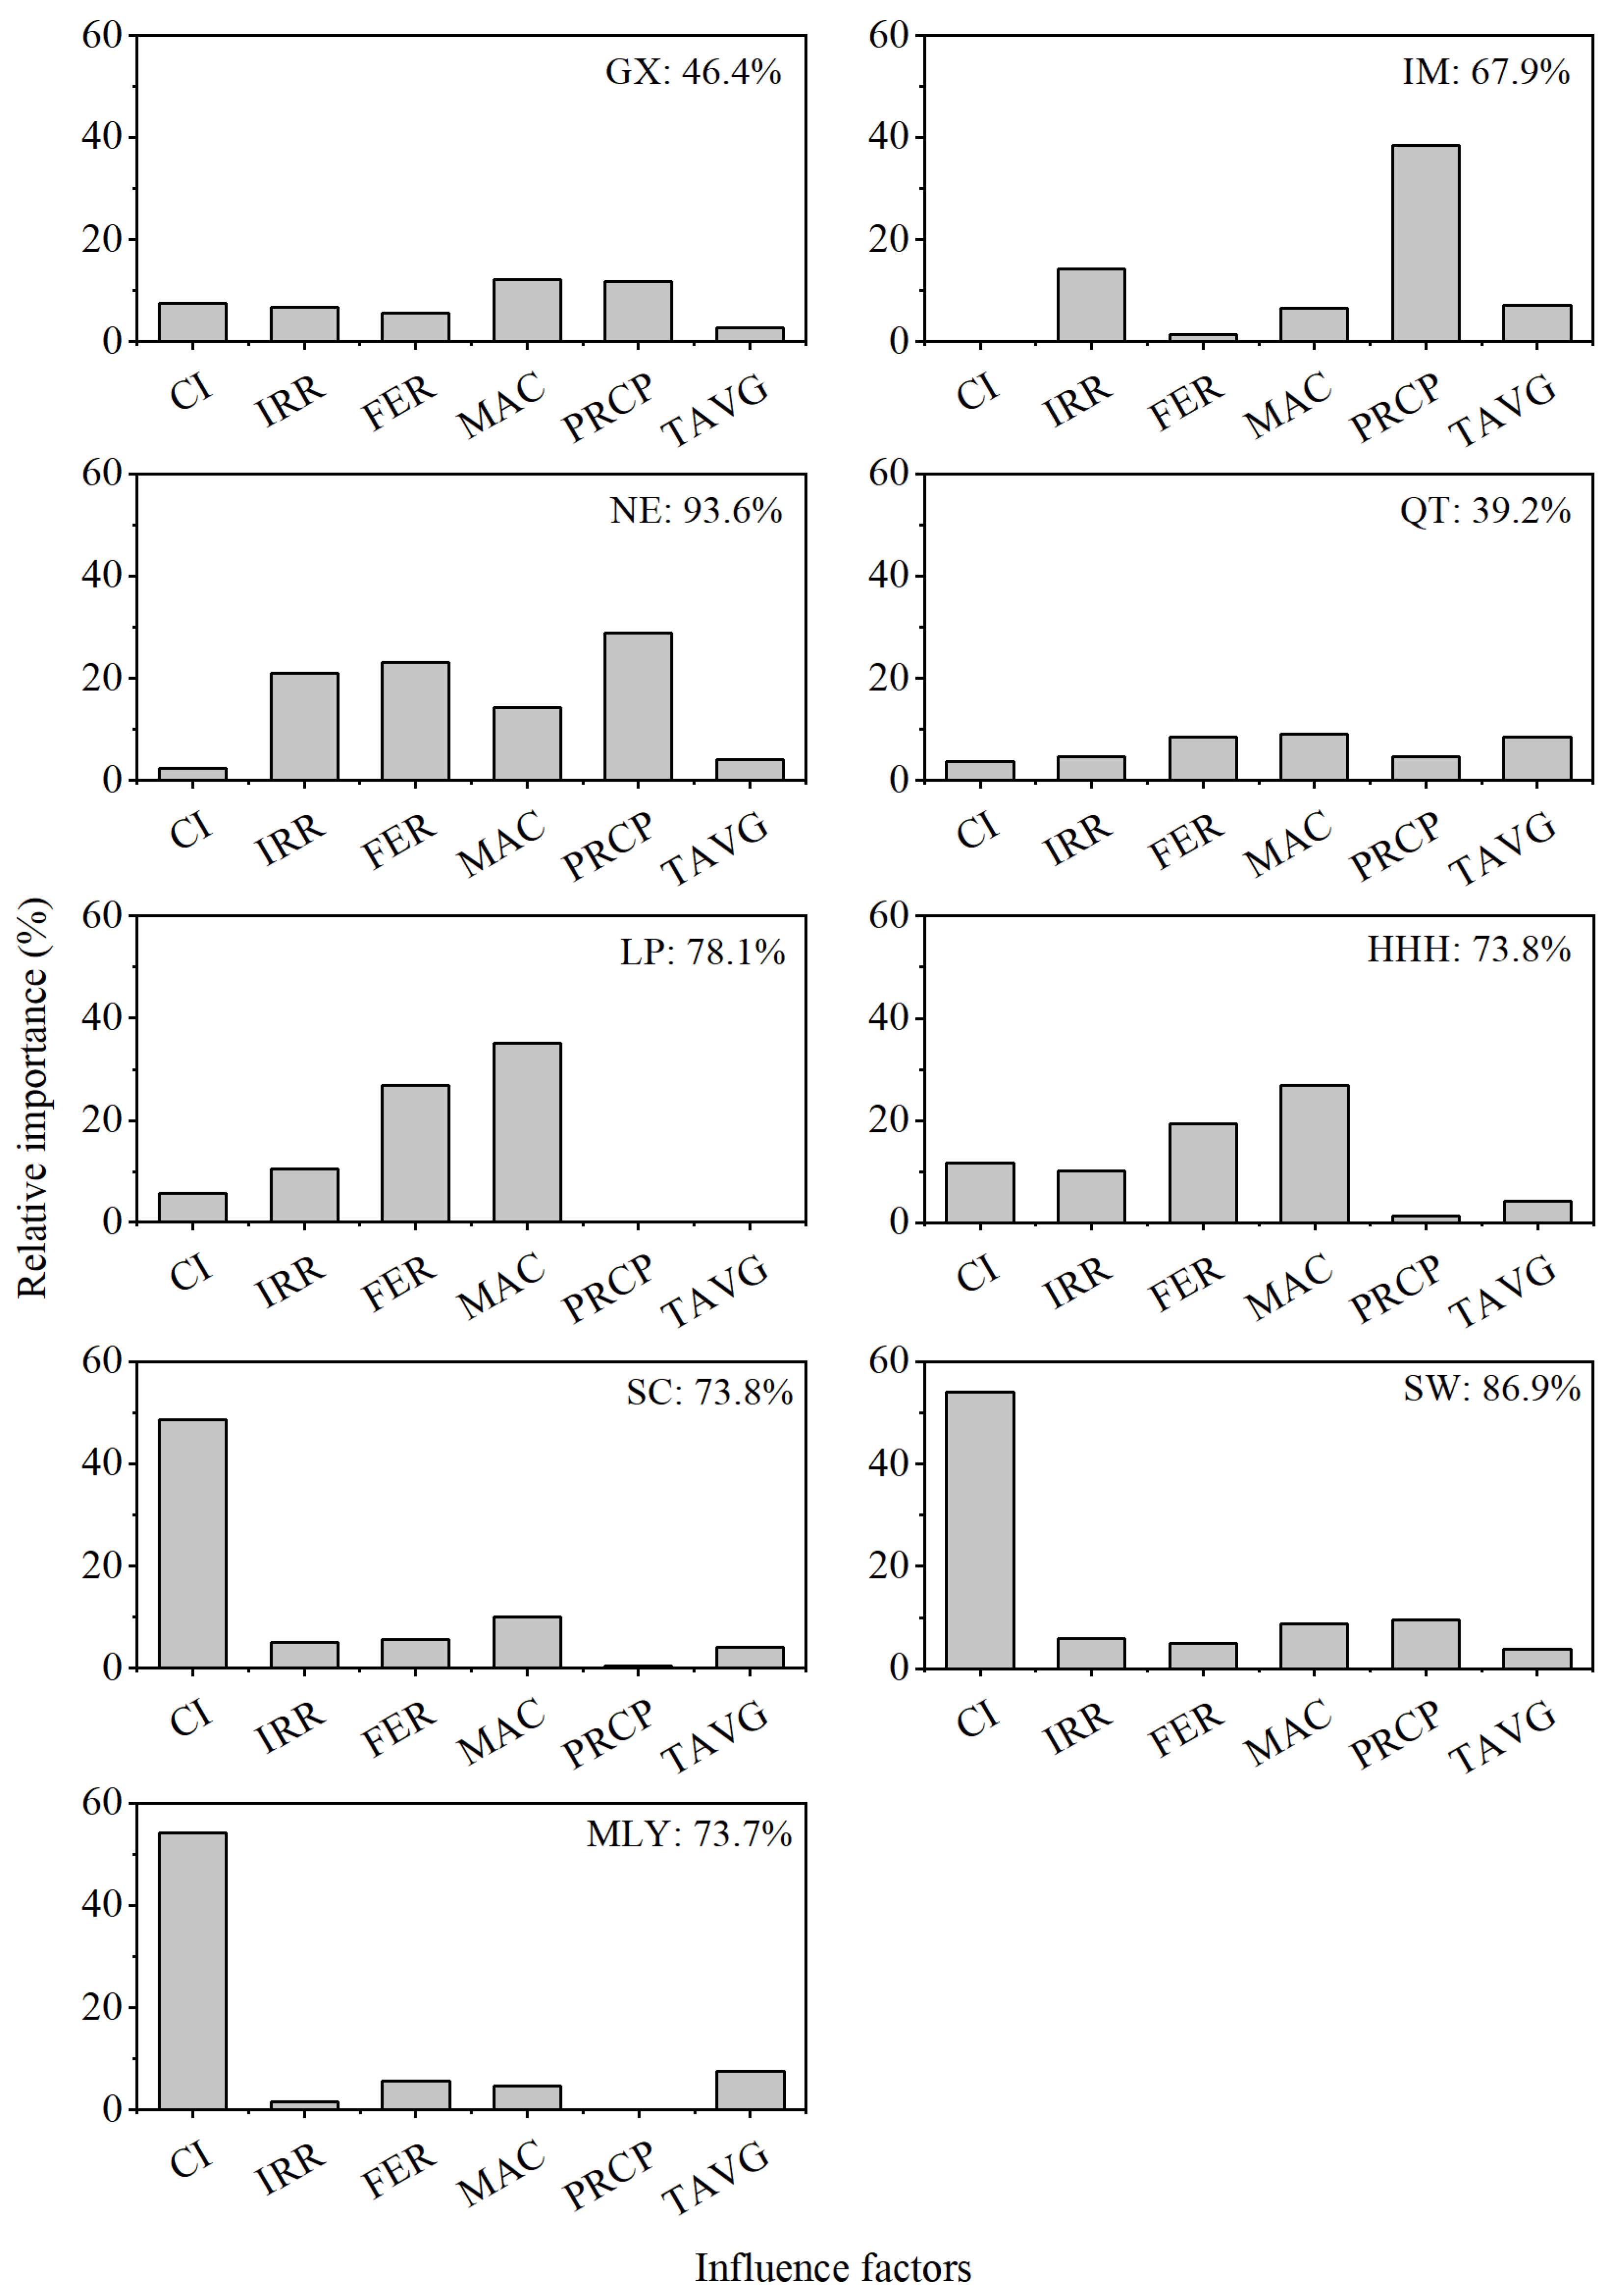
3.3. GPP Influencing Factors

We further examined the dominant climatic factors through the decomposition of regression coefficients when regressing GPP against cropping intensity, irrigation area, fertilizer consumption, quantity of agricultural machinery, and climate factors (annual mean temperature and annual cumulative precipitation). The interannual trends of these factors are listed in Supplemental Table S2. These factors were effective in explaining the trend of GPP, and their contribution rates were above 62.8%, except for GX (46.4%) and QT (39.2%).
The dominant drivers of the GPP trend varied widely across different regions (Figure 4). The increasing trend of GPP in northern China was primarily driven by increasing investment in agriculture and rising precipitation. For HHH, multiple influencing factors jointly promoted a rise in GPP. An increasing quantity of agricultural machinery was the largest contributor, explaining 26.9% of the GPP trend, followed by rising irrigation area (19.3%), fertilizer consumption (10.2%), and cropping intensity (11.7%). The results were relatively consistent in LP and NE. The GPP of NE and IM was also affected by precipitation, with contribution rates of 28.9% and 38.4%, respectively. The negative GPP trend in southern China was mainly attributed to the decreasing cropping intensity, while other factors had a relatively small impact. In the MLY, SW, and SC regions, the direct contribution rates of cropping intensity to the GPP trends were 54.1%, 53.9%, and 48.7%, respectively, indicating that decreasing cropping intensity is a predominant factor of changing GPP trends. Additionally, we further investigated the direct relationships between GPP and influencing factors for each region (Supplemental Table S3), and the results were consistent with the above data.
Additionally, the spatial patterns of the correlation coefficients between cropping intensity and annual cropland GPP are shown in Figure 5. About 87.9% of pixels showed a positive correlation (42.4% had a significant positive correlation, p < 0.05) between cropping intensity and GPP in southern China, which covered the MLY, SW, and SC regions. In contrast, about 86.5% of pixels showed decreasing trends (35.6% had significant decreasing trends, p < 0.05) of cropping intensity in southern China. The pixels revealed decreasing cropping intensity; cropping intensity and GPP were positively correlated and almost coincided, indicating that the decreasing cropping intensity was the main reason for the changes in GPP in these regions. In contrast, 8.7% of pixels showed significant positive correlations between cropping intensity and GPP, and almost all of them were distributed in HHH.

4. Discussion

Despite the country’s overall increasing trend of cropland GPP, a spatial pattern of “increasing in the north and decreasing in the south” was identified, which is consistent with changes in grain yield in China [50,51]. The increase in grain yield per unit area was the direct reason for the rise in cropland productivity in the north of China [52,53], which increased from 168.5 kg mu−1 (about 252.8 g m−2) in the 1980s to 316.5 kg mu−1 (about 474.8 g m−2) in 2007, primarily due to agriculture policy support and technological progress [20,53,54,55]. Since 2004, China has implemented agricultural subsidy programs, such as “Quality seed subsidy”, “Direct grain subsidy”, and “Machinery subsidy”. When domestic chemical fertilizer prices began to rise with international prices, China extended the subsidy program to include the “Aggregate input subsidy”, and the total growth of the four major subsidies continued [7]. In addition, we noted that the low- and medium-yield cropland in China was about two-thirds of the total cropland, and the grain yield was unstable and had large fluctuations between years [56]. To promote grain yield, China has launched construction projects for well-maintained farmland, which aimed to improve low- and middle-efficiency cropland and lead to the construction of 400 million mu high-standard farmland by 2020, of which about 70% is located in the main production areas of China (i.e., HHH, NE, and MLY) [57]. Researchers have further evaluated the effectiveness of the constructed high-standard farmland. The results showed that productivity in the project area has generally improved, especially in the north of China. In 35% of the project area, productivity increased by more than 100 kg mu−1 (about 150 g m−2) until 2017, and approximately 97% of it was located in NE, IM, and HHH [58], which is consistent with the regionally averaged results shown in Figure 3. In addition to human activities, climate change has also affected cropland productivity; because of the strengthening of the East Asian summer monsoon, precipitation increased in northern China [59], and the rising precipitation promoted an increase in cropland GPP in NE and IM, which have relatively dry climates and widely distributed rainfed farming.
Although the irrigation area, consumption of fertilizers, and quantity of agricultural machinery also significantly increased, the significant decrease in cropping intensity was a predominant factor in the decline in cropland GPP in southern China, covering MLY, SW, and SC. These regions experienced an increase in single-cropping area and a decrease in multiple-cropping area [20]. Urban expansion and the growth of out-migrant agricultural workers will lead to extensive farming [60]. In seeking maximum economic benefits at the household level, increases in the out-migrant population have caused declines in available farmworkers and continuous growth in labor costs for major crops [20]. The percentage of households in rural areas without farming activities markedly increased from less than 5% to 23% between 2000 and 2013 [61]. More provinces in southern China have become the main sources of migrant workers, which is consistent with the distribution of hotspots of declining cropping intensity [20]. Although there have been fewer farmworkers, landowners have preferred to retain their land for family farming [60], which accounted for 59% of the land transfer area [62], and this can lead to decreased cropping intensity [63]. Further contributing to the cost of productivity are rising rural labor wages, which annually increased by more than 8% after the mid-2000s [64,65], and increasing productivity costs can reduce enthusiasm for farming [66].
Although the cropland productivity in southern China has decreased, the food security of China is essentially stable because of the productivity increase in northern China [62]. The continuous increase in cropland productivity in northern China faces a series of challenges. Agricultural productivity in this region is highly reliant on irrigation, and the increase in irrigation area has led to the overdraft of groundwater and, therefore, falling groundwater tables and land degradation [67]. The intensification of agriculture has caused water tables to drop continuously at a rate of 0.5–2 m year−1 in the North China Plain, and this situation has become more serious with a decline in annual precipitation of 15% over the past decades [68]. This might lead to more serious environmental problems. Moreover, increasing cropland productivity also relies on the extensive use of fertilizers and pesticides, which have caused severe non-point pollution and soil degradation [69]. According to the national soil pollution report, about 19% of China’s agricultural soils have been polluted [70]. The above problems have reduced the sustainability of cropland productivity and food security [71,72], as well as ecosystems [73,74]. Therefore, a balance should be reached between cropland productivity and ecosystem services [20].
Fortunately, the Chinese government has recognized the resource constraints and challenges in sustainable development. China has been following a new agricultural development approach, that is, Cang-liang-yu-di (storage food in land) and Cang-liang-yu-ji (storage food in technology) [7]. Cang-liang-yu-di not only considers the current production, but also focuses on the production capacity in the long term. Cang-liang-yu-ji emphasizes the role of technology in food security. To achieve these goals, China aims to scale back the use of chemical fertilizer rather than promote its use to raise crop yields, as in the previous strategy. China plans to achieve “zero discharge” of agricultural waste by 2030. In addition, China strives to preliminarily curb the worsening of soil pollution by 2020 and to comprehensively improve the soil environment and quality by 2050 [21]. These measures are conducive to the sustainable development of China’s agriculture.
The main challenge in China’s agriculture has changed from a quantity deficiency to structural problems due to changes in cropland productivities [75]. Rice accounts for about 60% of residents’ ration consumption, and its proportions are gradually rising; however, paddy fields (rice planting area) in the south are falling sharply, and the total supply of rice will be restricted for a long time [76]. Therefore, China has committed to stabilizing the rice planting area based on the “National Structural Adjustment Plan for Planting Industry (2016–2020)”. The potential cropping intensity has increased as a result of climate warming in the past decades [77,78]. Therefore, if food security is threatened in the future, China can increase production by increasing cropping intensity in southern China.

5. Conclusions

In this study, we used a satellite-based light use efficiency model (VPM) to analyze the spatial and temporal patterns of cropland productivity and their influencing factors. The results showed that the inter-annual trend of gross primary productivity in China cropland markedly increased in northern China (i.e., NE, IM, HHH, and LP) and significantly decreased in southern China (i.e., MLY, SW, and SC). The increase in cropping intensity, irrigation area, fertilizer consumption, agricultural machinery, and precipitation have jointly contributed to the positive trend of cropland productivity in northern China, while decreasing cropping intensity directly contributed to the negative trend of GPP in southern China, explaining more than 50% of the observed change. Despite the decline in cropping intensity, the increasing potential cropping intensity can provide support for China’s future food security. Additionally, the Cang-liang-yu-di and Cang-liang-yu-ji policies can help to achieve the sustainable development of agriculture.

Supplementary Materials

The following are available online at https://www.mdpi.com/2071-1050/12/23/10070/s1: Table S1: Several major agricultural policies implemented in 2000–2015; Table S2: Interannual trends of socioeconomic and climatic factors for each region in 2000–2015; Table S3: Determination coefficient between GPP and influencing factors.

Author Contributions

Conceptualization, Z.N. and H.Y.; investigation, Z.N.; methodology, Z.N.; resources, H.Y.; supervision, H.Y.; writing—original draft, Z.N.; writing—review and editing, H.Y. and F.L. All authors have read and agreed to the published version of the manuscript.

Funding

This research was funded by the Strategic Priority Research Program of the Chinese Academy of Sciences (XDA19040301) and Establishment of National Ecological Environmental Accounting System (2110105).

Acknowledgments

We thank the National Ecosystem Science Data Center for providing climatic data, the National Bureau of Statistics of China for providing agricultural statistics data, and the Distributed Active Archive Center of the Oak Ridge National Laboratory and the Earth Observing System Data for providing MODIS products.

Conflicts of Interest

The authors declare no conflict of interest.

References

  1. Chen, X.; Cui, Z.; Fan, M.; Vitousek, P.; Zhao, M.; Ma, W.; Wang, Z.; Zhang, W.; Yan, X.; Yang, J.; et al. Producing more grain with lower environmental costs. Nature 2014, 514, 486–489. [Google Scholar] [CrossRef]
  2. Alston, J.M.; Beddow, J.M.; Pardey, P.G. Agricultural research, productivity, and food prices in the long run. Science 2009, 325, 1209–1210. [Google Scholar] [CrossRef]
  3. Grassini, P.; Eskridge, K.M.; Cassman, K.G. Distinguishing between yield advances and yield plateaus in historical crop production trends. Nat. Commun. 2013, 4, 2918. [Google Scholar] [CrossRef]
  4. Ray, D.; Ramankutty, N.; Mueller, N.; West, P.; Foley, J. Recent patterns of crop yield growth and stagnation. Nat. Commun. 2012, 3, 1293. [Google Scholar] [CrossRef] [Green Version]
  5. Cui, K.; Shoemaker, S.P. A look at food security in China. NPJ Sci. Food 2018, 2, 4. [Google Scholar] [CrossRef] [Green Version]
  6. Deng, N.Y.; Grassini, P.; Yang, H.S.; Huang, J.L.; Cassman, K.G.; Peng, S.B. Closing yield gaps for rice self-sufficiency in China. Nat. Commun. 2019, 10, 9. [Google Scholar] [CrossRef] [Green Version]
  7. Huang, J.K.; Yang, G.L. Understanding recent challenges and new food policy in China. Glob. Food Secur. Agric. Policy 2017, 12, 119–126. [Google Scholar] [CrossRef]
  8. Yu, Q.Y.; Wu, W.B.; You, L.Z.; Zhu, T.J.; van Vliet, J.; Verburg, P.H.; Liu, Z.H.; Li, Z.G.; Yang, P.; Zhou, Q.B.; et al. Assessing the harvested area gap in China. Agric. Syst. 2017, 153, 212–220. [Google Scholar] [CrossRef]
  9. Tao, R.; Qin, P. How has rural tax reform affected farmers and local governance in China? China World Econ. 2007, 15, 19–32. [Google Scholar] [CrossRef]
  10. Liu, M.X.; Xu, Z.G.; Su, F.B.; Tao, R. Rural tax reform and the extractive capacity of local state in China. China Econ. Rev. 2012, 23, 190–203. [Google Scholar] [CrossRef]
  11. Yi, F.J.; Sun, D.Q.; Zhou, Y.H. Grain subsidy, liquidity constraints and food security-Impact of the grain subsidy program on the grain-sown areas in China. Food Policy 2015, 50, 114–124. [Google Scholar] [CrossRef]
  12. Xiong, W.; Holman, I.; Lin, E.; Conway, D.; Li, Y.; Wu, W.B. Untangling relative contributions of recent climate and CO2 trends to national cereal production in China. Environ. Res. Lett. 2012, 7, 9. [Google Scholar] [CrossRef]
  13. Yu, Y.Q.; Huang, Y.; Zhang, W. Changes in rice yields in China since 1980 associated with cultivar improvement, climate and crop management. Field Crop. Res. 2012, 136, 65–75. [Google Scholar] [CrossRef]
  14. Hu, Y.N.; Fan, L.L.; Liu, Z.H.; Yu, Q.Y.; Liang, S.F.; Chen, S.; You, L.Z.; Wu, W.B.; Yang, P. Rice production and climate change in Northeast China: Evidence of adaptation through land use shifts. Environ. Res. Lett. 2019, 14, 9. [Google Scholar] [CrossRef]
  15. Deng, X.Z.; Huang, J.K.; Rozelle, S.; Uchida, E. Cultivated land conversion and potential agricultural productivity in China. Land Use Policy 2006, 23, 372–384. [Google Scholar] [CrossRef]
  16. He, J.H.; Liu, Y.L.; Yu, Y.; Tang, W.W.; Xiang, W.N.; Liu, D.F. A counterfactual scenario simulation approach for assessing the impact of farmland preservation policies on urban sprawl and food security in a major grain-producing area of China. Appl. Geogr. 2013, 37, 127–138. [Google Scholar] [CrossRef]
  17. Wu, W.B.; Yu, Q.Y.; You, L.Z.; Chen, K.; Tang, H.J.; Liu, J.G. Global cropping intensity gaps: Increasing food production without cropland expansion. Land Use Policy 2018, 76, 515–525. [Google Scholar] [CrossRef]
  18. Yan, H.M.; Xiao, X.M.; Huang, H.Q.; Liu, J.Y.; Chen, J.Q.; Bai, X.H. Multiple cropping intensity in China derived from agro-meteorological observations and MODIS data. Chin. Geogr. Sci. 2014, 24, 205–219. [Google Scholar] [CrossRef] [Green Version]
  19. Qiu, J.; Tang, H.; Frolking, S.; Boles, S.; Li, C.; Xiao, X.; Liu, J.; Zhuang, Y.; Qin, X. Mapping single-, double-, and triple-crop agriculture in China at 0.5 × 0.5 by combining county-scale census data with a remote sensing-derived land cover map. Geocarto Int. 2003, 18, 3–13. [Google Scholar] [CrossRef]
  20. Yan, H.M.; Liu, F.; Qin, Y.W.; Niu, Z.E.; Doughty, R.; Xiao, X.M. Tracking the spatio-temporal change of cropping intensity in China during 2000–2015. Environ. Res. Lett. 2018, in press. [Google Scholar] [CrossRef]
  21. You, L.Z.; Spoor, M.; Ulimwengu, J.; Zhang, S.M. Land use change and environmental stress of wheat, rice and corn production in China. China Econ. Rev. 2011, 22, 461–473. [Google Scholar] [CrossRef]
  22. Liu, L.L.; Wang, E.L.; Zhu, Y.; Tang, L. Contrasting effects of warming and autonomous breeding on single-rice productivity in China. Agric. Ecosyst. Environ. 2012, 149, 20–29. [Google Scholar] [CrossRef]
  23. Farquhar, G.D.; Caemmerer, S.V.; Berry, J.A. A biochemical model of photosynthetic CO2 assimilation in leaves of C3 species. Planta 1980, 1980, 78–90. [Google Scholar] [CrossRef] [Green Version]
  24. Running, S.W.; Coughlan, J.C. A general model of forest ecosystem processes for regional applications I. Hydrologic balance, canopy gas exchange and primary production processes. Ecol. Model. 1988, 42, 125–154. [Google Scholar] [CrossRef]
  25. Cramer, W.; Kicklighter, D.W.; Bondeau, A.; Iii, B.M.; Churkina, G.; Nemry, B.; Ruimy, A.; Schloss, A.L.; The Participants of the Potsdam NPP Model Intercomparison. Comparing global models of terrestrial net primary productivity (NPP): Overview and key results. Glob. Chang. Biol. 1999, 5, 1–15. [Google Scholar] [CrossRef]
  26. Nayak, R.K.; Patel, N.R.; Dadhwal, V.K. Estimation and analysis of terrestrial net primary productivity over India by remote-sensing-driven terrestrial biosphere model. Environ. Monit. Assess. 2010, 170, 195–213. [Google Scholar] [CrossRef]
  27. He, M.; Kimball, J.S.; Maneta, M.P.; Maxwell, B.D.; Moreno, A.; Beguería, S.; Wu, X. Regional crop gross primary productivity and yield estimation using fused landsat-MODIS data. Remote Sens. 2018, 10, 372. [Google Scholar] [CrossRef] [Green Version]
  28. Zhang, Y.L.; Song, C.H.; Sun, G.; Band, L.E.; McNulty, S.; Noormets, A.; Zhang, Q.F.; Zhang, Z.Q. Development of a coupled carbon and water model for estimating global gross primary productivity and evapotranspiration based on eddy flux and remote sensing data. Agric. Forest Meteorol. 2016, 223, 116–131. [Google Scholar] [CrossRef] [Green Version]
  29. Running, S.W.; Nemani, R.R.; Heinsch, F.A.; Zhao, M.S.; Reeves, M.; Hashimoto, H. A continuous satellite-derived measure of global terrestrial primary production. Bioscience 2004, 54, 547–560. [Google Scholar] [CrossRef]
  30. Tramontana, G.; Jung, M.; Schwalm, C.R.; Ichii, K.; Camps-Valls, G.; Raduly, B.; Reichstein, M.; Arain, M.A.; Cescatti, A.; Kiely, G.; et al. Predicting carbon dioxide and energy fluxes across global FLUXNET sites with regression algorithms. Biogeosciences 2016, 13, 4291–4313. [Google Scholar] [CrossRef] [Green Version]
  31. Pury, D.G.G.; Farquhar, G.D. Simple scaling of photosynthesis from leaves to canopies without the errors of big-leaf models. Plant Cell Environ. 1997, 20, 537–557. [Google Scholar] [CrossRef]
  32. Xiao, X.M.; Hollinger, D.; Aber, J.; Goltz, M.; Davidson, E.A.; Zhang, Q.Y.; Moore, B. Satellite-based modeling of gross primary production in an evergreen needleleaf forest. Remote Sens. Environ. 2004, 89, 519–534. [Google Scholar] [CrossRef]
  33. Xiao, X.M.; Zhang, Q.Y.; Braswell, B.; Urbanski, S.; Boles, S.; Wofsy, S.; Berrien, M.; Ojima, D. Modeling gross primary production of temperate deciduous broadleaf forest using satellite images and climate data. Remote Sens. Environ. 2004, 91, 256–270. [Google Scholar] [CrossRef]
  34. Yan, H.M.; Fu, Y.L.; Xiao, X.M.; Huang, H.Q.; He, H.L.; Ediger, L. Modeling gross primary productivity for winter wheat-maize double cropping System using MODIS time series and CO2 eddy flux tower data. Agr. Ecosyst. Environ. 2009, 129, 391–400. [Google Scholar] [CrossRef]
  35. Niu, Z.E.; Yan, H.; Chen, J.; Huang, M.; Wang, S. Comparison of crop gross primary productivity estimated with VPM model and MOD17 product in field ecosystem of China. Trans. Chin. Soc. Agric. Eng. 2016, 32, 191–198. [Google Scholar]
  36. Wang, Z.; Xiao, X.; Yan, X. Modeling gross primary production of maize cropland and degraded grassland in northeastern China. Agric. For. Meteorol. 2010, 150, 1160–1167. [Google Scholar] [CrossRef]
  37. Zhang, Y.; Xiao, X.M.; Jin, C.; Dong, J.W.; Zhou, S.; Wagle, P.; Joiner, J.; Guanter, L.; Zhang, Y.G.; Zhang, G.L.; et al. Consistency between sun-induced chlorophyll fluorescence and gross primary production of vegetation in North America. Remote Sens. Environ. 2016, 183, 154–169. [Google Scholar] [CrossRef] [Green Version]
  38. Zhang, Y.; Xiao, X.M.; Wu, X.C.; Zhou, S.; Zhang, G.L.; Qin, Y.W.; Dong, J.W. A global moderate resolution dataset of gross primary production of vegetation for 2000–2016. Sci. Data 2017, 4, 13. [Google Scholar] [CrossRef] [Green Version]
  39. Chen, J.; Yan, H.; Wang, S.; Gao, Y.; Huang, M.; Wang, J.; Xiao, X. Estimation of gross primary productivity in Chinese terrestrial ecosystems by using VPM model. Quat. Sci. 2014, 34, 732–742. [Google Scholar]
  40. Liu, J.Y.; Kuang, W.H.; Zhang, Z.X.; Xu, X.L.; Qin, Y.W.; Ning, J.; Zhou, W.C.; Zhang, S.W.; Li, R.D.; Yan, C.Z.; et al. Spatiotemporal characteristics, patterns, and causes of land-use changes in China since the late 1980s. J. Geogr. Sci. 2014, 24, 195–210. [Google Scholar] [CrossRef]
  41. Liu, J.Y.; Liu, M.L.; Tian, H.Q.; Zhuang, D.F.; Zhang, Z.X.; Zhang, W.; Tang, X.M.; Deng, X.Z. Spatial and temporal patterns of China’s cropland during 1990–2000: An analysis based on Landsat TM data. Remote Sens. Environ. 2005, 98, 442–456. [Google Scholar] [CrossRef]
  42. Sakamoto, T.; Yokozawa, M.; Toritani, H.; Shibayama, M.; Ishitsuka, N.; Ohno, H. A crop phenology detection method using time-series MODIS data. Remote Sens. Environ. 2005, 96, 366–374. [Google Scholar] [CrossRef]
  43. Huete, A.R.; Liu, H.Q.; Batchily, K.; vanLeeuwen, W. A comparison of vegetation indices global set of TM images for EOS-MODIS. Remote Sens. Environ. 1997, 59, 440–451. [Google Scholar] [CrossRef]
  44. Xiao, X.; Boles, S.; Frolking, S.; Salas, W.; Moore, B.; Li, C.; He, L.; Zhao, R. Observation of flooding and rice transplanting of paddy rice fields at the site to landscape scales in China using VEGETATION sensor data. Int. J. Remote Sens. 2002, 23, 3009–3022. [Google Scholar] [CrossRef]
  45. Wang, J.; Wang, J.; Ye, H.; Liu, Y.; He, H. An interpolated temperature and precipitation dataset at 1-km grid resolution in China (2000–2012). China Sci. Data 2017, 2, 88–95. [Google Scholar]
  46. Grömping, U. Estimators of relative importance in linear regression based on variance decomposition. Am. Stat. 2007, 61, 139–147. [Google Scholar] [CrossRef]
  47. Yao, Y.; Wang, X.; Li, Y.; Wang, T.; Shen, M.; Du, M.; He, H.; Li, Y.; Luo, W.; Ma, M.; et al. Spatiotemporal pattern of gross primary productivity and its covariation with climate in China over the last thirty years. Glob. Chang. Biol. 2018, 24, 184–196. [Google Scholar] [CrossRef]
  48. Musavi, T.; Migliavacca, M.; Reichstein, M.; Kattge, J.; Wirth, C.; Black, T.A.; Janssens, I.; Knohl, A.; Loustau, D.; Roupsard, O. Stand age and species richness dampen interannual variation of ecosystem-level photosynthetic capacity. Nat. Ecol. Evol. 2017, 1, 0048. [Google Scholar] [CrossRef] [Green Version]
  49. Carvalhais, N.; Forkel, M.; Khomik, M.; Bellarby, J.; Jung, M.; Migliavacca, M.; Saatchi, S.; Santoro, M.; Thurner, M.; Weber, U. Global covariation of carbon turnover times with climate in terrestrial ecosystems. Nature 2014, 514, 213–217. [Google Scholar] [CrossRef] [Green Version]
  50. Zhang, W.F.; Cao, G.X.; Li, X.L.; Zhang, H.Y.; Wang, C.; Liu, Q.Q.; Chen, X.P.; Cui, Z.L.; Shen, J.B.; Jiang, R.F.; et al. Closing yield gaps in China by empowering smallholder farmers. Nature 2016, 537, 671–674. [Google Scholar] [CrossRef]
  51. Ding, J.; Yang, K.; Ma, C.; Wen, Q. Spatial-temporal evolution of grain production in China. Arid. Land Geogr. 2017, 40, 1290–1297. [Google Scholar]
  52. Zhang, F.S.; Chen, X.P.; Vitousek, P. Chinese agriculture: An experiment for the world. Nature 2013, 497, 33–35. [Google Scholar] [CrossRef]
  53. Cheng, S.; Wang, S.; Liu, X.; Liu, X.; Wu, L. Food nutrition and food security of China in a new development phase. Chin. Sci. Bull. 2018, 63, 1764–1774. (In Chinese) [Google Scholar] [CrossRef]
  54. Huang, J.K.; Wang, X.B.; Rozelle, S. The subsidization of farming households in China’s agriculture. Food Policy 2013, 41, 124–132. [Google Scholar] [CrossRef]
  55. Li, Y.X.; Zhang, W.F.; Ma, L.; Huang, G.Q.; Oenema, O.; Zhang, F.S.; Dou, Z.X. An analysis of China’s fertilizer policies: Impacts on the industry, food security, and the environment. J. Environ. Qual. 2013, 42, 972–981. [Google Scholar] [CrossRef] [PubMed]
  56. Yan, H.M.; Ji, Y.Z.; Liu, J.Y.; Liu, F.; Hu, Y.F.; Kuang, W.H. Potential promoted productivity and spatial patterns of medium- and low-yield cropland land in China. J. Geogr. Sci. 2016, 26, 259–271. [Google Scholar] [CrossRef] [Green Version]
  57. National Development and Reform Commission. National Plan to Increase Production Capacity of 100 Billion Jin (2009–2020). Available online: http://www.gov.cn/gzdt/2009-11/03/content_1455493.htm (accessed on 30 November 2020).
  58. Institute of Geographic Sciences and Natural Resources Research, Chinese Academy of Sciences. Third-Phase Evaluation Report on the Construction of High-Standard Farmland for Comprehensive Agricultural Development in the 12th Five-Year Plan; Institute of Geographic Sciences and Natural Resources Research: Beijing, China, 2018. [Google Scholar]
  59. Piao, S.; Ciais, P.; Huang, Y.; Shen, Z.; Peng, S.; Li, J.; Zhou, L.; Liu, H.; Ma, Y.; Ding, Y.; et al. The impacts of climate change on water resources and agriculture in China. Nature 2010, 467, 43. [Google Scholar] [CrossRef]
  60. Xie, Y.; Jiang, Q.B. Land arrangements for rural-urban migrant workers in China: Findings from Jiangsu Province. Land Use Policy 2016, 50, 262–267. [Google Scholar] [CrossRef]
  61. Huang, J.K.; Ding, J.P. Institutional innovation and policy support to facilitate small-scale farming transformation in China. Agric. Econ. 2016, 47, 227–237. [Google Scholar] [CrossRef]
  62. Cheng, S.; Wang, S. Food security strategy and food supply-side reform for new development phase. Bull. Chin. Acad. Sci. 2017, 32, 1074–1082. [Google Scholar]
  63. Su, S.L.; Zhou, X.C.; Wan, C.; Li, Y.K.; Kong, W.H. Land use changes to cash crop plantations: Crop types, multilevel determinants and policy implications. Land Use Policy 2016, 50, 379–389. [Google Scholar] [CrossRef]
  64. Li, H.B.; Li, L.; Wu, B.Z.; Xiong, Y.Y. The end of cheap Chinese labor. J. Econ. Perspect. 2012, 26, 57–74. [Google Scholar] [CrossRef]
  65. Wang, X.B.; Huang, J.K.; Zhang, L.X.; Rozelle, S. The rise of migration and the fall of self employment in rural China’s labor market. China Econ. Rev. 2011, 22, 573–584. [Google Scholar] [CrossRef]
  66. Wang, X.B.; Yamauchi, F.; Otsuka, K.; Huang, J. Wage growth, landholding, and mechanization in chinese agriculture. World Dev. 2016, 86, 30–45. [Google Scholar] [CrossRef] [Green Version]
  67. Ministry of Water Resources. Monthly Groundwater Dynamics (May 2016). Available online: http://www.mwr.gov.cn/sj/tjgb/dxsdtyb/201612/t20161222_776144.html (accessed on 30 November 2020).
  68. McLaughlin, D.; Kinzelbach, W. Food security and sustainable resource management. Water Resour. Res. 2015, 51, 4966–4985. [Google Scholar] [CrossRef]
  69. Liu, X.J.; Zhang, Y.; Han, W.X.; Tang, A.H.; Shen, J.L.; Cui, Z.L.; Vitousek, P.; Erisman, J.W.; Goulding, K.; Christie, P.; et al. Enhanced nitrogen deposition over China. Nature 2013, 494, 459–462. [Google Scholar] [CrossRef]
  70. Ministry of Environmental Protection and Ministry of Land Resources. National Report on the Status of Soil Pollution. Available online: http://www.mee.gov.cn/gkml/sthjbgw/qt/201404/t20140417_270670.htm (accessed on 30 November 2020).
  71. Guo, J.H.; Liu, X.J.; Zhang, Y.; Shen, J.L.; Han, W.X.; Zhang, W.F.; Christie, P.; Goulding, K.W.T.; Vitousek, P.M.; Zhang, F.S. Significant acidification in major Chinese croplands. Science 2010, 327, 1008–1010. [Google Scholar] [CrossRef] [Green Version]
  72. Rodell, M.; Famiglietti, J.S.; Wiese, D.N.; Reager, J.T.; Beaudoing, H.K.; Landerer, F.W.; Lo, M.H. Emerging trends in global freshwater availability. Nature 2018, 557, 651–659. [Google Scholar] [CrossRef]
  73. Sanderson, E.W.; Jaiteh, M.; Levy, M.A.; Redford, K.H.; Wannebo, A.V.; Woolmer, G. The human footprint and the last of the wild. Bioscience 2002, 52, 891–904. [Google Scholar] [CrossRef]
  74. Foley, J.A.; DeFries, R.; Asner, G.P.; Barford, C.; Bonan, G.; Carpenter, S.R.; Chapin, F.S.; Coe, M.T.; Daily, G.C.; Gibbs, H.K.; et al. Global consequences of land use. Science 2005, 309, 570–574. [Google Scholar] [CrossRef] [Green Version]
  75. Central Committee of the Chinese Communist Party and State Council of the People’s Republic of China. Several Opinions on Deepening the Structural Reform of Agricultural Supply Side and Accelerating the Cultivation of New Kinetic Energy of Agricultural and Rural Development. Available online: http://www.gov.cn/zhengce/2017-02/05/content_5165626.htm (accessed on 30 November 2020).
  76. National Development and Reform Commission. Medium- and Long-Term Planning Outline for National Food Security (2008–2020). Available online: http://www.gov.cn/jrzg/2008-11/13/content_1148372.htm (accessed on 30 November 2020).
  77. Liu, L.; Xu, X.L.; Zhuang, D.F.; Chen, X.; Li, S. Changes in the potential multiple cropping system in response to climate change in china from 1960–2010. PLoS ONE 2013, 8, 12. [Google Scholar] [CrossRef]
  78. Zhang, G.L.; Dong, J.W.; Zhou, C.P.; Xu, X.L.; Wang, M.; Ouyang, H.; Xiao, X.M. Increasing cropping intensity in response to climate Warming in Tibetan Plateau, China. Field Crop. Res. 2013, 142, 36–46. [Google Scholar] [CrossRef]
Figure 1. Spatial distribution of the cropland area in China. The base map is the spatial distribution of cropping intensity. The agricultural division is from the comprehensive agricultural zoning map, and agricultural regions include the Northeast region (NE), Inner Mongolia and Great Wall region (IM), Gan-xin region (GX), Huang-Huai-Hai region (HHH), Loess Plateau region (LP), Qinghai-Tibet region (QT), Middle and Lower Reaches of Yangtze River region (MLY), Southwest region (SW), and South China (SC).
Sustainability 12 10070 g001
Figure 2. Spatial distribution of mean GPP in the cropland of China from 2000 to 2015. The insert map shows the average annual GPP and total GPP for each region.
Sustainability 12 10070 g002
Figure 3. (a) Interannual trends of total GPP for each region; (b) the spatial distribution of annual cropland GPP trends from 2000 to 2015; (c) the spatial distribution of the significant increases or decreases in GPP at a significant level of 0.05.
Sustainability 12 10070 g003
Figure 4. The relative importance of the influencing factors in determining the GPP trend. CI = cropping intensity; IRR = irrigation area; FER = consumption of fertilizers; MAC = quantity of agricultural machinery; TAVG = annual mean temperature; PRCP = annual cumulative precipitation. The numbers in the upper right corner of each graph indicate the degree to which all factors explain GPP trends.
Sustainability 12 10070 g004
Figure 5. Spatial distribution of (a) trends in cropping intensity and (b) the correlation coefficients between cropping intensity and annual cropland GPP from 2000 to 2015.
Sustainability 12 10070 g005
Table 1. Regions of the Chinese cropland ecosystem.
IDRegionAbbreviationsPercentage of the Whole Cropland Area (%)
1Middle and Lower Reaches of Yangtze River regionMLY19.2
2Huang-Huai-Hai regionHHH19.0
3Northeast regionNE17.7
4Southwest regionSW14.8
5Loess Plateau regionLP9.0
6Inner Mongolia and Great Wall regionIM8.4
7South China regionSC6.2
8Gan-xin regionGX5.0
9Qinghai-Tibet regionQT0.7
Publisher’s Note: MDPI stays neutral with regard to jurisdictional claims in published maps and institutional affiliations.

