Article

A Sustainable Evaluation Processes for Investments in the Transport Sector: A Combined Multi-Criteria and Cost–Benefit Analysis for a New Highway in Italy

1
Department of Civil, Construction and Environmental Engineering, University of Naples “Federico II”, 80125 Napoli, Italy
2
Department of Engineering, University of Campania “Luigi Vanvitelli”, 81031 Aversa, Italy
*
Author to whom correspondence should be addressed.
Sustainability 2020, 12(23), 9854; https://doi.org/10.3390/su12239854
Submission received: 12 October 2020 / Revised: 15 November 2020 / Accepted: 22 November 2020 / Published: 25 November 2020

Abstract

:
In the transport sector, a rational and shared planning process is commonly based on the comparison of different design alternatives through quantitative evaluations and stakeholders’ engagement. Among the most adopted evaluation methods, there are cost–benefit analysis (CBA) and multi-criteria analysis (MCA). Both these methods have strengths and weaknesses, which do not allow the conclusion that one technique is dominant over the other. Starting from these considerations, the aim of this paper is to propose a sustainable evaluation process for investments in the transport sector, based on the combined use of both CBA and MCA analysis and a stakeholders’ engagement. The proposed evaluation method was also applied to a real case study: the decision-making process for a new highway in a high naturalistic and touristic area in north of Italy. Furthermore, a “weighted criteria process definition” based on the Delphi method was also performed within a public engagement process. Research results show that the application of both the evaluation analyses (CBA and MCA) allows the selection of the most rational althernative from a sustainable, shared and technical point of view. Precisely, the estimations performed underline that the CBA analysis significantly underestimated the non-users’ benefits, while the opposite occurred for the MCA analysis. The incidence of the non-users’ benefits is only the 14% of the total for the CBA, while it reaches more than the 79% for the MCA. This result is very relevant underling how, for a decision-making processes aimed in comparing different design alternatives for which non-users impacts are expected as relevant against the users ones, the unique application of the most consolidated CBA analyses are not always adequate, while the joint use of the two evaluation methods ensures robust and rational choices for a sustainable development.

1. Introduction

The decision-making process involving the transport system does not always lead to rational choices. Indeed, in literature exists a phenomenon well-known as “planning fallacy” [1], in which the transport planners are brought to underestimate investment costs and/or overestimate the potential benefits produced by a new intervention/investment. To reduce the planning fallacy risk, it is necessary to:
  • Standardize the procedures followed by decision-makers (e.g., through specific guidelines or regulations);
  • Estimate the effects of a new intervention/investment through consolidated quantitative methods, also by introducing prudential hypothesis to avoid benefit overestimation;
  • Enlarge consensus to reach shared choices with all the stakeholders. Indeed, shared decision-making reduces the risk of planning failure and often reduces (or does not increase) the infrastructure realization time, which have a significant impact, for example, on the investment cost.
Recently, the Italian government approved the “Guidelines for assessment of Investment Projects” that, jointly with the EU guidelines [2], defines the methodologies to develop both ex-ante and ex-post evaluation analyses. Quantitative techniques are commonly used for these evaluations [2,3,4] and the Italian guidelines suggest applying both cost–benefit analyses (CBA) and multi-criteria analyses (MCA) for a rational decision-making process. These evaluation methods are commonly applied in the transport sector (e.g., [5,6]), and have different strengths, weaknesses, and application fields (e.g., [7,8,9,10,11,12]), and for these reasons there is no unique technique that dominates the others (for details see Section 2), but often several techniques are applied jointly in a rational approach aimed at reducing the weakness of the overall analysis.
Starting from this consideration, the aim of this paper is to propose a sustainable evaluation process for investments in the transport sector based on the combined use of both CBA and MCA analysis and stakeholders’ engagement. The proposed evaluation method was also applied to a real case study: the decision-making process for a new highway in a high naturalistic and touristic area in the north of Italy. Furthermore, a “weighted criteria process definition” based on the Delphi method was also performed within a public engagement process developed for the case study considered. The evaluation process could be considered as sustainable, because allow to choose the most economically viable solution and the choice of the best solution, aimed at reducing environmental impacts, is shared with the main stakeholders (social sustainability).
The case study consists in the design (choice) of a new highway in a high naturalistic and touristic area. Different design scenarios were defined and compared to choose the best solution to implement from a sustainable perspective. Precisely, the sustainable decision-making process proposed allows the investigation: (i) of how reliable the cost–benefit analysis (CBA) is, as the unique evaluation method to compare different infrastructure options within a naturalistic/touristic case study, (ii) when and how it would be better to combine (and not replace) the CBA with more environmentally friendly analyses (e.g., MCA).
Furthermore, to perform these aims, an ad-hoc macro-economic travel demand trend model was also estimated to better quantify the (future) transport users potentially interested in the new road infrastructure, in the function of the expected (estimated) trend of the main socio-economic and economic variables (e.g., GDP, population, fuel/gasoline price, highway toll).
The paper is structured as follows: Section 2 reports a literature review of the main quantitative evaluation methods commonly applied in transport sector applications; Section 3 describes the proposed evaluation methodology; Section 4 discusses the case study, the traffic demand estimation and the estimation results. Section 5 reports the main results of the analyses performed. Finally, in Section 6, the conclusions of the study are discussed.

2. Literature Review

In the literature, several quantitative methods have been proposed to compare public investments and assess rational choices [13]. Many authors have proposed optimization approaches for better development of the transport system [14,15,16,17]. For the application case study of Italy, many evaluation methods are suggested to compare (and choose) different transport investments (e.g., [14]), which include: risk analysis, risk assessment, analysis of cost assessment, cost-effectiveness analysis (ACE), Standard Cost Model, multi-criteria analysis (MCA) and cost–benefit analysis (CBA). The reason why many techniques are commonly applied is related to the fact that each one has its strengths and weaknesses and therefore it is not possible to identify a unique method that is better than the others.
Risk analysis consists of identification, estimation and control of a risk that may affect the implementation and the construction of the project [18]. With this approach, it is possible to identify the “critical variables” to be taken into account during the design and construction phase of a project but it does not evaluate whether it is useful or not to the realization of the project/intervention. For example, for the case study of the road infrastructure development in Papua, five main risks that could compromise the time of realization of the road have been identified: (i) uncertain weather, (ii) material damage due to the transportation process, (iii) the dismantling of storage, (iv) the low quality of materials, the lack of expertise (v) the risk of political instability in the area [19]. Risk analysis is an important tool to develop policies to prevent accidents and develop mitigative measures [20]. This analysis has been especially used in climate adaptation practice [21] to evaluate the environmental risk of mobility policies and in some case investigate the effects of climate change on transportation infrastructure [22]. In recent years, an increase in uncertainty linked to the economic development of territories and technological development has given importance to risk analysis. Enhanced risk analysis tools provide improved knowledge for the decision-making process and performance effect. One such risk analysis method is known as Monte Carlo. The Monte Carlo method is especially useful in evaluating which of several uncertain quantities most significantly contributes to the overall risk of the project [23]. In the literature, there are several applications in the transport sector of risk analysis and the Monte Carlo method. De Almeida Guimarães et al. [24] have applied the Monte Carlo simulation (MCS) to economic, social, and environmental indicators to evaluate the performance of passenger transport alternatives between the cities of Niterói and Rio de Janeiro. Salling and Leleur [25], through a combination of quantitative risk analysis based on the Monte Carlo simulation and the principle of optimism bias, have proposed a new way of managing the uncertainties present in transport decisions.
Lemp and Kockelman [26] have highlighted in their research the uncertainty in traffic forecasts (overestimation of traffic volumes) and in revenue for highway projects, supporting that one way to deal with the uncertainty of forecasts is the Monte Carlo simulation, as it can provide probability distributions of future traffic and revenue.
In cost assessment analysis, all costs (e.g., direct costs according to the realization of the project and external costs including environmental and health costs associated with a decision) are estimated [27]. This evaluation method can be useful to choose the alternative that minimizes costs, once having defined the intervention to be carried out. For example, in Malnaca et al. [28], the total cost of ownership model is utilized to estimate the economic viability of a technological solution to convert a diesel bus into an electric bus, in Itho [29], an analysis on the cost and CO2 emissions impact in function of substituting functional characteristics of the drivetrain of the vehicle, was carried out.
The cost-effectiveness analysis (ACE) evaluates the effectiveness of an intervention compared to its cost [30]. In ACE, the impacts produced from the project are not monetized, they are only evaluated and/or estimated. In the ACE, only a qualitative comparison between the costs and effectiveness of different design solutions is possible. Some applications of the ACE in the transport sector are: in Milan, the ACE analysis was implemented to evaluate the effectiveness of the road charge policy [31]; Geske et al. described, through ACE, the optimization of vessel size compared to the CO2 emission [32]; Geng et al. [33], through cost-effectiveness analysis (ACE), studied the co-benefits of bus and taxi vehicle selection in Shenyang city and have identified the opportunity to reduce CO2 emissions and air pollution; Shafie et al. [34] implemented a cost-effectiveness analysis to assess different incentives for low or zero-emission vehicles to evaluate deep reductions in greenhouse gas emissions in New Zealand.
The Standard Cost Model aims at identifying and measuring the administrative burdens of businesses [35]. For this reason, it is not used to evaluate public utility projects.
In the transport sector, the most used evaluation methods to make rational choices are CBA and MCA.
Regarding CBA, it can be considered as a more standardized and less discretionary procedure (e.g., application of the national and/or the EU guidelines), commonly considered a “solid” evaluation method. This circumstance means that the cost–benefit analysis is in practice more widely used in decision-making processes especially those referring to public transport investments [36]. Indeed, the main CBA application fields refer to economic and financial viability analysis of an infrastructural investment, in the case of public private partnership or transport infrastructures in project financing. In this analysis, all the costs and benefits are monetarized, so it is possible choose the best economic or financially sustainable solution. Dyr et al. [37] have analyzed the costs and benefits linked to the purchase and use of Compressed Natural Gas (CNG) buses for public transport and have presented the results of an evaluation of their economic and financial effectiveness; Harford [38] has presented a broad set of cost–benefit analyses of the public transit systems of 81 urbanized areas; Danon et al. [39], for the Belgrade tram case study, through the cost–benefit analysis, have identified a safe, comfortable and economical transport solution for the citizens of Belgrade for the next 20–30 years; Chi et al. [40] have presented an estimated cost–benefit analysis of a privately operated toll road.
In the transport sector, there are also several applications of multi-criteria analysis and several MCA approaches [41,42], which allow the identification of the best “compromise” solution. The choice of the best methods depends on this case [43]. Precisely, Table 1 shows the methods developed since 1968 [44]. As mentioned above, multi-criteria analysis is used in different application fields: the main one is in regard to the project where not all the benefits can be monetarized (especially those regarding non-users in a transport system, e.g., impact on the naturalistic) or when there are several project alternatives. In the latter, the MCA can be applied as slot analysis to eliminate the project alternatives dominated by others. Hickman et al. [45] have proposed a methodology that includes multi-criteria analysis and scenario testing to compare numerous sustainable transport scenarios with MCA impacts. Nogués and González-González [46] have developed a multi-criteria model that aims at giving priority to highway projects through integrated impact assessments for non-central areas to select the best execution order when budgets are limited. This method classifies highway projects by foreseeing their potential combined impact on the regional population, the environment, the territory, the economy, and mobility. Furthermore, Awasthi et al. [47] have used three fuzzy techniques: TOPSIS (Technique for Order Preference by Similarity to Ideal Solution) and VIKOR (Multi-criteria Optimization and Compromise Solution) for the urban mobility project’s sustainability evaluation.
Many authors have pointed out that it is necessary to apply several evaluation techniques/methods to arrive at rational choices. For example, Turró et al. [69] have integrated the CBA with the Intergenerational Redistributive Effects Model (IREM).
Annema et al. [70] have declared, through qualitative analysis, that a joint application of CBA analyses (can provide the efficiency criteria) and multi-criteria decision maker (MCDM) methods (can provide other aggregated criteria, for example, for the equity impact [71] of the proposal and/or its environmental impact) is possible.
The application of multiple evaluation methods leads to more informed decisions. Only in a few studies, have several evaluation methods been applied to the same project. In this way, it is possible to easier to compare the results obtained and to understand the strengths and weaknesses of both methods. Beria et al. [72] have compared two different ex-ante evaluation approaches (MCA and CBA), and claimed that multi-criteria analysis is a useful tool for quantifying indirect actions, while the CBA is better for strategies where monetizable costs and benefits prevail. The joint use of them can guarantee a more in-depth analysis of the priorities and impacts of action; it can also create stronger and more aware participation in the decision-making process, spreading knowledge, not only of the objective but also of alternative solutions to the problems and their costs.
Furthermore, Leleur et al. [73] have introduced a methodology that combines CBA and MCDM in a composite analysis, the COSIMA decision support model, to help decision-makers make a more informed decision [74]. The combination of CBA and MCDM allows non-monetary criteria to be added to monetary impacts using a weighting procedure that describes the importance of each criterion [75]. Ambrasaite et al. [76] have presented the principles of this methodology through a case study relating to a series of proposals for investment packages concerning the construction of the railway line, called Rail Baltica, which crosses four Eastern European countries (Estonia, Latvia, Lithuania and Poland) and connects them with the rest of Europe [77]. However, this composite assessment (COSIMA) presents some degree of uncertainty regarding the weighting of the criteria in the MCDM as it is based on subjective judgments of the decision-makers. In this regard, Ambrasaite et al. [76], introducing the Monte Carlo simulation to the COSIMA approach, have examined the variation of the weights of the criteria to allow interval results (probability distribution functions) instead of “point estimates”. Their study has proven that the transfer of point estimates into probability curves for the TRRs of alternatives is useful support and allows a robust decision. This will eventually lead to the assessment of the feasibility risk by providing a totality of the possible future results related to the TRR and the selection of project alternatives.
Definitely, the multi-criteria analysis generally allows a more reliable estimation of the non-users’ impacts [78,79,80,81,82,83,84] (e.g., non-monetary externalities such as greenhouse gas emissions, naturalistic impacts, aesthetic quality) that are generally underestimated with cost–benefit analysis. On the other hand, cost–benefit analysis is a more standardized and less discretionary procedure (e.g., application of the national and/or the EU guidelines [85,86]) and it is commonly considered a “solid” evaluation method to reduce the risk of planning fallacy and minimize conflicts over decisions (enlarges the consensus). This paper is an example of a joint application of CBA and MCA. In fact, the case studied refers to the design of a new highway in a high touristic and naturistic area in Italy, so as argued in this section, it would generally use the CBA. On the contrary, this analysis alone is not enough because of the non-users’ benefits (not simple to monetarize), due to the high touristic and naturistic area, that are relevant. The application of the two evaluation methods in this case studied is of interest, in order to highlight differences, strengths and weaknesses of both analyses.

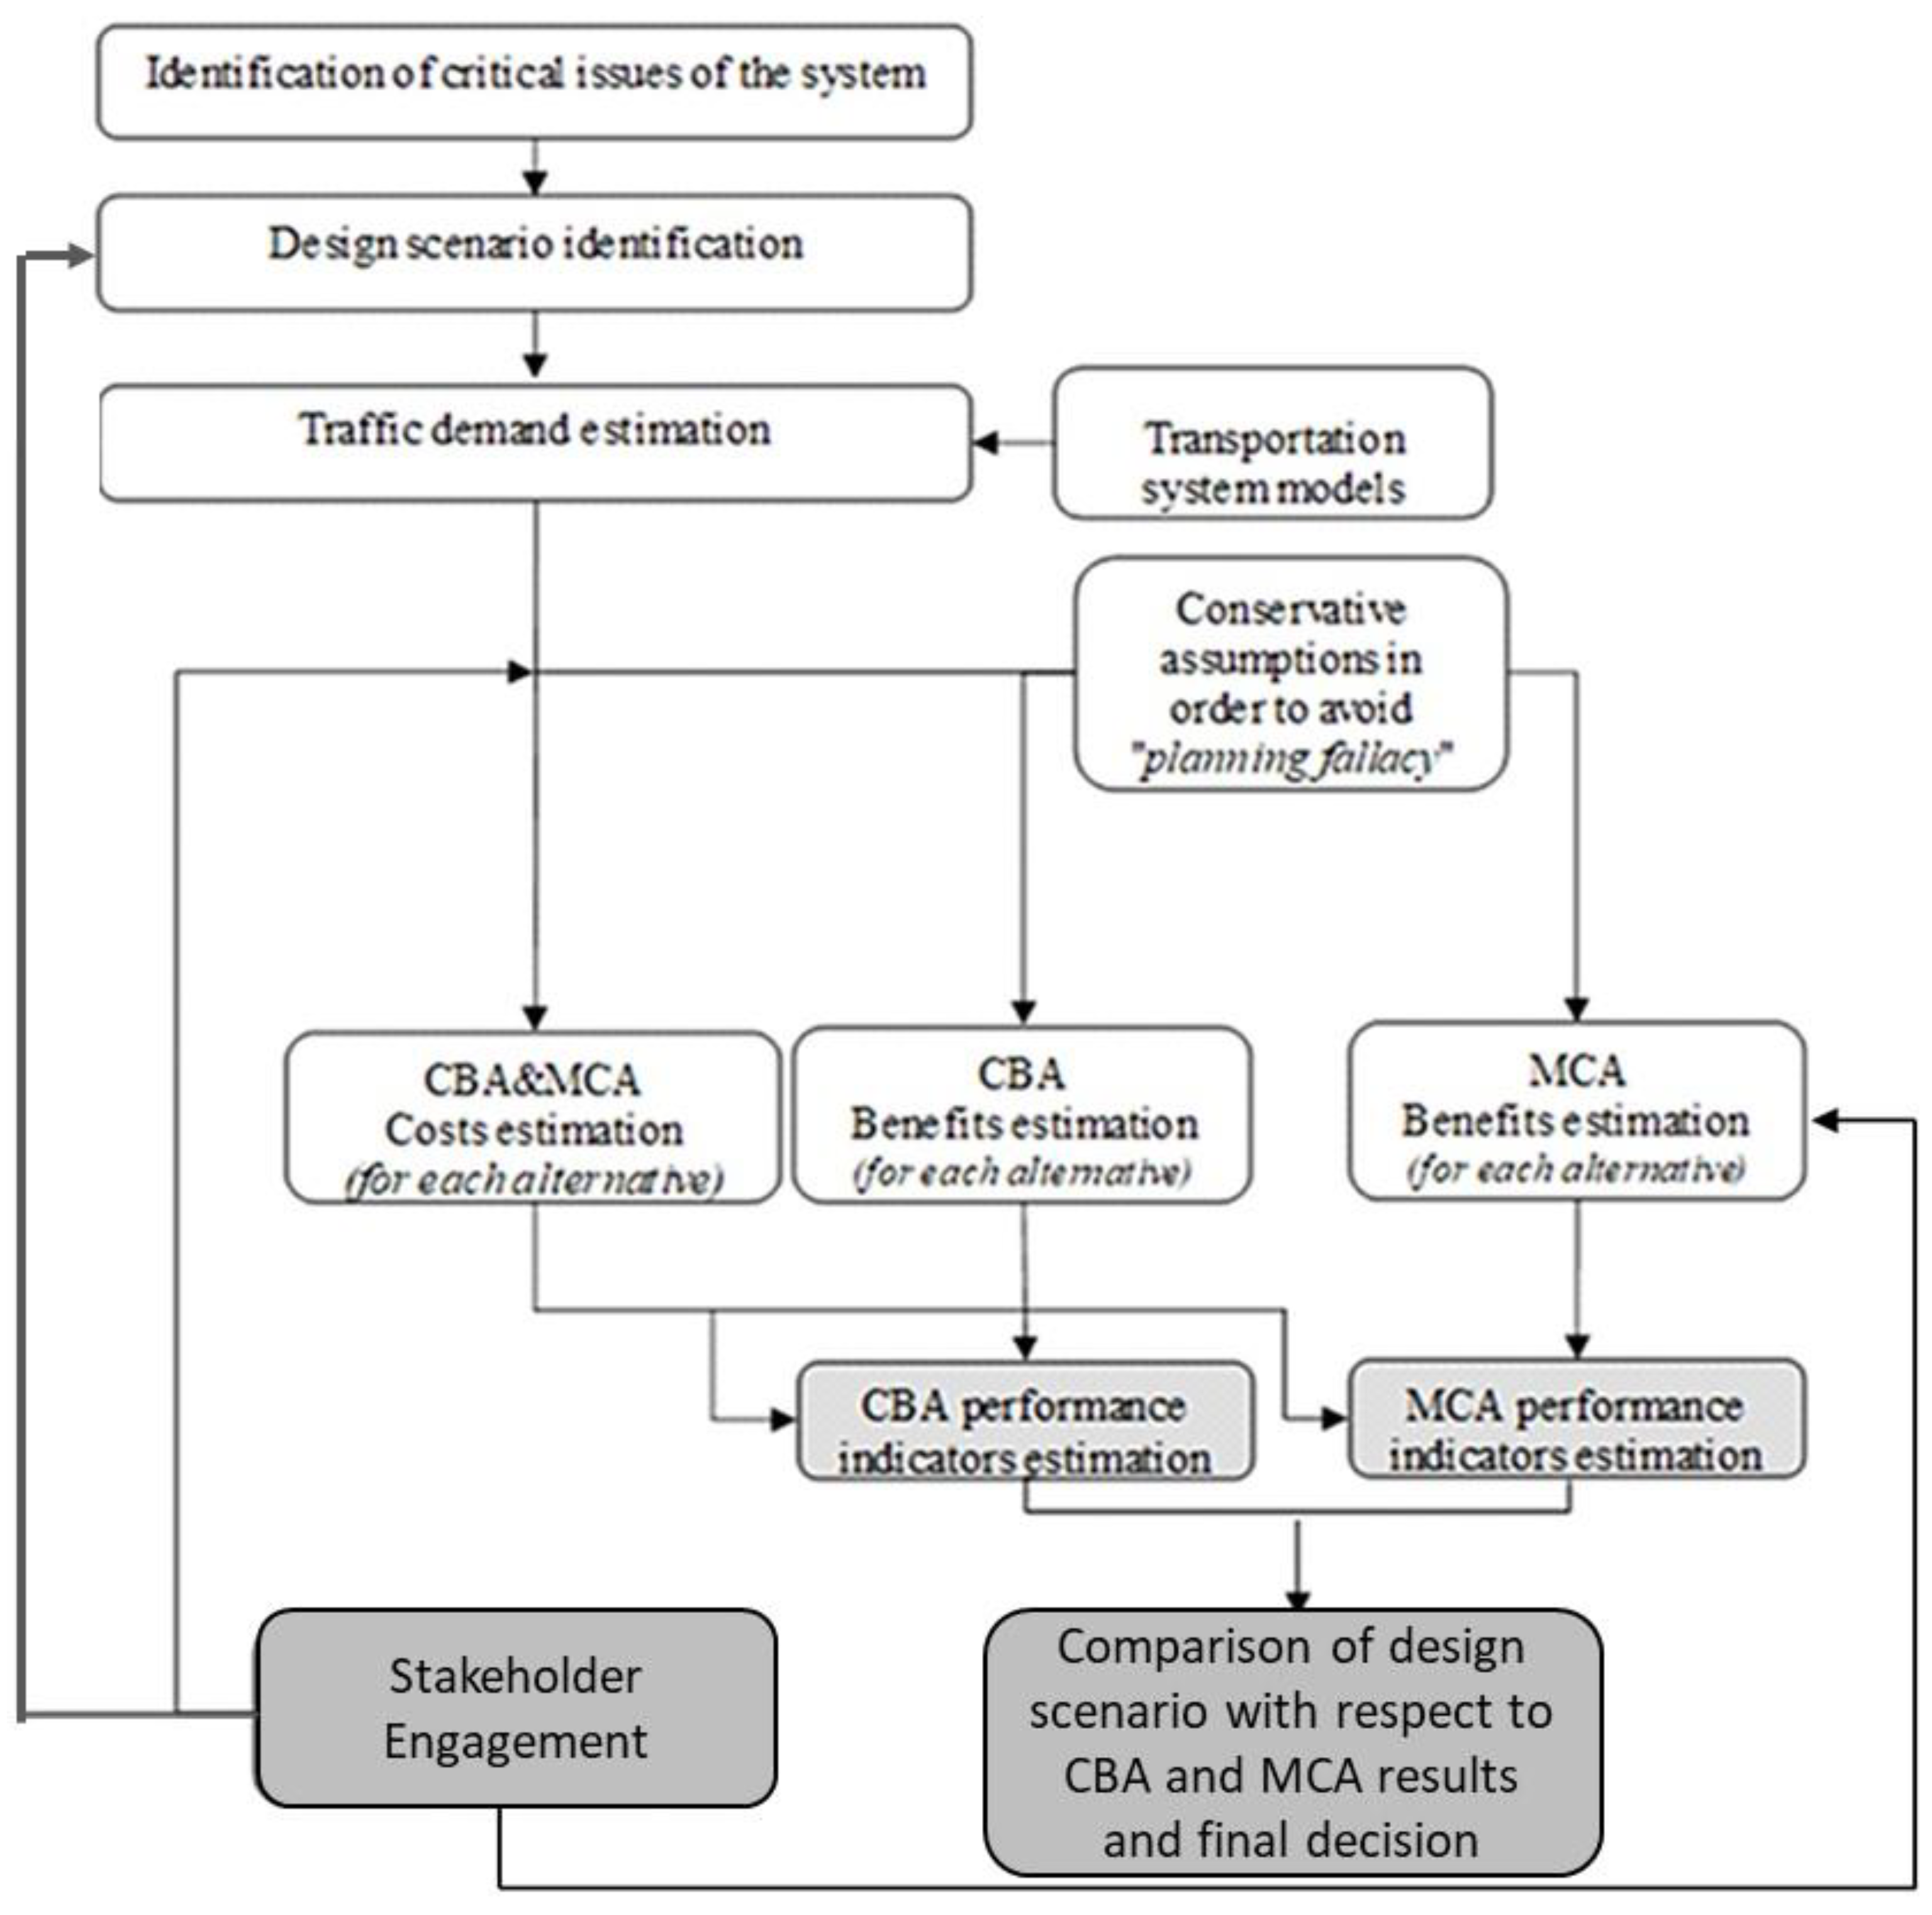
3. A Sustainable Evaluation Methodology for Investments in the Transport Sector

As said, this paper aimed to propose a sustainable evaluation process for investments in the transport sector, through the combined application of both multi-criteria and cost–benefit analysis and stakeholder engagement. The overall proposed methodology (described in Figure 1) consists of three macro activities:
  • The combined use of both CBA and MCA analysis to ensure robust and rational choices for sustainable development;
  • The implementation of a transportation system model (TSM) to reduce the risk of “planning fallacy”;
  • Stakeholder engagement during the decision-making process to ensure shared choice.
The first activity is the identification of critical issues surrounding the study area (e.g., traffic congestion, environmental restricted areas, landslide, and hydrogeological risk areas).
The second activity is the implementation of a transportation system model (TSM) that is able to estimate the transport supply and the mobility demand, which are useful for estimating the potential users’ benefits derived by a new design solution (and aimed at improving the system). There are two main methods for estimating the travel demand: the direct estimation and model implementation (e.g., [87]).
The output of the TSM is the input of the evaluation methods, MCA and CBA. One of the preliminary activities for an evaluation analysis is the identification of the reference time period. This represents the number of years for which the impacts must be taken into account in the analysis. The European guidelines [2] propose different reference time periods according to the type of the infrastructure design (e.g., roads, railways, highways).
Generally, in the evaluation analyses (e.g., MCA and CBA), the design scenario is compared with a non-project solution in terms of differences in impacts produced (design scenario vs. non-project alternative).
In both the analyses, MCA and CBA, the costs commonly considered are investments, managements and maintenances costs. Additionally, a residual value of the investment should be considered when the reference time period is lower than the life-time of the project/investment (and this value should be considered as a benefit and therefore with a positive sign).
The output of the TSM is the input of benefits estimation in CBA and MCA (Figure 1).
One of the main characteristics of the CBA is that all the benefits must be monetized in order to be compared with the costs incurred (e.g., according to the national [85] and/or the EU guidelines [86]). The main benefits produced by an investment can be grouped in [79]:
  • Transport users’ benefits, which are the impacts produced for users of the transport system, including those directly involved with the project; these impacts could be both perceived by the transport users (e.g., travel time and cost reduction, consumer surplus) and not perceived by the travelers (e.g., savings costs for car maintenance);
  • Non-users’ benefits, which are those produced for those who will not use the transport system and are not involved with the project, but will still experience some positive impacts (e.g., externalities reduction, pollutant reductions, quality of life, accident reduction).
Among the best ways to quantify the users’ benefits is the estimation of the “consumer surplus” variation (between the design scenario and the non-project one); for example, through behavioral methods (e.g., random utility theory [88]). Specifically, it is possible to quantify the generalized transport cost variation (Δgen.cost) composed in a travel time variation (e.g., [89]) and a monetary cost variation (Δtime and Δcost, respectively), weighted with respect to reciprocal substitution parameters (value of time, VOT, or Value of Travel Time Savings, VTTS):
ΔSP = Δgen.cost = VOT ∙ Δtime + Δcost
With respect to the non-users’ benefits (external impacts), an estimation of the monetary value saved could be performed through the formula:
DEP,i (t) = Δcar*km/year · EP,i
where Δcar*km/year is travel demand variation (e.g., number of cars * km saved on the roads in one year), EP,i is the marginal cost (e.g., as proposed by the European Commission [86]). Generally, EP,i is the function of the vehicular fleet composition function of the study area.
By contrast, the multi-criteria analysis is commonly applied through a multi-step process as follows:
(a)
Evaluation criteria and/or sub-criteria definition;
(b)
“Evaluation matrix” estimation;
(c)
Definition of the weights associated with each criterion; this activity, in a rational and sustainable decision-making process, should be defined through stakeholder engagement (shared process) sub-activity as proposed in [2,90].
One of the main activities of MCA is the definition of the aims and the criteria through which to compare the different alternatives (design solutions). Once the objectives and criteria have been identified, the next step is to estimate the “evaluation matrix”. This is the matrix that on the columns has the different design alternatives and on the rows the different criteria. The criteria can be quantitative or qualitative measures. Due to the different measurement units, a normalization process must be performed. There are several normalization techniques (e.g., [80]). The successive step of the MCA is the “weight” estimation, aiming to define the importance (the weight) for each criterion compared to the others. The definition of the weights is a crucial activity that could impact on the decision-making result and for this reason it is important that all the stakeholders involved in the process can express their judgments. There are several methods to define these weights (e.g., Delphi method, stakeholder engagement, for details see [80]).
After the estimation of these weights, a normalization (or standardization) of the weight vector must be performed. After that, it is possible to multiply the weights vector (normalized) for the evaluation matrix (normalized).
For both the CBA and the MCA, the estimated costs and benefits are input for the estimation of the measure of effectiveness (MOE) indicators. The MOE represents the measures through which it is possible to evaluate the economic viability of a project (e.g., net present value (NPV), internal rate of return (IRR), payback period (PBP), and benefits/costs (B/C)). The MOE indicators are useful for comparing the results of the two analyses to ensure robust and rational choices.
In order to obtain a shared decision, it is needed to take into account the influence and the interactions of the main stakeholders involved in the project. Stakeholder engagement persists in the whole transportation planning process (as suggested in [2,91,92]), starting with the initial phase of design scenario identification (Figure 1). In the MCA, the stakeholder engagement also takes place in the weight definition of the different analyzed criteria leading to an agreed outcome with the main stakeholders (Figure 1).
Finally, to reduce the risk of planning fallacy (an overestimation of benefits against an underestimation of costs), some conservative assumptions could be also introduced in both the analyses (MCA and CBA). In particular, the prudential hypotheses could be:
  • Estimating the mobility demand [93,94,95,96,97,98,99,100]: the conservative estimate of users potentially attracted by the new infrastructure will allow underestimation of the benefits for non-users and transport users;
  • An estimate of benefits: of all the positive impacts produced by the infrastructure, only some benefits (those more easily observable and/or measurable) have been considered in the analyses;
  • An estimate of costs: overestimation of the investment costs and underestimation of the residual value of the investment.

4. The Application Case Study: A New Highway in Italy

4.1. Identification

The research background was the low accessibility of transport that characterizes some Italian touristic places that often produce high traffic congestion and externalities (negative environmental impacts). This is the case of the coastal area between Cesena and Venice (Emilia-Romagna and Veneto Italian regions), which is especially affected, during the summer period, by heavy traffic congestion due to its status as a tourism attraction, with consequences on the environment. As described in Section 3, the first activity performed was to highlight the main issues and limits of the existing infrastructures. A single local road, named “Romea” (Figure 2), was identified, which allows travel among these touristic places. Furthermore, this local road has several environmental protected areas (e.g., parks and reserves), landslide and hydrogeological risk areas, which are crossed by the actual road.
Three different project alternatives (scenarios) were compared through CBA and MCA:
  • Scenario 1: a “stand-alone” scenario, improving the actual road path “Romea” quality and safety;
  • Scenario 2: a new toll highway scenario;
  • Scenario 3: in addition to Scenario 2, there is the “Romea” conversion into a “green-way” with restrictive policies for cars and freight vehicles beyond the quality of life and tourism improvements into the area.
According to the European guidelines [2], the analysis time period is 30 years, in Table 2 are the main boundary conditions for the model’s implementation in the three design scenarios.

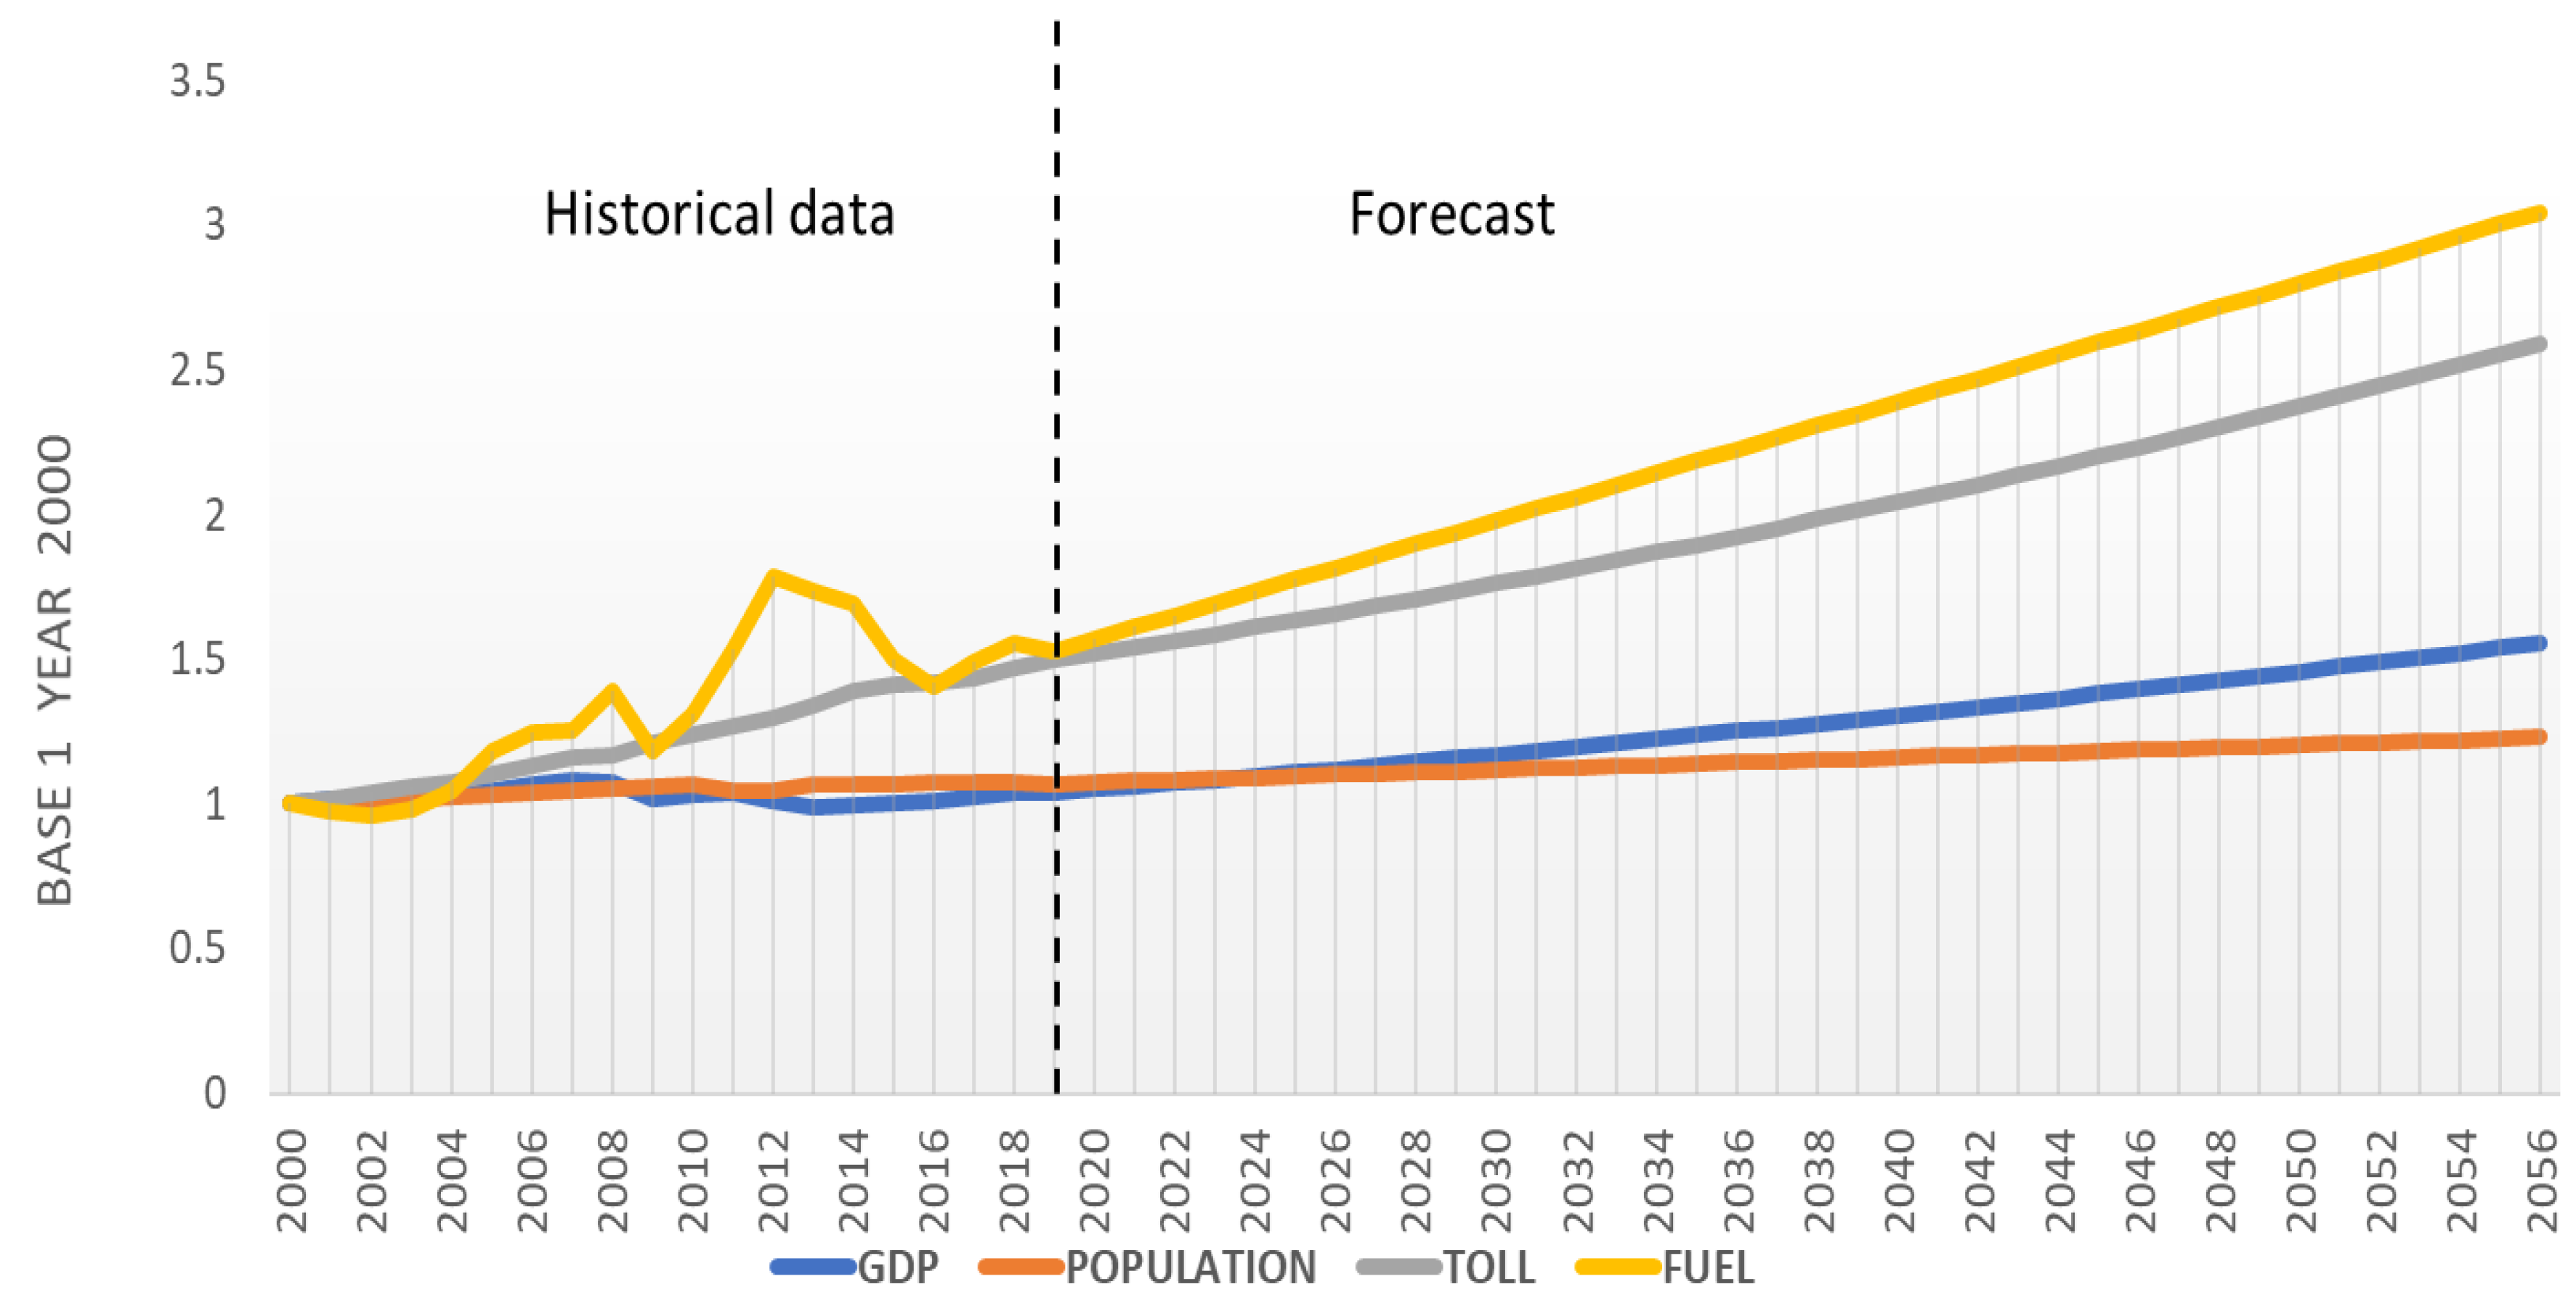
4.2. Traffic Demand Estimation

As argued in the methodology (Section 3), the second activity is the traffic demand estimation, which is a crucial element in the evaluation analysis (e.g., CBA, MCA). In this case study, an ad-hoc demand estimation that recognized the passengers’ car and freight vehicle demand was implemented. Starting from the traffic counts, the mobility survey, and the available origin–destination OD matrix, a multinomial LOGIT path choice model that considered the results achieved by [101,102,103] in the Italian context was assessed. In the proposed case study, it was possible to apply a multinomial LOGIT path choice model due to the low overlap (observed) of the actual travel paths chosen by users (cars and freight vehicles). Indeed, on average, no more than 2–3 perceived path alternatives were observed for each origin–destination for the study area. The generic path k choice probability was estimated through the equation:
p(k) = exp (Vk/θ)/Σj exp (Vj/θ)
Vj = βtime · trj + βtime · st.dev.trj + βcost · tollj + βcost · fuel_costj
where:
p(k) is the probability of choosing to travel k among the j path alternatives;
θ is the Gumbel random variable parameter;
Vj is the systematic utility relative to the path alternative j;
trj [h] is the average travel time on the path j;
t.dev.trj [h] is the travel time standard deviation on the path j (an indirect measure of the reliability of travel time);
fuel_costj [€] is the average fuel cost supported on the path j;
βtime [1/h] and βcost [1/€] are the mutual weights of the attributes, estimated model parameters, to make the systematic utility relatively dimensionless.
The model parameters were estimated through an available database of over 7000 real observations of path choices resulting from a mobility survey performed to this study. The parameters of the model were estimated by applying a maximum likelihood estimator through BIOGIME software [93]. The tables below (Table 3 and Table 4) show the main estimation results. All the parameters are statistically significant and have the expected signs (Table 3). Other validation results show that the rho-squares are about 0.6. As known, βtime (1/h) and βcost (1/€) are commonly considered as both homogenization and weight parameters of the two variables—travel time and monetary cost. The reciprocal ratio between these parameters has a specific meaning for transport planners, that is the monetary value of time (VOT) (€/hour) (Table 3).
By applying the path choice model to the design scenarios, it was possible to estimate, in the best design scenario (Scenario 3), that:
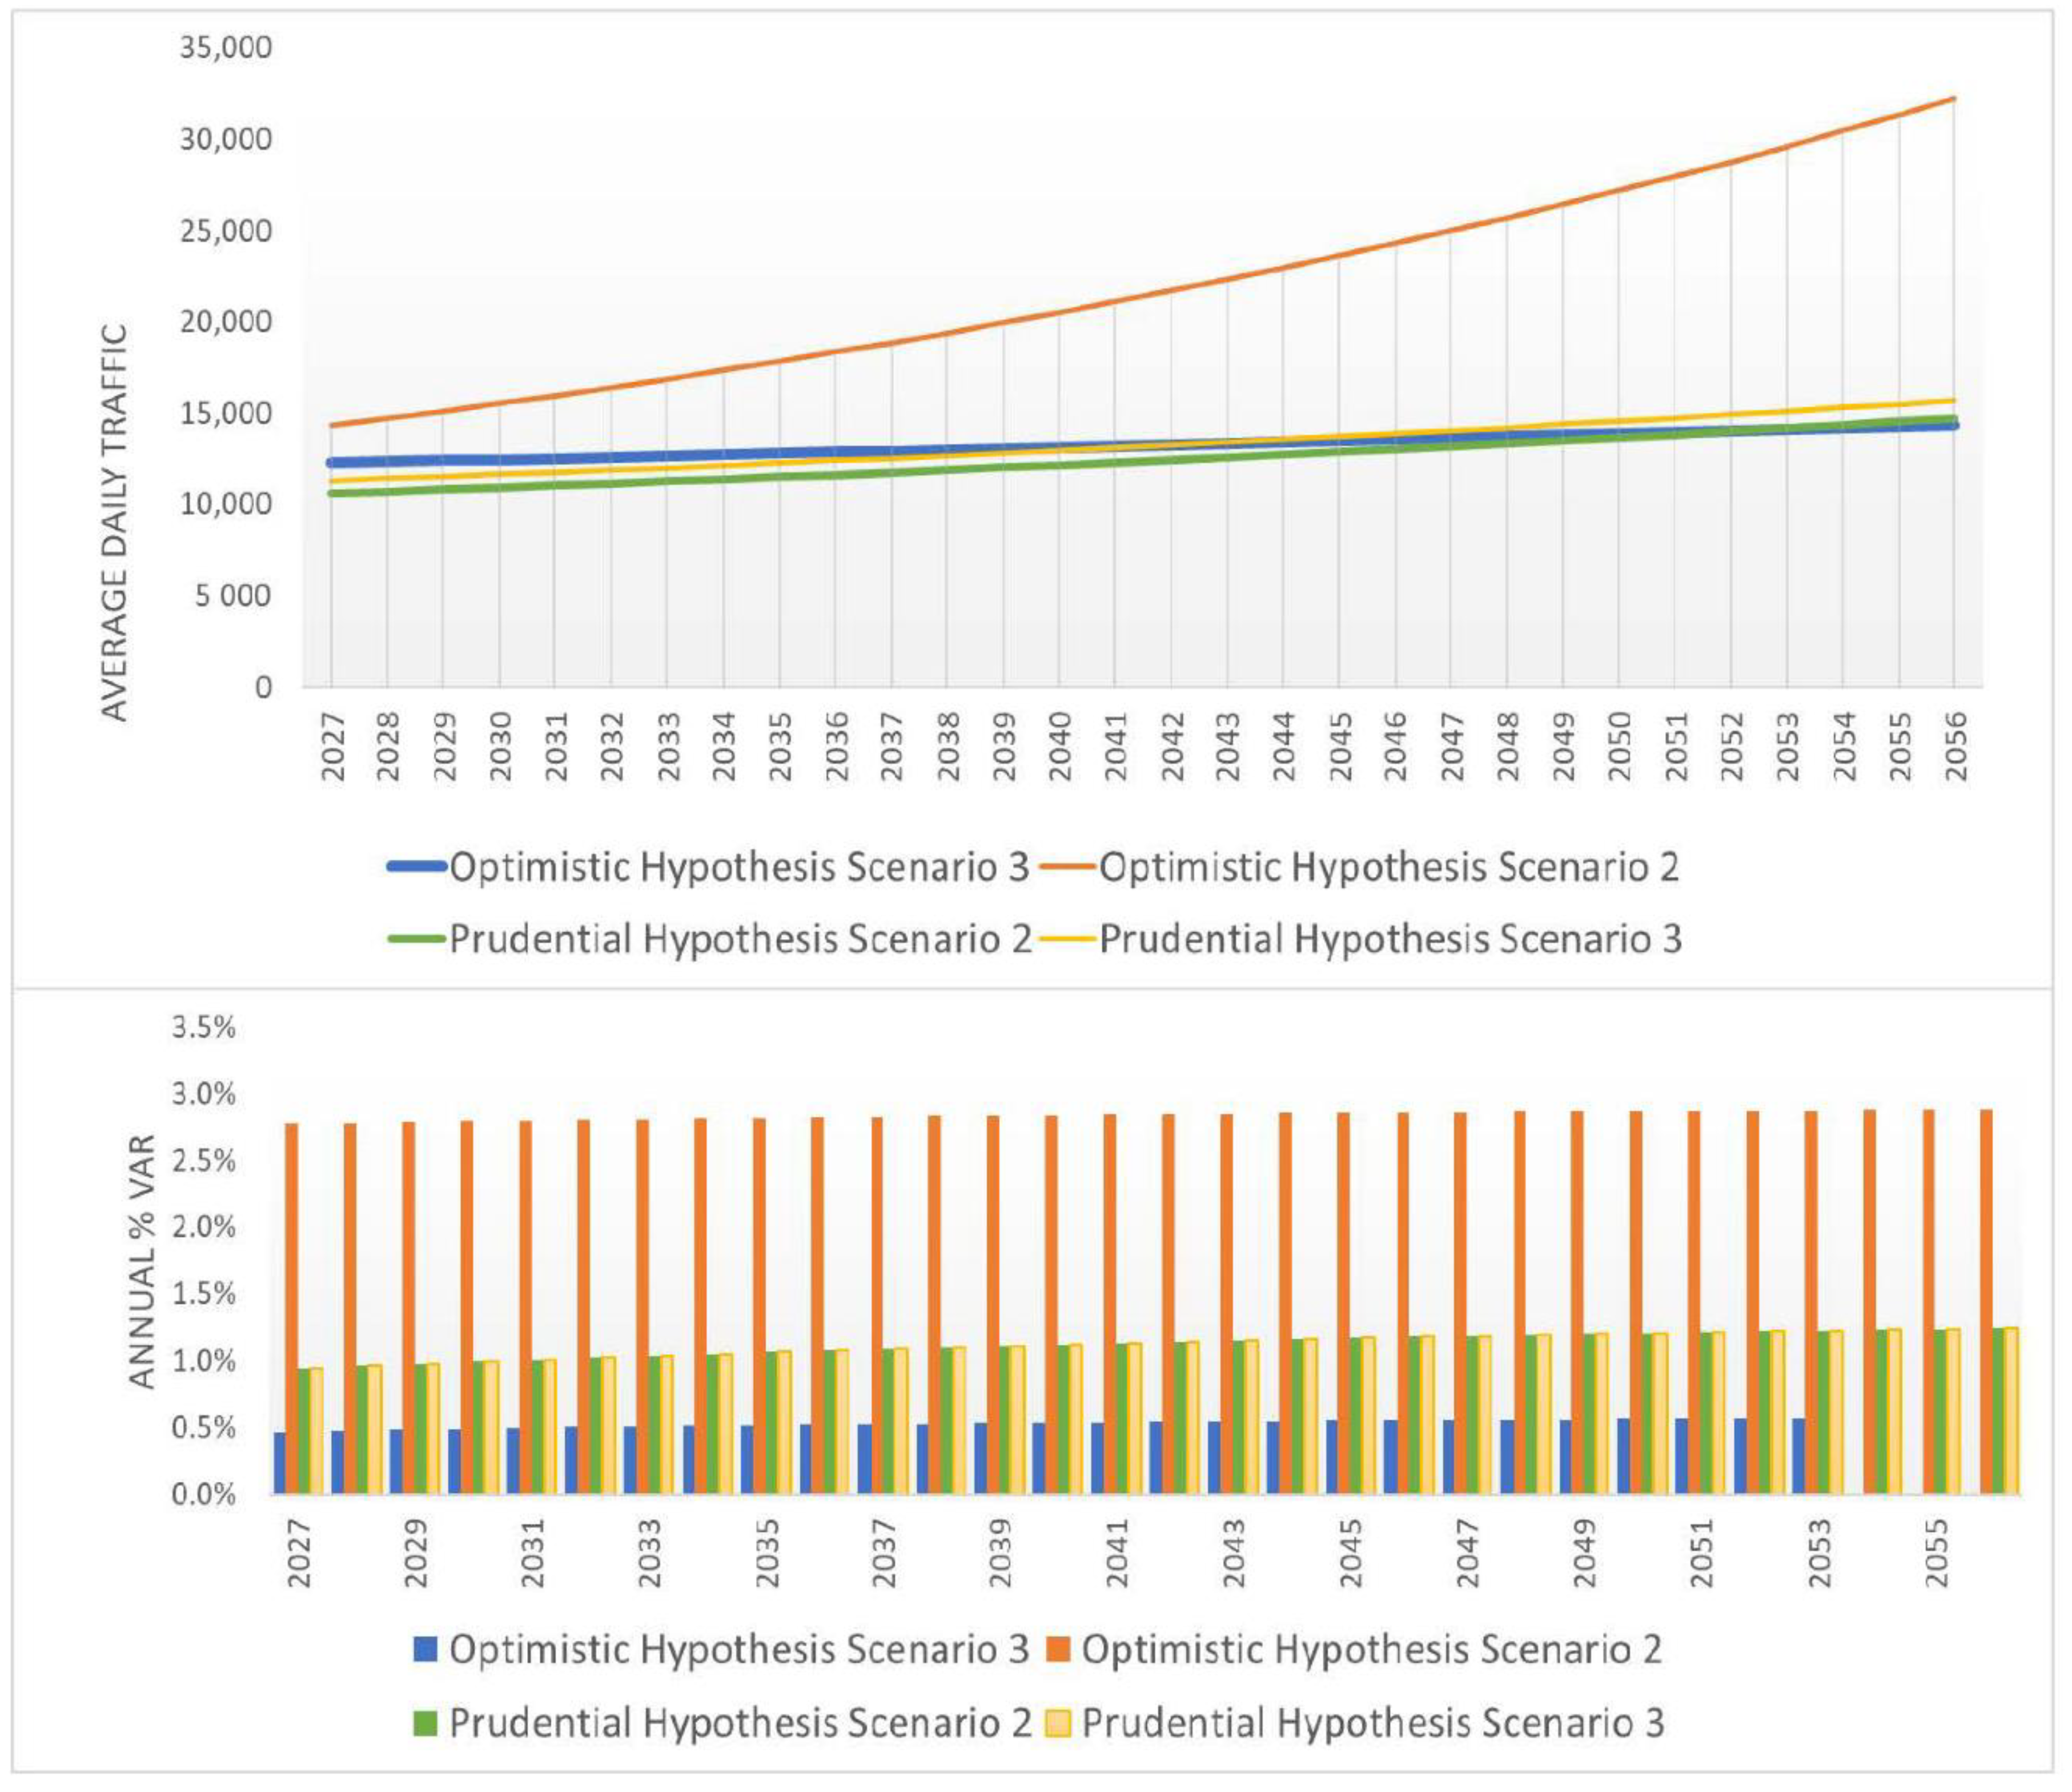
  • The potential demand interested in the design scenario was about 20–25 thousand vehicles/day (cars and freight vehicles);
  • The traffic demand catchable by the new highway (Scenario 2 and 3) was about 18–20 thousand vehicles/day (cars and freight vehicles), equal to about 80% of the overall potential demand.
Furthermore, a macro-economic trend model was also estimated to quantify the trend of the demand (vehicles*km) over the time (reference time period). The model estimates the future traffic demand in the function of the estimated trend of the main socio-economic and macro-economic variables (GDP, population, fuel/gasoline price and toll):
%Var_traffic demand (t2t1) = β1 * %Var_GDP (t2t1) + β2 * %Var_fuel (t2t1) +
β3 * %Var_toll (t2t1) + β4 * %Var_Population (t2t1)
where:
%Var_traffic demand (t2t1) is the percentage variation of the traffic demand between two successive years (t2 and t1);
%Var_GDP (t2t1) is the percentage variation of the gross domestic product (GDP) between two successive years (t2 and t1);
%Var_fuel (t2t1) is the percentage variation of the average fuel cost between two successive years (t2 and t1);
%Var_toll (t2t1) is the percentage variation of the highway toll charge (at national scale) between two successive years (t2 and t1);
%Var_Population (t2t1) is the percentage variation of the population of the study area involved between two successive years (t2 and t1).
The β1, β2, β3 and β4 estimated parameters represent the demand elasticity. This, with respect to i-th variable, is expressed by the following equation:
Traffic   demand   Elasticity   with   respect   to   i - th   variable   =   %   v a r   t r a f f i c   %   v a r   i t h   v a r i a b l e
A negative value of Traffic demand Elasticity means that when increasing the variable βi, a demand reduction occurs on the contrary, with a positive value of the traffic demand. In addition, a 2% reduction in the GDP, considering a model with the elasticity of two, would lead to a decrease of 2 × 2% = 4% in traffic.
Since the evolution in recent years of the GDP, cost of fuel and motorway toll depend on multiple not easily predictable factors, to avoid the planning fallacy and overestimate the potential demand interested in the design scenario, some prudential hypotheses on socio-economic factors were presented. In this way, to compare each of the three design scenarios (Scenario 1: stand alone, Scenario 2: new highway and Scenario 3: new highway + green-way). Several more or less restrictive hypotheses were considered about the trend population evolution, the GDP, the cost of fuel and motorway toll (Table 5).
In Table 6, the model parameters represent the elasticity (as defined above, i) while in Table 7, the statistical tests related to the variables considered are shown.
Figure 3 and Figure 4 report the main macro-economic variable trends in both scenarios.
Figure 5 shows the traffic estimation demand (in daily average traffic demand) for Scenario 3: a new highway.

4.3. Cost Estimation

The common element of the two evaluation analyses (CBA and MCA) is the estimation of costs supported by the project scenarios (Table 8). During the overall time period analysis, the main costs are represented by the investment, operative, ordinary and extraordinary maintenance costs. Additionally, a residual value of the investment to consider the benefits and costs of the project beyond the analysis period was estimated (often less than the economic life of the project). This value, representing a revenue for the project, was taken into account in the evaluation analysis with a positive sign. The 30% of the total investment cost is the residual value considered according to the “prudential estimation” performed.

4.4. Benefits Estimation in Costs–Benefits Analysis

In the CBA, the positive impacts (benefits) were estimated compared to the project scenario (from the three considered design alternatives) and the non-project (NP) ones (trend scenario). So, as argued in the Methodology (Section 3), in this paragraph we estimate the benefits produced by the new highway, considering the three proposed scenarios.
Of high importance in the economic evaluation (following both the national and the EU guidelines) was the quantification of the benefits for the users and the externalities (benefits for non-users) produced by the project.
Regarding users’ benefits, a delta surplus estimation was provided as follows, considering the generalized Formula (1) explained in the Methodology.
ΔSP = Δvehicle*hours ∙ loading factorVOT + Δvehicle*km ∙ CONScost
where:
Δvehicle*hour is the variation of vehicles*hour per year generated by the project;
Δvehicle*km is the variation of vehicle*km per year generated by the project;
loading factor is the average loading factor of a vehicle (e.g., in the case of road projects it is the average number of passengers/cars that will benefit from a possible reduction in the travel time) that was estimated equal to 1.3 passengers/cars;
CONS is the average fuel consumption (per km) of a vehicle;
VOT is the value of time saved and shown in Table 3.
Considering a time period of 30 years and a discount rate equal to 3%, in 2056 (the end of the evaluation time period) the benefits (perceived and not perceived by the users) in Scenario 3 (new highway + green-way scenario) are quantified in more than 7.5 M€ (constant prices) in the case of the optimistic hypothesis and about 3.9 M€ (constant prices) in the case of the prudential hypothesis.
Regarding the external impact (non-users’ benefits), the monetary value of these i benefits (DEP,i) was estimated according to Formulation (2) and is shown in the Methodology section. The externality (monetary value) was estimated considering the vehicle fleet of the study area and as shown in Table 9, this decreases over the years, following the evolution of the vehicle fleet. Indeed, it was estimated that in the future the most polluting vehicle fleet (euro 0, 1, 2 and 3 category cars) will no longer circulate for the benefit of a more sustainable vehicle fleet. Considering Scenario 3 (construction of a highway plus the realization of a “green-way”), the amount (in monetary value) of saved external costs is about 947.4 M€ (2018 prices) (Table 9). Specifically, the benefit produced by the reduction in collisions resulting from the infrastructure construction affects over 80% of both the optimistic and prudential hypotheses (872.0 M€ and 693.8 M€, respectively). Finally, before choosing the best project alternative to implement, a “consensus building” through stakeholder engagement (sometimes named public engagement) was performed according to the methodology proposed in [2,105].
As reported in Section 3, to avoid planning fallacy, conservative hypotheses have to be introduced in the evaluation of benefits, in particular:
  • The benefits for the users have been estimated considering the benefits produced by the design scenario during travel time; reliability of travel time; the cost of travel and operating costs;
  • The positive effects (benefits) of the intervention on economic growth have not been considered (e.g., in terms of traffic revenues, impact on tourism, increasing accessibility of existing industrial centers and other wider economic benefits) because they are not standardized by national and European guidelines;
  • Underestimating the quality of life benefits of alternative design: in the analyses, the benefits in terms of the reduction in the number of accidents are estimated, but the positive effects on social and territorial cohesion are not;
  • Underestimating the environmental benefits: the benefits in terms of local climate change, air pollution and noise reduction are estimated, but the positive effects of the intervention in terms of protected and restricted areas at risk (hydrogeological, landslide) are not;
  • The residual value of the investment underestimation, equal to 30% of the total investment cost (prudential hypothesis);
  • Underestimating the vehicle fleet renewal over the analyzed time period.

4.5. Benefits Estimation in Multi-Criteria Analysis

In the MCA, the positive impacts (benefits) were estimated according to the methodology illustrated in Section 3 (Methodology). In particular, the first activity was the definition of objectives and criteria. The criteria identified for the analysis, in addition to those derived from the efficiency of the road (investment, management and maintenance costs) were: revenue from traffic; business diversification; generalized transport cost [107,108]; increase in the accessibility of transport [4,109]; increase in tourism produced by the new transport scenario; increase in transport accessibility of freight transport nodes and firms; reduction in the risk of accidents; increase in social and territorial cohesion; reduction in all externalities produced both by the cars and by the freight vehicles within the study area; reduction in vehicles × km within the protected environmental areas and the hydrological and landslide risk areas; global warming variation; disability-adjusted life years (DALY) and usage of primary resources and consumption variation.
Table 10 (evaluation matrix) shows the results derived from the analysis. For details on the estimation of the indicators (qualitative/quantitative) for the three project scenarios reported in Table 10, see [80]. The design Scenario 1 “stand alone” produces the lower benefits both for users and for non-users but also presents the lower investment costs. By contrast, the design Scenario 3 “new highway + greenway”, even if it has the highest investment costs, will produce the highest benefits for users and non-users of the system (externality), as reported in the table.
Assigning weights to each criterion is one of the most important activities of multi-criteria analysis. The weights are a function of the priorities perceived by the decision-maker and can, therefore, vary according to it. In this case study, the weights were defined by the Delphi method in a stakeholder engagement process. The stakeholder engagement process aims to reach a shared point of view through interaction between experts and subjects involved or interested in the project (stakeholders). Furthermore, two main stakeholder groups were involved: (1) institutions, experts in public decision-making and citizens (interested in both users’ and non-users’ benefits); (2) private operators, possible manager of the new highway (private interests to increase profits).
Inside each group, there were experts in the transport sector, with high knowledge of the project, so the Delphi survey was conducted with a total of 10 participants. The aim was to reach a point of view that was as shared as possible through interaction between stakeholders without them being able to influence each other in advance. Despite its extensive use, there are no univocal guidelines or definitions regarding the size of the sample to be used for Delphi studies. On the contrary, the studies were conducted with a panel size ranging from 10 to 1685 participants [110]. Obviously, as reported by Akins [111], when increasing the sample size, the error is reduced, and good results to develop reliable criteria to support decision-making can be obtained with a panel of a limited number of experts. This is possible if the experts have similar training and have a general understanding of the field of interest [50]. See (Table 11).
After the identification of the stakeholders, the definition of the weight for each criterion and sub-criterion according to the different considered stakeholders were selected. In particular, each stakeholder has to associate a weight with the different sub-criteria, comparing in pairs using a single priority scale [50,112,113] that varies from 1 to 9 according to the scale (Table 12). This comparing method in pairs is known as the analytic hierarchy process (AHP). The analytic hierarchy process deals with complex decision-making, and it can help to set priorities and make the best decisions by reducing them to a comparison in a pair, and then synthesizing the results, considering both subjective and objective aspects. In addition, it helps the decision makers to check the consistency of the different weights chose by the different stakeholders. The joint application of AHP and the Delphi method is, therefore, a useful tool for participatory decision-making processes aimed at consensus building [114].
In Table 13, we report the average normalized weights (from a total of 100) that each stakeholder group gives to each goal after the first phase. Starting from these, an arithmetic average that was submitted to their subsequent approval was made. After the third interaction between the two stakeholder groups, a shared average vector of weights was obtained and accepted by the two stakeholder groups, as shown in the following table (Table 14).

5. Results and Discussion

In this section, the results for both the proposed evaluation analyses have been compared.
For the cost–benefit analysis, the comparison among the project alternatives was performed through the difference between costs and benefits over the years (30 years of the time period). Defined and quantified (in monetary terms), the impacts related to the design scenarios (some measure of effectiveness (MOE) as net present value (NPV), internal rate of return (IRR) r0, benefit/cost ratio (Bi/Ci), payback period (PBP)) were estimated (for details on the formula of the MOE indicators see [115,116]).
The best choice for the project scenario to develop was defined by comparing the estimated MOE indicators. The results of the cost–benefit analysis show that Scenario 3 “new highway + green-way” is the best design alternative (Table 15) and all MOE indicators for this scenario are reported in Table 16.
In the multi-criteria Analysis to the measures of effectiveness (MOE) estimation, an evaluation matrix normalization was performed. As argued in Section 3 (Methodology), these weighted summations allow the comparison of the different design scenarios for choosing the best solution to implement. As reported in Table 17, the third solution (new highway + green-way) was the best solution in this analysis, but contrary to the cost–benefit analysis, in which the difference between the third and the second scenario was only about 6%. The MCA analysis, properly evaluating all the positive externalities on the naturalistic, pollution and environment factors, allowed the conclusion that the green-way scenario is the one to prefer because of its 23% more convenience in terms of performance indicators.
Furthermore, a significant difference was observed in terms of the “weight” of the expected impacts produced between the transport users and non-users (externality), according to the different evaluation methods applied in Table 18. According to the cost–benefit estimations, the user benefits incidence (travel time and travel cost saved) is about 86% of the total expected benefits produced by the best design scenario, while this incidence is only 21% for the multi-criteria assessment. This difference is explained since the CBA (against the multi-criteria analysis) does not consider several “non-monetary” impacts (externalities). For these reasons, the application of only the cost–benefit analysis or only multi-criteria analysis can lead to wrong choices for some case studies.

6. Conclusions

The aim of this paper was to propose a sustainable evaluation process for investments in the transport sector based on the combined use of both CBA and MCA analysis and a stakeholder’s engagement. The proposed evaluation method was also applied to a real case study: the decision-making process for a new highway in a naturalistic and touristic area in north of Italy. Furthermore, a "weighted criteria process definition", based on the Delphi method, was also performed within a Public Engagement process.
Results show that the application of both the evaluation analysis (CBA and MCA) lead to identify the same solution as the best ones, allowing to perform a most rational choice from a sustainable, shared and technical point of view. Despite both analyses produce the same result, the estimations performed underline that the CBA analyses significantly underestimated the non-users’ benefits, while the opposite occur for the MCA ones. Precisely, the incidence of the non-users’ benefits is only the 14% of the total for the CBA, while reach more than the 79% for the MCA. This result is very relevant and could compromise a rational choice (risk of planning fallacy) for the assessment of a transport infrastructure that significantly impacts with tourist/naturalistic areas, for which environmental and sustainable impacts are relevant and should be adequately taken into account.
In conclusion, for a decision-making processes aimed in comparing different design alternatives for which non-users impacts are expected as relevant (predominant) against the users ones, the unique application of the most consolidated and standardized (e.g., European Guidelines) CBA analyses are not always adequate, while only the joint use of the two evaluation methods ensures robust and rational choices for a sustainable development.

Author Contributions

Methodology formulation, data curation, formal analysis, writing—original draft preparation and review and editing: I.H.; conceptualization, methodology and supervision: A.C.; data curation, validation and writing—original draft preparation: L.D.F. All authors have read and agreed to the published version of the manuscript.

Funding

This manuscript is the result of research work and we did not receive any funds for the preparation of it.

Acknowledgments

The authors are grateful to ANAS S.p.A. for allowing the use of the data and the dissemination of results. The research was also carried out within the activities of the funding program VALERE: VAnviteLli pEr la RicErca; SEND research project, University of Campania “Luigi Vanvitelli”, Italy.

Conflicts of Interest

The authors declare no conflict of interest.

References

  1. Kahneman, D.; Tversky, A. Prospect theory: An analysis of decision under risk. Econometrica 1979, 47, 363–391. [Google Scholar] [CrossRef] [Green Version]
  2. Guide to Cost-Benefit Analysis of Investment Projects, Economic Appraisal Tool for Cohesion Policy 2014–2020. Available online: https://ec.europa.eu/regional_policy/sources/docgener/studies/pdf/cba_guide.pdf (accessed on 12 November 2019).
  3. Cascetta, E.; Cartenì, A.; Pagliara, F.; Montanino, M. A new look at planning and designing transportation systems: A decision-making model based on cognitive rationality, stakeholder engagement and quantitative methods. Transp. Policy 2015, 38, 27–39. [Google Scholar] [CrossRef]
  4. Cartenì, A. Accessibility indicators for freight transport terminals. Arab. J. Sci. Eng. 2014, 39, 7647–7660. [Google Scholar] [CrossRef] [Green Version]
  5. Cartenì, A.; De Guglielmo, M.L.; Henke, I. Design of Sustainable Urban Transport Infrastructures: A Real Case Application in Italy. Int. J. Civ. Eng. Technol. 2018, 9, 2131–2147. [Google Scholar]
  6. Henke, I.; Cartenì, A.; Molitierno, C.; Errico, A. Decision-Making in the Transport Sector: A Sustainable Evaluation Method for Road Infrastructure. Sustainability 2020, 12, 764. [Google Scholar] [CrossRef] [Green Version]
  7. Roy, B.; Vincke, P. Multicriteria analysis: Survey and new directions. Eur. J. Oper. Res. 1981, 8, 207–218. [Google Scholar] [CrossRef]
  8. Wang, J.J.; Jing, Y.Y.; Zhang, C.F.; Zhao, J.H. Review on multi-criteria decision analysis aid in sustainable energy decision-making. Renew. Sustain. Energy Rev. 2009, 13, 2263–2278. [Google Scholar] [CrossRef]
  9. Malczewski, J. GIS-based multicriteria decision analysis: A survey of the literature. Int. J. Geogr. Inf. Sci. 2006, 20, 703–726. [Google Scholar] [CrossRef]
  10. Cartenì, A.; De Guglielmo, M.L.; Pascale, N. Congested urban areas with high interactions between vehicular and pedestrian flows: A cost-benefit analysis for a sustainable transport policy in Naples, Italy. Open Transp. J. 2018, 12, 273–288. [Google Scholar] [CrossRef]
  11. Carteni’, A.; Henke, I.; Molitierno, C. A cost-benefit analysis of the metro line 1 in Naples, Italy. Wseas Trans. Bus. Econ. 2018, 15, 529–538. [Google Scholar]
  12. Cartenì, A.; Henke, I. The evaluation of public investments according to the cost-benefit analysis: An application to the formia-gaeta railway line [La valutazione degli investimenti in opere pubbliche attraverso l’analisi costi-benefici: Un’applicazione alla riqualificazione della linea ferroviaria formia-gaeta]. Ing. Ferrov. 2018, 74, 651–681. [Google Scholar]
  13. Artis, M.; Carrion, J.L.; Moreno, R.; Pons, G.; Surinach, J. Efficiency measurements in infrastructure projects: Cost-benefit analysis of the Tunnel of Cadi. Int. J. Transp. Econ. Riv. Internazionale Econ. Trasp. 2000, 1, 401–423. [Google Scholar]
  14. Jacyna, M. The Multiobjective Optimisation to Evaluation of the Infrastructure Adjustment to Transport Needs. In Transport Science and Technology; Emerald Group Publishing Limited: Bingley, UK, 2006; pp. 395–405. [Google Scholar]
  15. Marianna, J. The modeling of the external cost influence on the modal split in the transport network. In Proceedings of the 2008 19th International Conference on Systems Engineering, Las Vegas, NV, USA, 19–21 August 2008; pp. 453–457. [Google Scholar]
  16. Jacyna-Gołda, I.; Jolanta, Ż.; Piotr, G. Models of traffic flow distribution for various scenarios of the development of proecological transport system. Arch. Transp. 2014, 32, 17–28. [Google Scholar] [CrossRef]
  17. De Mare, G.; Granata, M.F.; Nesticò, A. Weak and strong compensation for the prioritization of public investments: Multidimensional analysis for pools. Sustainability 2015, 7, 16022–16038. [Google Scholar] [CrossRef] [Green Version]
  18. Smith, C.W.; Smithson, C.; Wilford, D.S. Strategic Risk Management. In Institutional Investor Series in Finance; Harper and Row: New York, NY, USA, 1990; pp. 45–46. [Google Scholar]
  19. IOP Conference Series: Earth and Environmental Science 2019. Available online: https://iopscience.iop.org/issue/1755-1315/235/1 (accessed on 24 November 2020).
  20. Khakzad, N.; Khan, F.; Amyotte, P. Quantitative risk analysis of offshore drilling operations: A Bayesian approach. Saf. Sci. 2013, 57, 108–117. [Google Scholar] [CrossRef]
  21. Wang, T.; Qu, Z.; Nichol, T.; Yang, Z.; Dimitriu, D.; Clarke, G.; Bowden, D. Impacts of climate change on rail systems: A new climate risk analysis model. In Safety and Reliability-Safe Societies in a Changing World; Taylor & Francis Group: Oxfordshire, UK, 2018. [Google Scholar]
  22. Wu, Y.J.; Hayat, T.; Clarens, A.; Smith, B.L. Climate change effects on transportation infrastructure: Scenario-based risk analysis using geographic information systems. Transp. Res. Rec. 2013, 2375, 71–81. [Google Scholar] [CrossRef]
  23. Songer, A.D.; Diekmann, J.; Pecsok, R.S. Risk analysis for revenue dependent infrastructure project. Constr. Manag. Econ. 1977, 15, 377–382. [Google Scholar] [CrossRef]
  24. de Almeida Guimaraes, V.; Junior, I.C.; da Silva, M.A. Evaluating the sustainability of urban passenger transportation by Monte Carlo simulation. Renew. Sustain. Energy Rev. 2018, 93, 732–752. [Google Scholar] [CrossRef]
  25. Salling, K.B.; Leleur, S. Modelling of transport projects uncertainties: Risk assessment and scenario analysis. Eur. J. Transp. Infrastruct. Res. 2012, 12, 21–38. [Google Scholar]
  26. Lemp, J.D.; Kockelman, K.M. Understanding and accommodating risk and uncertainty in toll road projects: A review of the literature. Transp. Res. Rec. 2009, 2132, 106–112. [Google Scholar] [CrossRef] [Green Version]
  27. Arpke, A.; Hutzler, N. Operational life-cycle assessment and life-cycle cost analysis for water use in multioccupant buildings. J. Archit. Eng. 2005, 11, 99–109. [Google Scholar] [CrossRef]
  28. Malnaca, K.; Gorobetz, M.; Yatskiv, I.; Korneyev, A. Decision-Making Process for Choosing Technology of Diesel Bus Conversion into Electric Bus. In Reliability and Statistics in Transportation and Communication; Springer: Berlin/Heidelberg, Germany, 2018; Volume 68, pp. 91–102. [Google Scholar]
  29. Itoh, R. Is transportation infrastructure cost recoverable under the risk of disasters? Transp. Res. Part A Policy Pract. 2018, 118, 457–465. [Google Scholar] [CrossRef]
  30. Yates, B.T. Cost-effectiveness analysis and cost-benefit analysis: An introduction. Behav. Assess. 1985, 7, 207–234. [Google Scholar]
  31. Beria, P. Effectiveness and monetary impact of Milan’s road charge, one year after implementation. Int. J. Sustain. Transp. 2016, 10, 657–669. [Google Scholar] [CrossRef] [Green Version]
  32. Geske, J.; Berghout, N.; van den Broek, M. Cost-effective balance between CO2 vessel and pipeline transport. Part I—Impact of optimally sized vessels and fleets. Int. J. Greenh. Gas Control 2015, 36, 175–188. [Google Scholar] [CrossRef]
  33. Geng, Y.; Ma, Z.; Xue, B.; Ren, W.; Liu, Z.; Fujita, T. Co-benefit evaluation for urban public transportation sector—A case of Shenyang, China. J. Clean. Prod. 2013, 58, 82–91. [Google Scholar] [CrossRef]
  34. Shafiei, E.; Leaver, J.; Davidsdottir, B. Cost-effectiveness analysis of inducing green vehicles to achieve deep reductions in greenhouse gas emissions in New Zealand. J. Clean. Prod. 2017, 150, 339–351. [Google Scholar] [CrossRef]
  35. Weigel, W. The standard cost model-A critical appraisal. In Proceedings of the 25th Annual Conference of the European Association of Law and Economics, Haifa, Israel, 24–26 September 2008. [Google Scholar]
  36. Ponti, M. Evaluation of transport infrastructure projects beyond cost-benefit analysis. An application to Barcelona’s 4th ring road. A comment. Int. J. Transp. Econ. Riv. Internazionale Econ. Trasp. 2002, 29, 235–237. [Google Scholar]
  37. Dyr, T.; Misiurski, P.; Ziółkowska, K. Costs and benefits of using buses fuelled by natural gas in public transport. J. Clean. Prod. 2019, 225, 1134–1146. [Google Scholar] [CrossRef]
  38. Harford, J.D. Congestion, pollution, and benefit-to-cost ratios of US public transit systems. Transp. Res. Part D Transp. Environ. 2006, 11, 45–58. [Google Scholar] [CrossRef]
  39. Danon, G.; Tica, S.; Vasić, B. Cost benefit analysis of Belgrade tram rolling stock. J. Appl. Eng. Sci. 2006, 4, 57–68. [Google Scholar]
  40. Chi, S.; Bunker, J.; Teo, M. Measuring impacts and risks to the public of a privately operated toll road project by considering perspectives in cost-benefit analysis. J. Transp. Eng. Part A Syst. 2017, 143, 04017060. [Google Scholar] [CrossRef] [Green Version]
  41. Tsamboulas, D.A.; Yiotis, G.; Mikroudis, G. A method for multi-criteria analysis in transportation infrastructure investments. Int. J. Transp. Econ. Riv. Internazionale Econ. Trasp. 2007, 34, 113–131. [Google Scholar]
  42. Marletto, G. Transalpine transport policies: Towards a shared approach. Int. J. Transp. Econ. Riv. Internazionale Econ. Trasp. 2010, 37, 353–370. [Google Scholar]
  43. Tsamboulas, D. A tool for prioritizing multinational transport infrastructure investments. Transp. Policy 2007, 14, 11–26. [Google Scholar] [CrossRef]
  44. Zolfani, S.H.; Zavadskas, E.K.; Khazaelpour, P.; Cavallaro, F. The multi-aspect criterion in the PMADM outline and its possible application to sustainability assessment. Sustainability 2018, 10, 4451. [Google Scholar] [CrossRef] [Green Version]
  45. Hickman, R.; Saxena, S.; Banister, D.; Ashiru, O. Examining transport futures with scenario analysis and MCA. Transp. Res. Part A Policy Pract. 2012, 46, 560–575. [Google Scholar] [CrossRef]
  46. Nogués, S.; Gonzàlez-Gonzàlez, E. Multi-criteria impacts assessment for ranking highway projects in Northwest Spain. Transp. Res. Part A Policy Pract. 2014, 65, 80–91. [Google Scholar] [CrossRef]
  47. Awasthi, A.; Omrani, H.; Gerber, P. Investigating ideal-solution based multicriteria decision making techniques for sustainability evaluation of urban mobility projects. Transp. Res. Part A Policy Pract. 2018, 116, 247–259. [Google Scholar] [CrossRef]
  48. Decision Marking among Multiple Attribute Alternatives: A Survey and Consolidated Approach. Available online: https://www.rand.org/pubs/research_memoranda/RM4823.html (accessed on 12 November 2019).
  49. Roy, B. Classement et choix en prèsence de points de vue multiples. Rev. Fr. D’Informatique Rech. Oper. (Riro) 1968, 2, 57–65. [Google Scholar] [CrossRef]
  50. On the Internet Traffic Classification: A Multi-Criteria Decision Making Approach. Available online: http://www.sciepub.com/reference/155073 (accessed on 24 November 2020).
  51. Hwang, C.L.; Yoon, K. Multiple Attribute Decision Making: A State of the Art Survey. In Lecture Notes in Economics and Mathematical Systems; Springer: Berlin, Germany, 1981; Volume 186, pp. 58–191. [Google Scholar]
  52. Brans, J.P. La méthode PROMETHEE. In L’Ingéniérie de la Décision. Elaboration d’Instruments d’Aide à la Décision. Méthode PROMETHEE; Université LAVAL: Quebec, QC, Canada, 1982; pp. 183–213. [Google Scholar]
  53. Brans, J.P.; Mareschal, B.; Vincke, P. PROMETHEE: A new family of outranking methods in multicriteria analysis. In Operational Research ‘84 IFORS 84, 6–10 August 1984, Washington, DC, USA; Brans, J.P., Ed.; Elsevier Science Pub. Co.: Amsterdam, The Netherlands, 1984; pp. 477–490. [Google Scholar]
  54. Gomes, L.F.A.M.; Lima, M.M.P.P. TODIM: Basics and application to multicriteria ranking of projects with environmental impacts. Found. Comput. Decis. Sci. 1992, 16, 113–127. [Google Scholar]
  55. Saaty, T.J. Decision Making in Complex Environments, The Analytical Hierarchy Process for Decision Making with Dependence and Dependence and Feedback; RWS Publications: Pittsburgh, PA, USA, 1996. [Google Scholar]
  56. Saaty, T.L. Fundamentals of analytic network process. In Proceedings of the 5th International Symposium on the Analytic Hierarchy Process, Kobe, Japan, 12–14 August 1999; pp. 348–379. [Google Scholar]
  57. Zavadskas, E.K.; Kaklauskas, A. Determination of an efficient contractor by using the new method of multicriteria assessment. In International Symposium for “The Organisation and Management of Construction”. Shaping Theory and Practice 2: Managing the Construction Project and Managing Risk; Langford, D.A., Retik, A., Eds.; CIB W: London, UK; Weinheim, Germany; New York, NY, USA; Tokyo, Japan; Melbourne, Australia; Madras, India; E and FN SPON: London, UK, 1996; Volume 65, pp. 94–104. [Google Scholar]
  58. Opricovic, S. Multiple Criteria Optimization of Civil Engineering Systems; Faculty of Civil Engineering: Belgrade, Serbian, 1998. [Google Scholar]
  59. Zavadskas, E.K.; Turskis, Z.; Vilutiene, T. Multiple criteria analysis of foundation instalment alternatives by applying additive ratio assessment (ARAS) method. Arch. Civ. Mech. Eng. 2010, 10, 123–141. [Google Scholar] [CrossRef]
  60. Keršulienė, V.; Zavadskas, E.K.; Turskis, Z. Selection of rational dispute resolution method by applying new step-wise weight assessment ratio analysis (SWARA). J. Bus. Econ. Manag. 2010, 11, 243–258. [Google Scholar] [CrossRef]
  61. Ginevicius, R. A New Determining Method for the Criteria Weights in Multi-Criteria Evaluation. Int. J. Inf. Technol. Decis. Mak. 2011, 10, 1067–1095. [Google Scholar] [CrossRef]
  62. Zavadskas, E.K.; Turskis, Z.; Antucheviciene, J.; Zakarevicius, A. Optimization of weighted aggregated sum product assessment. Electron. Elektron. Ir Elektrotechnika 2012, 122, 3–6. [Google Scholar] [CrossRef]
  63. Krylovas, A.; Zavadskas, E.K.; Kosareva, N.; Dadelo, S. New KEMIRA Method for Determining Criteria Priority and Weights in Solving MCDM Problem. Int. J. Inf. Technol. Decis. Mak. 2014, 13, 1119–1133. [Google Scholar] [CrossRef]
  64. Rezaei, J. Best-worst multi-criteria decision-making method. Omega 2015, 53, 49–57. [Google Scholar] [CrossRef]
  65. Keshavarz Ghorabaee, M.; Zavadskas, E.K.; Olfat, R.; Turskis, Z. Multi-Criteria Inventory Classification Using a New Method of Evaluation Based on Distance from Average Solution (EDAS). Informatica. 2015, 26, 435–451. [Google Scholar] [CrossRef]
  66. Keshavarz Ghorabaee, M.; Zavadskas, E.K.; Turskis, Z.; Antucheviciene, J. A new combinative distance-based assessment (CODAS) method for multi-criteria decision-making. Econ. Comput. Econ. Cybern. Stud. Res. 2016, 50, 25–44. [Google Scholar]
  67. Keshavarz Ghorabaee, M.; Amiri, M.; Zavadskas, E.K.; Turskis, Z.; Antucheviciene, J. Simultaneous Evaluation of Criteria and Alternatives (SECA) for Multi-Criteria Decision-Making. Informatica 2018, 29, 265–280. [Google Scholar] [CrossRef] [Green Version]
  68. Yazdani, M.; Zarate, P.; Zavadskas, E.K.; Turskis, Z. A Combined Compromise Solution (CoCoSo) method for multi-criteria decision-making problems. Manag. Decis. 2018, 57. [Google Scholar] [CrossRef]
  69. Turró, M.; Penyalver, D. Hunting white elephants on the road. A practical procedure to detect harmful projects of transport infrastructure. Res. Transp. Econ. 2019, 75, 3–20. [Google Scholar] [CrossRef]
  70. Annema, J.A.; Mouter, N.; Razaei, J. Cost-benefit analysis (CBA), or multi-criteria decision-making (MCDM) or both: Politicians’ perspective in transport policy appraisal. Transp. Res. Procedia 2015, 10, 788–797. [Google Scholar] [CrossRef] [Green Version]
  71. Cascetta, E.; Cartenì, A.; Henke, I.; Pagliara, F. Economic growth, transport accessibility and regional equity impacts of high-speed railways in Italy: Ten years ex post evaluation and future perspectives. Transp. Res. Part A Policy Pract. 2020, 139, 412–428. [Google Scholar] [CrossRef] [PubMed]
  72. Beria, P.; Maltese, I.; Mariotti, I. Multi-Criteria versus Cost Benefit Analysis: A comparative perspective in the assessment of sustainable mobility. Eur. Transp. Res. Rev. 2012, 4, 137–152. [Google Scholar] [CrossRef] [Green Version]
  73. Improving Public Investment Management for Large-Scale Government Projects: Focusing on the Feasibility Studies: Lessons and Challenges. Available online: https://orbit.dtu.dk/en/publications/improving-public-investment-management-for-large-scale-government (accessed on 24 November 2020).
  74. Ambrasaite, I. Comprehensive Transport Infrastructure Assessment Based on the Rail Baltica Case. Master’s Thesis, Department of Transport, Technical University of Denmark, Lyngby, Denmark, 2010. [Google Scholar]
  75. Barfod, M.B.; Salling, K.B.; Leleur, S. Composite decision support by combining cost-benefit and multi-criteria decision analysis. Decis. Support Syst. 2011, 51, 167–175. [Google Scholar] [CrossRef]
  76. Ambrasaite, I.; Barfod, M.B.; Salling, K.B. MCDA and risk analysis in transport infrastructure appraisals: The Rail Baltica case. Procedia-Soc. Behav. Sci. 2011, 20, 944–953. [Google Scholar] [CrossRef] [Green Version]
  77. Telicka, P. Annual Activity Report-Priority Project N° 27. 2006. Available online: http://ec.europa.eu/ten/transport/coordinators/doc/2006_07_pp27_en.pdf (accessed on 12 November 2019).
  78. Cartenì, A.; De Guglielmo, M.L.; Pascale, N.; Calabrese, M. An adaptive rational decision-making process for developing sustainable urban mobility plans. Int. J. Civ. Eng. Technol. 2017, 8, 1147–1156. [Google Scholar]
  79. Cartenì, A.; Henke, I. External costs estimation in a cost-benefit analysis: The new Formia-Gaeta tourist railway line in Italy. In Proceeding of the 17th IEEE International Conference on Environment and Electrical Engineering, Milan, Italy, 6–9 June 2017. [Google Scholar]
  80. Cartenì, A.; Henke, I.; Mallozzi, F.; Molitierno, C. A multi-criteria analysis as a rational evaluation process for building a new highway in Italy. In WIT Transactions on Ecology and the Environment; WIT Press: Southampton, UK, 2018; Volume 217, pp. 713–723. ISSN 1743-3541. [Google Scholar] [CrossRef] [Green Version]
  81. Cartenì, A.; Henke, I.; Di Bartolomeo, M.I.; Regna, M. A Cost-Benefit Analysis of a Fully-Automated Driverless Metro Line in a High-Density Metropolitan Area in Italy. In Proceedings of the 2019 IEEE International Conference on Environment and Electrical Engineering and 2019 IEEE Industrial and Commercial Power Systems Europe, EEEIC/I and CPS Europe, Genova, Italy, 11–14 June 2019. [Google Scholar]
  82. Cartenì, A.; Galante, G.; Henke, I. An assessment of models accuracy in predicting railways traffic flows: A before and after study in Naples. Wit Trans. Ecol. Environ. 2014, 191, 783–794. [Google Scholar] [CrossRef] [Green Version]
  83. de Luca, S.; Cartenì, A. A multi-scale modelling architecture for estimating of transport mode choice induced by a new railway connection: The Salerno-University of Salerno-Mercato San Severino Route [Un’architettura modellistica multi-scala per la stima delle ripartizioni modali indotte da un nuovo collegamento ferroviario: Il caso studio della tratta Salerno-Università di Salerno-Mercato San Severino]. Ing. Ferrov. 2013, 68, 447–473. [Google Scholar]
  84. Cartenì, A.; Russo, F. A distribution regional freight demand model. Adv. Transp. 2004, 16, 275–285. [Google Scholar]
  85. Decreto del Ministro delle Infrastrutture e dei Trasporti. Linee Guida per la Valutazione Degli Investimenti in Opere Pubbliche nei Settori di Competenza del Ministero delle Infrastrutture e dei Trasporti. 2017. Available online: http://www.mit.gov.it/sites/default/files/media/notizia/2017-07/Linee%20Guida%20Val%20OO%20PP_01%2006%202017.pdf (accessed on 21 October 2020).
  86. Korzhenevych, A.; Dehnen, N.; Brocker, J.; Holtkamp, M.; Meier, H.; Gibson, G.; Varma, A.; Cox, V. Update of the Handbook on External Costs of Transport; Final Report for the European Commission, DG MOVE.; MOVE. DIW Econ, CAU.; Ricardo-AEA: London, UK, 2014. [Google Scholar]
  87. Cascetta, E. Transportation Systems Engineering: Theory and Methods. Applied Optimization; Springer: Boston, MA, USA, 2001. [Google Scholar]
  88. Cascetta, E. Transportation System Analysis: Models and Applications; Springer: New York, NY, USA, 2009. [Google Scholar]
  89. Cartenì, A.; Punzo, V. Travel time cost functions for urban roads: A case study in Italy. WIT Trans. Built Environ. 2007, 96, 233–243. [Google Scholar] [CrossRef] [Green Version]
  90. Cartenì, A. Urban sustainable mobility. Part 1: Rationality in transport planning. Transp. Probl. 2014, 9, 39–48. [Google Scholar]
  91. Cartenì, A.; Henke, I.; Regna, M.; Di Bartolomeo, M.I.; Di Francesco, L. A Stakeholder Engagement Process for a Rational Decision-Making Process in Transportation Planning. Int. J. Adv. Res. Eng. Technol. 2020, 11, 333–343. [Google Scholar]
  92. Cartenì, A.; D’Acierno, L.; Gallo, M. A Rational Decision-Making Process with Public Engagement for Designing Public Transport Services: A Real Case Application in Italy. Sustainability 2020, 12, 6303. [Google Scholar] [CrossRef]
  93. Bierlaire, M. BIOGEME: A free package for the estimation of discrete choice models. In Proceedings of the 3rd Swiss Transport Research Conference, Ascona, Switzerland, 19–21 March 2003. [Google Scholar]
  94. Bifulco, G.N.; Cartenì, A.; Papola, A. An activity-based approach for complex travel behaviour modelling. Eur. Transp. Res. Rev. 2010, 2, 209–221. [Google Scholar] [CrossRef] [Green Version]
  95. Henke, I. The Effect Of Railway Accessibility on the Choice of University Studies. Int. J. Transp. Dev. Integr. 2017, 1, 339–347. [Google Scholar] [CrossRef]
  96. Cascetta, E.; Cartenì, A.; Henke, I. Stations quality, aesthetics and attractiveness of rail transport: Empirical evidence and mathematical models [Qualità delle stazioni, estetica e attrattività del trasporto ferroviario: Evidenze empiriche e modelli matematici]. Ing. Ferrov. 2014, 69, 307–324. [Google Scholar]
  97. Cartenì, A.; Pariota, L.; Henke, I. Hedonic value of high-speed rail services: Quantitative analysis of the students’ domestic tourist attractiveness of the main Italian cities. Transp. Res. A Policy Pract. 2017, 100, 348–365. [Google Scholar] [CrossRef]
  98. Cartenì, A.; Cascetta, E.; de Luca, S. A random utility model for park & carsharing services and the pure preference for electric vehicles. Transp. Policy 2016, 48, 49–59. [Google Scholar] [CrossRef]
  99. Cascetta, E.; Carteni, A.; Henke, I. Acceptance and equity in advanced path-related road pricing schemes. In Proceedings of the 5th IEEE International Conference on Models and Technologies for Intelligent Transportation Systems, New York, NY, USA, 26–28 June 2017; pp. 492–496. [Google Scholar] [CrossRef]
  100. Cartenì, A. A new look in designing sustainable city logistics road pricing schemes. Wit Trans. Ecol. Environ. 2017, 223, 171–181. [Google Scholar] [CrossRef] [Green Version]
  101. Cantarella, G.E.; Cartenì, A.; de Luca, S. Stochastic equilibrium assignment with variable demand: Theoretical and implementation issues. Eur. J. Oper. Res. 2015, 241, 330–347. [Google Scholar] [CrossRef]
  102. Cartenì, A. Urban sustainable mobility. Part 2: Simulation models and impacts estimation. Transp. Probl. 2015, 10, 5–16. [Google Scholar] [CrossRef] [Green Version]
  103. Cartenì, A. Updating demand vectors using traffic counts on congested networks: A real case application. In WIT Transactions on the Built Environment; Wit Press: Southampton, UK, 2007; Volume 96, pp. 211–221. [Google Scholar]
  104. ISTAT. Available online: https://www.istat.it/ (accessed on 14 November 2019).
  105. de Luca, S. Public engagement in strategic transportation planning: An analytic hierarchy process based approach. Transp. Policy 2014, 33, 110–124. [Google Scholar] [CrossRef]
  106. ACI. Autoritratto. Available online: http://www.aci.it/laci/studi-e-ricerche/dati-e-statistiche/autoritratto.html (accessed on 14 November 2019).
  107. Cascetta, E.; Cartenì, A. A quality-based approach to public transportation planning: Theory and a case study. Int. J. Sustain. Transp. 2014, 8, 84–106. [Google Scholar] [CrossRef] [Green Version]
  108. Cascetta, E.; Cartenì, A.; Carbone, A. The quality in public transportation. The campania regional metro system. Ing. Ferrov. 2013, 68, 241–261. [Google Scholar]
  109. Cascetta, E.; Cartenì, A.; Montanino, M. A behavioral model of accessibility based on the number of available opportunities. J. Transp. Geogr. 2016, 51, 45–58. [Google Scholar] [CrossRef]
  110. Reid, N. The Delphi technique: Its contribution to the evaluation of professional practice. Prof. Competence Qual. Assur. Caring Prof. 1988, 230, 262. [Google Scholar]
  111. Akins, R.B.; Tolson, H.; Cole, B.R. Stability of response characteristics of a Delphi panel: Application of bootstrap data expansion. BMC Med. Res. Methodol. 2005, 5, 37. [Google Scholar] [CrossRef] [Green Version]
  112. De Brucker, K.; de Winne, N.; Peeters, C.; Verbeke, A.; Winkelmans, W. The economic evaluation of public investments in transport infrastructure: The use of multicriteria analysis. Int. J. Transp. Econ. Riv. Internazionale Econ. Trasp. 1995, 22, 261–281. [Google Scholar]
  113. Figueira, J.; Greco, S.; Ehrgott, M. Multiple criteria decision analysis. In International Series in Operations Research and Management Science, 78; Springer: New York, NY, USA, 2005. [Google Scholar]
  114. Le Pira, M.; Inturri, G.; Ignaccolo, M.; Pluchino, A. Modelling consensus building in Delphi practices for participated transport planning. Transp. Res. Procedia 2017, 25, 3725–3735. [Google Scholar] [CrossRef]
  115. Cartenì, A.; Henke, I.; Molitierno, C.; Di Francesco, L. Strong Sustainability in Public Transport Policies: An e-Mobility Bus Fleet Application in Sorrento Peninsula (Italy). Sustainability 2020, 12, 7033. [Google Scholar] [CrossRef]
  116. Cartenì, A. A cost-benefit analysis based on the carbon footprint derived from plug-in hybrid electric buses for urban public transport services. Wseas Trans. Environ. Dev. 2018, 14, 125–135. [Google Scholar]
Figure 1. The proposed methodology for a sustainable evaluation process for investments in the transport sector.
Sustainability 12 09854 g001
Figure 2. Case study and design scenarios. (Sources: elaborations starting from https://www.google.com/maps/).
Sustainability 12 09854 g002
Figure 3. Trend of the main macro-economic variables estimated for the best alternative (Scenario 3) under the “optimistic hypothesis”.
Sustainability 12 09854 g003
Figure 4. Trend of the main macro-economic variables estimated for the best alternative (Scenario 3) under the “prudential hypothesis”.
Sustainability 12 09854 g004
Figure 5. Average daily traffic demand evolution estimated for the best alternative (Scenario 3).
Sustainability 12 09854 g005
Table 1. A literature review of the main multi-criteria evaluation methods.
MethodsReference
SAW (Simple Additive Weighting)MacCrimon [48]
ELECTRE (Elimination and Choice Expressing Reality)Roy [49]
AHP (Analytic Hierarchy Process)Saaty [50]
TOPSIS (Technique for Order Preference by Similarity to Ideal Solution)Hwang & Yoon [51]
PROMETHEE (Preference Ranking Organization Method for Enrichment of Evaluations)Brans [52]; Brans et al. [53]
TODIM (Interactive and Multi-Criteria Decision Making)Gomes & Lima [54]
ANP (Analytic Network Process)Saaty [55,56]
COPRAS (Complex Proportional Assessment)Zavadskas & Kaklauskas [57]
VIKOR (Multi-criteria Optimization and Compromise Solution)Opricovic [58]
ARAS (Additive Ratio Assessment)Zavadskas et al. [59]
SWARA (Step-Wise Weight Assessment Ratio Analysis)Kersuliene et al. [60]
FARE (Factor Relationship)Ginevicius [61]
WASPAS (Weighted Aggregated Sum Product Assessment)Zavadskas et al. [62]
KEMIRA (Kemeny Median Indicator Ranks Accordance)Krylovas et al. [63]
BWM (Best-Worst Method)Rezaei [64]
EDAS (Evaluation Based on Distance from Average Solution)Keshavarz Ghorabaee et al. [65]
CODAS (A New, Combinative Distance-Based Assessment)Keshavarz Ghorabaee et al. [66]
SECA (Simultaneous Evaluation of Criteria and Alternatives)Keshavarz Ghorabaee et al. [67]
CoCoSo (Combined Compromise Solution)Yazdani et al. [68]
Table 2. The boundary conditions for the model’s implementation with respect to the three design scenarios implemented.
Scenario 1
“Stand-Alone”
Scenario 2
New Toll Highway
Scenario 3
Green-WayNew Toll Highway
Population directly involved
(Mlns inhabitants)
1.51.02.5
Road length
(km)
127108235
Average speed
(km/h)
6011050110
Average travel time saved with respect to the current scenarioup to 21%up to 65%up to 5%up to 65%
Average fuel cost
(€/liter)
1.31.31.3
Highway toll
(cent.€/km)
00.7300.73
Table 3. The value of time (VOT) applied.
Vehicle TypesValue of Time (VOT)
[€/hour]
timecost)Passenger cars12
timecost)Freight vehicles30
Table 4. The path choice model estimation results.
AttributesPassenger CarsFreight Vehicles
βtimeRobust Std errRobust t-test0.048−2.0700.030−2.011
βcostRobust Std errRobust t-test0.204−7.8000.050−2.121
ParametersPassenger CarsFreight Vehicles
Adjusted rho-square0.6590.581
Final log-likelihood−34.142−31.103
Null log-likelihood−106.52−106.52
Table 5. The macro-economic trend model: the main application hypotheses considered to quantify the traffic demand evolution over time.
TrendPrudential HypothesesOptimistic Hypotheses
Resident population (from 2016 to 2056)Linear according to ISTAT population trends (from 2000 to 2016) [104]15% higher than the historical ISTAT 2000–2016 years trend
Gross Domestic Product (GDP)Linear regression starting the data observed in the period 2000–2019. Data observed in the International Monetary Fund provisions in the World Economic Outlook Database from January Equal to the average GDP of the European countries EU4 until 2019 and then constant (annual growth equal to that of 2019) for the analysis time period; according to a GDP growth of Italy which can make it closer to the main European countries
Fuel pump priceLinear regression starting the data observed in the period 2000–2019.Linear but 50% lower than that observed
Motorway tollsAs planned from transport operator in the business plan (annual increase of 1.50%)Reduced by 70% to the planned (annual increase of 1.05%)
Table 6. The macro-economic trend model estimation results.
Variables
(βi)
Passenger CarsFreight Vehicles
Traffic Demand
Elasticity
(βi)
Standard Errort-TestTraffic demand Elasticity
(βi)
Standard Errort-Test
GDP1.4580.4473.2601.3830.3347.124
Fuel−0.4170.159−2.631−0.3190.119−2.692
Toll−0.2660.114−1.423−0.1800.086−1.420
Population1.7450.9771.7381.6810.7802.251
Table 7. The macro-economic trend model estimation results.
Aggregate Statistics Passenger CarsFreight Vehicles
Adjusted rho-square0.5940.709
Standard error0.0320.024
Root Mean Square Error (RMSE) 0.0280.021
Mean Squared Error (MSE)0.0010.000
t-test11.81014.423
Table 8. Costs estimation for the best alternative (Scenario 3).
C1 Investment CostsC2 Operative and Maintenance CostsC3 Residual Value of the InvestmentTotal Costs
2018 prices and with fiscal corrections (M€)−2923.5−679.7336.4−3603.2
Constant prices and with fiscal corrections (M€)−3788.4−1525.81136.5−4177.7
Table 9. The average marginal air pollution costs for the Italian case study (source: processing starting from the data [86,104,105,106]).
Air Pollution Marginal Costs
[€ct per Vehicle*km, 2016 Prices]
2016202620362046
Urban areaCar1.160.690.570.56
Freight vehicles5.252.832.251.95
Bus19.5813.087.264.24
Sub-Urban AreaCar0.620.340.260.25
Freight vehicles2.821.431.080.88
Bus13.068.985.192.76
Rural AreaCar0.390.210.160.15
Freight vehicles1.820.820.570.43
Bus9.006.003.281.61
MotorwaysCar0.410.210.160.15
Freight vehicles1.660.710.470.33
Bus7.454.822.491.18
Table 10. Estimation of the external costs saved for the best alternative (Scenario 3), under both the optimistic and the prudential hypotheses.
The External Costs SavedDesign Scenario with Optimistic Hypothesis 2018 Prices (M€)%Design Scenario with Prudential Hypothesis 2018 Prices (M€)%
Climate Change63.66%38.45%
Air Pollution23.32%14.02%
Noise2.40%1.40%
Congestion72.67%43.05%
Accident872.081%693.885%
Up and downstream44.14%26.23%
Total1077.9100%816.8100%
Table 11. Multi-criteria analysis impacts assessment (source: processing starting from [80]).
ObjectivesCriteriaScenario 1-
Stand Alone
Scenario 2-
New Highway
Scenario 3-
New Highway +
Green-Way
ROAD EFFICIENCYInvestment costs (millions of €)−33−2824−2924
Management and maintenance costs (millions of €)N.A.−680−680
SERVICE PROVIDER BENEFITSRevenues (millions of total vehicles)N.A.243285
Business diversification (high = 1, medium = 0.66, low = 0.33)N.A.0.661
USERS BENEFITSCars generalized transport costs
(millions of hours saved)
8.5250275
Freight vehicles generalized transport costs (millions of hours saved)10.979112
ECONOMIC GROWTHTourism promotion: accessibility to inland historical centres (number)N.A.55
Tourism promotion: a new green-way road (high, medium, low)0.330.661
Freight centres and firms accessibility (number)N.A.88
QUALITY OF LIFEAccidents risk (millions of €)8113661608
Social cohesion (high, medium, low)0.330.661
LOCAL ENVIRONMENTAL BENEFITSPollution (millions of €)16772
Protected environmental areas
(number)
N.A.22842867
Hydrological risk areas (number)12181529
Landslide risk areas (number)10661338
GLOBAL ENVIRONMENTAL BENEFITSGlobal warming (tons of C02*1000)14830163459
Disability-Adjusted Life Years and usage of primary resources (millions of €)6112971480
Table 12. The ratio scale within the analytic hierarchy process (AHP) performed.
Intensity of ImportanceValue of Importance
Same weight1
Weakly greater weight compared to another one3
Greater weight compared to another one5
Demonstrated relevance compared to another one7
Absolute dominance compared to another one9
Intermediate values between two judgements2, 4, 6, 8
Table 13. First-round of “weights” defined by the stakeholders involved in the process for each criteria.
ObjectivesCriteriaCriteria Weight for Stakeholder Group 1
(Public)
Criteria Weight for Stakeholder Group 2
(Private)
ROAD EFFICIENCYInvestment costs1.215.7
Management and maintenance costs1.87.9
SERVICE PROVIDER BENEFITSRevenues from traffic1.311.6
Business diversification2.82.6
USERS BENEFITSCars generalized transport costs8.85.5
Freight vehicles generalized transport costs12.35.5
ECONOMIC GROWTHTourism promotion: accessibility to inland historical centres5.53.3
Tourism promotion: a new green-way road4.45.1
Freight centres and firms accessibility4.38.8
LIFE QUALITYAccidents risk11.78.6
Social cohesion42.3
LOCAL ENVIRONMENTAL BENEFITSPollution decrease13.04.0
Protected environmental areas7.21.8
Hydrological risk areas5.65.6
Landslide risk areas5.65.6
GLOBAL ENVIRONMENTAL BENEFITSGlobal warming4.51.0
Disability-Adjusted Life Years and usage of primary resources6.15.0
TOTAL100100
Table 14. Final and shared “weights” defined by the stakeholders involved in the process for each criteria and objectives.
ObjectivesCriteriaCriteria
“Weight”
Objectives “Weight”
ROAD EFFICIENCYInvestment costs8.513.3
Management and maintenance costs4.8
SERVICE PROVIDER BENEFITSRevenues from traffic6.59.2
Business diversification2.7
USERS BENEFITSCars generalized transport costs7.216.1
Freight vehicles generalized transport costs8.9
ECONOMIC GROWTHTourism promotion: accessibility to inland historical centres4.415.7
Tourism promotion: a new green-way road4.8
Freight centres and firms accessibility6.5
LIFE QUALITYAccidents risk10.213.3
Social cohesion3.2
LOCAL ENVIRONMENTAL BENEFITSPollution decrease8.524.2
Protected environmental areas4.5
Hydrological risk areas5.6
Landslide risk areas5.6
GLOBAL ENVIRONMENTAL BENEFITSGlobal warming2.88.3
Disability-Adjusted Life Years and usage of primary resources5.5
TOTALE100100
Table 15. The benefit/cost (B/C) ratio estimated and design alternatives comparison (median hypothesis).
Scenario 1 (Stand Alone)Scenario 2 (New Highway)Scenario 3 (New Highway +
Green-Way)
Benefit/Cost ratio 1.01.81.9
% variation with respect to the best scenario90.0%5.6%0%
Table 16. Measure of effectiveness (MOE) estimated related to the best design alternative (Scenario 3).
Optimistic HypothesisPrudential Hypothesis
rate of return r3.0%3.0%
NPV5113.9 M€1075.3 M€
B/C2.41.3
IRR8.9%5.0%
PBP21 years13 years
Table 17. Normalization of the evaluation matrix, sum of the impacts and comparison of the design alternatives (scenarios).
ALTERNATIVES
ObjectivesCriteriaScenario 1 Stand AloneScenario 2
New Highway
Scenario 3 New Highway +
Green-Way
ROAD EFFICIENCYInvestment costs0.0850.0030.000
Management and maintenance costs0.0480.0000.000
SERVICE PROVIDER BENEFITSRevenues from traffic0.0000.0550.065
Business diversification0.0000.0130.027
USERS BENEFITSCars generalized transport costs0.0000.0650.072
Freight vehicles generalized transport costs0.0000.0600.089
ECONOMIC GROWTHTourism promotion: accessibility to inland historical centres0.0000.0440.044
Tourism promotion: a new green-way road0.0000.0240.048
Freight centres and firms accessibility0.0000.0650.065
QUALITY OF LIFEAccidents risk0.0000.0860.102
Social cohesion0.0000.0160.032
LOCAL ENVIRONMENTAL BENEFITSPollution0.0000.0800.085
Protected environmental areas0.0000.0360.045
Hydrological risk areas0.0000.0450.056
Landslide risk areas0.0000.0450.056
GLOBAL ENVIRONMENTAL BENEFITSGlobal warming0.0000.0240.028
Disability-Adjusted Life Years and usage of primary resources0.0000.0240.028
TOTAL (SUM OF THE IMPACTS)0.1330.6830.840
% VARIATION WITH RESPECT
TO THE BEST SCENARIO
532%23%0%
Table 18. Comparison among the main results obtained for cost–benefit and multi-criteria analyses.
CBA vs. MCA
CBA result: % variation of the B/C ratio estimated for the first-best alternative (Scenario 3) and the second-best ones (Scenario 2)6%
MCA result: % variation of the weighted overall impacts produced by the first-best alternative (Scenario 3) and the second-best ones (Scenario 2)23%
Benefits percentage incidenceCBAMCA
User’s Benefits85.6%20.7%
Non-Users Benefits14.4%79.3%
ECONOMIC Growth (Tourism, Firms)-20.20%
-
QUALITY OF LIFE (accidents risk, social cohesion)
11.90%17.20%
-
LOCAL ENVIRONMENTAL BENEFITS (pollution, protected and environmental areas)
1.90%31.20%
-
GLOBAL ENVIRONMENTAL BENEFITS (CO2 equiv., DALY, resources)
0.50%10.70%
TOTAL100.0%100.0%
Publisher’s Note: MDPI stays neutral with regard to jurisdictional claims in published maps and institutional affiliations.

