Abstract
Speed is a quality measurement for travel, since it is related to traffic, safety, time, and economics. The speed limit on selected freeways in Kansas changed from 70 mph to 75 mph in the summer of 2011. In this study, the driver’s speed selection behavior was analyzed by considering average speed and 85th percentile speed in the before and after periods. Data from Automatic Traffic Recorders (ATRs) on the sections affected by speed limit increase and sections with no speed limit increase were analyzed. The t-test was applied to investigate if there was any significant difference in the speed of drivers on both treated and control sections. The Kolmogorov-Smirnov (K-S) test was also conducted to see if the distribution of speed data in the before period was different than after the period. The results showed that for the majority of the sections affected by speed limit change, there was a statistically significant difference in the 85th percentile speed of drivers during after period. Additionally, the K-S test results showed that the distribution of speed data in the before period was different than after the period for the majority of treated sections. The results indicated how drivers’ behavior was influenced by the speed limit increase.
1. Introduction
Speeding is a common habit for drivers. Exceeding the speed limit and driving too fast for conditions is one of the traffic violations that often happens on the roads. High speed causes safety problems for road users and increases air pollution and traffic noise. Speed limits are generally considered as the peak travel speeds under good weather conditions, uncongested traffic, and clear visibility. Appropriate speed limits are essential for ensuring safe highways and streets. In 2011, Kansas legislature passed the new maximum speed limit law on selected segments of freeways. Accordingly, more than 800 miles of freeways in Kansas saw a speed limit increase from 70 mph to 75 mph as the maximum speed limit on these sections. It was thought that drivers were already driving 5–10 miles above the posted speed limit and therefore it made sense to make it formal. Speed limit increase was expected to help the economic development of Kansas, via travel time savings. It was also pointed out that the higher speed limit would help make regulations match reality because many passengers drive faster in the open country anyway. On the other hand, opponents were saying that drivers would not change their behavior and would drive 5–10 miles more than the new posted speed limit, where higher speed might negatively influence safety and may increase the number and severity of crashes [1].
In the past, several research studies have evaluated the effect of a driver’s speed and its impact on traffic safety. The speed of a driver from one journey to another may not be the same and there could be circumstances that a driver is controlling a vehicle out of speed limit. For example, for one trip, the driver may need to reach his/her destination hastily or the driver may not have good enough concentration while driving and it would affect the speed of vehicle [2]. Speeding is the main problem in traffic safety and a driver’s age and sex are good predictors of selected speeds, and young drivers drive faster than old drivers. Additionally, male drivers are faster than female drivers and speed increases with vehicle power-to-weight ratio and decreases with the vehicle age [3].
Speed limit changes may have a significant impact on free-flow speed. According to a Canadian study conducted by Islam et al. [4], when the posted speed limit was reduced from 50 to 40 km/h, it resulted in a 4.9 km/h actual speed reduction after 6 months from the speed limit change. Elvik [5] considered speed limit changes for multiple research studies and understood that a 10 km/h change in the speed limit value could cause 2.5 km/h change in the mean speed, which shows that speed limit change has influenced the actual driver’s speed.
Silvano and Bang [6] considered the impact of speed limit changes on free-flow speeds in urban areas in Sweden. Standard deviation, 85th percentile speed, and confidence interval for mean free-flow speed were identified and a two-sample t-test was applied for the analysis to observe statistically significant changes in the mean free-flow speed after speed limit decrease. The results depicted that a decreased Posted Speed Limit (PSL) caused a small reduction in the mean free-flow speed and speed variance, which was statistically significant and led to a 10% reduction of severe injury accidents. Additionally, the PSL reduction had a larger effect on faster drivers and higher capacity highways.
Brown et al. [7] performed speed data analysis when the speed limit raised from 55 mph to 65 mph in Alabama. The speed study revealed that around half of the vehicles exceeded the PSL on the rural interstates after the speed limit increase. Najjar et al. [8] evaluated the 85th percentile speed according to the before and after posted speed limit increases in Kansas from 55 mph to 60 mph in March 1996. The 85th percentile speed in the before period was compared to the after period, where the two-tailed t-test was employed to investigate if a statistically significant difference in 85th percentile speed between before and after speed data could be seen at 95% confidence level. The results showed that there was a statistically significant difference between before and after speed limit increases. Shirazinejad and Dissanayake [9] analyzed the speed characteristics before and after the speed limit increases using a t-test. The results showed that there was a statistically significant increase in the 85th percentile speed of drivers after speed limit increases compared to the before period.
Binkowski et al. [10] evaluated speed characteristics when the speed limit increased from 65 mph to 70 mph for freeways in Michigan. According to the authors, there was an increase in both average and 85th percentile speeds for some of the test sites, but the statistical significance of the change in speed was not possible to be observed, because the sample size was so large.
In Iowa, the speed limit on most of the rural interstates changed from 65 mph to 70 mph in 2005. The speed data were available for 11 months before the speed limit change and 18 months after. To test the statistical significance of the 85th percentile speed, a generalized regression model was implemented to identify if speed limit change has been significant or not. It was known that on the rural interstates, the mean and 85th percentile speeds increased by about 2 mph and the increases were statistically significant [11]. Aronsson and Bang [12] also used linear regression models for predicting the mean speed on various road types according to their facility type, such as arterial and multilane highways in rural or urban roads. Further, statistical analysis approaches such as t-test is commonly used for speed analysis during the before-and-after comparisons based on the safety impacts of speed limit changes and it showed statistically significant difference after speed limit increase in Texas [13].
There are several ways of collecting speed data in each state in order to conduct speed data analysis. For example, Wang [14] utilized the Global Positioning System (GPS) data from vehicles to estimate operating speeds on low-speed urban roads in Georgia. So, collecting the speed data in each state is different and it depends on the most appropriate and available facilities.
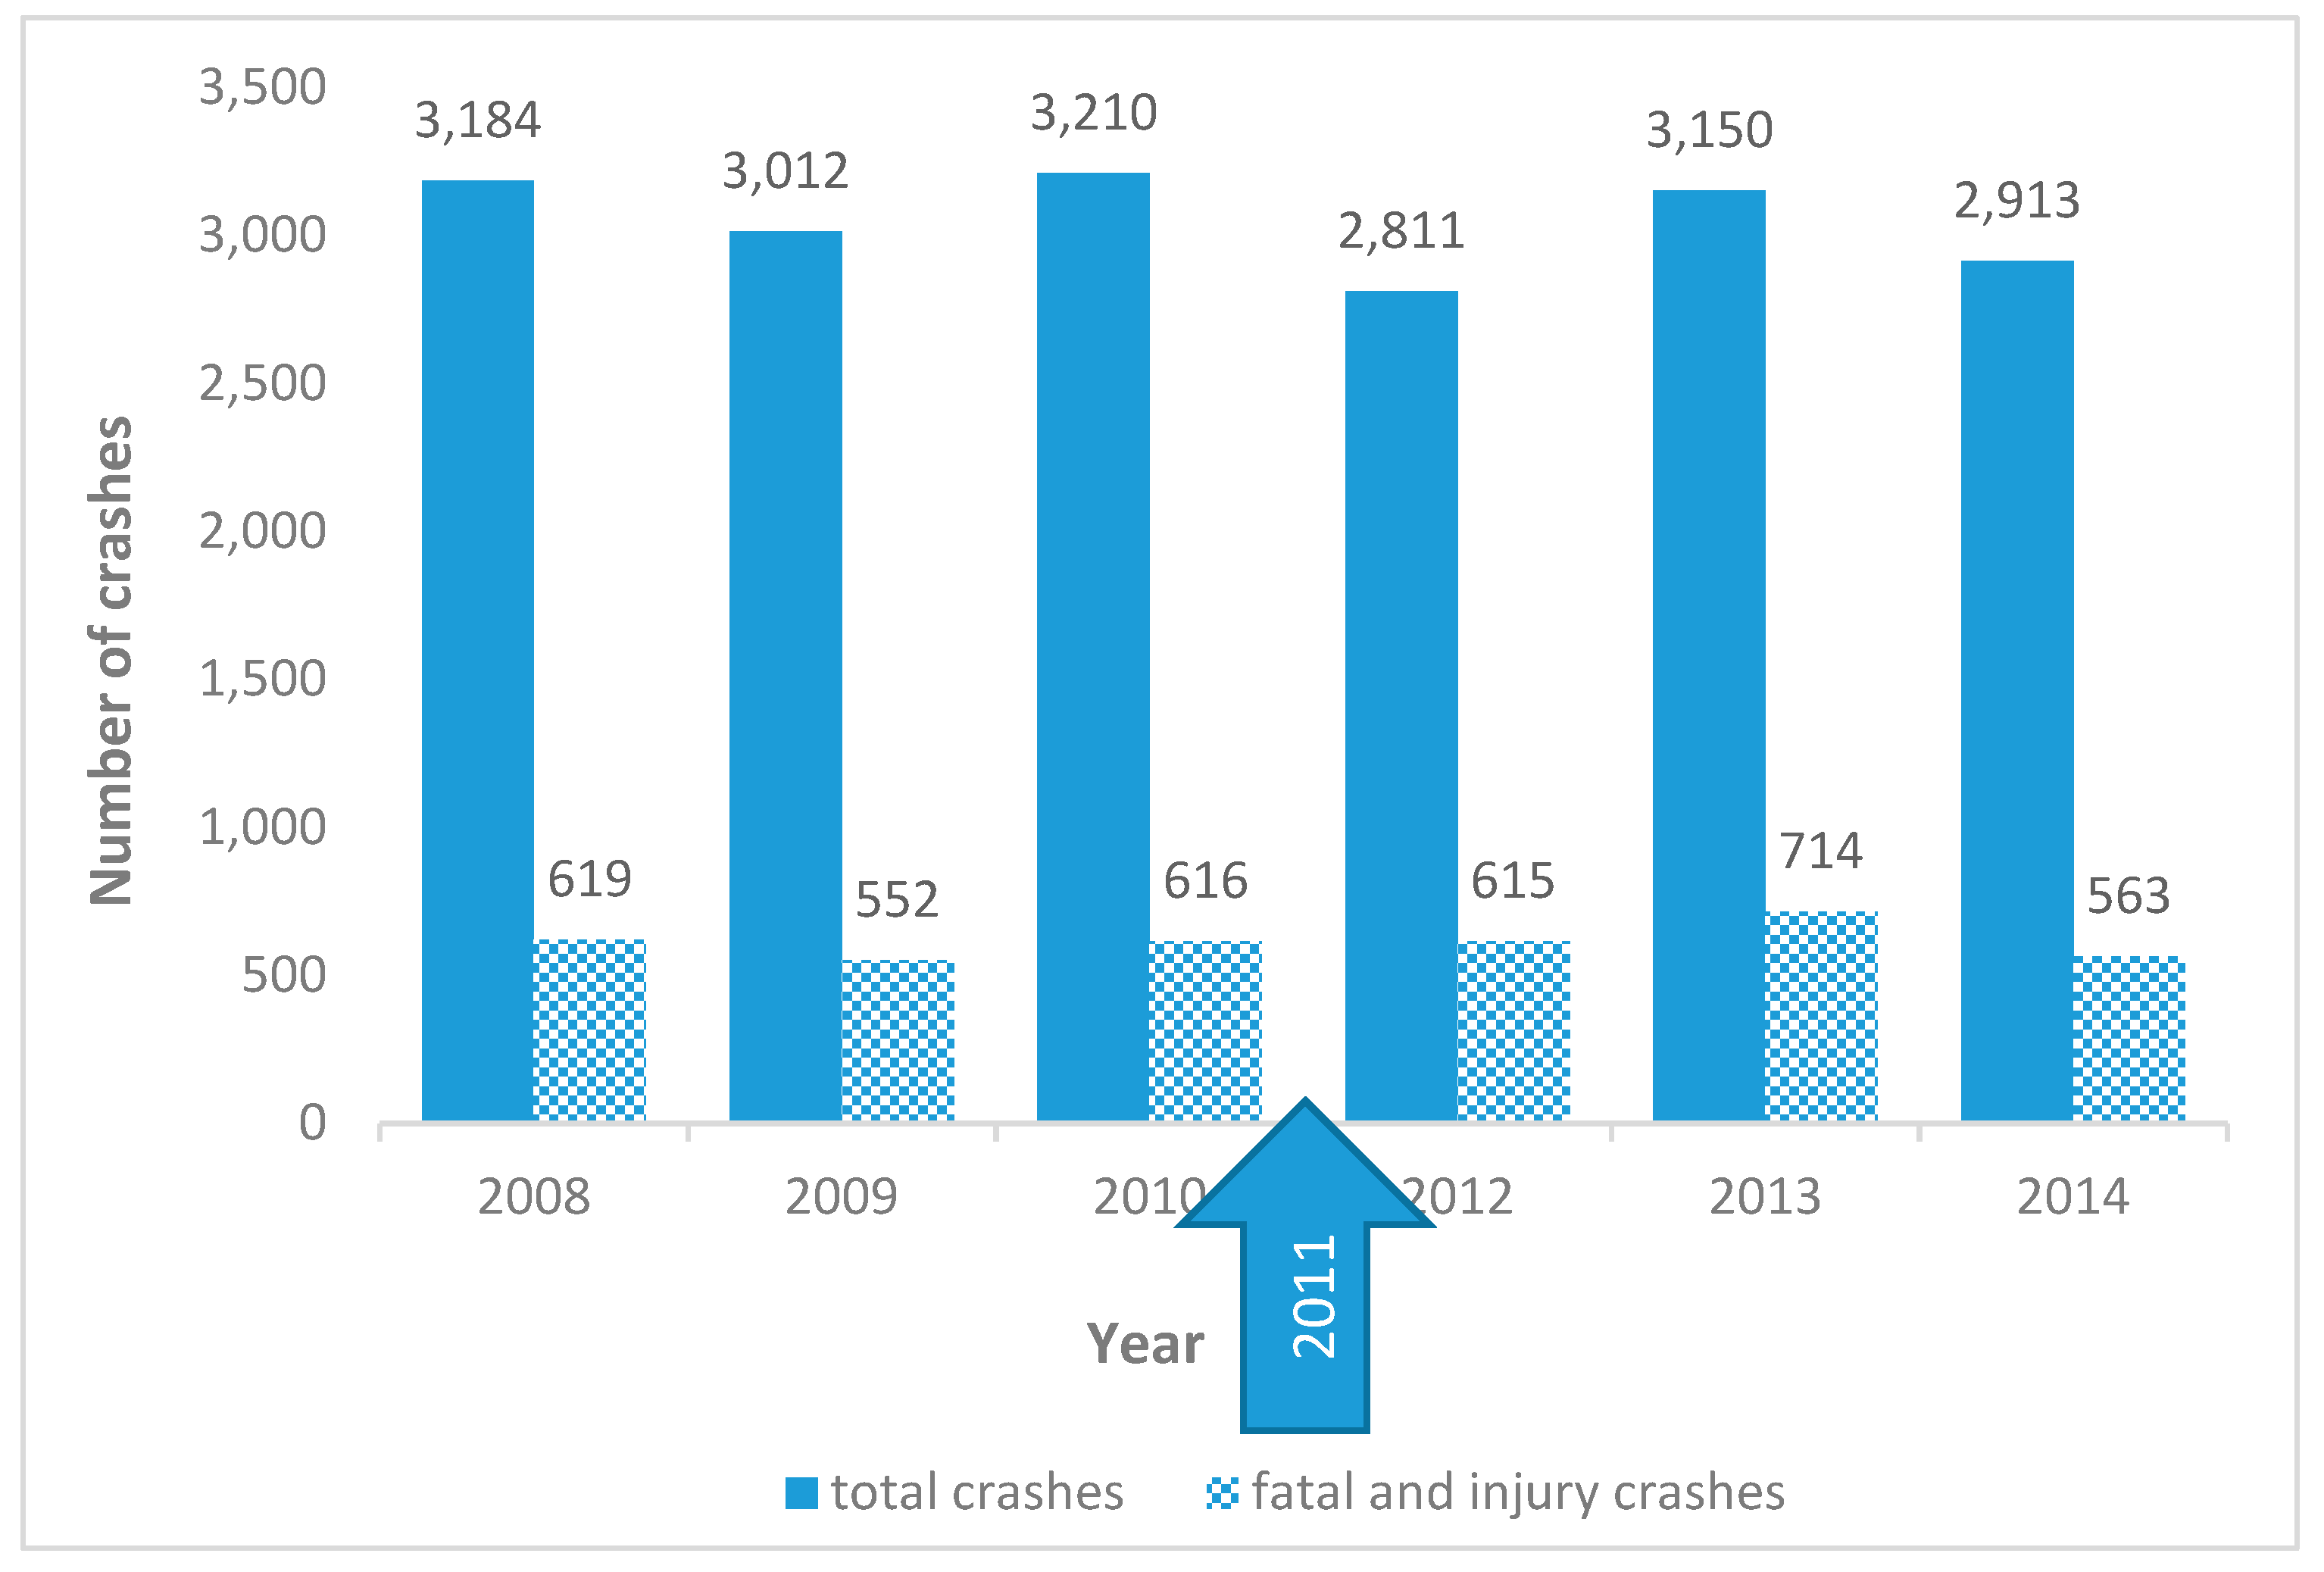
Therefore, the goal of this study is to examine the effect of speed limit increase on actual speeds of vehicles and viewing the drivers’ speeding behavior on rural and urban highways affected by speed limit increase. Additionally, there is some information about the crash statistics in the before period and after a period, which is shown in Figure 1.

Figure 1.
Crash distribution before and after speed limit change.
The Figure 1 represents how speed limit increase caused changes in the total number of crashes and fatal and injury crashes. However, the increase exists in the before period, too, and needed further crash data analysis for an accurate conclusion, in which some crash data analysis methods are recommended. In this study, the main focus is analyzing the speed characteristics to understand if the speed limit increase has significantly affected the drivers’ speed selection behavior, because the higher operating speeds may eventually affect the traffic safety and sustainable transportation system.
2. Methodology
To check if there are any statistically significant differences in the before period compared to after period, the two-tailed t-test is applied. On the other hand, the Kolmogorov-Smirnov(K-S) test is also conducted to see if the speed data distribution during the before speed limit increase is different than after the period or not.
2.1. Data
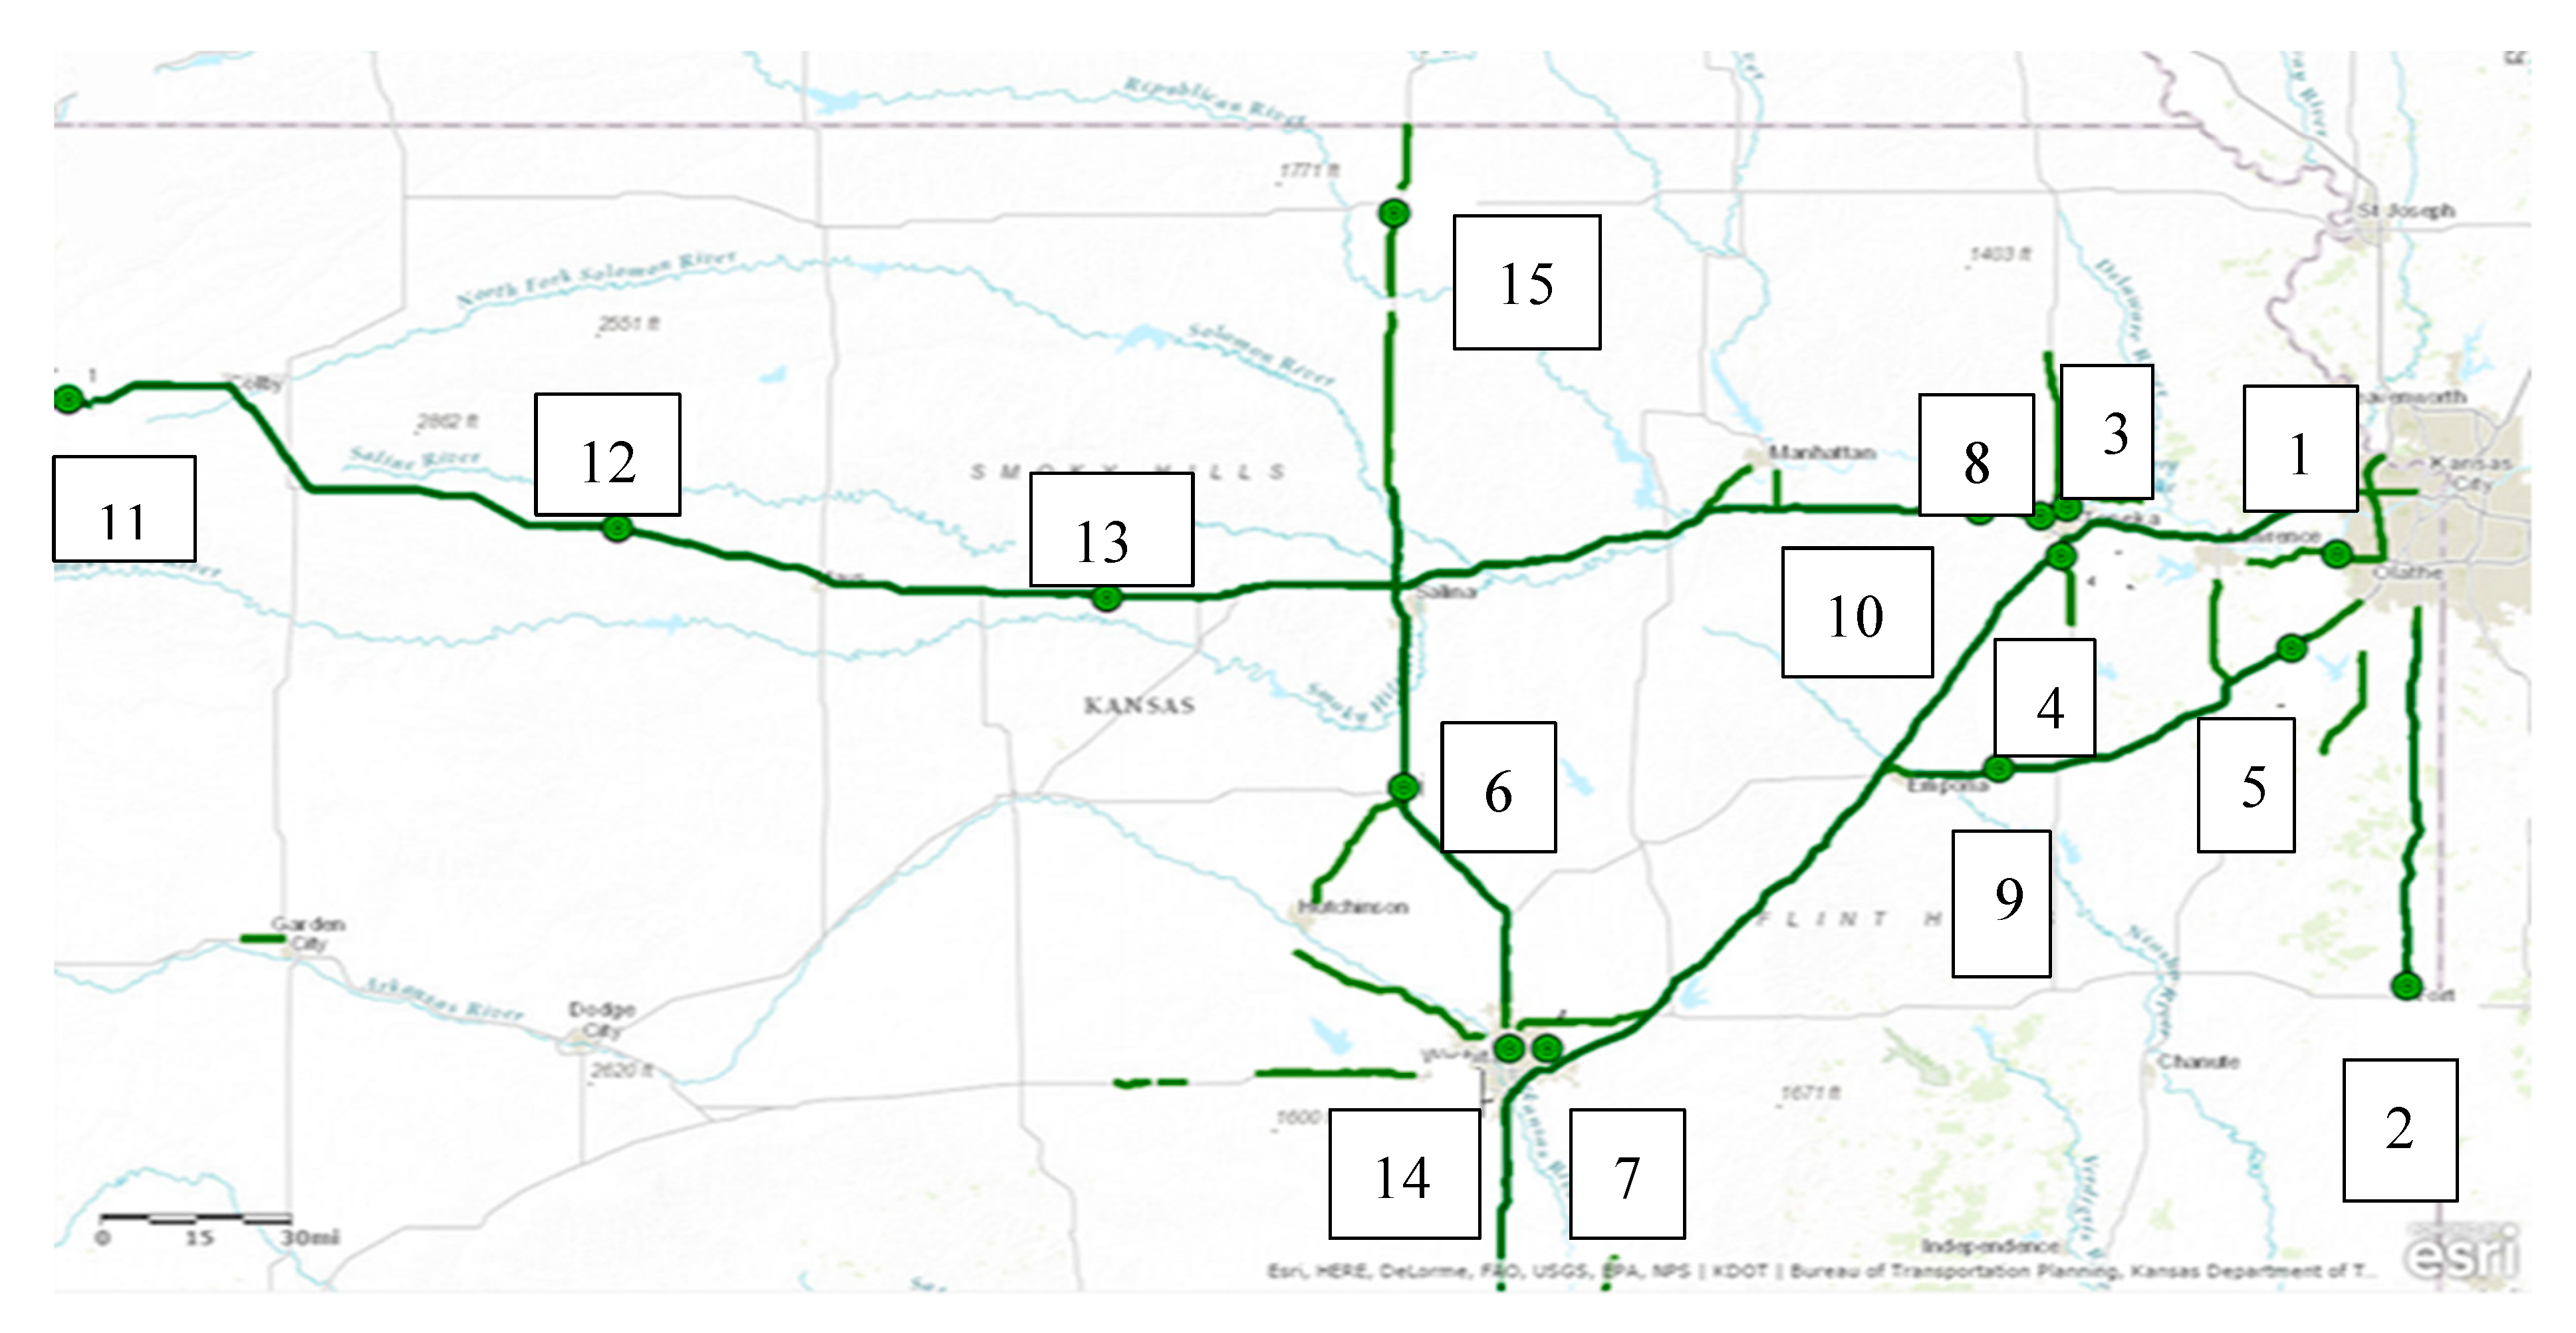
There are Automatic Traffic Recorders (ATRs) in Kansas that record the number of vehicles passing per hour in different speed ranges automatically. In this study, comparison site selection was selected based on matching, as closely as possible, the geometric characteristics, volume, and speed characteristics of the experimental sites (sites studied by the highway agencies for speed limit revisions). Furthermore, the sections less than 0.5 miles were not selected according to Highway Safety Manual [15] recommendations, and geographic and urban or rural conditions were also important for identifying the sections. Accordingly, 27 sites were selected as control sites (sites with 70 mph speed limit) and 39 sites as treated sites (sites with 75 mph speed limit). According to the speed data, there are some available ATRs located on control sites and treated sites to collect the speed data. The location of each ATR is plotted in Figure 1. The location of each ATR and the number of vehicles in different speed bins starting from 40 mph to 95 mph in divisions of 5 mph such as 40 mph-45 mph, 45mph -50mph, and so forth are obtained from Kansas Department of Transportation (KDOT). To analyze the speed characteristics, it was decided to compute and compare both average speed and 85th percentile speed but the 85th percentile speed is more common among traffic engineers as the main factor for evaluating the operating speeds [6]. So, the 85th percentile speed increase suggests that most drivers were affected by speed limit change and they continued driving at a higher speed more than they felt comfortable than the previous speed limit. The locations of ATRs are shown in Figure 2.

Figure 2.
Location of selected Automatic Traffic Recorders on freeway segments.
Each ATR provided the number of vehicles passing the location and the speed distribution in one-hour time intervals for one year before speed limit change (2010) and one year after the change (2012). However, the data for the year 2010 was not available for all months. So, it was decided to compare each ATR data based on the available months in the year 2010 with the same corresponding months in the year 2012. The identification label of each ATR along with the availability of data during before and after speed limit increase are tabulated in Table 1.

Table 1.
ATR characteristics with available data for before and after speed limit change.
2.2. Two-Tailed t-Test
The two-tailed t-test is applied in this study for comparing 85th percentile speed and average speed in the before period and after periods. The two-tailed t-test is employed to identify whether a statistically significant difference exists in speeds between the before period and after the period at a 95% confidence level. To apply the t-test, some assumptions need to be met, which are listed as follows [16]:
- The observations from two groups (before period and after the period) are normally distributed.
- The variances of two groups are checked to see whether they are equal or not.
- The observations in each group are independent of each other.
The critical t-value is selected from the standard tables of t-values based on the significance level (95%) and the degree of freedom. The comparison of calculated t-value with critical t-value determines whether the null hypothesis can be rejected at 95% confidence level or not. The t-test procedure of STATA software [17] was also utilized in this research to compute the t-values.
The p-value is the primary factor for the t-test on validating the null hypothesis; which is interpreted as when the p-value is less than 5%, the null hypothesis is rejected and the alternative hypothesis would be accepted at 95% confidence level. On the contrary, when the p-value is greater than 5%, the alternative hypothesis is rejected and the null hypothesis would be accepted at a 95% confidence level [18].
2.3. Kolmogorov-Smirnov (K-S) Test
The Kolmogorov-Smirnov (K-S) test is also applied in this study since the sample size is large. The K-S test is based on the Empirical Distribution Function (EDF). This test is defined for comparing two different data distributions of sizes m and n, and the hypothesis test for checking two different distributions is as follows [19]:
- : The distribution for one set of data is the same as the second set of data
- : The distribution for one set of data is different than the second set of data and the Kolmogorov-Smirnov test statistic is defined as:where,
- = the test statistic for the difference between two distributions
- & = empirical distribution functions for the first and second samples
- Sup = supremum function
- n, m = sizes of first and second sample, respectively.
The null hypothesis that the distribution of two sets of data is the same was verified through applying R software package [20], which is very common to apply for K-S test and check if the probability (p-value) is greater than 0.05 at 95% confidence level, otherwise, there is no evidence that the two sets of data come from the same distribution.
3. Results
3.1. Two-Tailed t-Test Results
The frequency distribution curves of all available ATRs were drawn and the test of normality for each ATR was conducted separately. The ATRs 6 and 11 were not normally distributed and they were removed. So, the speed analysis was carried out for the remaining ATR locations, which were normally distributed for both before and after periods. Table 2 presents the 85th percentile speed and two-tailed t-test results for 13 ATRs that include both treated sites and control sites. The sample sizes in the before period are different than the after period and the F-test results also showed that the variances of two groups of data in the before period is not equal to the after period. The final results are summarized in Table 2 and the statistical significance results are also identified at a 95% percent confidence level according to the STATA statistical software package.
Table 2.
Results of the two-tailed t-test for 13 ATRs during before and after speed limit change (85th percentile speed).
According to the two-tailed t-test results presented in Table 2, the 85th percentile speed increased on the majority of the sections after the speed limit increase. Additionally, the results show that the 85th percentile speed increase in both treated and non-treated sections is statistically different from each other in the before period compared to the after period.
The statistically significant difference between before and after the period for all of the sections is due to the large sample size in this research, that any change in 85th percentile speed would be significant as recognized by previous research as well [10]. The t-test results for the average speed are also presented in Table 3.
Table 3.
Results of the two-tailed t-test for 13 ATRs during before and after speed limit change(Average speed).
According to Table 3, there is also an increase in the average speed of vehicles in the after period compared to the before period for the treated sections and not much change in the control sections. However, ATR#3 shows a decrease in average speed in the after period compared to the before period and this is because of the large sample size in the after period versus the before period. Since the sample size is too large, the K-S test is recommended to be conducted in this study in order to obtain better results [10]. In addition, since the two-tailed t-test results may not be very satisfying and may not help to identify if the speed limit increase has had any more prominent effect on treated sites than non-treated sites, the K-S test, which is commonly used to compare two different distributions with large sample size is employed and the results are shown in Section 3.2.
3.2. K-S Test Results
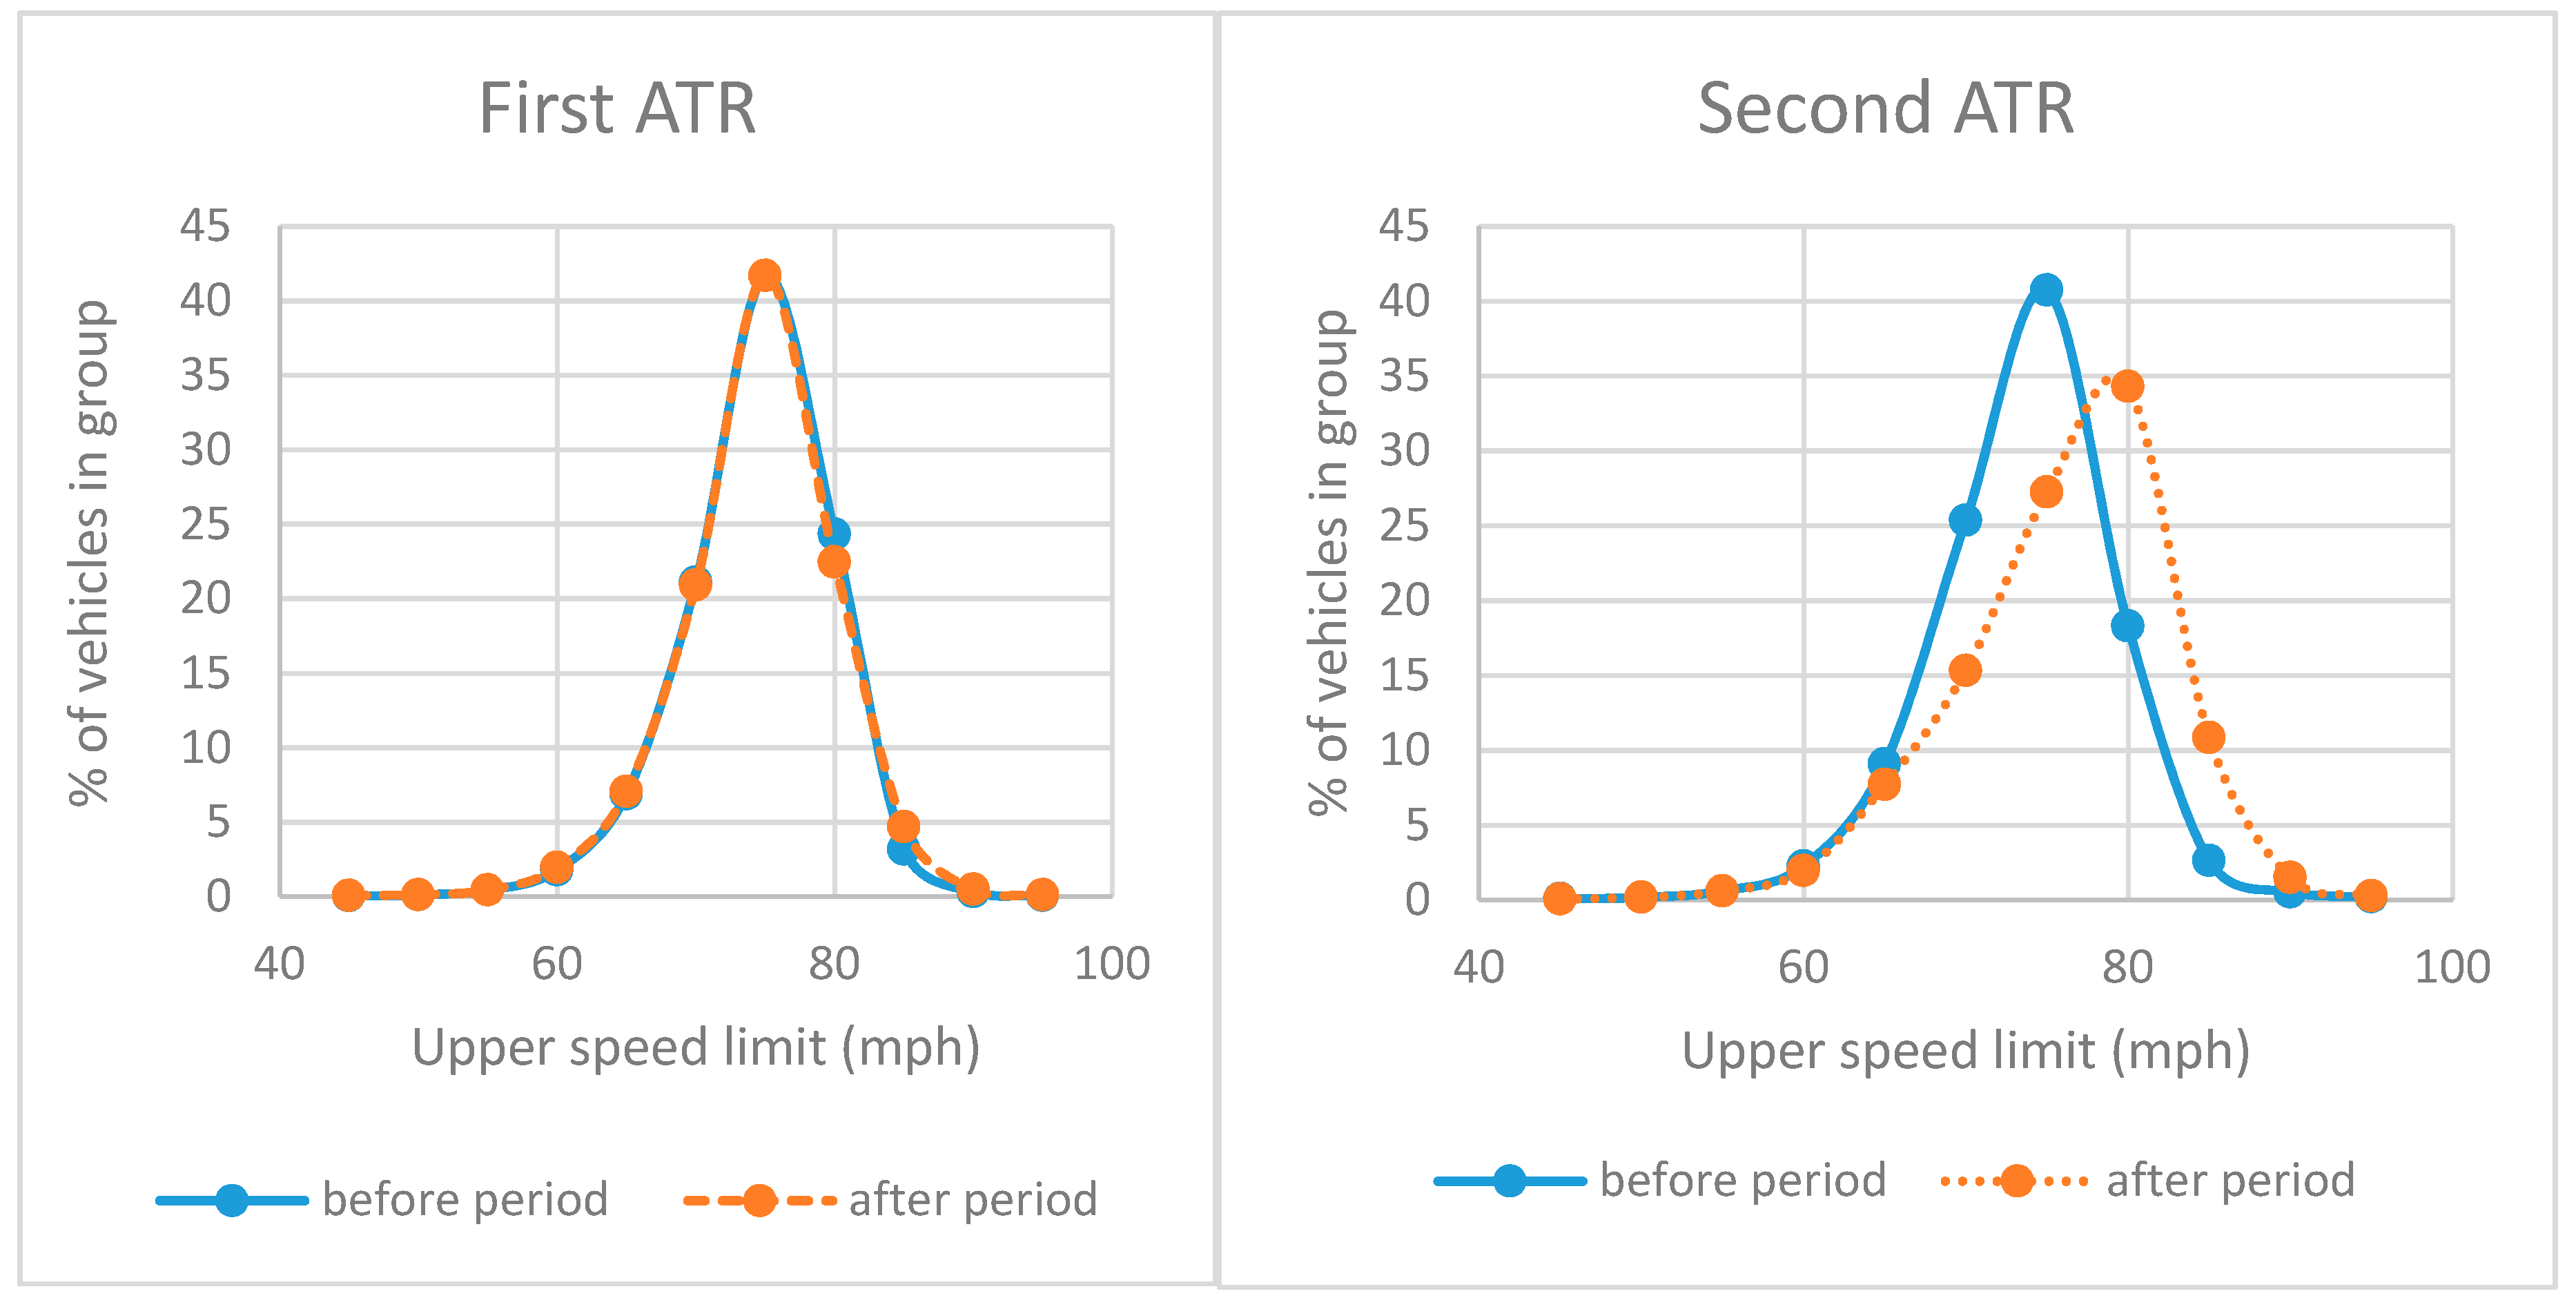
The K-S test is applied to check if two sets of speed data are differently distributed or not. For this purpose, as an example, the first two ATRs distribution curves are presented in Figure 3 to show how speed data is differently distributed.

Figure 3.
Sample K-S test distributions for the first two ATRs during before and after periods.
According to Figure 3, it is obvious that the speed distribution during the before period for the first ATR is similar to the after period and there is no difference between before and after speed limit increase. However, the speed distribution during the before period for the second ATR is differently distributed compared to the after period and this means that the drivers’ speed in the before speed limit increase is not equal to the drivers’ speed during the after speed limit increase. To evaluate the statistically significant difference of the remaining ATRs in the before period compared to the after period, the K-S test application of R software package is used to obtain the test statistic (D), and critical D along with the probability value (p-value) for identifying the statistically significant difference between the before and after period speed limit increase and the results are summarized in Table 4.
Table 4.
K-S test results with test statistic, critical D, and corresponding p-values for available ATRs.
According to the results from Table 4, it is clear that the speed data for the majority of treated sites, which are affected by speed limit change, is differently distributed and there is a statistically significant difference between the before and after speed limit increase. However, there is only one treated site that belongs to ATR 3 and it shows that there is no statistically significant difference in the before period compared to the after period. The reason for this matter could be because the sample size in the after period is much larger than the before period and it may not help to compare the significant difference easily. On the other hand, there is no statistically significant difference in the speed data distribution for control sites that are not affected by speed limit increase and it is understood that speed limit increase has had an effective impact on drivers’ behaviors in the before period versus the after period.
4. Discussion and Conclusions
This study suggests that the impact of speed limit increase on the 85th percentile speed is considerable, and results showed that the speed limit change caused an increase in drivers’ speed for the majority of the freeway section influenced by speed limit increase during the after period. Moreover, this increase was statistically significant in all of the places that ATRs did exist after the speed limit change. In addition, the 85th percentile speed and average speed increase among all sites have been statistically significant during the after period compared to the before period based on t-test results.
In order to have better results, the K-S t-test was applied and depicted the speed data distribution in the after period and was statistically different than the before period for the majority of the treated sections after speed limit increase. On the other hand, the speed data distribution for all of the control sites that were not influenced by speed limit increase did show no statistically significant difference between the before and the after period. The statistical significance of the change for all of the locations in the before and after analysis according to a two-tailed t-test could be because the sample size for this research is very large that any change in 85th percentile speed would be significant as recognized by previous research as well [10].
In this research, there were not enough ATRs at all of the treated and control sections influenced by the speed limit increase. If there are more available ATRs, the comparison of drivers’ speeds for the sections with speed limit increase versus without speed limit increase could give more detailed results as the future research. Additionally, crash data analysis may be used in the future for comparing total and fatal and injury crashes in the before period versus after period. Overall, the speed limit increase has had significant increases in drivers’ speed and caused a significant change in their behavior based on the new speed limit in Kansas. In conclusion, in order to have a safe and more sustainable transportation system, any new changes that are happening on the roadway sections are needed to be considered and new countermeasures could be applied if needed.
Author Contributions
S.D. wrote the proposal for the project and received the funding to conduct the research. The analysis was developed by R.S.S. R.S.S. wrote the first draft of the manuscript. All authors have read and agreed to the published version of the manuscript.
Funding
This project was supported by the K-TRAN program of the Kansas Department of Transportation and the writers wish to acknowledge the assistance provided by the project monitor, Steven Buckley. The authors also wish to thank Tina Cramer for providing the data needed for conducting this study.
Conflicts of Interest
The authors declare no conflict of interest.
References
- Kansas Legislature Conference Committee. Kansas to Raise Rural Interstate Speed Limits to 75 MPH. April 2011. Available online: www.thenewspaper.com/news/34/3448.asp (accessed on 29 May 2017).
- Haglund, M.; Åberg, L. Speed choice in relation to the speed limit and influences from other drivers. Transp. Res. Part F Traffic Psychol. Behav. 2000, 3, 39–51. [Google Scholar] [CrossRef]
- Quimby, A.; Maycock, G.; Palmer, C.; Buttress, S. The Factors the Influence a Driver’s Choice of Speed: A Questionnaire Study; Transport Research Laboratory: Berkshire, UK, 1999. [Google Scholar]
- Islam, M.T.; El-Basyouny, K.; Ibrahim, S.E. The Impact of Lowered Residential Speed Limits in the City of Edmonton. In Proceedings of the Transportation Research Board 92nd Annual Meeting, Washington, DC, USA, 13–17 January 2013. [Google Scholar]
- Elvik, R. A restatement of the case for speed limits. Transp. Policy 2010, 17, 196–204. [Google Scholar] [CrossRef]
- Silvano, A.P.; Bang, K.L. Impact of Speed Limits and Road Characteristics on Free-Flow Speed in Urban Areas. J. Transp. Eng. 2015, 142, 04015039. [Google Scholar] [CrossRef]
- Brown, D.B.; Maghsoodloo, S.; McArdle, M.E. The Safety Impact of the 65 mph Speed Limit: A Case Study Using Alabama Accident Records. J. Saf. Res. 1991, 21, 125–139. [Google Scholar] [CrossRef]
- Najjar, Y.M.; Stokes, R.W.; Russell, E.R.; Ali, H.E.; Zhang, X. Impact of New Speed Limits on Kansas Highways; Publication K-TRAN: KSU-98-3; K-TRAN Report; Kansas Department of Transportation: Topeka, KS, USA, 2000. [Google Scholar]
- Shirazinejad, R.S.; Dissanayake, S. Analysis of Speed Characteristics before and After Speed Limit Change. In Proceedings of the Transportation Research Board 97th Annual Meeting, Washington, DC, USA, 7–11 January 2018. [Google Scholar]
- Binkowski, S.; Maleck, T.; Taylor, W.; Czewski, T. Evaluation of Michigan 70-mph Speed Limit. Transportation Research Record. J. Transp. Res. Board 1998, 1640, 37–46. [Google Scholar] [CrossRef]
- Souleyrette, R.R.; Stout, T.B.; Carriquiry, A. Evaluation of Iowa’s 70 Mph Speed Limit: 2.5 Year Update; CTRE Project 06-247; Centre for Transportation Research and Education, Iowa State University: Ames, IA, USA, 2009. [Google Scholar]
- Aronsson, K.F.; Bang, K.L. Speed Characteristics of Urban Streets Based on Driver Behavior Studies and Simulation Including Pedestrian Movements. In Proceedings of the Transportation Research Board 86th Annual Meeting, Washington, DC, USA, 21–25 January 2007. [Google Scholar]
- Brackett, Q.; Ball, K. The Safety Impact of the 65 mph Speed Limit in Texas: A Thirty-Six Month Evaluation; Human Factors Division, Texas Transportation Institute, Texas A & M University: College Station, TX, USA, 1990. [Google Scholar]
- Wang, J. Operating Speed Models for Low-Speed Urban Environments Based on In-Vehicle GPS; Publication UMI-32-12319; Northwestern University: Evanston, IL, USA, 2006. [Google Scholar]
- AASHTO. Highway Safety Manual; American Association of State Transportation Officials: Washington, DC, USA, 2014; Volume 1. [Google Scholar]
- Brandt, S.; Brandt, S. Data Analysis: Statistical and Computation Methods for Scientists and Engineers; Springer: New York, NY, USA, 1999. [Google Scholar]
- Stata Statistical Software: Release 14; Stata Corp: College Station, TX, USA, 2015.
- Montgomery, D.C.; Runger, G.C.; Humble, N.F. Engineering Statistics; John Wiley and Sons, Inc.: New York, NY, USA, 2009. [Google Scholar]
- Pham, H. (Ed.) Springer Handbook of Engineering Statistics; Springer Science & Business Media: Berlin, Germany, 2006. [Google Scholar]
- R Development Core Team. R: A Language and Environment for Statistical Computing; R Foundation for Statistical Computing: Vienna, Austria, 2013; Available online: http://www.R-project.Org (accessed on 15 May 2018).
© 2020 by the authors. Licensee MDPI, Basel, Switzerland. This article is an open access article distributed under the terms and conditions of the Creative Commons Attribution (CC BY) license (http://creativecommons.org/licenses/by/4.0/).