Abstract
In order to grasp the building palisade structure tightness of indoor particulate matter mass concentration based on the particle penetration mechanism and settlement characteristics, this article analyzes the measurements of two different types of building air tightness of a Shenyang university office building in terms of indoor and outdoor particulate matter mass concentration levels from 2016-1-09 to 1-22, 2016-7-18 to 8-03, and 2017-2-28 to 3-13. The building outside the closed window that had no indoor source condition, the indoor office building and outdoor particle mass concentration, and the aperture size and shape of the envelope were analyzed to carry on the numerical simulation research by Fluent software, which was then analyzed; the results reveal that the measuring point of the I/O ratio is less than point B of the I/O ratio, measurement points of A linear regression fitting degree is lower than the fit of the measuring point B, and the causes for the measuring point A tightness (level 8) is superior to the measuring point B (level 4). When the gap height h is greater than 0.5 mm, the penetration rate of particles within the range of 0.25–2.5 μm particle size is close to 1. In different gap depths, the penetration rate of particles within the range of 0.1–1 μm particle size was close to 1. In diverse pressure difference, the 0.25–2.5 μm particles within the scope of penetration rate P is close to 1, the gap on both sides of the differential value ΔP; the greater the particle, the higher penetration rate. The larger the right-angle number of gap n, the lower the penetration rate of particles. The L-shaped gap and U-shaped gap have significantly better barrier effects in larger and smaller particles than the rectangular gap. The research results in this paper can help people understand and effectively control the influence of outdoor particles on the indoor air quality and provide reference data for the prediction of indoor particle mass concentration in buildings, which has theoretical basis and practical significance.
1. Introduction
In recent years, haze has occurred frequently in most areas of China, and outdoor air pollution has become serious. From the statistics of PM2.5 and PM10 on the pollution in the 2015–2017 Bulletin of the State of the environment of China [1] and the 2015–2017 Bulletin of the State of the environment of Shenyang [2], it was observed that the annual average of the PM2.5 mass concentration in China and Shenyang decreased from 72 to 51 μg/ m3 and 50 to 43 μg/m3 and the average of the PM10 mass concentration decreased from 115 to 88 μg/m3 and 87 to 75 μg/m3. Although the pollution situation of the outdoor atmospheric particulate matter in China and Shenyang has been improved to some extent, it is still about 1.2 times higher than the current national standard for “Ambient air quality standards” GB3095-2012 [3], and the pollution level of PM2.5 and PM10 in Shenyang is significantly higher than the national average. Relevant research shows that the increase in human mortality and morbidity has a significant relationship with human exposure to particulate matter [4]. The increasing incidence of lung and cardiovascular diseases is linked to increased concentrations of particulate matter, every 10% increase in the concentration of PM2.5 in the air, leading to an increase in lung function by about 1% and increase in the incidence of various respiratory illnesses by about 10% [5].
In modern societies, urban residents spend more than 90% of their time indoors. Therefore, people pay more and more attention to indoor air quality [6]. Indoor particulate matter pollution is more harmful to human health than outdoor particulate matter pollution. The particulate matter in indoor air has become one of the important factors affecting indoor air quality and indoor health. In modern office buildings, outdoor pollution sources rather than indoor sources are the main factors affecting indoor particulate pollution [7]. The study found that when there was no significant indoor particulate pollution source, 60–70% of the indoor PM2.5 mass density came from the outdoor particulate pollution [8]. When there were indoor pollution sources, 55–60% of the indoor PM2.5 mass concentration came from outdoor particulate pollution. The study showed that the monthly mean values of the indoor and outdoor PM2.5 mass concentration at the measurement points in summer were 104.1 and 49.2 μg/m3, respectively, which were lower than the winter mass concentration of 230.1 and 134.2 μg/m3, and the I/O ratio of indoor PM2.5 in summer was also significantly lower than the winter value [9]. The study found that the indoor PM2.5/ PM10 ratio was higher than the outdoor PM2.5/ PM10 ratio, the indoor PM2.5 concentration was higher than the outdoor concentration, and the indoor PM2.5 concentration was higher than the outdoor concentration. The indoor particulate pollutants were mainly PM2.5 [10]. The study found mild haze weather in summer, and the weekly average mass concentration of PM2.5 in buildings was 135.1 μg/m3; and in the moderate haze weather in winter, the weekly mean mass concentration of PM2.5 in buildings was 231.6 μg/m3 [11].
This paper selected Shenyang, a typical city in a severely cold region, as the research object. As public buildings are the main gathering place of urban residents, many people were involved, it was easy for pathogens to gather, and the cross-infection rate was high. Therefore, it was necessary to study the indoor air pollution in public buildings. Therefore, the measurement point A (in the air tightness grade 8 green buildings) and point B (in the air tightness level 4 non-green building) of the two office buildings with different airtightness were selected from a university in Shenyang for actual measurement, according to the measured building palisade structure gap type; the calculation model was set up through a mathematical statistical analysis method where the fluent software numerical simulation method was used for particulate matter under the conditions of different influence factors to simulate the penetration coefficient changes with the particle size. The analysis of the influence of factors such as the gap geometry, size, and the pressure difference of indoor and outdoor on penetration coefficient were also conducted. It provided regional basic data for setting the PM2.5 limits of indoor air standards in China, provides a reference basis for the study of outdoor particulate barrier performance of buildings with different air tightness levels and the improvement of indoor environmental quality of buildings, and provides relevant research results for ensuring human health.
2. Materials and Method
2.1. Sampling Sites
In this paper, two office buildings with different air tightness located in the campus of a university in Shenyang city were selected as the measured objects, and three measured points were implemented, namely, the measured points A and B (indoor) and C (outdoor), respectively. These are shown in Figure 1, the measured situation is shown in Table 1. Measuring point A is located in the meeting room (1st floor) within the main facade facing north, and the building structure is a frame structure with an area of 45 m2. Measuring point B is located in the equipment room (2nd floor) facing south of the main facade. The building structure is a brick-concrete structure with a building area of 50 m2. Survey of points A and B are shown in Table 2.
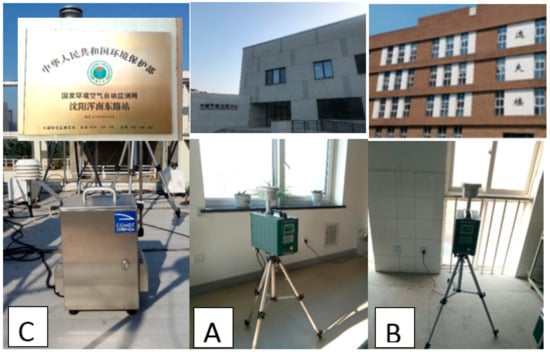
Figure 1.
Survey of points A, B, and C.

Table 1.
Survey overview.
Table 2.
Survey of exterior windows of observation points [12].
2.2. Sampling Methods and Instruments
During the measurement period, there was no obvious pollutant source in the measuring point, and during the test period, there was no personnel activity in the measuring point and the external windows and ventilation equipment were closed. Therefore, it can be approximately considered that there was no obvious particle source at the measuring points A and B. The measuring points were arranged in accordance with the national standards for “Indoor air quality” GB/T18883-2002 [13]. The detection method followed the industry standard for “Technical requirement and test procedures for total suspended particulates sampler” HJ/T374-2007 [14], “Total Suspended Particulates Sampler” JJG 943-2011 [15], “Determination of atmospheric articles PM10 and PM2.5 in ambient air by gravimetric method” HJ618-2011 [16], “Specification and Test procedures for (PM10 and PM2.5) sampler” HJ93-2013 [17] and the European Union standards for “atmospheric total suspended particle sampler” regulation. The daily average mass concentration of indoor and outdoor particulate matter in office buildings was measured using the gravimetric method. The measurement instruments used were the Lao ying 2030 intelligent TSP sampler and the COMDE DERENDA particles sampler, instrument appearance (Figure 2 and Figure 3), instrument measuring range and accuracy (Table 3 and Table 4).
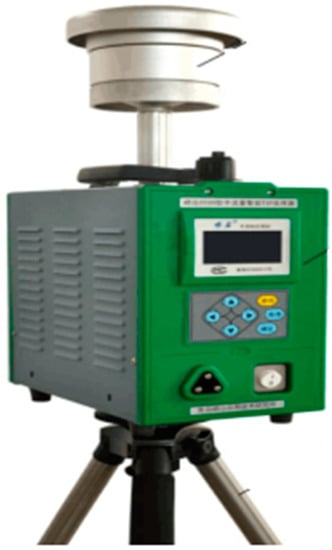
Figure 2.
Lao ying 2030 TSP sampler.
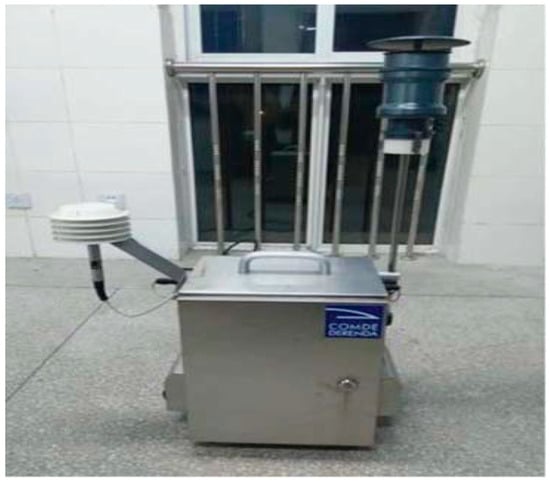
Figure 3.
COMDE DERENDA particulate sampler.
Table 3.
Lao ying 2030 TSP sampler technical parameters.
Table 4.
COMDE DERENDA sampler technical parameters.
3. Processing of Measured Data
3.1. I/O Ratio
For the average of PM2.5 and PM10 mass concentration I/O ratios taken in winter 2016, the measurement points for A were 0.60 and 0.48 and for B were 0.67 and 0.53; in summer 2016, the measurement points for A were 0.34 and 0.30 and for B were 0.40 and 0.32; in winter 2017, the measurement points for A were 0.38 and 0.33 and for B were 0.44 and 0.36. The I/O ratio of PM2.5 and PM10 varies over time (Figure 4).
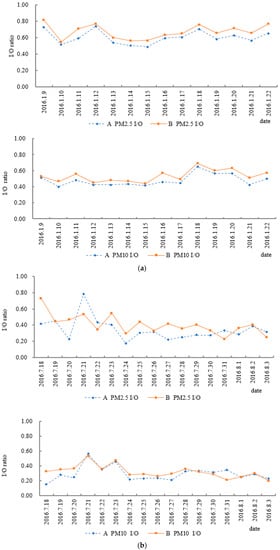
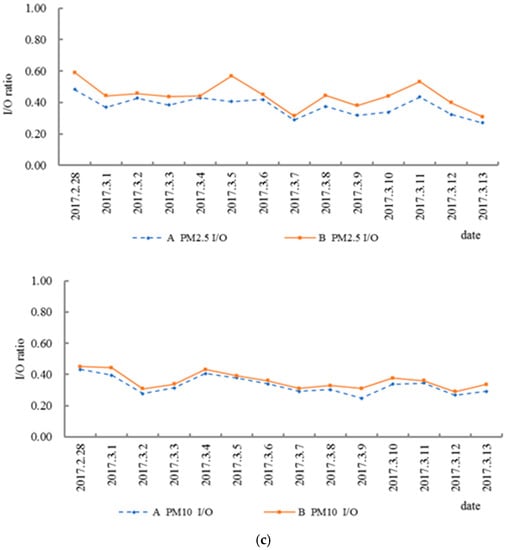
Figure 4.
Daily changes of PM2.5 and PM10 I/O ratios. (a) In the winter of 2016, (b) In the summer of 2016, (c) In the winter of 2017.
By comparing the I/O values of PM2.5 and PM10 measured three times, we found that the average of I/O in the winter of 2015 > winter of 2016 > summer of 2015; at the same time, the I/O ratio of the PM2.5 and PM10 varied with time in a consistent manner, but the mean of I/O ratio of measurement point A is less than the mean of measurement point B, and the change trend of I/O ratio of measurement point A is relatively flat. Considering that the air tightness of the building envelope at measurement point A is better than that at measurement point B, it can delay the influence of outdoor particles indoors in a better manner.
3.2. Linear Regression
The regression analysis of the average daily mass concentration of indoor and outdoor PM2.5 measured three times in winter 2016, summer 2016, and winter 2017 shows that the linear regression fitting R2 of indoor and outdoor PM2.5 mass concentration in point A reached 0.8346, 0.3747, and 0.8348, while the linear regression fitting R2 of indoor and outdoor PM2.5 mass concentration in point B reached 0.8411, 0.6077, and 0.8231. The linear regression fitting R2 of indoor and outdoor PM10 mass concentration at point A reached 0.8889, 0.4062, and 0.8583. The linear regression fitting R2 of indoor and outdoor PM10 mass concentration at point B reached 0.8741, 0.6563, and 0.9074. The average daily mass concentration curve fitting is shown in Figure 5.
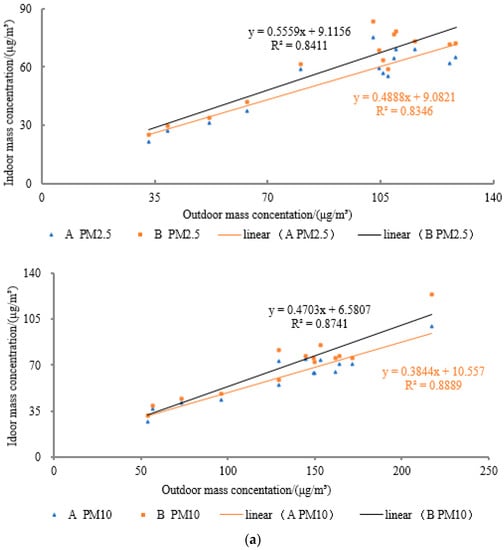
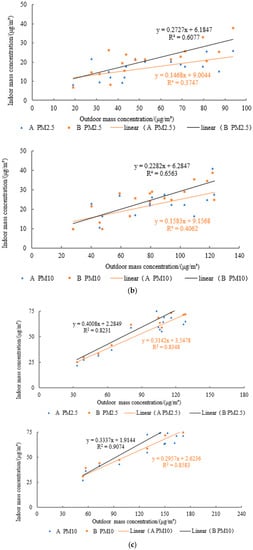
Figure 5.
Linear regression analysis of indoor and outdoor PM2.5 and PM10 concentration. (a) In the winter of 2016, (b) In the summer of 2016, (c) In the winter of 2017.
When the doors and windows were closed and there was no obvious pollution source in the room, the average daily mass density of the indoor and outdoor particles in the three types of measurement became highly correlated. Winter 2015 R2 > winter 2016 R2 > summer 2016 R2; at the same time, R2 of B >R2 of A. This is because the containment structure of point A has good air tightness, which weakens the correlation between the concentration of indoor and outdoor particles.
4. Numerical Simulation Results
According to the abovementioned results and data analysis, the mass concentration of the indoor particulate matter in office buildings with no indoor air conditioning and ventilation equipment and no significant particulate matter pollution sources is mainly affected by the pollution degree of the outdoor particulate matter. The air tightness of the building envelope is one of the key factors that determine the outdoor particulate matter entering indoors through permeation ventilation [18,19,20,21,22]. There are many kinds of gaps in the envelope structure. For office buildings, they are mainly around the external window between the window pane and the window frame, between the window frame and the wall, electrical entrance, exterior wall gap, and the gap around the door frame; these are mainly determined by the gap size and geometric shape of the envelope structure [23]. Therefore, in order to study the relationship between the mass concentration of indoor and outdoor particulate matter in office buildings and the gap size and shape of the building envelope, numerical simulation was conducted in this paper concerning the gap of external windows with different sizes and shapes under different indoor and outdoor pressure differences. Generally, there are three types of gaps in the envelope: square-shape gap, L-shaped gap, and U-shaped gap (Figure 6). In the three-dimensional diagram, the gap length is represented by W, the gap height by h, and the gap depth by d. The three-dimensional structure is shown in Figure 7.
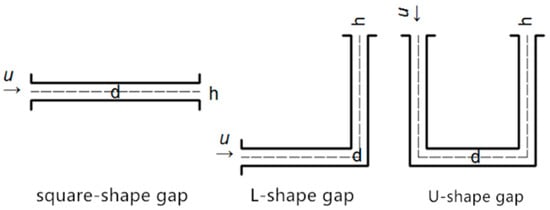
Figure 6.
Envelope structure gap schematic diagram.
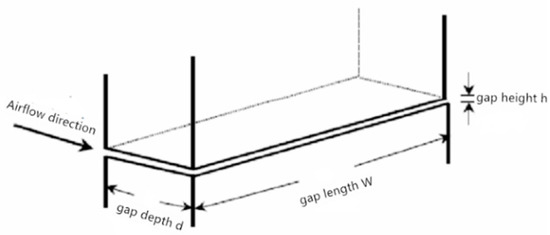
Figure 7.
Rectangular gap 3D illustration.
4.1. Principle of Calculation Model
In this paper, the discrete phase model was used for simulation. Whether the flow pattern is turbulent or laminar depends on whether the Reynolds number exceeds the critical Reynolds number. The Reynolds number of all the flow problems involved in this paper is less than 2320, so it is laminar steady flow and the pressure gradient is zero. During the penetration of particulate matter in the gap of the envelope structure, the pressure, density, and temperature distribution of the gap facing the flow field have little effect, and as the gap depth d is short, it can be approximated that the air temperature at the gap inlet and outlet does not change. Therefore, in the process of particulate matter penetrating the gap of the envelope structure, the effects of the thermophores and pressure gradient force on the motion of the particulate matter can be ignored, i.e., it is mainly affected by the combined effects of gravity, Brownian force, and drag force. The sum of the forces exerted on the particles is shown in Table 5. The pre-processing software gambit was used for modeling and meshing. Considering the regular structure of the gap, a quadrilateral mesh was selected. The whole model was divided into about 300,000 element meshes. The meshing is shown in Figure 8.
Table 5.
Particulate matter the force magnitude.
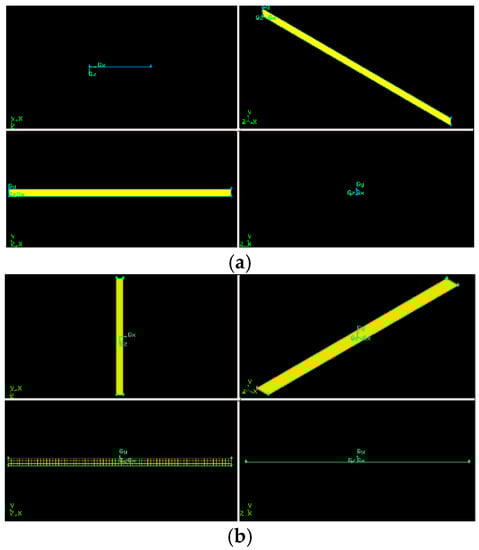
Figure 8.
Meshing. (a) 2D Meshing and (b) 3D Meshing.
4.2. Setting of Boundary Conditions and Basic Parameters
The particle size range of the particles studied in this paper was 0.001–100 μm, and it was assumed that the particles were coal ash. The Rosin–Rammler distribution was used for particle size distribution.
The following assumptions were made in the simulation:
- (1)
- because the volume fraction of particulate matter in the atmosphere is very small, its subsidence had little effect on the laminar flow, and the effect of particulate matter on laminar flow was ignored (Table 6);
Table 6. Airflow parameters (W = 0.5 m, d = 0.03 m, n = 0).
- (2)
- only the influence of gravity, Brownian force, and drag force on particles were considered;
- (3)
- the air passing through the gap was incompressible and met the Bussinesq approximation;
- (4)
- the heat transfer between the air and particulate matter was ignored;
- (5)
- the particles were spherical smooth particles (spherical);
- (6)
- the particles were not charged and there was no electrostatic friction, condensation, collision, or chemical reaction among them, and the particle size did not change during the penetration process;
- (7)
- the particles were inert particles.
Under the action of inside and outside differential pressure ΔP, the airflow enters the indoor through a structure crack. The pressure difference is caused by indoor and outdoor wind pressure and thermodynamic pressure; additionally, the building palisade structure on both sides of the differential pressure is less than 10 pa. In this paper, the air density = 1.342 kg/m³ at the average outdoor temperature of −10℃ in January in Shenyang was selected, and the coefficient of dynamic viscosity was 1.67 × 10⁻⁵ pa·s.
According to the ASHRAE manual, the gap height of the envelope is generally between 0.05 and 3 mm. At this time, the flow state of the permeation ventilation in the gap of the envelope is laminar flow. The size of the average air velocity u only depends on the gap height h, gap depth d, and the pressure difference between the two sides of the gap but has nothing to do with the structure of the gap [24]. When the seam length is W = 0.5 m, d = 3 cm, and the various parameters when the air passes through the gap of the envelope are shown in Table 6.
The boundary conditions of this simulation are defined as follows:
- (1)
- inlet: the continuous phase air is set as “velocity-inlet” and the discrete phase particle is set as “escape”;
- (2)
- solid wall: the continuous phase air boundary condition is “no slip (fixed boundary)” and the discrete phase particle boundary condition is “trap”;
- (3)
- export (outlet): continuous phase boundary condition is set as free air flow (outflow) and the discrete phase particles are set as “escape” (escape).
As observed from the above table, the airflow flow pattern wherein air penetrates into the room through the gap of the envelope structure is generally laminar flow, and the air velocity in the gap only depends on the gap shape, gap size, and the pressure difference between the two sides of the gap. In this paper, the Fluent software was used to simulate the penetration of particles with particle size between 0.001 and 100 μm. –The particles with particle size between 0.001 and 100 μm were divided into 10 particle size segments: 0.001–0.005 μm, 0.005–0.01 μm, 0.01–0.05 μm, 0.05–0.1 μm, 0.1–0.5 μm, 0.5–1 μm, 1–2.5 μm, 2.5–10 μm, 10–50 μm, 50–100 μm. Assuming that the number of particles at the entrance of each particle size segment is 200, the ratio of the number of particles at the exit of each particle size segment divided by the number of particles at the entrance is the penetration coefficient, represented by P and the formula is as follows:
N escape—the number of escaping particles at the exit;
N inlet—number of particles at the inlet.
4.3. Simulation Results
4.3.1. Influence of Gap Height on Penetration Coefficient
When retaining structure gap on both sides of the differential ΔP = 10 pa, the air inlet temperature is 263 k, d = 0.03 m, W = 0.5 m in length as the conditions; and at the same time, only consider the effect of different gap heights h on the penetration rate of particles The variation of the penetration coefficient P with particle size at three gap heights (1, 0.5, and 0.1 mm) was simulated. Under h = 0.5 mm, the velocity vector and pressure vector of the airflow are shown in Figure 9, Figure 10 and Figure 11, respectively. Under different gap heights, the law of penetration changed with different particle sizes (Figure 12).
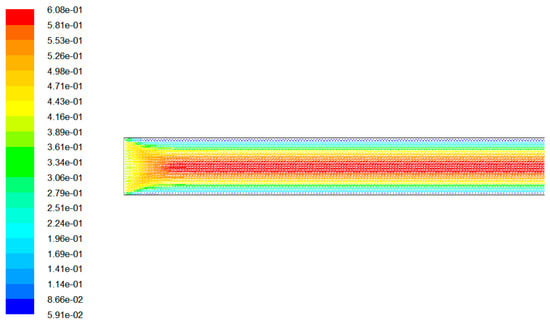
Figure 9.
Inlet velocity vector (h = 0.5mm).
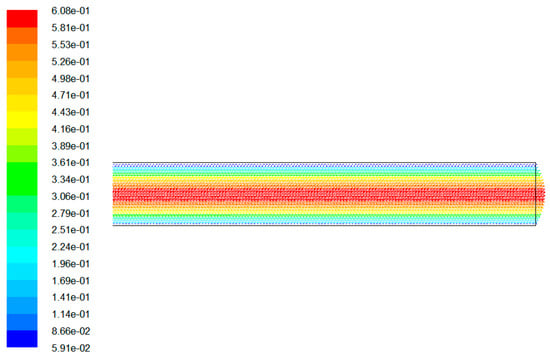
Figure 10.
Outlet velocity vector (h = 0.5mm).
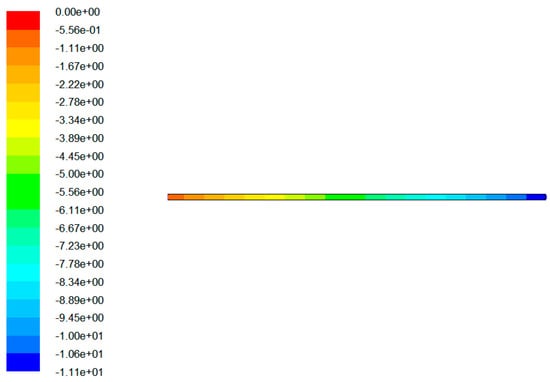
Figure 11.
Stress vector diagram (h = 0.5 mm).
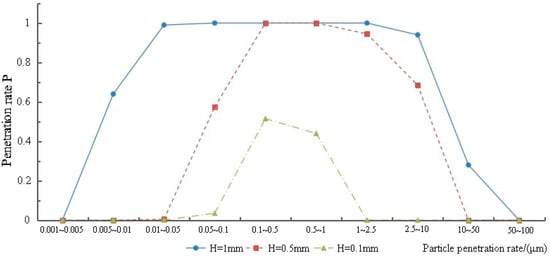
Figure 12.
Penetration rate between the particle size of gap height (Δ P = 10 pa, d = 3 cm)
In Figure 12, among all particles with particle sizes, the particles with particle sizes between 0.25 and 0.75 μm has the highest penetration rate. Particle size is less than 0.25 μm, the penetration rate P increased with the increase of particle size, particle size is greater than 0.25 microns, the penetration rate P decreases with the increase of particle size, and all this is because the smaller particle size of particles was mainly affected by brown diffusion, and the particle size of larger particles, mainly the gravity effect, under the action of these two kinds of force is bigger; smaller particles are easily captured by the wall of the retaining envelope structure and deposited on its surface. When h = 1 mm, the penetration rate of particles with particle size ranging from 0.01 to 10 μm exceeded 95%. When h = 0.5 mm, the penetration rate of particles within the range of 0.25–2.5 μm exceeded 90%. When h = 0.1 mm, the penetration rate is the highest when the particle size is around 0.4 μm, and the penetration rate of the particles is about 50%.
4.3.2. Influence of Gap Depth on Penetration Coefficient
With the palisade structure gap on both sides of the differential ΔP = 10 pa, an air inlet temperature of 263 k, h = 1 mm, W = 0.5 m, only consider the effect of different gap depths d on the penetration rate of particles In this paper, the variation of penetration rate P was simulated with the particle size in different gap depths (70, 50, 30 mm). The flow parameters of the gaps in different depths are shown in Table 7. Under the conditions of d = 5 cm and d = 7 cm, the velocity vector and pressure vector of the airflow are as shown in Figure 13, Figure 14, Figure 15, Figure 16, Figure 17 and Figure 18 respectively. In different gap depths, the variation law of penetration with different particle sizes is as shown in Figure 19.
Table 7.
Slot flow parameters at different depths (H = 1mm, ΔP = 10 pa)
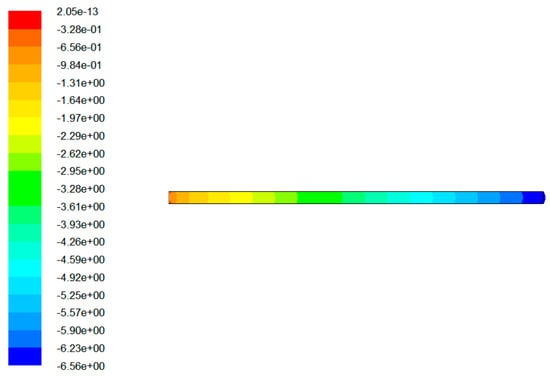
Figure 13.
Pressure vector (d = 5cm).
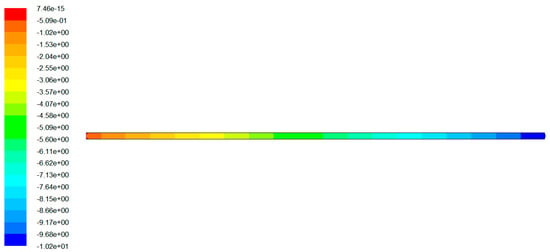
Figure 14.
Pressure vector (d = 7cm).
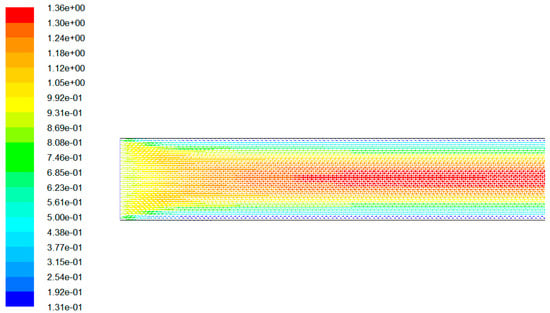
Figure 15.
Inlet velocity vector (d = 5cm).
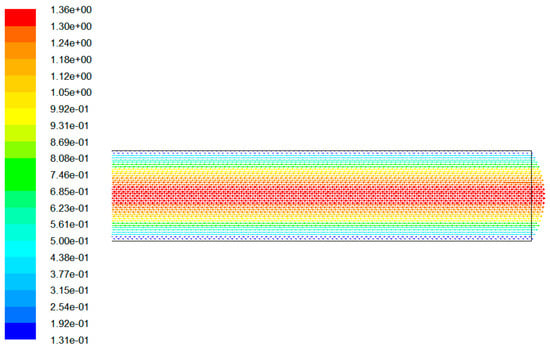
Figure 16.
Outlet velocity vector (d = 5cm).
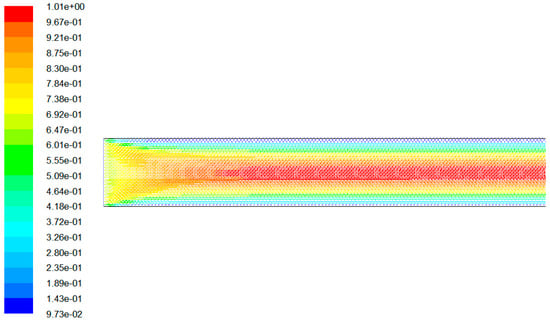
Figure 17.
Inlet velocity vector (d = 7cm).
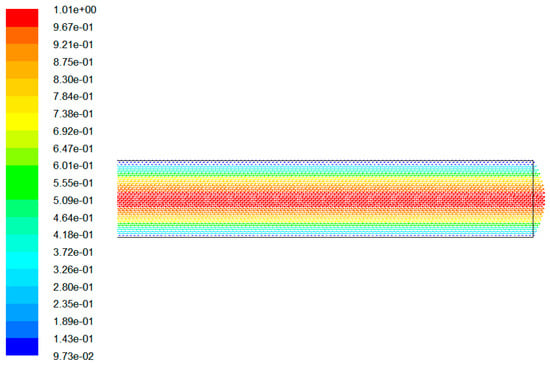
Figure 18.
Outlet velocity vector (d = 7cm).
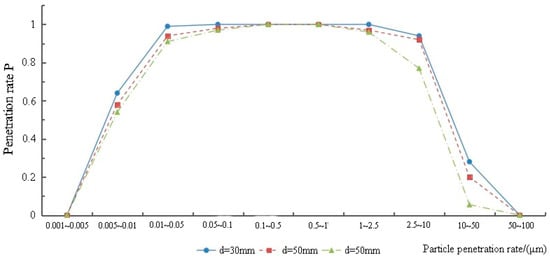
Figure 19.
Penetration rate of each particle size segment at different gap depths (Δ P = 10 pa, h =1 mm).
In Figure 19 the penetration rate P decreases with an increase of gap depth d. In the range of 0.1–1μm, the penetration rate of particles at different gap depths was close to 1. When the particle size is less than 0.1μm, the penetration rate decreases with an increase of gap depth d, as the particles with smaller size are mainly affected by the Brownian diffusion. When the particle size is greater than 2.5 μm, the penetration rate decreases with an increase of gap depth d, as particles with larger particle sizes are mainly affected by a gravity settlement. The larger gap depth increases the residence time of particles in the gap of the envelope, thus increasing the probability of particles contacting the gap wall.
4.3.3. Influence of Pressure Difference between the two Sides of the Gap on the Penetration Coefficient
When the air inlet temperature is 263 k, h = 1 mm, W = 0.5 m, d = 30 mm, only consider the gap on both sides of the differential. ΔP does not influence particle penetration rate. At the same time, the variation of penetration coefficient P caused by the change of particle size in diverse gap pressure difference (5, 7, 10 pa) was simulated in this paper. In ΔP = 5 pa, ΔP = 7 pa cases, the velocity vector and pressure vector of the airflow are as shown in Figure 20, Figure 21, Figure 22 and Figure 23 respectively., when the pressure difference between the two sides of the gap changes, the change law of penetration rate has diverse particle sizes (Figure 24).
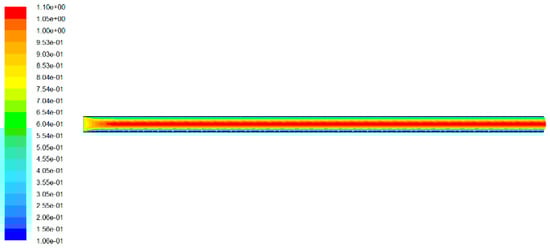
Figure 20.
Velocity vector (Δ P = 5 pa).
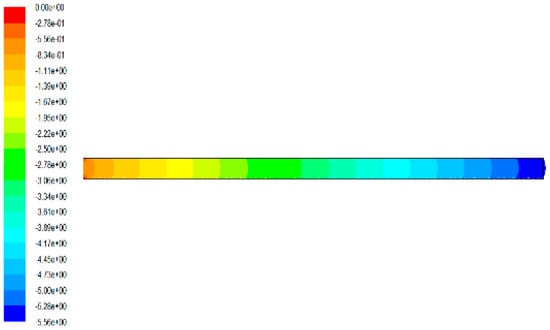
Figure 21.
Pressure vector (Δ P = 5 pa).
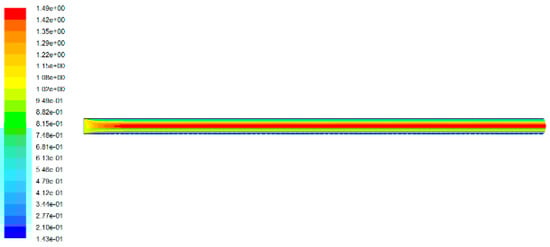
Figure 22.
Velocity vector (Δ P = 7 pa).
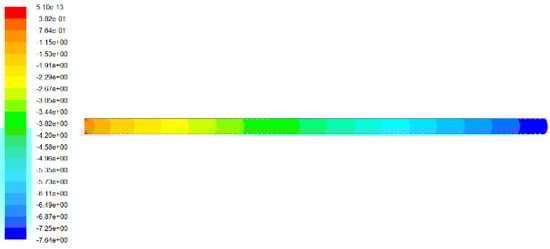
Figure 23.
Pressure vector (Δ P = 7 pa).
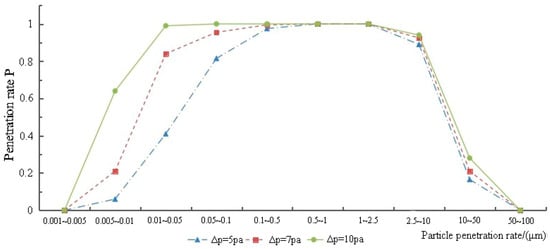
Figure 24.
Penetration rate of each particle size segment at different pressure differences (d = 3 cm, h = 1 mm).
In Figure 24, the difference in pressure between the two sides of the gap has a great impact on the penetration rate of particles, especially those with particle sizes of less than 0.1 μm. The penetration rate P of particles in the range of 0.25–2.5 μm under different pressure differences is close to 1, which increased along with the pressure difference between the two sides of the gap.
4.3.4. Influence of Gap Shape on Penetration Coefficient
When the air inlet temperature is 263 k, Δ P = 10 pa, h = 1 mm, W = 0.5 m, d = 30 mm, only considering crack geometry does not influence the particle penetration rate at the same time. In this paper, the variation of penetration coefficient P with particle size under a different gap geometry (L, U, square) was simulated. The airflow parameters when the airflow passes through gaps of different geometric shapes are shown in Table 8. Under the L-shaped and U-shaped seams, the velocity vector and pressure vector of the airflow (Figure 25, Figure 26, Figure 27, Figure 28, Figure 29 and Figure 30) are present. The law of the penetration rate changes with the different particle size when the gap depth varies (Figure 31).
Table 8.
Airflow parameters of different geometries (H = 1 mm, Δ P = 10 pa).
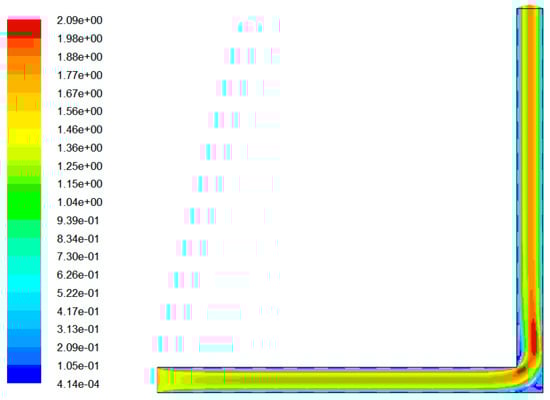
Figure 25.
Velocity vector of L-shaped gap.
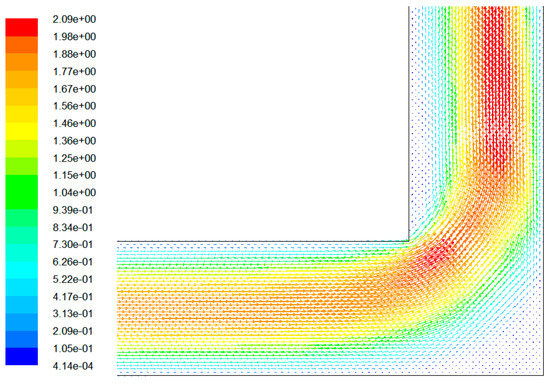
Figure 26.
Corner velocity vector of L-shaped gap.
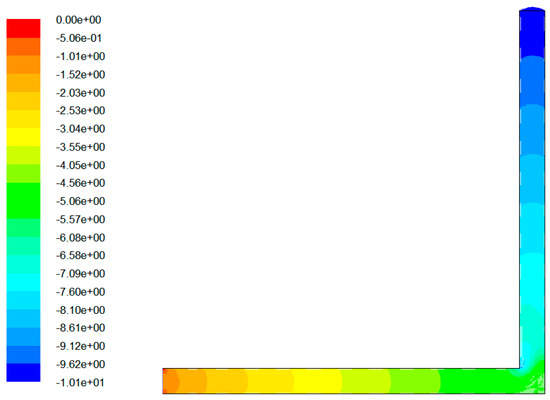
Figure 27.
Pressure vector of L-shaped gap.
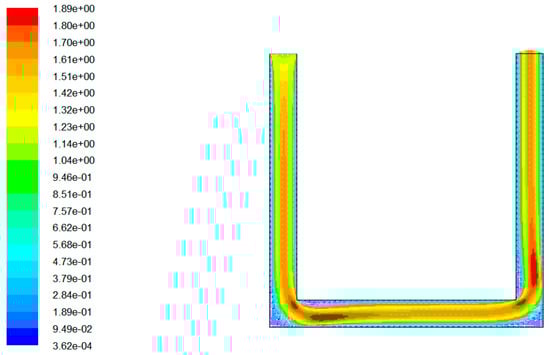
Figure 28.
Velocity vector of U-shaped gap.
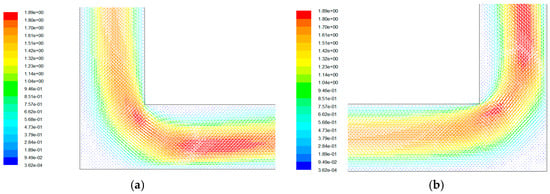
Figure 29.
Corner velocity vector of U-shaped gap. (a) Left corner, (b) right corner.
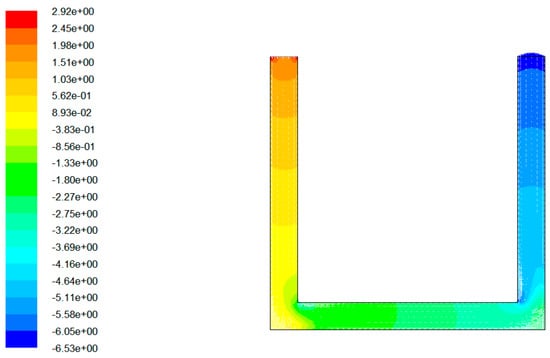
Figure 30.
Pressure vector of U-shaped gap.
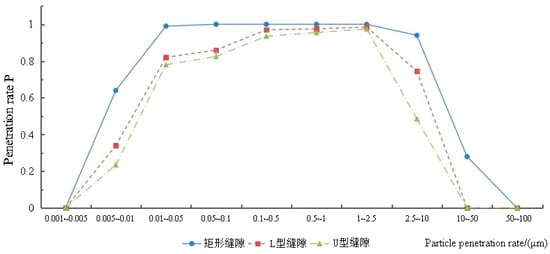
Figure 31.
The penetration rate of each particle size segment at different geometric shape gaps (d = 3 cm, h = 1 mm).
In Figure 26 and Figure 29, although the flow in the L-shaped and U-shaped gaps is laminar flow, turbulence still occurs at the corner. In Figure 31, the larger the n value is, the smaller the particle penetration rate will be, mainly because the airflow disturbance occurs at the gap corner, which increases the probability of collision between particles and the wall surface. The L-shaped and U-shaped gaps have a better blocking effect on larger and smaller particles than the rectangular shape.
5. Conclusions
The mass concentration I/O ratio of indoor and outdoor particles and the linear regression of mass concentration were analyzed. According to the measured gap types of the building envelope, a fluent software was used to simulate the change of particle penetration coefficient with particle size under different influencing factors; the influence law of gap geometry, size, and pressure of indoor and outdoor on the penetration coefficient was analyzed. The main conclusions are as follows:
(1) When buildings are exposed to a high concentration of outdoor particles for a long duration, indoor particles will reach high concentration; by comparing the I/O ratio of measuring points A and B, it can be observed that measuring point A is less than measuring point B; by comparing the fitting degree of points A and B, we can see that the R2 of point B is greater than that of point A, because the air tightness of building envelope at point A is better than that at point B, which weakens the correlation degree of indoor and outdoor particle concentration.
(2) According to fluent simulation results, the penetration rate of particles in the range of 0.25–2.5 μm particle size is close to 1, when the gap height h is greater than 0.5 mm. Moreover, when h =1 mm, the penetration rate of particles with particle size ranging from 0.01 to 10 μm exceeded 95%. When h = 0.5 mm, the penetration rate of particles within the range of 0.25–2.5 μm exceeded 90%. When h = 0.1 mm, the penetration rate was the highest when the particle size was around 0.4 μm, and the penetration rate of the particles was about 50%.
(3) According to fluent simulation results, the penetration rate of particles at different gap depths within the particle size range of 0.1–1 μm is close to that at different gap depths. When the particle size is less than 0.1μm, the penetration rate decreases with the increase of gap depth d; when the particle size is greater than 2.5 μm, the penetration rate decreases with the increase of gap depth.
(4) The fluent simulation result shows that within 0.25–2.5 μm, particles under different pressure differentials within the scope of the penetration rate of P are close to 1; in the gap on both sides of the differential value ΔP, the greater the particle penetration rate, the larger the number n of right-angle number of gaps, and the smaller the penetration rate of particles. The L-shaped and U-shaped gaps have a significantly better barrier effect on larger and smaller particles than the rectangular gap.
Author Contributions
Author Contributions: L.Y. proposed the innovative points and conceives the study. L.Y. and N.K. wrote the paper. W.W., H.G. and J.J. experimented. Y.L. and N.K. revised the paper. All authors have read and agreed to the published version of the manuscript.
Funding
The research work is supported by National Key R&D Program of China: 2016YFC0700100 and Key projects of Shenyang Academy of Environmental Sciences: 15-10-154.
Acknowledgments
In this section you can acknowledge any support given which is not covered by the author contribution or funding sections. This may include administrative and technical support, or donations in kind (e.g., materials used for experiments).
Conflicts of Interest
The authors declare no conflict of interest
References
- Bulletin of the State of the Environment of China. Official Website of the Ministry of Environmental Protection of the People’s Republic of China. Available online: http://www.zhb.gov.cn/ (accessed on 24 February 2020).
- Bulletin of the State of the Environment of Shenyang. Official website of the Shen Yang Municipal Bureau of Ecology and Environment. Available online: http://sthjj.shenyang.gov.cn/syssthjj/zwgk/hjzl/hjzlgb/glist.html (accessed on 24 February 2020).
- National standards of People’s Republic of China “Ambient air quality standards” GB3095-2012.
- Ostro, B.; Lipsett, M.; Reynolds, P.; Goldberg, D.; Hertz, A.; Garcia, C.; Henderson, K.D.; Bernstein, L. Long-Term Exposure to Constituents of Fine Particulate Air Pollution and Mortality: Results from the California Teachers Study. Environ. Health Perspect. 2010, 118, 363–369. [Google Scholar] [CrossRef] [PubMed]
- Tovalin-Ahumad, H.; Whitehead, L.; Blanco, S. Personal Exposure to PM and Element Compositional: A Comparison between Outdoor and Indoor Workers from Two Mexican Cities. Atmos. Environ. 2007, 41, 7401–7413. [Google Scholar] [CrossRef]
- Zhang, Y.P. Indoor Air Quality Control: Challenges in the New Century and Responsibilities of HVAC Personnel. HVAC 2013, 43, 1–7. [Google Scholar]
- Cao, G.Q.; Xie, H.; Zhao, S. Study on Indoor PM2.5 Pollution Control Strategy in Public Buildings. Build. Sci. 2015, 31, 41–44. [Google Scholar]
- Xiong, Z.M.; Zhang, G.Q.; Peng, J.G.; Zhou, J.L. Research Status of Indoor Inhalable Particulate Pollution. HVAC 2004, 34, 32–36. [Google Scholar]
- Zhao, L.; Chen, C.; Wang, P.; Wan, Y.L.; Wang, Y.F.; Chen, Z.G.; Wang, Q.Q.; Gao, G.Q.; Meng, C.; Wang, L.T. Variation Characteristics of Indoor and Outdoor PM2.5 Concentration in Summer and Winter of an Office Building in Beijing. Build. Sci. 2015, 4, 32–39. [Google Scholar]
- Fan, Y.S.; Xie, W.; Ye, L.L.; Si, P.F. Analysis on the Characteristics of Indoor and Outdoor Particulate Matter Concentration in an Office Building in Xi ’an. Build. Sci. 2013, 8, 39–44. [Google Scholar]
- Zhong, K.; Yang, F.; Zhu, H.; Kang, Y.M. Comparison of Indoor and Outdoor Particle Concentrations in Ventilation Rooms in Haze in Shanghai. Green Build. 2014, 1, 24–26. [Google Scholar]
- Shi, T.M.; Shan, R.D.; Xia, X.D. Research on Sustainable Design Strategy and Energy-Saving Technology of Sino-German Energy Conservation Demonstration Center. J. Archit. 2016, 14, 28–34. [Google Scholar]
- National standards of People’s Republic of China “Indoor air quality” GB/T 18883-2002.
- Chinese environmental protection industry standard “Technical requirement and test procedures for total suspended particulates sampler” HJ/T374-2007.
- National metrological verification regulations of the People’s Republic of China “Total Suspended Particulates Sampler” JJG 943-2011.
- National environmental protection standard of the People’s Republic of China “Determination of atmospheric articles PM10 and PM2.5 in ambient air using the gravimetric method” HJ618-2011.
- National environmental protection standard of the People’s Republic of China “Specification and Test procedures for (PM10 and PM2.5) sampler” HJ93-2013.
- Li, G.Z. Research on PM Exterior Window Penetration and Control under Multiple Factors. Chin. Acad. Build. Sci. 2016, 2, 5. [Google Scholar]
- Wang, Q.Q.; Li, G.Z.; Meng, C.E. Influence of Air Tightness on Penetration Coefficient of Particles in Cracks of Building Envelope. HVAC 2015, 45, 8–13. [Google Scholar]
- Xu, X. Study on Indoor PM Concentration Control Strategy. Sch. Civ. Eng. Hunan Univ. 2017, 2, 5. [Google Scholar]
- Huang, Y.H. Concentration Level and Exposure Evaluation of Indoor and Outdoor Particulate Matter in Office Buildings in Chongqing. Ph.D. Thesis, Chongqing University, Chongqing, China, 2013. [Google Scholar]
- Wang, Q.Q.; Li, G.Z.; Meng, C.; Zhao, L.; Wang, J.L.; Wang, X.F. External Fine Particulate Matter (PM2.5) Building Envelope Penetration and Passive Control Measures. HVAC 2015, 45, 8–13. [Google Scholar]
- Zhang, F. Numerical Simulation of the Penetration Mechanism of Building Envelope by Airborne Particulate Matter. Ph.D. Thesis, Hunan University, Changsha, China, 2007. [Google Scholar]
- Zhao, L. Indoor PM Pollution Control in Buildings; China Building Industry Press: Beijing, China, 2016; pp. 91–92. [Google Scholar]


© 2020 by the authors. Licensee MDPI, Basel, Switzerland. This article is an open access article distributed under the terms and conditions of the Creative Commons Attribution (CC BY) license (http://creativecommons.org/licenses/by/4.0/).