Article

Regional Differences and Influential Factors of Open Public Space in Chinese Cities Based on Big Earth Data

1
Northwest Institute of Eco-Environment and Resources, Chinese Academy of Sciences, Lanzhou 730000, China
2
University of Chinese Academy of Sciences, Beijing 100049, China
3
College of Geography and Environment Science, Northwest Normal University, Lanzhou 730070, China
4
State Key Laboratory of Resources and Environmental Information System, Institute of Geographic Sciences and Natural Resources Research Chinese Academy of Sciences, Beijing 100101, China
*
Author to whom correspondence should be addressed.
Sustainability 2020, 12(6), 2514; https://doi.org/10.3390/su12062514
Submission received: 15 February 2020 / Revised: 13 March 2020 / Accepted: 19 March 2020 / Published: 23 March 2020

Abstract

:
Urban open public spaces that provide multiple services for residents are essential for improving life quality and urban ecosystem function and promoting healthy development, the safety of human settlements and the sustainable development of urban cities. Based on Sustainable Development Goal 11.7 of the United Nations (UN) 2030 Agenda, this study combines the big earth data with the Theil index, a coefficient of variation and Exploratory Spatial Data Analysis (ESDA) to analyze the regional differences and spatial distribution of urban open public space in 2015 for China, and uses the geographical detector to identify key factors that affect the distribution of open public spaces. The results show that (1) open public space scales in provincial-level cities have an ‘East–Central–West’ low-lying land pattern in spatial distribution, where the eastern region has a relatively larger open public space scale. (2) In the prefecture-level cities, the open public space scale increases with an increase in city size and economic development level, and the differences in urban open public space reduce with an increase in city size and increase with a decrease in the economic development level. (3) Factors including economic development level, residents’ living standards, the urbanization level and the population size have sound explanatory powers in varying degrees on the scale of open public spaces; interactions between these factors have improved the explanatory power of the scale of urban open public space.

1. Introduction

With the implementation of modern spatial planning policies and management, the role of open public space in urban life has undergone a qualitative change [1]. Such changes not only contribute to the improvement of the living environment and the city quality and meet the psychological and physical health needs of residents [2], but also facilitate the long-term sustainable development of cities. Currently, more than 50% of the world population lives in urban areas [3], and it is estimated that the population living in urban areas will reach 66% by 2050 [4]. The urban areas in developing countries will expand by three times by 2030 [5]. The urbanization rate in China has also increased from 17.92% in 1978 to more than 59.58% in 2018. It is estimated that the urbanization rate will reach 70% by 2030 and will exceed 80% by 2050 [6]. However, in the process of rapid urbanization, a series of severe challenges, such as energy consumption, carbon emissions, urban heat island effect, and traffic congestion, threaten the sustainable development of cities [7]. To this end, ‘Transforming our World: The 2030 Agenda for Sustainable Development’ sets Sustainable Development Goal 11 (SDG11) on sustainable cities and communities, which, as clearly stated, need to ‘provide universal access to safe, inclusive, accessible, and open public space, in particular for women, children, older persons and persons with disabilities’ (SDG11.7) [8]. The New Urban Agenda also proposes the building of sustainable cities and human settlements for all residents, and highlights the role of public spaces [9]. Understanding the regional differences and spatial distribution of open public spaces in cites could help very much in future decision-making processes about urban management. Thus, it is urgent to identify the regional differences and spatial distribution of urban open public space and its influencing factors to support the goals of SDG2030.
A large number of studies have focused on the supply of urban green space, the green accessibility index, the availability of green space, and the impact of open space on sustainability [10,11,12,13,14]. For example, Henry et al. [10] analyzed the difference between green space supplies for major cities in Germany and found that urban green space supply is related to household income, age and education level, and this study will provide a reference for the analysis of influencing factors. Fan et al. [11] analyzed the spatial distribution of the green accessibility index and the spatial distribution of cold and hotspots. It was found that the green accessibility index of Shanghai city increased from 2000 to 2010, especially in Pudong and Baoshan district. Various methods of spatial analysis have been be utilized in the following studies. Kabisch et al. [12] used land usage and population data to assess the availability of green space for 299 European Union cities, and showed that the availability in southern European cities was below average, while the Nordic cities were the opposite. Bertram et al. [13] found that the number of and distance between urban green spaces have a significantly inverse U-shape effect on life satisfaction, and the results can help optimize green space to improve life satisfaction. Kilnarová et al. [14] used data from observations, questionnaires and other ways to analyze the impact of open space between residential buildings in three cities in central Europe on sustainability. This approach and the survey data sources reveal the effects of public space at the micro scale. Aletta [15] investigated an open public space used mainly as a pedestrian crossing to analyze the relationship between the audio stimuli and peoples’ behaviors. Bahriny et al. [16] studied patterns of urban park use and their relationship to factors of quality, and found that a combination of factors concerning the quality of the parks, such as the presence of facilities, existence of water and other special attractions. A key aspect is the difference between male and female users, with some parks being much less well-used by women, which is relevant to SDG11.7.
In contrast, studies about open public space in China have come relatively late and mainly focused on open public space comparison, urban green space, open space planning, urban green land and other fields. For example, Wei et al. [2] proposed that open space planning should be incorporated into the current planning system by interpreting the open public space planning standards of representative cities, such as the United States, the United Kingdom, and Australia. Jiang et al. [17] studied the domestic and overseas open space planning models, and divided the open spaces into three categories: linkage, ecology and society. The study proposed planning principles for different types of open public space. Yang [18] focused on the ‘living space’ of the metropolis, highlighting the life quality, and the social and cultural connotations of the open space. Chen et al. [19] found that urban area spread outward from the center and the urban green space had only slightly changed, but with fluctuations over time. Li et al. [20] used the Web of Science database as a document search engine and used knowledge map visualization software to analyze the core research clusters of open space in countries outside China into four categories: ecological benefits of public space, public space and public health, management of public space, and protection and value assessment. Jin et al. [21] found that the linear open space in the center of street not only serves the pedestrians, but also connects a mass rapid transit system to support sustainable transportation. Assessing the ecosystem services of green spaces could be used to assist urban planners and policymakers to optimize urban green space structure and composition to maximize ecosystem service provision [22].
In current open public space studies for China, the unified measurement indicator is still missing, and less attention is paid to the connotations and objectives of open public space in SDG11.7, which makes the research results difficult to compare with other countries. The recent research focuses more on green space but less on other types of open public space, such as streets or both types, which do not cover the evaluation of SDG11.7. In addition, the existing studies mainly utilized statistical and survey data; however, the spatial–temporal resolution and accuracy of these data are relatively low. Thus, it is difficult to provide support for sustainability decision-making at higher resolutions. Moreover, the existing studies focused more on the current situation and planning of open public space in a single city, but less on the distribution of urban open public space from a multi-scale perspective, and more on the impact of a single factor, but less on the interactions between different factors in urban public spaces.
Big earth data is being used in the evaluation of Sustainable Development Goals (SDGs) to meet data acquisition challenges [23,24]. The research on open public space based on big earth data is not only a prerequisite for pursuing a better and more efficient urban residential environment, but is also the key to achieving the UN Sustainable Development Goals 3, 5, and 8, and plays a vital role in the sustainable development of cities. In view of this, the indicators of SDG11.7, the Taylor index, coefficient of variation, ESDA and the geographical detector based on big earth data, are all used in this study to analyze the open public space of provincial and prefecture-level cities in China. The spatial distribution and influencing factors are used to provide a reference for open public space planning and the development of livable cities, and, finally, to achieve sustainable development in city. The main objectives of this study are to (1) achieve the relevant indicator of the open public space scale by using big earth data based on the connotations and goal of open public space in SDG11.7, (2) identify the distribution of the scale of open public space in China, and (3) identify the key factors influencing the differences in urban open public space.

2. Materials and Methods

2.1. Data Source

The open public spaces of this study include public green spaces, squares, and all levels of roads (highway, national highway, provincial highway, county roads, township roads, and urban streets). The data includes navigation and land use data with a 100-meter resolution for China in 2015. The national navigation vector data was stored in the PostgreSQL database. The land use data was generated by visual interpretation based on Landsat 8 images, including six primary types of cultivated land, woodland, grassland, water, residential land and unused land, and 25 secondary types (the data set is provided by the Data Center for Resources and Environmental Sciences, Chinese Academy of Sciences (http://www.resdc.cn)). The population data, the per capita Gross Domestic Product (GDP), the per capita disposable income, and the urbanization rate are derived from the statistical bulletins of the local cities. Some of the data are derived from the provincial statistical yearbooks. The statistical data are used for the analysis of influential factors on open public space.

2.2. Methods

2.2.1. Measurement of Urban Open Public Space

The urban public open space mainly reflects the living comfort and quality of a city. Based on the target of SDG11.7.1, this study mainly measures the proportion of urban open public spaces from public green spaces, parks, squares and roads. The ‘urban land’ sub-category is extracted from the land use data to establish the spatial database of the national built-up area. Open public spaces (including public green spaces and squares), and road data at all levels (e.g., highway, national highway, provincial highway, county road, township road, and urban streets) are extracted from national navigation vector data within urban boundaries defined by built-up areas. Road data is converted from line to polygon structure according to Chinese road width specifications (Table 1). According to the metadata of SDG11.7.1, the formula is defined as follows [25]:
P i = S i g r e e n   s p a c e + S i r o a d S b u i l d u p
where P i is the proportion of open public space at kilometer grid scale, S i g r e e n   s p a c e is the area of public green spaces and squares at kilometer grid scale, S i r o a d is the area of roads at kilometer grid scale, and S b u i l d u p is the urban built-up area. The road widths used in this study are listed in Table 1.
The specific calculation process is described in the following way (Figure 1): (1) a national kilometer grid is generated, and a Fishnet function is defined. The grid transformation method is then used to generate the national kilometer grid. (2) The national grid is overlapped with the spatial data of the public green space to generate the kilometer grid spatial data of the public green space. (3) High-speed, provincial, county, and other urban roads are converted into polygon data according to national road construction width specifications. This data is then overlapped with a national grid to generate kilometer grids of road spatial data. (4) Road and public green space data are integrated at the grid scale and divided by the total urban built-up area to determine the proportion of urban open public space areas. (5) The results are converted from the kilometer grid scale to county, city, provincial, and national scales based on spatial statistical analysis.

2.2.2. Regional Differences Measure of Urban Open Public Space

Coefficient of variation is used to measure regional differences in the scale of open public spaces in Chinese cities. Differences in open public spaces in local regions lay the foundations for the following analysis of influencing factors. The formula for the Cv is defined as follows [26]:
C v = 1 P ¯ i = 1 n ( p i p ¯ ) 2 n 1
where CV is coefficient of variation, n is the number of provinces (cities), pi is the scale of urban open public space of provinces (cities), p ¯ is the average of pi. The larger the CV value, the greater the difference in the scale of urban open public space.
Theil index can decompose regional differences into intra- and inter-regional differences. The formula for the Theil is defined as follows [26]:
T h e i l = i = 1 m T i ln ( m T i ) = T w z + T b z
T w z = i = 1 m e T i l n ( m e T i T e ) + i = 1 m c T i l n ( m c T i T c ) + i = 1 m w T i l n ( m w T i T w )
  T b z = T e l n ( T e m m e ) + T c l n ( T c m m c ) + T w l n ( T w m m w )
where Twz represents intra-regional differences in the eastern, central and western regions of China: the eastern region includes 11 provinces (autonomous regions or municipalities): Beijing, Tianjin, Hebei, Liaoning, Shanghai, Jiangsu, Zhejiang, Fujian, Shandong, Guangdong and Hainan. The central region includes Shanxi, Anhui, Jiangxi, Henan, Hubei, Hunan, Jilin, and Heilongjiang. The western region includes 12 provinces: Guangxi, Chongqing, Sichuan, Yunnan, Guizhou, Tibet, Shaanxi, Gansu, Ningxia, Inner Mongolia, Qinghai and Xinjiang; Tbz represents inter-regional differences among the three regions; m represents the number of provinces (cities); me, mc, and mw represent the number of provinces (cities) in each region, respectively; Ti represents the ratio of the scale of open public spaces ( P i ) in the province (city) i to the average value in China; Te, Tc, and Tw represent the ratio of the scale of open public spaces in the cities to the average value in the three regions, respectively.

2.2.3. Spatial Pattern Measurement of Urban Open Public Space

Global Moran’s I in the ESDA method is used to judge the distribution characteristics of urban open public space in 2015. It can judge whether the open public space scale has spatial autocorrelation in China—that is, whether the scale in the adjacent city has a certain correlation with the change in spatial distance. It is defined as [27]:
M o r a n s   I = i = 1 m j = 1 m W i j ( P i P ¯ ) ( P j P ¯ ) S 2 i = 1 m j = 1 m W i j
Z ( I ) = I E ( I ) V a r ( I )
where m is the total number of provinces (prefecture-level cities); Wij is the spatial weight matrix, calculated by ArcGIS with the algorithm of ‘contiguity_edges_corners’; Pi and Pj are the open public space scales of province (city) i and j; P ¯ is the average value of Pi. Moran’s I values range from −1 to 1. If Moran’s I is significantly positive, this indicates that the open public space scale of neighboring cities is spatially concentrated. If Moran’s I is significantly negative, this indicates that the scale of open public space in neighboring cities is significantly dispersed in space. In addition, the Z-test is required for Moran’s I. In Equation (7), Z(I) is the standardized value of I; E(I) is the mathematical expectation; Var(I) is the variance. Positive and significant Z value indicates that there is positive spatial autocorrelation. Negative and significant Z values mean negative spatial autocorrelation. When the Z value is zero, this means that random independent distribution exists.
The Gi* Index is used to identify the Spatial Dependence and Spatial Heterogeneity of urban open public space, and it can reveal whether spatial autocorrelation exists in some local areas. The index is calculated as [26]:
G i * = i = 1 m W i j P i i = 1 m P i
where the Gi* value is significantly positive, indicating the clustering of high values (above the average) around zone i, it is the “hotspot”; otherwise, the low value (below the average) cluster is a “cold spot” zone.

2.2.4. Analysis of the Factors Affecting the Distribution of Urban Open Public Space

Geographical detector is a statistical method for detecting spatial differentiation and revealing the driving factors. Because there is no linear hypothesis in its application, a geographical detector can effectively overcome the limitations of traditional statistical methods when dealing with different variables, and is widely used in the research of natural and socio-economic problems of different scales. In this study, factor detection and interactive detection in the geographical detector are used to identify the key factors affecting the spatial differentiation of urban open public space, and to analyze the impact of the interaction of influencing factors on the size of urban open public space.
(1) Factor Detection
Factor detection is used to identify the extent to which influencing factors explain the spatial differentiation of urban open public space, and is defined as [28,29]:
q = 1 1 n σ 2 i = 1 m n i σ i 2
where q is the detection index of the influencing factors on spatial distribution of urban open public space scale; n and σ 2 are the sample size and variance of the prefecture-level city, respectively; ni and σ i 2 are the sample size and variance in layer i. The q value is between zero and one. The larger the q value, the stronger the explanatory power of the influencing factors on the spatial differentiation of urban open public space, and vice versa.
(2) Interaction Detection
Interaction detection mainly identifies the inter-relationship among the factors that influence the spatial differentiation of urban open public space, and the P value of the explanatory power of factors, a and b, on the size of the open public space is taken as the evaluation standard [23,24]. If P(ab) < min(P(a), P(b)), this indicates that the interaction has a nonlinear reduction between a and b. If min(P(a),P(b)) < P(ab) < max(P(a),P(b)), the interaction has a one-factor nonlinear reduction. If P(ab) > max(P(a),P(b)), the interaction has a two-factor enhancement. If P(ab) > P(a) + P(b), the interaction has a nonlinear enhancement. If P(ab) = P(a) + P(b), this indicates that the interaction is independent between a and b.

3. Results

3.1. Differences in the Scale of Open Public Space in Chinese Cities

3.1.1. Open Public Space Differences at Provincial Level

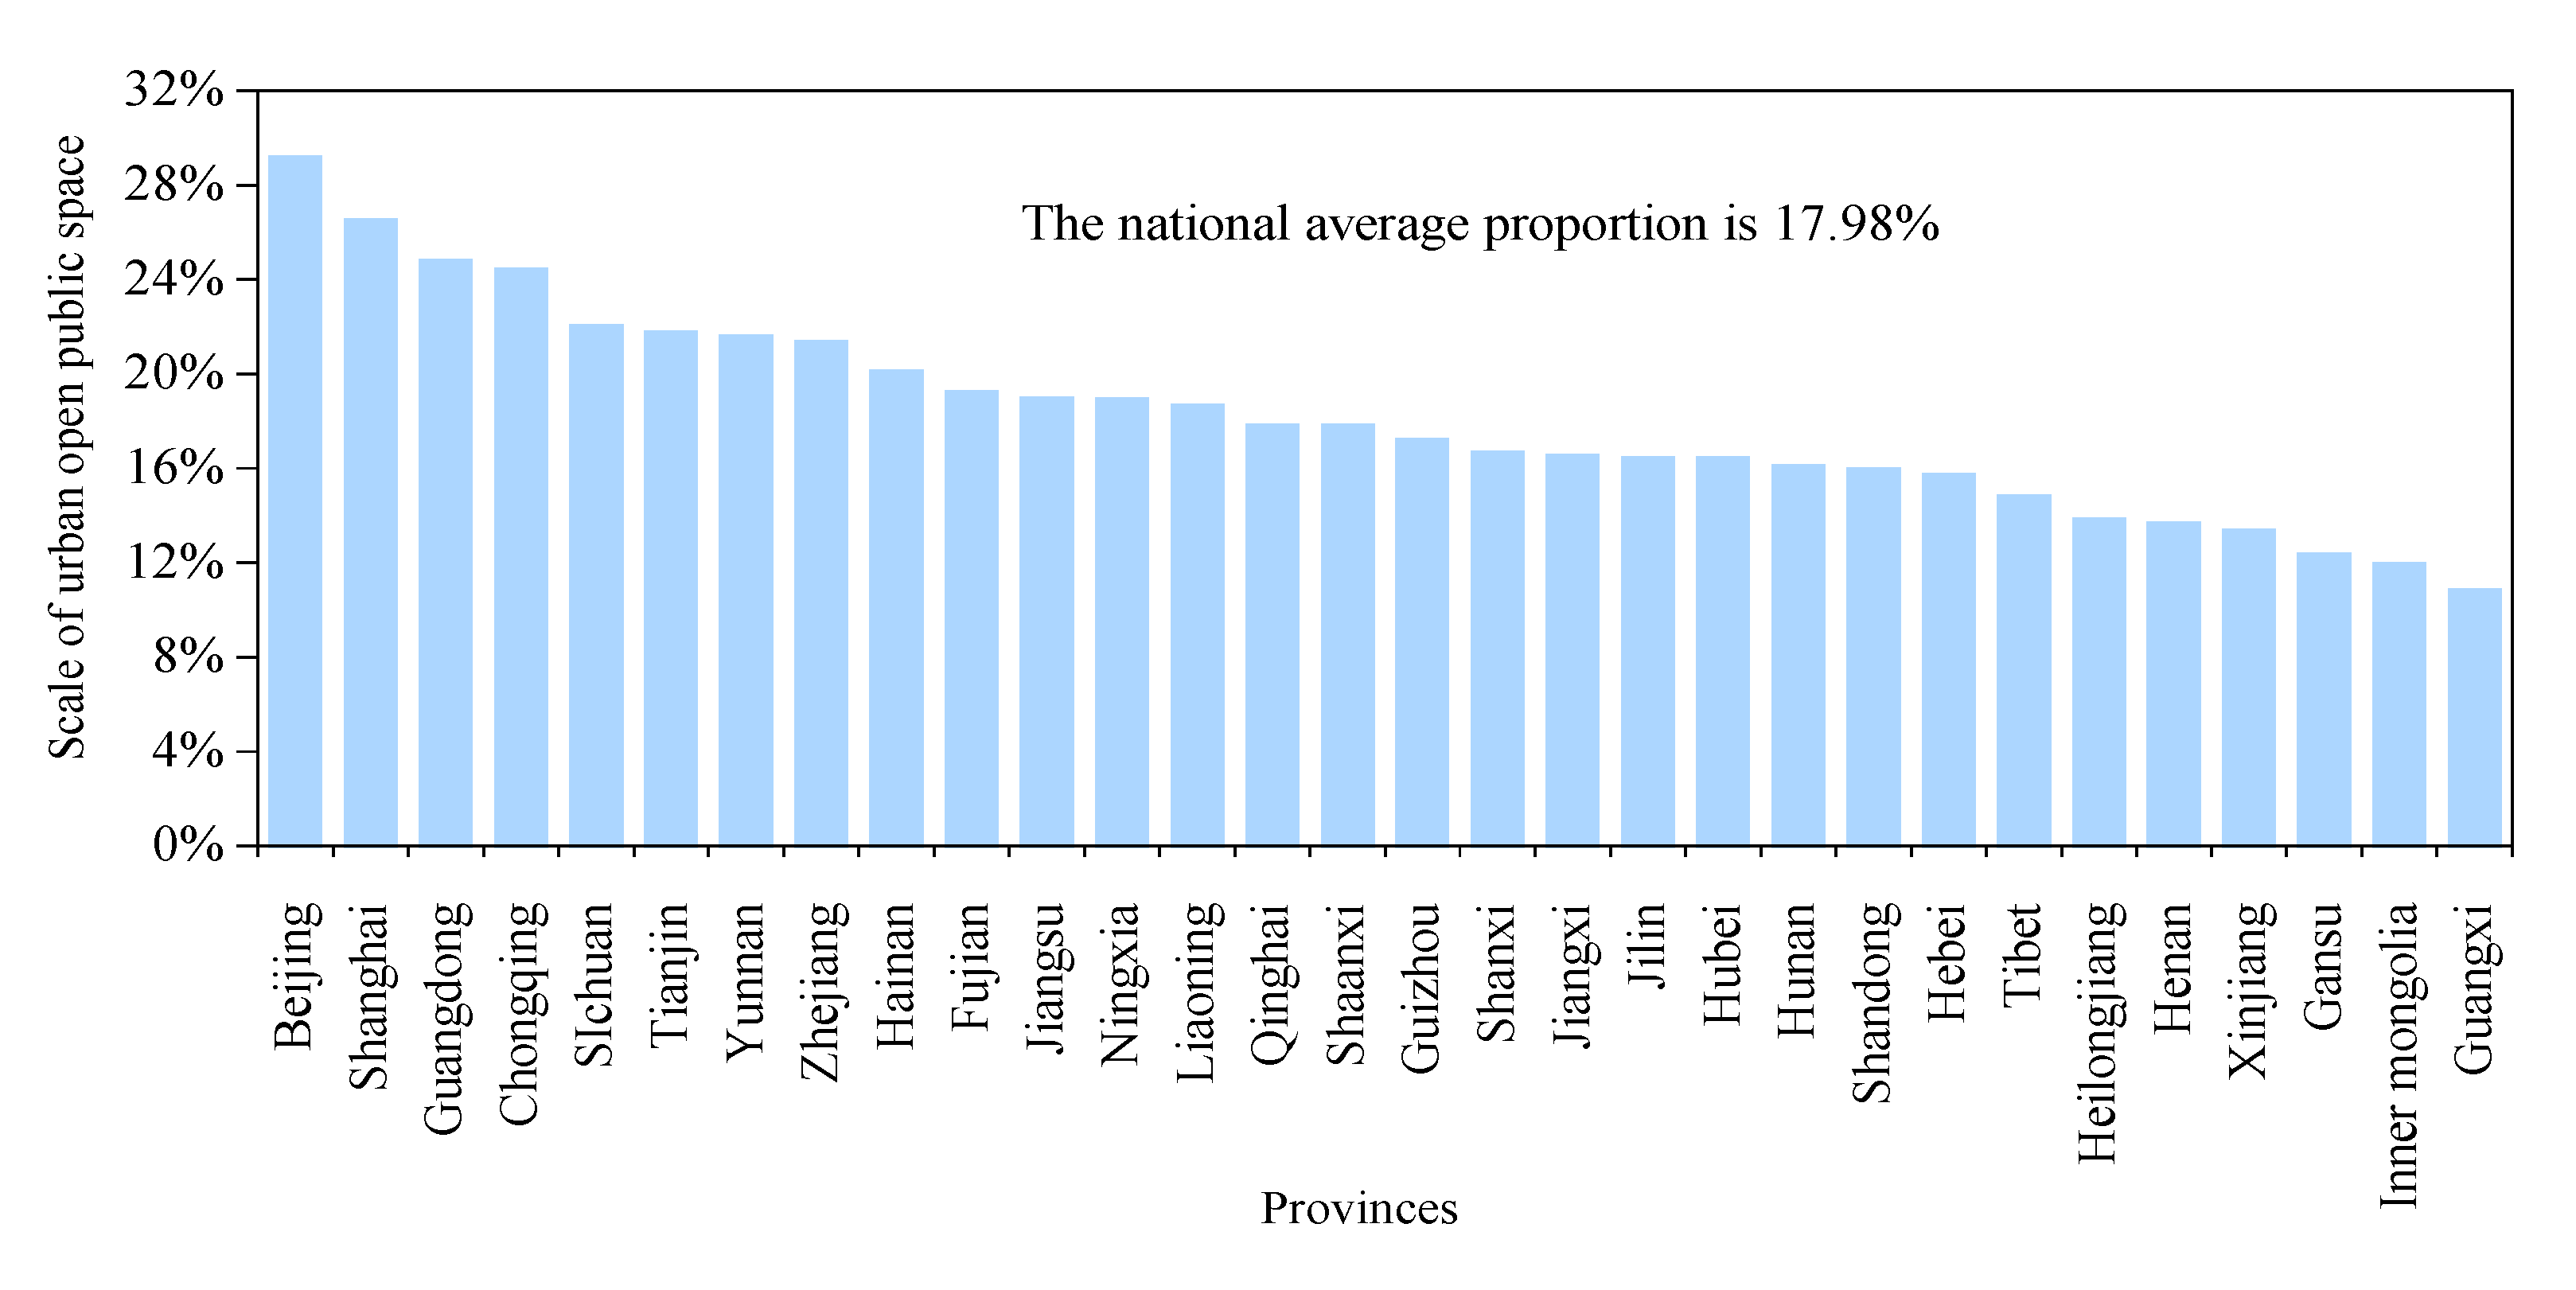
In 2015, the average proportion of open public space areas in Chinese cities was 17.98%. Among them, the proportions of 18 provinces, including Qinghai, Shaanxi, Guizhou, Shanxi, Jiangxi, Jilin, Hubei, Hunan and Shandong, were lower than the average. The proportion of open public space in Beijing has the biggest scale of 29.18%, followed by Shanghai (26.48%; Figure 2). While the proportion of open public space in Guangxi, Inner Mongolia and Gansu provinces are relatively small, among which the proportion is only 10.82% in Guangxi. Overall, the proportion in the eastern region has the biggest scale, followed by the western and central regions. The distribution of open public space shows the ‘East–Central–West’ low-lying land pattern.
In 2015, the coefficient of variation (CV) of open public space scale in China cities was 1.01, and the Theil index was 0.03 (Figure 3). The overall regional differences in urban public open scale are mainly caused by intra-regional differences than by inter-regional differences, and the former’s contribution rate reaches over 69.79%. For CV, the difference in the western region is the largest, followed by the eastern region, and the smallest in the central region. In general, the regional difference in urban open public space also shows the “East–Central–West” low-lying land pattern.

3.1.2. Open Public Space Differences in Prefecture-Level Cities

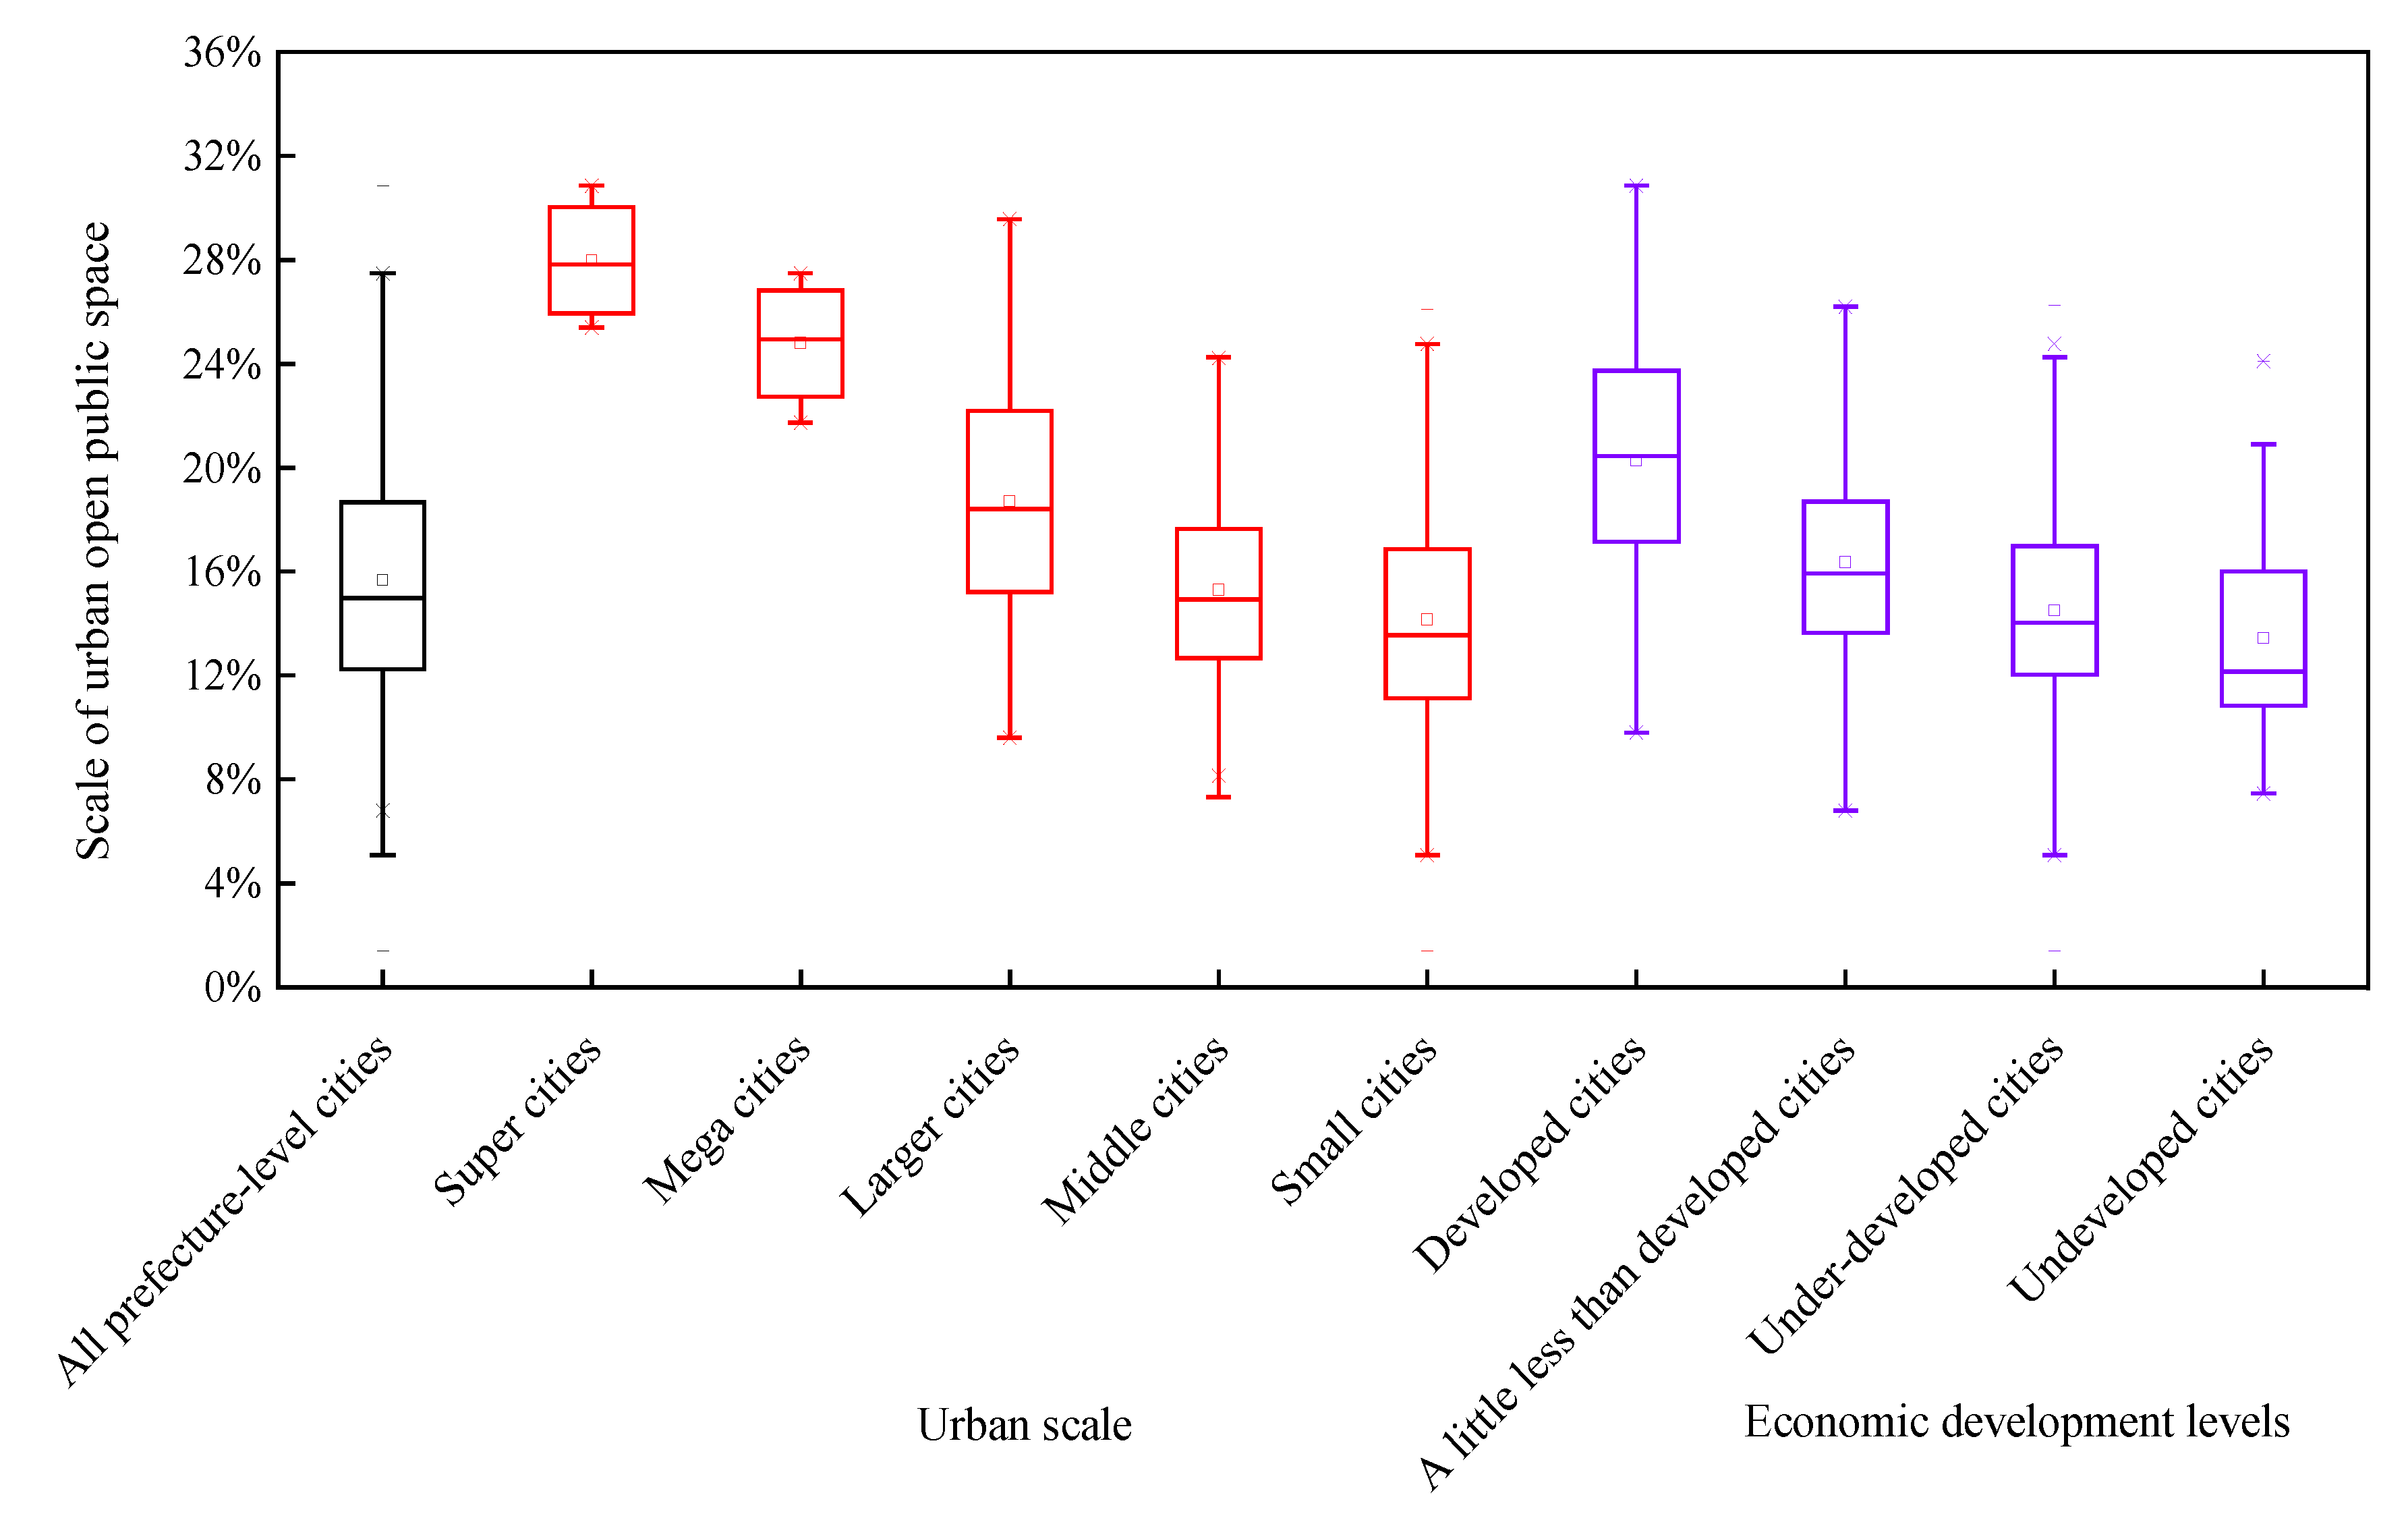
According to the ‘Notice on Adjusting the Standard for Cities’ Size Classification’ by China State Council, cities are divided into five categories: small city (with less than 500,000 residents), and middle city (with 500,000 to one million residents), larger city (with one to five million residents), mega city (with five to 10 million residents), super city (with over 10 million residents). The median scale of open public spaces in Chinese cities is close to the bottom quartile, and 54.38% of cities are below the average, indicating that the scale of open public space in cities is clustering at a low value (Figure 4). From the perspective of city size, the open public space scale of super cities, megacities, larger cities and medium cities are centralized and evenly distributed. The open public space scale of small cities is close to the bottom quartile, and 54.94% of small cities are below the average. On an economic development level, the open public space scale of undeveloped cities is close to the bottom quartile, and 55.36% of cities are below the average, which indicates that the scale of open public space in undeveloped cities is clustering at a low value with an uneven distribution. Open public space scales of all types of cities, except the undeveloped ones, are of even distribution.
In 2015, there were significant differences in the scale of open public space among various types of cities. For city size, the scale of open public space in super cities is biggest, while that in small cities is the smallest (Figure 5). The difference in the scale of open public space among cities of different sizes is very big. Small cities have the biggest difference, with a coefficient of variation of 1.04, followed by middle cities and super cities. Overall, the scale of open public space decreases with a decrease in city size. In contrast, its difference decreases with an increase in city size.
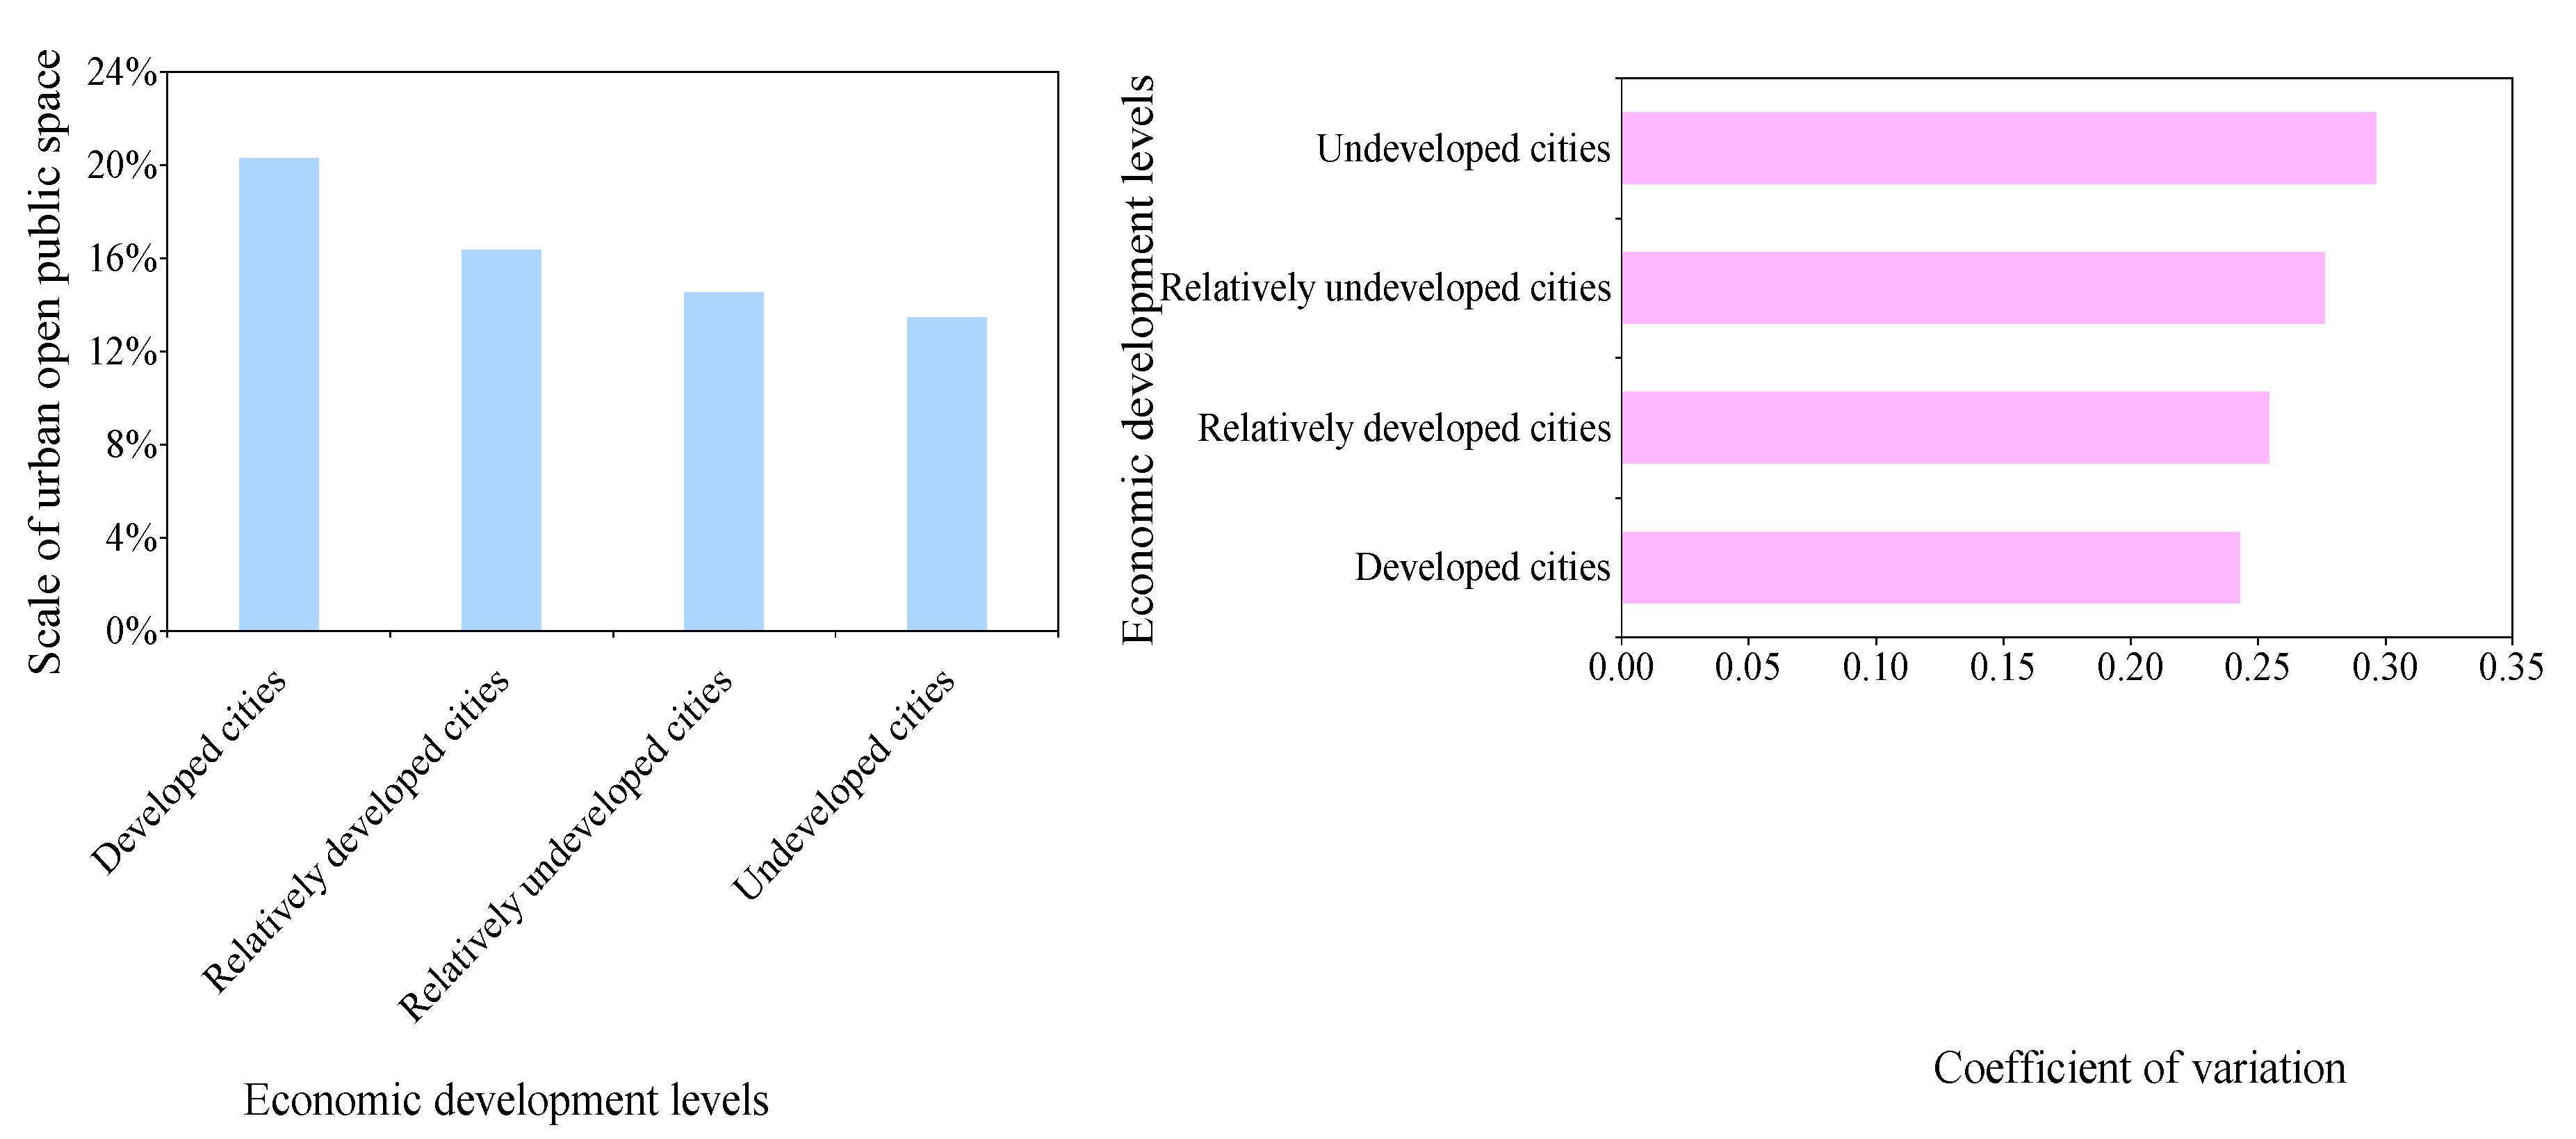
Cities are classified into four economic development levels: developed, relatively developed, relatively undeveloped and undeveloped, by breaks of 150%, 100% and 50%, respectively, per capita GDP to the national average value. For different economic development levels, the scale of open public space in developed cities is the biggest (reaching 20.26%), followed by relatively developed cities, and the scale of undeveloped cities is smallest (only 13.44%, Figure 6). In addition, the difference in the scale of open public spaces among undeveloped cities is largest, reaching 0.30, followed by relatively developed cities, and the smallest is in developed cities, with a coefficient of variation of only 0.24. On the whole, the scale of open public space in different cities decreases with a decrease in economic development level, and the difference increases with a decrease in economic development levels.

3.2. Spatial Distribution of Urban Open Public Space Scale in Chinese Cities

3.2.1. Spatial Distribution of Open Public Space Scale at Provincial Level

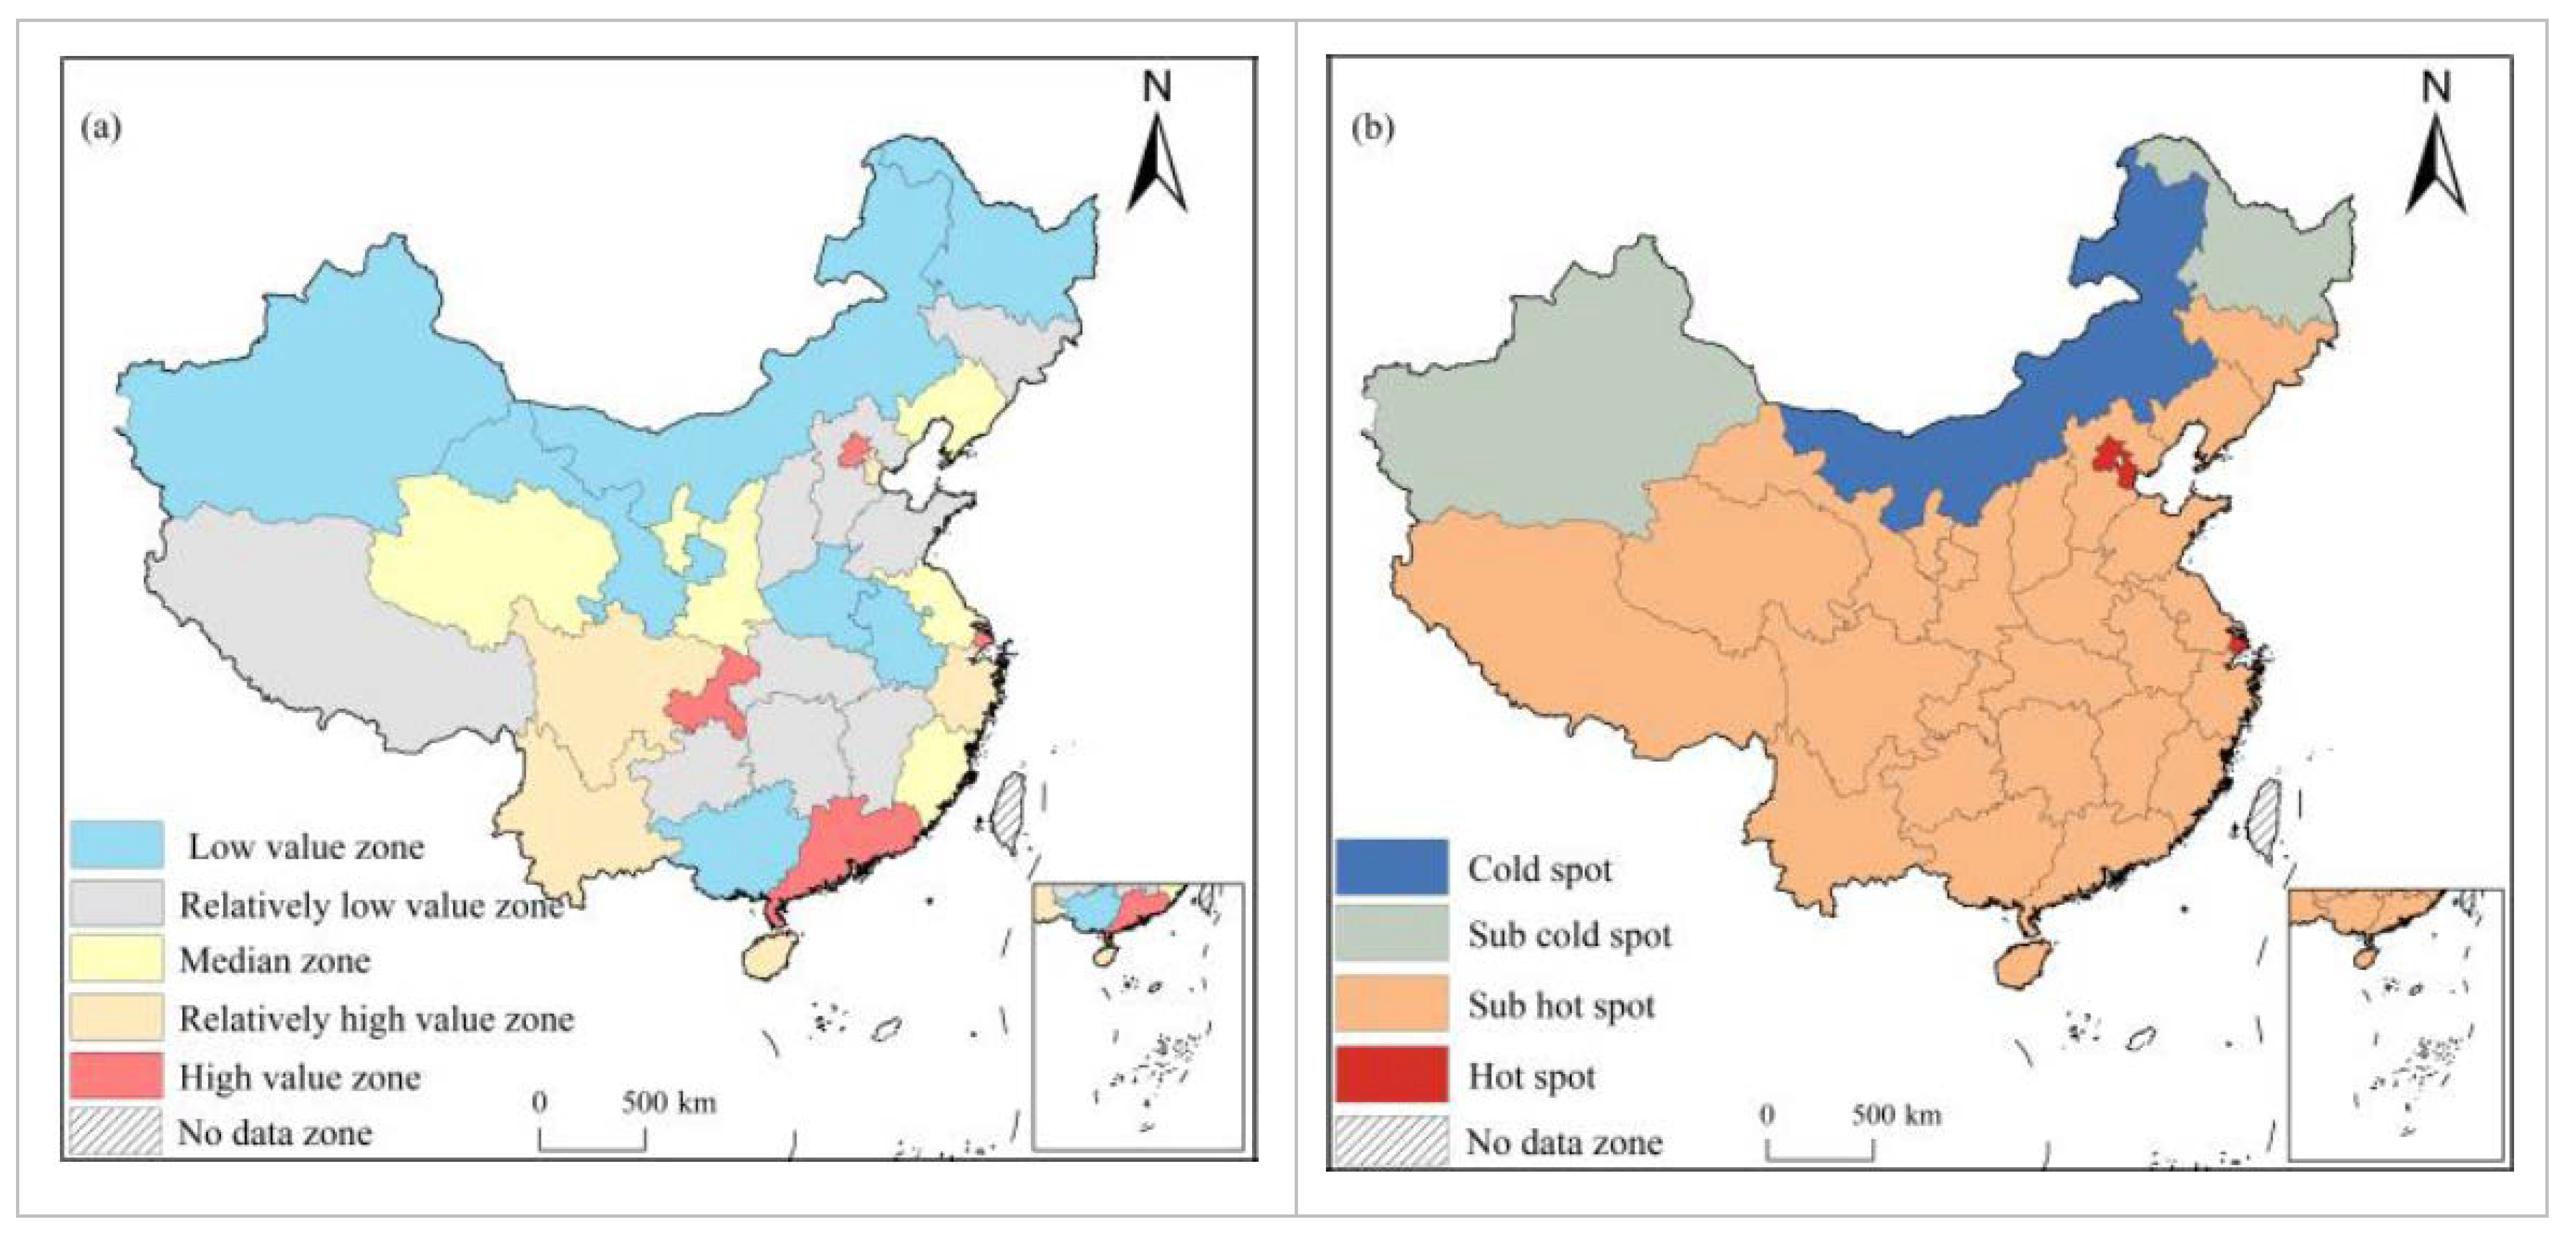
The 31 provinces with various open public space scales in China in 2015 are divided into low value zone, relatively low value zone, median zone, relatively high value zone, and high value zone by Jenks natural breaks classification method, using the ArcGIS tool. In terms of the spatial distribution of the open public space scale (Figure 7a), the provinces in relatively low value zones account for the highest proportion, reaching 29.03%, forming the contiguous area of Hebei–Shanxi–Shandong, Hubei–Jiangxi–Hunan–Guizhou. Provinces in low value zones account for 22.58%, forming the contiguous area of Heilongjiang–Inner Mongolia–Xinjiang–Gansu. Provinces in the high value areas occupy the least proportion, only 12.90%, forming the dot-like distribution of the contiguous area of Chongqing, Beijing, Shanghai and Guangdong.
The Global Moran’s I value of the open public space scale at provincial level is 0.28 under the 0.01 significance level, indicating there is positive spatial autocorrelation on the scale of open public space at the provincial level. That is, provinces with a bigger open public space scale tend to cluster, and provinces with a lower open public space scale are also clustering. Since the global Moran’s I value only reflects the overall spatial agglomeration feature, ‘hotspots’, ‘sub-hotspots’, ‘sub-cold spots’, and ‘cold spots’ are used to reflect local spatial distribution (Figure 7b). The analysis shows that the sub-hotspots dominate, followed by hotspots, sub-cold spots, and cold spots. Among them, the provinces in the sub-hotspots account for the biggest proportion, reaching 80.65%, forming a contiguous area of 25 provinces, Tibet–Qinghai–Gansu–Ningxia–Shaanxi–Shanxi–Hebei–Liaoning. The proportion of hotspots reaches 9.68%, and is only distributed in Beijing, Tianjin, and Shanghai. Only the Inner Mongolia autonomous region is in the cold spots area.

3.2.2. Spatial Distribution of Open Public Space Scale in a Prefecture-Level City

The prefecture-level cities with different open public space scales in 2015 are also divided into low, relatively low, median, relatively high, and high value zones by the natural breaks classification method. The open public space scales of urban agglomeration in Beijing–Tianjin–Hebei, Yangtze River Delta, Pearl River Delta, Sichuan Basin, and Yunnan–Guizhou are larger than surrounding cities, showing obvious ‘clustering’ characteristics. The higher value zone is consistent with the distribution of urban agglomerations, and the scale of open public space in eastern cities is bigger than that of central and western cities (Figure 7a).
From the perspective of prefecture-level cities (Figure 8a), the proportions of cities in low, relatively low median, relatively high, and high value zones are 2.64%, 36.36%, 34.31%, 18.77%, and 7.92%, respectively. From the perspective of spatial distribution, the northwest side of the Hu line (the black line shown in Figure 8) is dominated by a relatively low value zone, and only the capital cities of Xining and Yinchuan are in a high value zone. The southeast side of the Hu line is dominated by the median zone, the relatively high value zone and the high value zone, and the high value zones are mainly concentrated in developed cities.
The global Moran’s I value of the open public space scale in prefecture-level cities is 0.06, compared to the significance test at 0.01, indicating that there is a positive spatial autocorrelation for the prefecture-level cities. The ‘hotspot’, ‘sub-hotspot’, ‘sub-cold spot’ and ‘cold spot’ categories are used to reflect the local spatial distribution (Figure 8b). The northwest side of Hu line is a contiguous area with the cold spot zone and sub-cold spot zone. The urban agglomeration in northern Tianshan Mountains is a cold spot zone, and Lanxi is a sub-cold zone. On the southeast side of the Hu line, Liaodong Peninsula, Beijing–Tianjin–Hebei and other urban agglomerations are sub-cold spot zones. Urban agglomeration in western Taiwan Strait is a sub-hotspot zone, and the Beibu Gulf is a hotspot zone. The open public space scales of urban agglomeration in Beijing–Tianjin–Hebei, Yangtze River Delta, Pearl River Delta, Sichuan Basin, and Yunnan-Guizhou are larger than the surrounding cities. On the whole, the scale of open public space in Chinese cities shows a stepped decrease from the east to the central area, then to the west.

3.3. Factors Affecting the Scale of Urban Open Public Space

Urban open public space is an important guarantee for promoting social development and improving the life quality of residents. The scale of open public space is influenced by multiple factors, and the factors are diverse and complex. Studies have shown that the scale of open public space is affected by population size, residents’ living standards, the economic income of residents, and population density [2,10,30,31,32,33,34,35,36,37,38,39,40,41]. In view of this, this study analyzes the key factors of the open public space in prefecture-level cities from the aspects of economic development level, population density, population size, urbanization rate, and residents’ living standards. Among them, per capita GDP (x1) is used to represent the economic development level, total population/land area (x2) is used to characterize population density, per capita disposable income (x3) is used to characterize residents’ living standards. The ratio of urban population to resident population (x4) is used to represent the urbanization rate (Table 2).
The geographic detector is utilized to identify key factors affecting the scale of open public spaces. The factor detection shows that the interpretation of the economic development level, residents’ living standards, urbanization rate and population size on the scale of open public space have all passed the significance test of 0.001 (Table 3), indicating that the above factors have significant impacts on the scale of open public spaces. Among them, the interpretation of the residents’ living standards is the most critical to the level of open public spaces, followed by economic development level, with urbanization rate ranking thir.
The results of the interactive detection (Table 4) show that the interaction of each factor is mainly a two-factor enhancement for the interpretation of the scale of the open public space. The interaction between urbanization rate and other factors has a significant explanatory power. Among them, the interaction between urbanization rate and population size has the highest explanatory power, while the interaction between residents’ living standards and urbanization rate is second. The interaction between population density and population size has the least impact. However, the interaction between urbanization rate and population size has an important impact on the scale of open public space.

4. Discussion

4.1. Spatial Heterogeneity of Urban Open Public Space

Given the characteristics of social and economic development and natural geography, there is a big difference in the scale of open public space in Chinese cities. The results of this study are basically consistent with the existing research, in that the scale of urban open public space in the eastern region is significantly bigger than that in the central and western regions [30,31,32]. The reason is that, firstly, the ratio of green land to built-up areas in the eastern region is the highest. Secondly, the provincial, national, and county road areas in the eastern region, especially the urban road density areas, are higher than the central and western regions. In addition, the higher level of economic development in the eastern region is also a sound factor. Factors like these make the scale of open public spaces in eastern region bigger than that of central and western regions. Liu et al. [30] found that, although the green land rate in the eastern region in China is the highest, there is a convergence of regional differences in the green land rate in built-up areas in Chinese cities. Wu et al. [31] found that the ratio of green land rate to built-up areas showed a decreasing pattern from the southeast to northwest. Ye et al. [32] also proposed that there was a significant difference in urban green space in China, and the level of urban greening was stepped down from the east to the west.

4.2. The Residents’ Living Standards and the Scale of Urban Open Public Space

Residents’ living standards have an important impact on the scale of open public spaces. With an increase in resident income, resident demands for environmental conditions, infrastructure and public services are gradually increasing, and residents are more inclined to live in areas with a larger scale of open public space, which is basically consistent with the existing studies. For example, Choumert [33] proposed that the demand for urban green space will increase with the increase in average household income. Kline [34] found that per capita income had a positive impact on open public space, but the impact was gradually waning; Kahn et al. [35] proposed that there was a positive correlation between per capita income and public space. Yue et al. [36] pointed out that the distribution of the low-income population was related to the accessibility of parks and green spaces, and the streets concentrated by low-income populations had poor accessibility to parks and green spaces. A positive relationship is found between the public green space scale in a resident’s local area and life satisfaction in urban Australia, and public green space is welfare enhancing for urban residents, meaning that adequate allowance should be made for its provision when planning urban areas [37].

4.3. The Economic Development Level and the Scale of Urban Open Public Space

The economic development level has a significant impact on the scale of open public space. Firstly, with an improvement in the economic development level, the government not only improves the living environment of the residents, but also improves the urban parks, green spaces, urban landscape and transportation accessibility. Secondly, the construction of open public space requires a large amount of financial support, so economically developed areas have a stronger capability to build open public space than underdeveloped areas. This is basically consistent with the existing research. For example, Xu et al. [38] pointed out that the decline of local government revenue will affect the input of green land construction funds. Wu et al. [31] found that the green space area in built-up areas in cites is positively correlated with the regional GDP, and that it decreases from the southeast to northwest in China. Ye et al. [32] also found that GDP has a significant impact on the level of urban green space construction. Liu et al. [39] found that the economic development level is the direct driving force for the green space rate in built-up areas. The economic development level is not only a key factor affecting the green space rate in the built-up areas, but also the factor that indirectly affects the population density and industrial structure. Furthermore, another study indicated that urban green space coverage increases at the initial stage of economic development, and then starts to decrease as GDP per capita exceeds RMB50,855, then increases again at a higher GDP per capita level (RMB107,558) in Chinese cities [40]. This calls for policy makers to effectively manage the tradeoffs between continuous economic development and better natural amenities.

4.4. The Population Size and the Scale of Urban Open Public Space

The factor of population size and the scale of the open public space are mutually reinforced in Chinese cities. This not only reflects people’s demands for a better environment and the agglomeration effect, but also reflects the mutually promoted relationship between the urban population and the green land, which is consistent with the existing research. During the reconstruction of an old city, the city authorities will plan for more open public space, such as building parks and widening roads. In another way, when new urban districts are to be built, authorities will construct more open public space to improve the urban ecological environment. For example, Wu et al. [31] showed that the green space area in built-up areas positively correlated with the population size. Liu et al. [41] found that the increase in population in cities promotes the expansion of green space and the population size is one of the key elements to ensure that the urban green space will achieve its given ends. Ye et al. [32] demonstrated that the relationship between urban population size and green area was a two-way promotion, mainly reflected in the following aspects: on one hand, with the increase in population, the urban ecological environment has been continuously improved and urban green space construction has also increased; on the other hand, urban green spaces play a crucial role in maintaining urban ecosystem sustainability by providing numerous ecosystem services [22]. As the urban green space increases, urban ecosystem services provided by green spaces will improve, which will attract a large number of people to gather and result in an increase in urban population.

5. Conclusions

This study analyzes the regional differences, spatial distribution and influencing factors of urban open public space scales in Chinese cities using the Theil index, coefficient of variation, ESDA and a geographic detector combined with big earth data. We conclude that:
(1) In 2015, the average proportion of open public space areas in Chinese cities was 17.98% at provincial level, and the scale of open public space in Beijing was the biggest, reaching 29.18%. The spatial distribution of the open public space scale at the provincial level shows the ‘East–Central–West’ low-lying land pattern. Its regional difference also was an ‘East–Central–West’ low-lying land pattern. The spatial distribution of the open pubic space scale is consistent with the spatial layout of China’s economic development. The open pubic space scales in 18 provinces are lower than the average, where those provinces are mainly located in the central and western region and have a lower economic development level;
(2) For the prefecture-level cities, the urban open public space scale is increasing with the increase in city size and economic development level. The scale of open public spaces in super cities is biggest, while that of small cities is the smallest. Moreover, it is biggest (reaching 20.26%) in developed cities, compared to the relatively developed, relatively undeveloped and undeveloped cities. There exists a positive spatial autocorrelation of the open public space scale in prefecture-level cities. The open public space scales of urban agglomeration in Beijing–Tianjin–Hebei, Yangtze River Delta, Pearl River Delta, Sichuan Basin, and Yunnan–Guizhou, with their higher economic development levels, are larger than surrounding cities, showing obvious ‘clustering’ characteristics. The Hu line is the feature line of China’s population distribution and, to some extent, it also becomes the dividing line of the urbanization level. The population size on the southeast side of the line accounts for more than 94% when compared to the northwest. Cities on the southeast side of the line have generally higher urbanization and economic development levels than the national average. The open public space on the southeast side of the Hu line has a large scale, while the scale on the northwest side of the Hu line is relatively small. The overall urban public space scale shows a stepped decrease from the east to the central sides, then to the west;
(3) There is a significant difference in the spatial distribution of urban open public space scales in prefecture-level cities. The differences in urban open public space reduce with an increase in city size, and increase as the economic development level decreases. The open public space scales of super cities, megacities, larger cities and medium cities are centralized and evenly distributed. The open public space scales of all types of cities except the undeveloped are of even distribution. For city size, small cities have the biggest difference with a coefficient of variation of 1.04, followed by middle cities and super cities. For different economic development levels, the difference in the scale of open public spaces among undeveloped cities is largest, reaching 0.30, followed by relatively developed cities, and is the smallest in developed cities with a coefficient of variation of only 0.24;
(4) The factors, including economic development level, the residents’ living standards, the urbanization rate and the population size, have sound explanatory powers on the scale of open public space. Among them, the interpretation of the residents’ living standards is the most critical to the level of open public space, followed by economic development level, and urbanization rate ranks third. As urbanization, population sizes and economic development levels increase, residents’ growing demands for open public space will facilitate more planning and construction of open public spaces. The interaction between various factors has improved the explanatory power of the scale of open public spaces in cities. The interaction between urbanization rate and population size has the highest explanatory power.
This work especially achieves a breakthrough in data source, and solves the core evaluation content of SDG11.7.1. However, the following shortcomings still exist: according to the concepts of open public space in SDG11.7.1, the open public space types in this study currently only contain green public space and road data, but no other types; the open public space cannot be identified as available to all by sex, age and persons with disabilities; the accessibility of various types of open public spaces is not considered.

Author Contributions

Conceptualization, formal analysis, P.W. and X.Z.; data curation, P.W. and J.W.; investigation, methodology, Y.M.; writing—original draft preparation, P.W.; writing—review and editing, X.Z.; project administration, B.W. and F.G. All authors have read and agreed to the published version of the manuscript.

Funding

This research was founded by funded by the Strategic Priority Research Program of Chinese Academy of Sciences (No.XDA23100601).

Acknowledgments

We thank members of the research group in the program, and also wish to thank the editors and anonymous reviewers for their insightful comments.

Conflicts of Interest

The authors declare no conflicts of interest.

References

  1. Dong, Y.; Dong, W. The Construction of Ecological Functions of Urban Open Space. Appl. Mech. Mater. 2011, 99, 606–610. [Google Scholar] [CrossRef]
  2. Wei, F.; Li, W.M.; HuangPu, J.Q. A study on urban open space planning standards. City Plan. Rev. 2016, 40, 74–80. [Google Scholar]
  3. Debnath, A.K.; Chin, H.C.; Haque, M.M.; Yuen, B. A methodological framework for benchmarking smart transport cities. Cities 2014, 37, 47–56. [Google Scholar] [CrossRef] [Green Version]
  4. United Nations. World Urbanization Prospects: The 2014 Revision; United Nations Department of Economic and Social Affairs Population Division: New York, NY, USA, 2014. [Google Scholar]
  5. United Nations. World Cities Report 2016; UN-HABITAT: Nairobi, Kenya, 2016. [Google Scholar]
  6. Pan, J.H.; Wei, H.H. Urban Blue Book: China’s Urban Development Report NO.8; Social Sciences Academic Press: Beijing, China, 2015. [Google Scholar]
  7. Fang, C.L.; Zhou, C.H.; Gu, C.L. Theoretical analysis of interactive coupled effects between urbanization and eco-environment in mega-urban agglomerations. Acta Geogr. Sin. 2016, 71, 531–550. [Google Scholar] [CrossRef]
  8. United Nations. Transforming Our World: The 2030 Agenda for Sustainable Development. 2015. Available online: https://sustainabledevelopment.un.org/post2015/transformingourworld/publication (accessed on 25 September 2015).
  9. Mehaffy, M.W.; Elmlund, P.; Farrell, K. Implementing the New Urban Agenda: The central role of public space. Urban Des. Int. 2019, 24, 4–6. [Google Scholar] [CrossRef] [Green Version]
  10. Wüstemann, H.; Kalisch, D.; Kolbe, J. Access to urban green space and environmental inequalities in Germany. Landsc. Urban Plan. 2017, 164, 124–131. [Google Scholar] [CrossRef]
  11. Fan, P.; Xu, L.; Yue, W.; Chen, J.Q. Accessibility of public urban green space in an urban periphery: The case of Shanghai. Landsc. Urban Plan. 2016, 165, 177–192. [Google Scholar]
  12. Kabisch, N.; Strohbach, M.; Haase, D.; Kronenberg, J. Urban green space availability in European cities. Ecol. Indic. 2016, 70, 586–596. [Google Scholar] [CrossRef]
  13. Bertram, C.; Rehdanz, K. The role of urban green space for human well-being. Ecol. Econ. 2015, 120, 139–152. [Google Scholar] [CrossRef] [Green Version]
  14. Kilnarová, P.; Wittmann, M. Open Space between Residential Buildings as a Factor of Sustainable Development—Case Studies in Brno (Czech Republic) and Vienna (Austria). In IOP Conference Series: Earth and Environmental Science; IOP Publishing: Bristol, UK, 2017; Volume 95, pp. 1–13. [Google Scholar]
  15. Aletta, F.; Lepore, F.; Kostara-Konstantinou, E.; Kang, J.; Astolfi, A. An experimental study on the influence of soundscapes on people’s behaviour in an open public space. Appl. Sci. 2016, 6, 276. [Google Scholar] [CrossRef] [Green Version]
  16. Bahriny, F.; Bell, S. Patterns of Urban Park Use and Their Relationship to Factors of Quality: A Case Study of Tehran, Iran. Sustainability 2020, 12, 1560. [Google Scholar] [CrossRef] [Green Version]
  17. Jiang, H.Y.; Xiao, R.B.; Liang, H.Y.; Yao, J.C.; Li, Z.S. Methods and practices of collaborative planning of urban-rural open space: Acase study of nanhal district Foshan city. City Plan. Rev. 2018, 42, 44–50. [Google Scholar]
  18. Yang, G.Q. Diverse metropolitan open spaces ensure urban livability: Analysis of international design work camp for Frankurt Rhine-Main metropolitan region in Germany. Urban Plan. Forum 2014, 2, 105–111. [Google Scholar]
  19. Chen, K.L.; Gong, J.Z.; Liu, Y.S.; Chen, X.Y. The Spatial-temporal differentiation of green space and its fragmentation during the past thirty-five year in Guangzhou. J. Nat. Resour. 2016, 31, 1100–1113. [Google Scholar]
  20. Li, Z.M.; Fan, R.T. Visuaization analysis of foreign open space research evolution and frontiers. Urban Plan. Int. 2017, 36, 34–53. [Google Scholar] [CrossRef]
  21. Jin, Y.; Fan, W.; Zhou, X. Landscape typology research on the combination of linear open space and sustainable modes of transportation in the center of the street. Urban Rural. Plan. 2018, 1, 69–77. [Google Scholar]
  22. Song, P.; Kim, G.; Mayer, A.; He, R.; Tian, G. Assessing the Ecosystem Services of Various Types of Urban Green Spaces Based on i-Tree Eco. Sustainability 2020, 12, 1630. [Google Scholar] [CrossRef] [Green Version]
  23. Juanle, W.; Cheng, K.; Bian, L.; Han, X.; Wang, M. Integration Framework and Key Technology of Big Earth Data for SDGs and Beautiful China Evaluation. Remote. Sens. Technol. Appl. 2018, 33, 775–783. [Google Scholar]
  24. Andries, A.; Morse, S.; Murphy, R.J.; Lynch, J.; Woolliams, E.R. Seeing Sustainability from Space: Using Earth Observation Data to Populate the UN Sustainable Development Goal Indicators. Sustainability 2019, 11, 5062. [Google Scholar] [CrossRef] [Green Version]
  25. UN-HABITAT. SDG Indicators Metadata Repository. 2018. Available online: https://unstats.un.org/sdgs/metadata/ (accessed on 4 March 2016).
  26. Zhao, X.Y.; Wang, W.J.; Wan, W.Y. Regional inequalities of residents’ health level in China: 2003–2013. Acta Geogr. Sin. 2017, 72, 685–698. [Google Scholar]
  27. Zhao, X.Y.; Ma, Y.Y.; Chen, H.H.; Gao, Z.Y.; Xu, B. Spatio-Temporal Distribution of Rural Multidimensional Poverty and Influencing Factors in the Inland River Basin of Arid Areas—A Case Study of Shiyang River Basin. Econ. Geogr. 2018, 38, 140–147. [Google Scholar]
  28. Wang, J.F.; Xu, C.D. Geodetector: Principle and prospective. Acta Geogr. Sin. 2017, 72, 116–134. [Google Scholar]
  29. Wang, J.F.; Zhang, T.L.; Fu, B.J. A measure of spatial stratified heterogeneity. Ecol. Indic. 2017, 67, 250–256. [Google Scholar] [CrossRef]
  30. Liu, Z.Q.; Zhou, Y.Y.; Wang, J.D. Spatial Pattern Evolution of city scale Green Rate of Built District in China. J. Northwest For. Univ. 2019, 9, 28–36. [Google Scholar]
  31. Wu, B.Y.; Zhong, Q.L.; Cheng, D.L.; Sun, X.M.; Zhang, P.S. Research on spatial distribution characteristics and its influencing factors of the city green space in China. J. Shenyang Univ. Soc. Sci. 2012, 14, 13–16. [Google Scholar]
  32. Ye, J.H. Study on the regional differences and influencing factors of urban greening construction level in China. Product. Res. 2013, 6, 94–96. [Google Scholar]
  33. Choumert, J. An empirical investigation of public choices for green spaces. Land Use Policy 2010, 27, 1123–1131. [Google Scholar] [CrossRef] [Green Version]
  34. Jeffrey, K. Public demand for preserving local open space. Soc. Nat. Resour. 2006, 19, 645–659. [Google Scholar]
  35. Kahn, M.E.; Matsusaka, J.G. Demand for environmental goods: Evidence from voting patterns on California initiatives. J. Law Econ. 1997, 40, 137–174. [Google Scholar] [CrossRef] [Green Version]
  36. Yue, B.J.; Lin, A.W.; Sun, C. The analysis of low-income people’s park green space accessibility based on 2SFCA in Wuhan. Mod. Urban Res. 2017, 8, 99–107. [Google Scholar]
  37. Ambrey, C.; Fleming, C. Public greenspace and life satisfaction in urban Australia. Urban Stud. 2014, 51, 1290–1321. [Google Scholar] [CrossRef]
  38. Xu, H.; Liu, Z.Q. China’surban built up area green space ratio from 1996-2013. Planners 2016, 32, 126–132. [Google Scholar]
  39. Liu, L.Y.; Liu, Z.Q.; Wang, J.D.; Hong, G.W. Spatial distribution patterns and impact mechanism of green space rate in built areas along 106 nation highway. J. Chin. Urban For. 2019, 4, 1–6. [Google Scholar]
  40. Chen, W.Y.; Wang, D.T. Economic development and natural amenity: An econometric analysis of urban green spaces in China. Urban For. Urban Green. 2013, 12, 435–442. [Google Scholar] [CrossRef]
  41. Liu, Z.Q.; Wang, J.D. Empirical Analysis on Regional Differences of Urban Green Space Construction Level in China Based on Theil indices. Chin. Landsc. Archit. 2015, 3, 81–85. [Google Scholar]
Figure 1. Flow chart for the process of assessing the regional differences and influential factors of open public spaces.
Sustainability 12 02514 g001
Figure 2. Scale of urban open public space in China.
Sustainability 12 02514 g002
Figure 3. The regional differences in open public space scale in China.
Sustainability 12 02514 g003
Figure 4. Boxplot of scale of urban open public space (the red represents city types by urban scale, and the blue is by economic development levels).
Sustainability 12 02514 g004
Figure 5. The regional differences in open public space scale in different sized city.
Sustainability 12 02514 g005
Figure 6. The regional differences in open public space at different economic development levels.
Sustainability 12 02514 g006
Figure 7. (a) Spatial distribution and (b) cold–hotspot pattern of open public space scale at provincial level in China.
Sustainability 12 02514 g007
Figure 8. (a) Spatial distribution and (b) cold–hotspot pattern of open public space scale at prefecture-level cities.
Sustainability 12 02514 g008
Table 1. The road widths used in this study.
Road LevelHigh WayNational RoadProvincial RoadCounty RoadTownship RoadCity StreetPedestrian Path
Width (m)50403030251510
Table 2. Description of explanatory variables.
Explanatory VariablesDescription (Unit)MeanStandard Deviation
Economic development levelPer capita GDP (Yuan)49,686.4529,916.65
Population densityTotal population/land area (people/km2)3779.692688.05
Residents’ living standardsPer capita disposable income (Yuan)27,119.716528.48
Urbanization rateProportion of urban population and Resident population (%)51.4216.42
Population sizeResident population (10,000 people)400.50332.81
Table 3. The explanatory power of various influencing factors on open public spaces at city level.
Detection Indexq Value
(Detection Index)
p Value
(Significant Level)
Economic development level (x1) 0.20880.000
Population density (x2)0.20000.1616
Residents’ living standards (x3)0.22720.000
Urbanization rate (x4)0.17870.000
Population size (x5)0.10640.000
Table 4. The interaction between influencing factors of open public space.
FactorsEconomic Development Level (x1)Population Density (x2)Residents’ Living Standards (x3)Urbanization Rate (x4)
Population density (x2)0.2661
Residents’ living standards (x3)0.27840.2931
Urbanization rate (x4)0.30980.22330.3100
Population size (x5)0.33480.14690.34470.3735