Article

Gaze Point in the Evacuation Drills: Analysis of Eye Movement at the Indoor Wayfinding

1
School of Architectural, Civil, Environmental and Energy Engineering, Kyungpook National University, Daegu 41566, Korea
2
Department of Fire and Disaster Prevention Engineering, Changshin University, Changwon 51352, Korea
3
Department of Fire Protection Engineering, Pukyong National University, Busan 48513, Korea
*
Author to whom correspondence should be addressed.
Sustainability 2020, 12(7), 2902; https://doi.org/10.3390/su12072902
Submission received: 28 February 2020 / Revised: 31 March 2020 / Accepted: 3 April 2020 / Published: 5 April 2020
(This article belongs to the Section Sustainable Transportation)

Abstract

:
Signage systems are the main means of resolving the wayfinding problem in an emergency evacuation. However, recent literature has proven that signage systems are often not effective in an indoor wayfinding decision-making situation. Many studies that attempted to solve the problem did not consider the interaction between the optimal location of signage systems and gaze characteristics. Therefore, this study aimed to provide basic database to determine the optimal location of signage by analysing the characteristics of eye movements according to the type of junction. To achieve this, we conducted evacuation experiments in a maze set composed of eight junctions that we created ourselves and analysed the eye movement data of participants with 5196 gaze points and duration of 895,581.49 ms. The result showed that participants most often look between 100 cm and 150 cm (vertical height) in the corridor and in junctions. In addition, the gaze points of the evacuees are quantified by the horizontal and vertical directions according to the type of junction where the wayfinding decisions occur. This investigation showed that there are marked differences depending on the type.

1. Introduction

Indoor wayfinding describes the process of finding a relatively safe location or determining the path to an exit in the event of building evacuation [1,2]. Indoor wayfinding is relatively simple if the individual can see the exit directly or if the layout of the building is simple or intuitive. However, when evacuating from large buildings, wayfinding is often difficult due to the building’s complex layout. In addition, under these circumstances, people (including building occupants, pedestrians, and visitors) tend to attempt evacuation via the way they entered, bypassing or ignoring emergency exits [2,3,4]. Because the length of escape time is a critical determinant of survival [5,6], indoor wayfinding in a complex building designed like a maze is key to safe evacuation under emergency situations [7] and shortest wayfinding for occupants/pedestrians becomes a matter of life and death as the dimension and complexity of a building increase [8].
Signage systems (e.g., emergency exit, and corridor signage) are the main means of resolving the wayfinding problem in an emergency evacuation. Signage systems can increase indoor wayfinding performance because it facilitates finding exits within a complex building in emergency situations [9,10]. Signage systems are routinely installed in many buildings, and design guides and regulations highlight the specifications for this [11,12,13]. However, most of these guides and regulations do not quantify the effectiveness of a signage system in emergency situations [14]. Furthermore, recent literature has proved that signage systems are often not effective in an indoor wayfinding decision-making situation [15,16,17].
To overcome these limitations, previous research has investigated the optimal method to support human wayfinding using experimental approaches (e.g., post-trial questionnaires, video recordings and virtual reality experiments). This line of research is of two types—1) enhancement of signage system performance and 2) examination of human wayfinding characteristics.
Studies on enhancing signage systems performance investigate the efficiency of signage systems according to the type, colour and design of the signage system [9,16,17,18,19,20,21,22,23,24,25], and optimal installation location of exit signs [5,26,27,28]. For enhancement of signage system performance, some researchers have studied the efficiency of signage systems according to type. For example, Vilar et al. [9] analysed the wayfinding characteristics of people according to two types of signage systems (i.e. vertical and horizontal conditions) in a virtual reality (VR) environment. O’Neill [18] experimented with three signage types (no signage, textual signage, and graphic signage) in five building layouts. Frantzich and Nilsson [19] conducted experiments on three types of guidance systems in simulated situations (flashing lights, rows of flashing lights, and floor markings). Some researchers also demonstrated [20,21,22,23,24] that flash lights had a positive effect on the wayfinding of subjects through experimental studies, and conducted experimental studies of people’s choices based on signage colour [24,25].
In the cases of experiments on signage location, Kobes et al. [5] conducted an experimental study on the types of route selection of subjects based on the locations of signage through an evacuation experiment conducted at a hotel. In addition, several studies have developed a model to select optimal installation locations for signage systems [26,27,28].
Studies on human wayfinding characteristics are concerned with wayfinding characteristics (environment of space [1,7,29,30], handedness [1,31]), gaze characteristics when wayfinding [32], decision-making time [14,16,33], and visual catchment area (VCA) [14,34]. In order to analyse the wayfinding characteristics according to the environment of the space, Vilar et al. [7] and Vilar E et al. [29] analysed the wayfinding of subjects based on the brightness and width of junctions through VR experiments. Veeraswamy et al. [1] and Jeon [30] analysed wayfinding characteristics by conducting questionnaires on route selections at various junction types and proved the relationship between handedness and route selection. Scharine et al. [31] also confirmed the relationship between handedness and path selection through experiments. To analyse the gaze characteristics of people in buildings, Bianconi et al. [32] analysed gaze points based on building design using eye trackers via the VR environment. In addition, in a study on the decision-making of people in buildings, Xie et al. [17] analysed the decision-making time of people at indoor junctions, and Fu et al. [33] analysed the decision-making time for individuals and groups at junctions through evacuation experiments in the building. Xie et al. [14] and Filippidis et al. [34] also conducted research to introduce the interactions of people and signage systems through VCA. However, these studies did not analyse the interaction between the optimal location of signage systems and gaze characteristics.
Within this context and considering that junctions are a key decision-making point in indoor wayfinding, this study aims to provide a basic database (DB) for determining the optimal location of signage systems by analysing the characteristics of eye movements according to the type of junction. To this end, maze set experiments were carried out to simulate the corridor and junction of complex buildings, and gaze points were analysed using an eye tracker so that the characteristics of eye movements could be understood. The gaze point characteristics of the participants in the corridor and junction were analysed as follows: (1) gaze points in maze set, (2) difference in gaze points between corridors and junctions, and (3) characteristics of gaze points depending on the type of junction. Each section of the paper discusses these factors with the aim of enhancing current installation guides and regulations for signage systems. Therefore, the results of this experiment can be used to improve the installation guides and regulations of the signage system while also providing a human experimental DB on the characteristics of eye movements in emergency evacuations.

2. Experimental Method

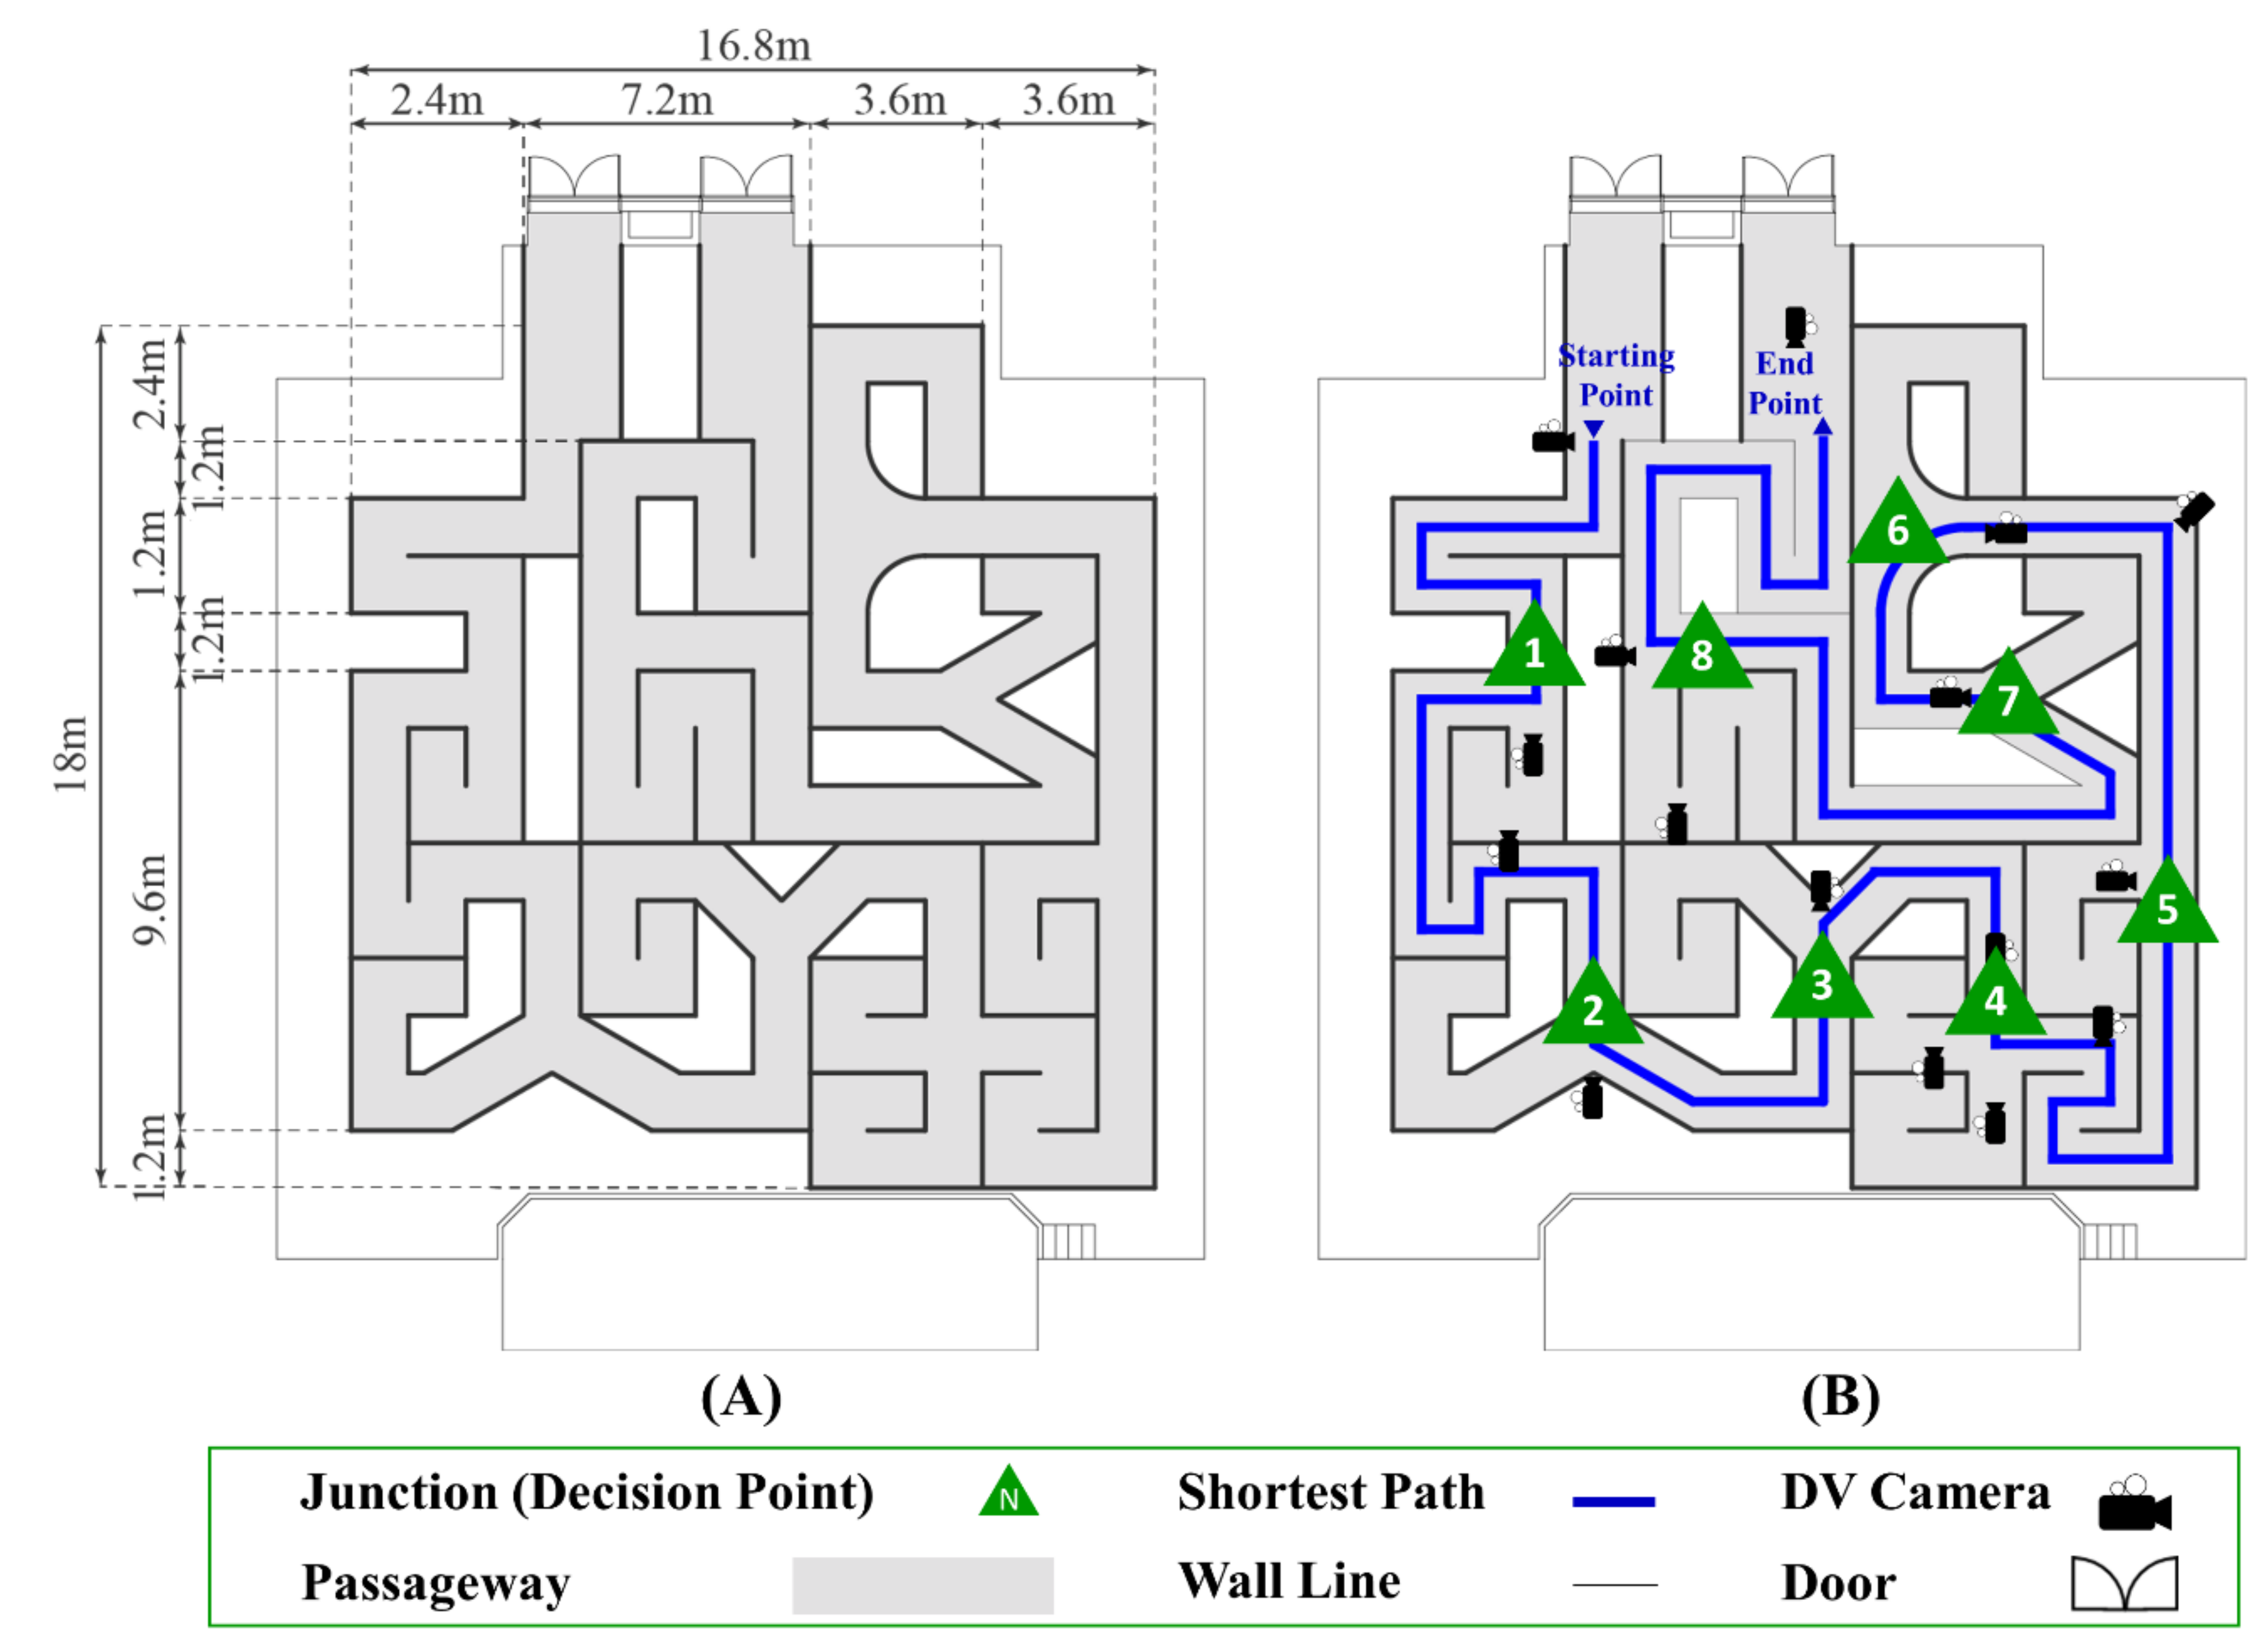
2.1. Maze Set Production Process and Layout

The experiment was conducted using a maze set to control all factors that influence indoor wayfinding except the type of junction (e.g. intensity of illumination, familiarity of the space and signages). The research team created and tested a maze set with different controlled factors. For the creation of the maze set, we first selected eight junctions consisting of three directions (left, straight, right) that generally were selectable by people in the building. The floor plan was organised using this means of selection, and the maze set was created by referring to the set manufacturing method [35,36].
The materials of the maze set walls were created with standardised manufactured corrugated cardboard sheets and the maze width (1.2m) complied with the minimum corridor width standard of the “Enforcement Decree of the Building Act” in the Republic of Korea [37]. In addition, the height of the wall (2.2 m) was configured so that the subjects could not see outside while in the maze. Figure 1A shows the layout of the maze set created by the researchers. The test area was located on the 1st floor of the building and the maze set included both corridors and junctions. The overall size of the maze set was 16.8 m × 18 m. As shown in Figure 1B, researchers asked the participants to perform wayfinding from the start point to the end point. After entering the start point, participants are supposed to move along the corridor, to face junctions (eight times in total), and to find the end points through a choice of path at each point. All behaviours of the participants in the maze set were recorded with total of 16 digital video (DV) cameras. The completed maze set is shown in Figure 2.

2.2. Participants and Experimental Procedures

All procedures of our experiment were approved by the Institutional Review Board (IRB) of the university. The participants consisted of 12 university students (eight males and four females) and were aged between 20 and 26 years. While subjects pass through the maze set, eye movement data were collected with a total of 895,581.49 ms duration at 5196 gaze points. The researchers selected the participants for the experiments by the strict standards as follows based on the literature review:
  • Participants should not have prior knowledge about the maze set (structure and shape, location of the entrance and exits, routes; the academic literature emphasizes that when occupants evacuate, they are greatly influenced by previous experiences (e.g., familiarity with the space [14] )).
  • All participants are right-handed (Veeraswamy et al. [1,31] found that there is a clear difference between right-handed and left-handed persons in their choice of routes).
  • Participants should not need glasses as they have to wear eye trackers. In addition, they should not feel any discomfort (e.g., dizziness) while wearing the eye trackers.
  • The supervisor asked the subjects to find the end point as quickly as possible, as if they were evacuating in an emergency situation.
First, participants were guided blindfolded from outside the building to the start point on the first floor of the building. Then, at the signal of the supervisor, they entered the maze set. Figure 3 shows the eight types of junctions that the participants faced while moving along the corridors of the maze set. They were supposed to choose to go straight, turn left, or turn right in each case. To record their movements, decision times and eye movement completely and accurately, head-mounted mini video (HMMV) cameras, GoPro 6 (GoPro, US), DV cameras (Hanwha Techwin, Republic of Korea), and eye tracking glasses (ETGs)(SMI, Germany) were used. All the experiments were conducted under the assumption that the participants were evacuating in emergency situations without smoke. It is noteworthy in this experiment that no signage systems were installed inside the maze set.

2.3. Data Gathering and Analysis Method

In this experiment, SensoMotoric Instruments (SMI) (Teltow, Germany) ETGs were used to gather/analyse the eye movement data of the participants. The device, called the SMI-ETG 2.0, is worn like a normal pair of glasses and includes a high-definition scene camera (resolution: 1280 × 960, 24 fps) and special eye tracking technology that captures the eye movements of the participant wearing it. The eye tracker frame rate was 30 Hz, and the tracking range covered a horizontal field of 80° and a vertical field of 60°. In addition, SMI-ETG is composed of eye tracking glasses, Recording Unit (RU), and BeGaze software.
All participants put on HMMV cameras and ETGs before the experiment to collect data, and the equipment worn was fixed to prevent movement during the evacuation. In order to enhance the accuracy of eye tracking, researchers conducted three-point calibration (eye movement calibration for three points) once the participants were wearing the ETGs but before entering the maze set. Participants wearing the ETGs were asked to look at three points (installed on the wall 1.5 m away from the participants) one after another. Researchers performed the calibration by clicking the cursor displayed on the scene video of the RU every time participants looked at a point.
The subjects then participated in the experiment according to the experimental method presented in the section above. Recorded images were analysed by the BeGaze software, which shows start and end time (ms) and duration (ms) of each movement by dividing eye movement into fixation, saccade and blink in the recorded images. Then, the eye movement data of participants was analysed in terms of the duration of fixation and saccade movement, excluding blinks.
Researchers set the areas of interest (AOIs) as shown in Figure 4 below to analyse the subject’s gaze point in the maze set. The AOIs of the vertical wall of the maze set was divided into 50 cm intervals according to the provisions of the National Fire Safety Code in the Republic of Korea (NFSC) [13]. Vertical wall AOIs are displayed in the order of A1, A2, A3, and A4 from bottom to top. Horizontal AOIs are divided into left, centre, and right, based on the width of the corridor at the decision point of the junction (i.e., the horizontal area of the wall that is equal to the width of the corridor is the centre). This is expressed as L (left), C (centre), and R (right), respectively. In addition, spaces other than walls, such as floors and ceilings are represented by O (other).
The subjects wore ETG and HMMV cameras as shown in Figure 5a, and the subject’s eye movement data and behaviour in the maze set were recorded as shown in Figure 5b. Using recorded data, the researchers analysed gaze point and duration of the participants’ eye movement data (except blinks) which occurred during the wayfinding process in the maze set. Figure 5c below shows the data gathering and analysis method. Among recorded eye movement data, the duration of each event (fixation, saccade) is analysed, and the locations of gaze points for each event are divided according to AOIs presented in Figure 4. Figure 5c shows an example of the gaze point analysis that occurred while the subject passed junction 8, including six events that occurred when the subject entered junction 8. The researchers performed date analysis by extracting start (ms) and duration (ms) AOIs from each event; this task was carried out in the entire maze set. Gaze point was analysed differentiating between gaze point of junction and gaze point of the corridor. The gaze point of junction was defined to be from the moment the gaze of the participant enters the AOIs defined for each junction to the moment it exits the junction. The cases where a subject takes a wrong direction and subsequently re-enters a junction are excluded from the analysis because the characteristics of the decision points, in which the subject is positioned, changes. The movements of all the subjects are different and the inside of the maze set does not have features, such as the colours of the wall, which distinguish the space in the image. This means that the location of the gaze point in the recorded image cannot be analysed automatically. Researchers had to analyse the points in the entire course of the movement of the maze set manually.
As shown in Figure 5d, the Kruskal–Wallis test was used to calculate the average and distribution of eye movement data and confirm statistical significance in the maze-set. The Kruskal–Wallis test is a non-parametric statistical test that assesses the differences among three or more independently sampled groups on a single, non-normally distributed continuous variable. These data analyses were conducted using SPSS software version 24 (IBM: Armonk, New York, US).

3. Experimental Results

3.1. Participants Gaze Point in Maze Set

The gaze points of participants while finding their way in the maze set were analysed to identify the general gaze point of the evacuees in a complex building without signage system. While subjects pass through the maze set, eye movement data were collected, with a total of 895,581.49 ms duration at 5196 gaze points. Table 1 shows the result for average duration of all gaze points according to vertical AOIs. The AOI with the longest duration was A3 (100–150 cm). In addition, average duration of the subject’s gaze in A3 was 27,145.64 ms (36.37%), followed by A2 (21,984.92 ms), A4 (11,783.41 ms), O (7114.10 ms), and A1 (6603.72 ms). The result of the Kruskal–Wallis test revealed significant differences in the time duration of the participant to watch vertical AOIs (df = 4, p = 0.000 < 0.05). This result is worth considering while preparing design guides and regulations for evacuation signage systems.

3.2. Gaze Point of the Corridor and Junction

This section analyses the participants’ gaze points divided into decision points (junction) and corridors. To do this, the average duration of a gaze point was analysed based on vertical AOIs and the result is presented in Table 2. From the data generated during the wayfinding in the entire maze set by the subjects, 4353 gaze points (total duration = 749,669.83 ms) occurred in the corridors while average duration per subject was 62,472.48 ms. On the other hand, 843 gaze points (duration time = 145,911.66 ms) occurred at the junctions with the average duration per subject of 12,159.31 ms. The result of analysis of each gaze point according to the position (junction and corridor) and vertical AOIs is shown in Table 2.
The AOI recording the maximum duration time in the corridor was A3. The average duration time of the subjects in A3 was 23,324.49 ms (37.34%), followed by A2 (18,430.03 ms), A4 (9563.66 ms), O (6106.12 ms), and A1 (5048.18 ms). Kruskal–Wallis test results showed that there was a significant difference in the time of participants watching vertical AOIs in the corridor. (df = 4, p = 0.000 < 0.05) (Table 2).
The AOI that recorded the maximum duration time at a junction was A3. The average duration time of the subjects in A3 was 3821.15 ms (31.43%), followed by A2 (3554.89 ms), A4 (2219.75 ms), A1 (1,555.54 ms), and O (1007.98 ms). The Kruskal–Wallis test showed the difference in the time for which participants watched vertical AOIs at a junction was significant. (df = 4, p = 0.006 < 0.05) (Table 2).
It was found that the AOI with the highest duration both corridors and junctions was A3 (100–150 cm). In addition, it was noted that the current standards on exit signs to be installed in the corridor are mostly less than 100 cm (National Fire Protection Association (NFPA), 1.5–4.55 cm; International Organization for Standardization (ISO) 16,069, 120–150 cm and less than 30 cm; and NFSC, less than 100 cm).
Under the assumption that the affordance of exit signage would increase if exit signages were placed in locations where people gaze at most often, it would be worth considering the results of this study in relation to the standards. In addition, researchers found that the installation location is not individually specified by the junction in most design guides and regulations of evacuation signage systems. Therefore, the next section deals with the subject’s gaze point at the junctions.

3.3. Gaze Point with Respect to the Type of Junction

The current section compares the distribution of subject gaze points at the junctions of the maze set. This analysis was conducted to identify the difference in evacuees’ gaze point depending on the type of junction they were faced with during wayfinding in the building. A total of 843 gaze points (duration time = 145,911.66 ms) were analysed at the junctions based on the duration of a gaze at vertical and horizontal AOIs by junction type. The results are shown in Table 3 and Figure 6. Table 3 shows the distribution along the horizontal, vertical, and each AOI at each junction, and Figure 6 presents this image by ranks. Since the AOI value with the highest gaze ratio is 27.19%, the gaze ratio was graded at an equal interval of 5% from 0% to 30%. As a result, the gaze ratio in each AOI is represented by seven levels (1: 0%; 2: 0–5%; 3: 5–10%; 4: 10–15%; 5: 15–20%; 6: 20–25%; 7: 25–30%).
The share of gaze duration in horizontal AOIs was highest at C area (37.96%) at all junctions, followed by R area (28.40%), and L area (25.36%). In particular, as seen in junction 1 (where participants can take right-hand turns only) and junction 5 (where participants can take left-hand turns only), the share of participants’ watching the centre was 45.41% and 41.65%, respectively; moreover, the distribution of the duration of the gaze in alternative directions was 52.32% and 30.26%, respectively. The ranked gaze ratio in Figure 6 describes the above phenomena in more detail. In junction 1, AOIs (A2C, A4C, A2R, A3R) with rank 4 or higher are concentrated in the selectable directions (C and R areas), and similarly AOIs (A3L, A3C, A4C) with rank 4 or higher in junction 5 are concentrated in the selectable direction (L and C areas). Also, the unselectable directions at both junctions were all very low with rank 1 or 2. This result is important because the share of gazes in alternative directions is far higher than when participants looked in directions that were impossible to choose.
In addition, as seen in junction 7 (where the angle of junction is 60°), junction 3 (where the angle of junction is 90°), and junction 2 (where the angle of junction is 120°), the share of participants watching the centre was 17.85%, 35.05% and 38.62%. In other words, as the angle of the Y-junction increases, so does the share of gaze duration at area C in the horizontal AOIs. Figure 6 shows that the sums of ranks of the C area at junctions 2, 3, and 7 decrease with an increasing angle to 14, 13, and 10 respectively, and the positions of the highest ranked AOIs were A2C and A3C at junction 2, A2L at junction 3, and A2L at junction 7. Furthermore, when the walls are at a right angle such as at a T-junction (junction 8), the probability of gaze duration at C area (66.11%) in the horizontal AOIs also increases, as compared with junction 6 (34.96%), where the walls are curved.
Also, an in-depth analysis of the five junctions which were either Y or T junctions was conducted to compare gaze points based on the paths at the junctions. Also, 180-degree junctions are considered T junctions (junctions 6, 8), and 90–180 degree junctions are considered Y junctions (junctions 2, 3, 7) (refer to Figure 3). Two alternative directions (right and left) are defined, depending on the angles. The result of analysis is shown in Table 4and Figure 7, below. Table 4 shows the distribution of gaze points in Y or T junctions, andFigure 7 shows this image according to rank (Rank selection criteria are the same as in Figure 6.). In particular, at Y junctions in horizontal areas, there is no big difference in the share of the gaze duration in areas L (35.68%), R (33.38%), and C (30.27%). By contrast, in vertical AOIs, the difference in the distribution of gaze duration was the highest with A2 (40.99%), followed by A3 (27.34%), A1 (19.84%), A4 (11.16%), and O (0.67%). Also, there was a marked difference at T junctions compared to Y junctions. At T junctions of horizontal AOIs, the gaze duration distribution was C (46.50%), L (28.02%), and R (23.62%), so gazes were concentrated in C area. However, in vertical AOIs, the share of duration was highest in A3 (39.43%), followed by A2 (30.82%) A4 (14.32%), A1 (13.57%), and O (1.86%). Figure 7 shows that the gaze point in the T junction is more highly concentrated in the C area, compared with the Y junctions. The T junction has a rank value 6 in A3C, a rank value 4 in A2C, and a rank value 3 or less only in other AOIs. In comparison, the Y junction has a rank value 4 or higher in A2L, A3C, and A2C, and a rank value 3 or lower in other AOIs.
The results are limited by the fact that the study does not consider the presence of smoke and toxic gases, a possibility in real evacuation situations. In addition, the experiment in this study was only conducted on adults in their 20s, and therefore cannot describe differences in eye movement by age. In addition, there is no comparison with the analysis result of the participants’ gaze points when the signage system is installed inside the maze set. However, the results are significant as they provided a basic DB for the details of the design guides and regulations of the evacuation signage system by various junction types, all of which will be encountered in actual evacuation situations.

4. Conclusions

This paper analysed the characteristics of eye movements during indoor wayfinding situations. A maze set experiment was conducted with the analysis of eye movement data with 5196 gaze points and duration of 895,581.49 ms.
  • The result showed that participants most often look between 100 cm and 150 cm (vertical height) in the corridor and in junctions.
  • In addition, the gaze points of the evacuees are quantified by the horizontal and vertical directions according to the type of junction where the wayfinding decisions occur. This investigation showed that there are marked differences depending on the type. In particular, participants tend to look in a certain direction when there is only one alternative.
  • In addition, as the angle of the Y junction increases, so does the share of gaze duration at area C in the horizontal AOIs. Furthermore, when the walls are at a right angle, such as at a T junction, the probability of gaze duration at C area in the horizontal AOIs also increases, as compared with a junction where the walls are curved.
  • Results show that the current heights of the signage are not aligned with most people’s gaze points, suggesting the need to change signage position according to the type of junction.
This research is significant in that it provides a scientific basis for details of the design guides and regulations of evacuation signage system. It also provides a database to quantify signage efficiency compared to the results of gaze point analyses at signage junctions. Future studies would greatly benefit from considering smoke generated in the evacuation process and comparing eye movement characteristics according to the presence of a signage system.

Author Contributions

Writing – original draft, Y.-H.B.; Writing – review & editing, Y.-C.K., R.-S.O., J.-Y.S., W.-H.H. and J.-H.C.; Conceptualization, R.-S.O.; Data curation, J.-Y.S.; Supervision, W.-H.H. and J.-H.C. All authors have read and agreed to the published version of the manuscript.

Funding

This work was supported by the National Research Foundation of Korea (NRF) grant (No. NRF-2018R1A2B3005951), which was funded by the Korean government (MSIT).

Acknowledgments

This paper was originally presented at Interflam 2019 conference. The authors revised and developed the conference proceeding [38] for journal submission and peer-review.

Conflicts of Interest

The authors declare no conflict of interest.

References

  1. Veeraswamy, A.; Galea, E.; Lawrence, P. Wayfinding Behavior within Buildings—An International Survey. Fire Saf. Sci. 2011, 10, 735–748. [Google Scholar] [CrossRef]
  2. Shields, T.J.; Boyce, K.E. Study of evacuation from large retail stores. Fire Saf. J. 2000, 35, 25–49. [Google Scholar] [CrossRef]
  3. Sime, J.D. Movement toward the familiar: Person and Place Affiliation in a Fire Entrapment Setting. Environ. Behav. 1985, 17, 697–724. [Google Scholar] [CrossRef]
  4. Nilsson, D.; Frantzich, H.; Saunders, W.L. Influencing exit choice in the event of a fire evacuation. Fire Saf. Sci. 2008, 9, 341–352. [Google Scholar] [CrossRef]
  5. Kobes, M.; Helsloot, I.; de Vries, B.; Post, J.G.; Oberijé, N.; Groenewegen, K. Way finding during fire evacuation; an analysis of unannounced fire drills in a hotel at night. Build. Environ. 2010, 45, 537–548. [Google Scholar] [CrossRef]
  6. Gwynne, S.M.V.; Kuligowski, E.D.; Kinsey, M.J.; Hulse, L.M. Modelling and influencing human behaviour in fire. Fire Mater. 2017, 41, 412–430. [Google Scholar] [CrossRef]
  7. Vilar, E.; Rebelo, F.; Noriega, P.; Duarte, E.; Mayhorn, C.B. Effects of competing environmental variables and signage on route-choices in simulated everyday and emergency wayfinding situations. Ergonomics 2014, 57, 511–524. [Google Scholar] [CrossRef]
  8. Vilar, E.; Rebelo, F.; Noriega, P. Smart Systems in Emergency Wayfinding: A Literature Review. In Lecture Notes in Computer Science (including Subseries Lecture Notes in Artificial Intelligence and Lecture Notes in Bioinformatics); Springer: Berlin/Heidelberg, Germany, 2018; Volume 10919, pp. 379–388. ISBN 9783319918020. [Google Scholar]
  9. Vilar, E.; Rebelo, F.; Noriega, P. Indoor human wayfinding performance using vertical and horizontal signage in virtual reality. Hum. Factors Ergon. Manuf. Serv. Ind. 2014, 24, 601–615. [Google Scholar] [CrossRef]
  10. Mantovani, G.; Gamberini, L.; Martinelli, M.; Varotto, D. Exploring the Suitability of Virtual Environments for Safety Training: Signals, Norms and Ambiguity in a Simulated Emergency Escape. Cogn. Technol. Work 2001, 3, 33–41. [Google Scholar] [CrossRef]
  11. National Fire Protection Association. NFPA. 101: Life Safety Code® Handbook, 2018th Edition; National Fire Protection Association: Quincy, MA, USA, 2018. [Google Scholar]
  12. International Organization for Standardization. ISO 16069:2017 Graphical Symbols-Safety Signs-Safety Way Guidance Systems (SWGS); International Organization for Standardization: Geneva, Switzerland, 2017. [Google Scholar]
  13. Ministry of Public Administration and Security. NFSC (National Fire Safety Code) 303: Fire Safety Regulation of Exit Light and Exit Sign; Ministry of Public Administration and Security: Seoul, Korea, 2016. [Google Scholar]
  14. Xie, H.; Filippidis, L.; Galea, E.R.; Blackshields, D.; Lawrence, P.J. Experimental analysis of the effectiveness of emergency signage and its implementation in evacuation simulation. Fire Mater. 2012, 36, 367–382. [Google Scholar] [CrossRef]
  15. Jeon, G.Y. An Analysis of Evacuation System Development for Underground Space with Consideration to Behaviors and Cognitive Characteristics of Humans under Emergency Situations. Ph.D. Thesis, Kyungpook University, Daegu, Korea, 2005. [Google Scholar]
  16. Xie, H.; Galea, E.R.; Lawrence, P.J. Experimental Study of the Effectiveness of Dynamic Signage System. In Proceedings of the 13th International Fire Science and Engineering Conference, London, UK, 24–26 June 2013; pp. 967–978. [Google Scholar]
  17. Galea, E.; Xie, H.; Lawrence, P. Experimental and Survey Studies on the Effectiveness of Dynamic Signage Systems. Fire Saf. Sci. 2014, 11, 1129–1143. [Google Scholar] [CrossRef] [Green Version]
  18. O’neill, M.J. Effects of signage and floor plan configuration on wayfinding accuracy. Environ. Behav. 1991, 23, 553–574. [Google Scholar] [CrossRef]
  19. Frantzich, H.; Nilsson, D. Evacuation Experiments in a Smoke Filled Tunnel. Third Int. Symp. Hum. Behav. Fire 2004, 229–238. [Google Scholar]
  20. Jin, T.; Yamada, T. Experimental study on effect of escape guidance in fire smoke by travelling flashing of light sources. Fire Saf. Sci. 1994, 4, 705–714. [Google Scholar] [CrossRef] [Green Version]
  21. Galea, E.R.; Xie, H.; Deere, S.; Cooney, D.; Filippidis, L. Evaluating the effectiveness of an improved active dynamic signage system using full scale evacuation trials. Fire Saf. J. 2017, 91, 908–917. [Google Scholar] [CrossRef]
  22. Galea, E.R.; Xie, H.; Deere, S.; Cooney, D.; Filippidis, L. An international survey and full-scale evacuation trial demonstrating the effectiveness of the active dynamic signage system concept. In Proceedings of the Fire and Materials, San Francisco, CA, USA, 6–8 February 2017; Volume 41, pp. 493–513. [Google Scholar]
  23. Kwee-Meier, S.T.; Mertens, A.; Schlick, C.M. Age-related differences in decision-making for digital escape route signage under strenuous emergency conditions of tilted passenger ships. Appl. Ergon. 2017, 59, 264–273. [Google Scholar] [CrossRef]
  24. Nilsson, D.; Frantzich, H.; Saunders, W. Coloured flashing lights to mark emergency exits—Experiences from evacuation experiments. Fire Saf. Sci. 2005, 8, 569–579. [Google Scholar] [CrossRef] [Green Version]
  25. Kinateder, M.; Warren, W.H.; Schloss, K.B. What color are emergency exit signs? Egress behavior differs from verbal report. Appl. Ergon. 2019, 75, 155–160. [Google Scholar] [CrossRef]
  26. Zhang, Z.; Jia, L.; Qin, Y. Optimal number and location planning of evacuation signage in public space. Saf. Sci. 2017, 91, 132–147. [Google Scholar] [CrossRef]
  27. Church, R.; ReVelle, C. The maximal covering location problem. Pap. Reg. Sci. 1974, 32, 101–118. [Google Scholar] [CrossRef]
  28. Chen, C.; Li, Q.; Kaneko, S.; Chen, J.; Cui, X. Location optimization algorithm for emergency signs in public facilities and its application to a single-floor supermarket. Fire Saf. J. 2009, 44, 113–120. [Google Scholar] [CrossRef]
  29. Vilar, E.; Rebelo, F.; Noriega, P.; Teles, J.; Mayhorn, C. The influence of environmental features on route selection in an emergency situation. Appl. Ergon. 2013, 44, 618–627. [Google Scholar] [CrossRef] [PubMed]
  30. Jeon, Y.T. A Study on Route Choice Patterns According to Agent Characteristics for Algorithms Complement of Evacuation Simulation Tools. Master’s Thesis, Pukyong National University, Busan, Korea, 2017. [Google Scholar]
  31. Scharine, A.A.; McBeath, M.K. Right-Handers and Americans Favor Turning to the Right. Hum. Factors J. Hum. Factors Ergon. Soc. 2005, 44, 248–256. [Google Scholar] [CrossRef] [PubMed]
  32. Bianconi, F.; Filippucci, M.; Felicini, N. Immersive Wayfinding: Virtual Reconstruction and Eye-Tracking for Orientation Studies Inside Complex Architecture. Int. Arch. Photogramm. Remote Sens. Spat. Inf. Sci. 2019, 42, 143–150. [Google Scholar] [CrossRef]
  33. Fu, L.; Cao, S.; Song, W.; Fang, J. The influence of emergency signage on building evacuation behavior: An experimental study. Fire Mater. 2019, 43, 22–33. [Google Scholar] [CrossRef] [Green Version]
  34. Filippidis, L.; Galea, E.R.; Gwynne, S.; Lawrence, P.J. Representing the influence of signage on evacuation behavior within an evacuation model. J. Fire Prot. Eng. 2006, 16, 37–73. [Google Scholar] [CrossRef]
  35. Jeon, E.-M.; Choi, J.-H.; Hong, W.-H. Analysis on Characteristics of Human Behavior and Cognitive Effects according to Types of Egress Route Instruction in a Large-scale Mazy Facility TT—Analysis on Characteristics of Human Behavior and Cognitive Effects according to Types of Egress Route I. J. Archit. Inst. Korea Plan. Des. 2011, 27, 51–58. [Google Scholar]
  36. Zhang, J.; Klingsch, W.; Schadschneider, A.; Seyfried, A. Transitions in pedestrian fundamental diagrams of straight corridors and T-junctions. J. Stat. Mech. Theory Exp. 2011, 2011, P06004. [Google Scholar] [CrossRef]
  37. Korea Ministry of Government Legislation. Enforcement Decree of the Building Act; Korea Ministry of Government Legislation: Sejong City, Korea, 2017. [Google Scholar]
  38. Bae, Y.H.; Kim, Y.C.; Oh, R.S.; Son, J.Y.; Hong, W.H.; Choi, J.H. Gaze point in the maze set evacuation drills: analysis of eye movement at the indoor wayfinding. In Proceedings of the 15th International Fire Science and Engineering Conference–Interflam, London, UK, 1–3 July 2019; pp. 739–750. [Google Scholar]
Figure 1. The schematic view of the maze set: (A) floor plan; (B) location of junctions, shortest path and digital video (DV) cameras.
Sustainability 12 02902 g001
Figure 2. (A) The panoramic view of the maze set; (B) the interior of the maze set.
Sustainability 12 02902 g002
Figure 3. The eight types of junctions in the maze set: combination of three directions (left, straight, right), three Y-type junctions (junctions 2, 3, 7) with different angles (60°, 90°, 120°), T-type junction with curved walls (junction 6).
Sustainability 12 02902 g003
Figure 4. Area of interest (AOI) division in the maze set: (A) junction; (B) corridor. In this paper, we divided junctions both vertically and horizontally. Corridors were only divided horizontally. For example, for a gaze point shown in (A), vertical AOI is A3, while horizontal AOI is C. This is represented as A3C.
Sustainability 12 02902 g004
Figure 5. Data gathering and analysis method: (a) participants wore experimental devices and passed through the maze set; (b) recorded images and eye-tracker gaze points were gathered by DV cameras, head-mounted mini video (HMMV) cameras, and eye tracking glasses (ETGs); (c) eye movement data analysis method (eye movement data is represented as image files containing gaze points and duration). Researchers identified AOIs in each image file and divided gaze points manually; (d) statistical analysis.
Sustainability 12 02902 g005
Figure 6. Rank of subject gaze points in AOIs by junction type.
Sustainability 12 02902 g006
Figure 7. Rank of gaze duration at T and Y junctions.
Sustainability 12 02902 g007
Table 1. Average duration time in the maze set (*** p < 0.01).
AreaAverage
Duration
Time (ms)
Proportion
(%)
Kruskal-Wallis Test
Mean Rankdf sig
A16,603.728.8518.1740.000***
A221,984.9229.4639.33
A327,145.6436.3745.25
A411,783.4115.7929.50
O7,114.109.5320.25
Total74,631.79100
Abbreviations: df, degree of freedom; sig, significance probability
Table 2. Average duration time (*p < 0.05, *** p < 0.01) at the corridor and decision points (junction).
TypeAverage
Duration
Time (s)
Proportion
(%)
Kruskal-Wallis Test
Mean Rankdf sig
CorridorA15048.188.0817.8340.000***
A218,430.0329.5038.42
A323,324.4937.3445.33
A49563.6615.3129.83
O6106.129.7721.08
Total62,472.48100.00
JunctionA11555.5412.7921.7140.006***
A23554.8929.2439.42
A33821.1531.4340.50
A42219.7518.2630.79
O1007.988.2820.08
Total12,159.31100.00
Abbreviations: df, degree of freedom; sig, significance probability
Table 3. Probabilities of subject gaze points in AOIs by junction type.
AOI Probability (%)
Junction
ALL12345678
Horizontal
AOIs
L25.362.27 23.52 46.99 40.16 30.26 4.16 39.00 8.24
C37.9645.41 38.62 35.05 34.46 41.65 34.96 17.85 66.11
R28.4052.32 37.86 17.96 22.37 2.69 35.52 41.25 25.65
O8.280.00 0.00 0.00 3.00 25.40 25.36 1.91 0.00
Total100.00 100.00 100.00 100.00 100.00 100.00 100.00 100.00 100.00
Vertical
AOIs
A112.793.93 9.42 23.44 19.13 8.27 4.08 27.55 4.51
A229.2443.86 43.64 25.05 27.83 11.32 5.92 51.13 35.70
A331.4335.16 36.76 33.87 39.21 23.01 35.76 12.48 39.82
A418.2617.04 10.19 17.63 10.83 32.00 28.88 6.93 19.98
O8.280.00 0.00 0.00 3.00 25.40 25.36 1.91 0.00
Total100.00 100.00 100.00 100.00 100.00 100.00 100.00 100.00 100.00
All AOIsA1L4.020.00 2.55 7.53 7.35 1.38 0.00 11.09 1.67
A1C5.103.93 2.80 11.83 8.38 6.89 2.72 1.73 2.06
A1R3.670.00 4.07 4.09 3.40 0.00 1.36 14.73 0.77
A2L10.071.55 13.84 16.56 11.38 6.39 0.00 24.96 4.25
A2C10.9724.43 17.83 8.06 6.09 2.25 3.60 11.87 23.33
A2R8.2017.87 11.97 0.43 10.36 2.69 2.32 14.30 8.12
A3L7.120.00 6.88 11.93 13.99 12.85 2.64 2.34 2.32
A3C13.276.32 17.06 12.04 19.29 10.16 13.44 3.03 27.19
A3R11.0428.85 12.82 9.89 5.93 0.00 19.68 7.11 10.31
A4L4.150.72 0.25 10.97 7.43 9.65 1.52 0.61 0.00
A4C8.6210.73 0.93 3.12 0.71 22.35 15.20 1.21 13.53
A4R5.495.60 9.00 3.55 2.69 0.00 12.16 5.11 6.44
O8.280.00 0.00 0.00 3.00 25.40 25.36 1.91 0.00
Total100.00 100.00 100.00 100.00 100.00 100.00 100.00 100.00 100.00
Table 4. Distribution of gaze duration at T and Y junctions.
AOIProbability (%)
All JunctionY Junction (2,3,7)T Junction (6,8)
Horizontal
AOIs
L25.3635.6828.02
C37.9630.2746.50
R28.4033.3823.62
O8.280.671.86
Total100.00 100.00 100.00
Vertical
AOIs
A112.7919.8413.57
A229.2440.9930.82
A331.4327.3439.43
A418.2611.1614.32
O8.280.671.86
Total100.00 100.00 100.00
All AOIsA1L4.026.995.19
A1C5.105.005.98
A1R3.677.852.40
A2L10.0718.558.67
A2C10.9712.9412.64
A2R8.209.509.51
A3L7.126.719.55
A3C13.2710.6722.29
A3R11.049.967.59
A4L4.153.434.61
A4C8.621.665.59
A4R5.496.074.12
O8.280.671.86
Total100.00 100.00 100.00

