Abstract
The present study proposes a multiscale analysis of the dynamics of life expectancy at birth in Romania from 1990 to 2018, starting from the hypothesis of its dependence on the level of economic development or the quality of the public health infrastructure. Information from official sources (National Institute of Statistics (INS), Eurostat) was processed using agglomerative hierarchical clustering, principal component analysis and multiple regression. The main part of the analysis is devoted to the evolution of this indicator by gender and residence area. The conclusions of this study converge towards certifying the existence of some strong correlations between the evolution of life expectancy at birth at the territorial level and the illustrative factors of the level of economic and social development or of the quality of the environment. The persistence or amplification of territorial disparities attests to the general process of regional polarization. The results of the study confirm the hypothesis of a significant correlation between the level of economic development and that of the quality of the public health infrastructure, expressed through the dynamics of life expectancy at birth.
1. Introduction
The social-political and cultural changes that followed the fall of the totalitarian regime in December 1989 brought about an undisputed improvement in the quality of life in Romania, against the background of the democratization measures needed to implement a market economy and a human rights-based society. This improvement was not immediately felt, a certain latency of the worsening trend of the standard of living during the last decade of the totalitarian period being present at least until about the year 2000, with a significant increase in the incidence of cardiovascular diseases, in the context of serious social and economic dysfunctions similar to those of the other Eastern European states [1] (p. 615). The dissolution of the totalitarian political regime shaped the context in which the new tendencies for improving the quality of life progressively appeared, leading to an increase in life expectancy. Some authors believe that the explanation for this coincidence is due to the cultural changes associated with democratization [2]. Modern values promote a health-conscious behaviour or increase the demand for health services. Previous authoritarian regimes were able to impose effective policies to fight infectious diseases, the main effect being a tendency to equal the life expectancy of western states, but they failed to control cardiovascular or degenerative diseases. The link between democratization and the improvement of the population’s health—expressed, first and foremost, by the changes in the causes of mortality—is certified by studies on Europe where, until 1990, there was a convergence of the lagging states (Greece, Portugal, Spain) with the other western states [3]. The positive effects were, however, long in coming in the eastern part of the continent after 1990, precisely because democratization was part of a complete systemic change that caused major societal disruptions [4]. The gaps that separate the east from the west of the continent seem to endure [5], although from the perspective of demographic aging there is a certain convergence [6]. A somewhat similar convergence can be noticed in a wider regional framework, including North Africa and the Middle East. But very large differences persist in terms of morbidity patterns and health behaviour. While the prevalence of coronary heart diseases and unhealthy eating behaviours (alcohol, tobacco, drugs) in the former communist states is still of concern, inequalities related to the access to health infrastructures are rapidly growing in the southern flank of the Mediterranean [7].
However, the increase in life expectancy is equally strongly linked to the level of public spending in the health field, but also in related fields, such as education or building comfort. Such connections have long been tackled in studies on the determinants of health [8,9]. Higher life expectancy values result in increased public spending in the education system [10,11], investments in human capital being important for understanding the variability of this indicator in developed countries [12]. Investments in human capital are undoubtedly the main driver of economic growth, with the decrease in mortality as a result of life prolongation leading to its higher capitalization [13]. An important part is also played, in this context, by the reduction of infant mortality, closely related to the quality of health, educational and economic factors [14] (p. 117). The fall of the communist regime found Romania in an almost unique position in Europe, with very high values of this indicator (26.9 ‰ in 1990, almost double compared to neighbouring Bulgaria and 4–5 times higher than in western states). In the immediately following period, the regressive tendencies manifested in the last totalitarian decade (1980–1990) were still present, and they even grew stronger, against the background of some rapid social and economic changes [15]. Although there has been an increase, life expectancy in Romania is still among the lowest in the EU. This situation reflects not only the prevalence of unhealthy behaviours but also profound socioeconomic inequalities and substantial deficiencies in the provision of health services [16]. Some studies show that a large part of the population reports unmet health care needs [17,18]. Access to high profile public services is marked by significant regional, economic or cultural discrepancies, especially in rural areas and marginalized communities facing serious problems [19]. Gender gaps are not different from those recorded in Europe as a whole, but those related to the level of education are more important [20]. The excessive concentration, in some important centres, of quality medical services further limits the access of some categories of the population (for example, the number of doctors per 1000 inhabitants is 5.5 in the capital as compared to only 1.5 in the surrounding region) [21].
Therefore, life expectancy can also be regarded as an indicator of the performance of public health systems, its variability being correlated with the level of incomes. A more or less significant increase in their value has an important effect, especially in developing countries, when health is granted consistent funds [22,23,24]. However, the inequalities that appear in the health state of the population in developed states are much more complex, exceeding the simple connection with the income indicators [25,26,27]. An important role can also be played by factors related to local particularities, such as: types and extent of disease risks, economic conditions, demographic characteristics, quality of the environment, accessibility of the offer and the quality of health services etc. Last but not least, medical progress and behavioural changes act in a positive way, especially by increasing life expectancy among middle-aged and old people. This is particularly true in developed countries [28], as opposed to the lagging ones, in which progress is due to the improvement of the child healthcare system [29] (p. 141).
Based on these considerations, the present study proposes a longitudinal analysis from a time-space perspective of the dynamics of life expectancy at birth in Romania after 1990 within the European context. The study provides a geographical view on a topic of general interest, complementing previous studies [30] (pp. 154–164). The novelty of the approach is that it carries out a factorial analysis meant to explain some observed territorial distributions, thus updating certain tendencies that are still in their early stages or have not yet been manifested. We consider that the deepening and updating of this issue may support a further approach from the perspective of sustainable development and resilience, with possible applications in studies with other scales of analysis.
The working hypotheses, closely related to one another, can be summarized as follows:
Hypothesis 1 (H1):
The existence of some territorial disparities reflects the tendency of a significant concentration of public health services in several large urban centres;
Hypothesis 2 (H2):
The dynamics of life expectancy at birth in Romania, after 1990, was dependent on the level of economic development and the quality of the public health infrastructure;
Hypothesis 3 (H3):
Over the last 30 years, factors that can influence life expectancy have changed, and their importance is either decreasing or becoming consolidated.
These hypotheses will be tested through contextual, typological and factorial analyses aimed at capturing the specificity of Romania at the European level and at highlighting territorial disparities. We consider that this will provide, as much as possible, a broader interdisciplinary vision, accessible to a wider category of readers. For this purpose, descriptive analyses (agglomerative hierarchical clustering) and quantitative analyses (main component analysis, multiple regression) were performed, using information from official sources (National Institute of Statistics, Eurostat, etc.).
2. Materials and Methods
In order to test the above-mentioned hypotheses, several databases were created, containing information collected from relevant official sources:
- (a)
- Database on life expectancy at birth in European states (1990–2018), expressed in years and based on EUROSTAT [31] and DEMOGRAPHICS [32] sources. The processed information was used for contextualization. Caucasian states, Turkey and Cyprus were also included in the analysis, due to their links with Europe itself. This analysis was considered necessary in order to highlight the presence of the trends of evolution both at the continental and regional level, as well as the extent to which they are reflected in the distributions noticed at the national level.
- (b)
- Database on the structure of mortality by cause of death in Romania, at the county level (NUTS3), for the period 2012–2018, having as source the Tempo-Online database of the National Institute of Statistics [33]. 10 categories of causes were identified, based on the significance of their incidence: infectious and parasitic diseases (IPD); tumours (TUM); endocrine, nutrition and metabolism diseases (ENMD); diseases of the nervous system and sense organs (DNS); diseases of the circulatory system (DCS); diseases of the respiratory system (DRS); digestive disorders (DDT); diseases of the genitourinary tract (DGU); traumatic injuries, poisoning and external causes (EIPO); other causes (OTH). The information processed was used to track the existence of specific regional profiles with an explanatory potential.
- (c)
- Database on life expectancy at birth in the Romanian counties (NUTS 3), by gender and residence area (1990–2018), based on the Tempo-Online database of the National Institute of Statistics. The processed information was used to identify the typology and distribution of the evolution trends by means of an ascendant hierarchic classification (AHC).
- (d)
- Database on indicators that exert a certain influence on the evolution of life expectancy at birth (LEX). The selection of these indicators was subject to the restricted access to information. The following indicators were thus retained:
- -
- the gross domestic product expressed in lei/inhabitant, the average of the last three years of the two analysed subperiods (1997–1999 and 2016–2018) (GDP);
- -
- the number of doctors per 100 inhabitants at the end of the two study subperiods (PHYS);
- -
- the share of deaths caused by diseases of the circulatory system (the main death cause at the national level) at the end of the two study subperiods (DCS);
- -
- the share of the population with higher education (undergraduate and postgraduate studies) at the end of the two established subperiods (1999 and 2018), correlated with the results of the 2002 and 2011 censuses (HED);
- -
- the general fertility index of the female population, expressed in ‰, at the end of the two study subperiods (FT);
- -
- the share of urban population at the end of the two study subperiods (URB);
- -
- the share of the population with access to drinking water and sewerage supply networks at the end of the two study subperiods (SEW);
- -
- the share of forest area, expressed as a percentage of the total area in 2000 and 2018, respectively (FOR).
The sources used for this database were: the National Institute of Statistics (Tempo-Online database and the results of the 2002 and 2011 censuses) and the National Forecast Commission [34]. The data in this information set were standardized using the Z-Score procedure. The information processed was used for the principal component analysis (PCA) and multiple regression was necessary to establish the correlation between the evolution of life expectancy at birth and the factors expressed by the mentioned indicators. In order to clearly highlight the changes produced, two PCAs were operated for each of the two subperiods identified following the previous analyses:
- -
- 1990–1999, when, like in many Eastern European countries, there was a tendency of decrease/stagnation of LEX, differentiated from the territorial point of view;
- -
- 2000–2018, when a tendency for LEX growth was constantly noticed, in the context of strong territorial disparities in respect of the speed of changes.
The first set of data, intended for contextualization at the European level, uses the average values of life expectancy without gender differentiation, being limited by the information obtained for the 46 states, some of it resulting from official multiannual estimations.
The second set of data contains homogeneous information whose processing supports the testing of the three hypotheses, the main purpose being to observe regional disparities that overlap with the distribution of life expectancy values, at the same study scale. Although limited to a shorter period of time, such an analysis was considered to be necessary given the relationship that can be established between the distribution of the causes of death and life expectancy.
The third set of data tests hypothesis H1, the processed information having a high degree of reliability and comparability, being unitarily collected by official statistics. The use of AHC was chosen in this case in order to detect the evolution trends and the resulting territorial structures, being adapted to data series with a relatively uniform distribution.
The last set of data was used to test hypotheses H2 and H3, aimed at detecting changing trends and correlations observed in the two mentioned periods. The fact that the chronological overlap of the information specific to each factor is not complete was not considered an impediment, given the specific constancy or the reduced variability of some of the data. Using the same study scale as the previous two sets, the expected results thus become comparable, even if the factorial analysis selected the average life expectancy of both genders.
The information presented was statistically processed in XLSTAT, 2014 version (Addinsoft, Paris, France). The aim of all analyses was to maintain a high confidence interval, indicated by the intra/inter-class variance (in the case of AHC) or by the correlation matrix (in the case of PCA and multiple regression, using a 95% confidence interval and a tolerance of 0.0001). The number of classes/types for each analysis corresponds to the size of the sample (46 states and territories in Europe, 41 counties in Romania), opting for a number of 6 in all cases. In the case of AHC, the dissimilarity criterion used was the Euclidean distance. Ward’s method based on the nearest-neighbour chain algorithm was used for cluster agglomeration. In order to obtain the most homogenous classes, the intra-class variance did not exceed 30%. The classes are specific to each AHC, the data series being different. The results of the analyses were exposed and cartographically processed in Adobe Illustrator CS12.
3. Results and Discussions
3.1. Analysis of the Evolution of Life Expectancy at Birth in Europe (1990–2018)
This contextual analysis highlights the general increasing trend of life expectancy in all European states. While in 1990 no European state exceeded the level of 80 years, in the last year taken into consideration, 2018, half of them had a higher level. Romania, in the lower third of the initial ranking, has made obvious progress but still lags behind most European states (see Table 1).

Table 1.
Dynamics of the distribution of the European states by life expectancy level.
Following the typological analysis, six classes with a distinct profile were obtained, using the criteria mentioned in the methodology. At first sight, the distribution of the six classes identified through the AHC seems closely related to the level of economic and social development, the east-west gradient being very clearly marked. However, there is also a north-south gradient in Western Europe, ignoring the isolated cases of Iceland and Sweden, while in the southeast of the continent the significant difference between the western and eastern parts of the Balkan Peninsula escapes this logic. These disparities can be much more easily accounted for by the epidemiological transition, also dependent on diet or investments in the public health system [35,36,37]. The evolution of the demographic transition plays a significant role, especially in the evolution of infant mortality, as certified by some studies. These studies demonstrated the non-linearity of the relationship between economic growth and life expectancy, which seemed a reality before 1990 but which is no longer obvious nowadays [38,39]. Last but not least, the part played by the investments in human capital is also important, since they have significant positive correlations with the level of life expectancy in some research [40].
Classes C1–C2 (typical of Western Europe) and C4–C5 (typical of Central-Eastern Europe) stand out for the cadence of their evolution, practically preserving the same gap throughout the entire period. At the time, there were no noticeable convergence trends (Figure 1). After a quarter of a century, classes 4–5 barely reached the level of types 1–2 at the beginning of the period. This gap can only be explained as an effect of the delay of the demographic transition and the insufficient resources granted to the public health system. This is what some studies reveal [41]. There is also a difference among the countries in Central and Eastern Europe, some managing to avoid the decline or stagnation of life expectancy immediately after the fall of the totalitarian regimes (Estonia, Poland, the Czech Republic, Slovakia and the western Balkan states).
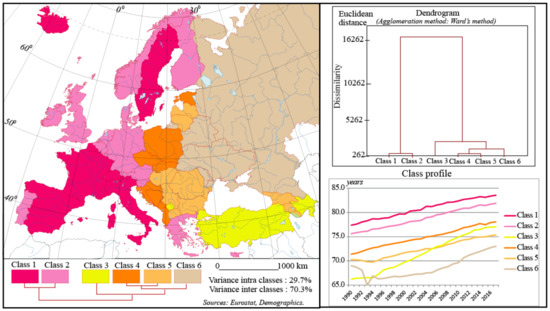
Figure 1.
Typology of the dynamics of life expectancy at birth in Europe (both sexes, 1990–2018).
Classes 3 and 6 are the most divergent ones, although they appear to be interspersed between 4 and 5. Class 3, which includes marginal states in the European context (Kosovo, Turkey and Azerbaijan, in the Caucasian area), reveals a model of evolution which is rather specific to the more developed Asian states. They massively recovered the gap that separated them from Western Europe in the years 1990–2010. The recovery trend was so strong that, at the end of the period, they reached a higher level of life expectancy than the states of SE Europe (Romania and Bulgaria, primarily). The decrease of infant mortality and the advance in the epidemiological transition, against the background of some cultural particularities, explain this situation, but the economic, social and political effects of globalization also played an important role [42].
Class 6 gathers four ex-Soviet states (the Republic of Moldova, Ukraine, Belarus and Russia) which stand out for the extent of the deterioration of life expectancy in the years 1990–2000. Having a starting point close to that of the other former communist states, they experienced at first a dramatic decline, followed by a rather long period of stagnation. Only after 2005 have they shown signs of revival. As a result, they remain the countries with the lowest life expectancy at birth in Europe, with a strong gender gap and an increased incidence of morbidity caused by long-dammed factors in the west of the continent [43,44]. The main cause of the decline was the increase in the incidence of cardiovascular and digestive diseases, against the background of economic and social instability among the adult population (aged 25–64), at least in the case of the Russian Federation [45].
In conclusion, this analysis reveals that Romania, although following the same trend of evolution of life expectancy at birth as most European states, still maintains significant gaps, even compared to Central European countries. The country is part of a group that occupies an intermediate position between the states that have experienced a continuous improvement in the level of this indicator and those marked by a significant decline, located in the former Soviet space. This position reflects the general situation which, at the regional or local level, can be marked by obvious territorial disparities, as the following analyses will demonstrate.
In order to highlight the extent to which this unfavourable position in the European context has been triggered by gaps in economic and social development, the typological analysis of the causes of death is presented below, largely dependent on the epidemiological transition, closely linked to the increase of life expectancy.
3.2. Typology of the Structure of Mortality Rate by Causes of Death in Romania (2012–2018)
The proper analysis of the dynamics of life expectancy at birth requires a review of the causes of death. Although the analysed information extends over a period of only seven years, we consider that they are sufficiently relevant to capture the existence of regional particularities or the specific incidence of certain causes. Although information prior to 2012 is only available at the national level, it shows a similar distribution of the causes of death, with slow changes. AHC highlighted the existence of six distinct classes, whose average profile shows significant deviations from the national average values, which demonstrates a regionalized incidence of the causes of death (Figure 2). Some of the ascending causes (neoplastic tumours) have a mosaic distribution, being more correlated with the degree of urbanization, as shown by their higher incidence in the counties with big cities (Cluj, Brașov, Timiș, Iași, Constanța, etc., including the capital). The main cause of mortality, the diseases of the circulatory system, has a maximum incidence in the southwest of the country. This area is more protected from the diseases of the respiratory system, which also seem to be correlated with big cities, a possible effect of their greater level of pollution. Despite its relatively low share, the incidence of digestive diseases is higher than the average in the south of Moldavia and in Maramureș, possibly in correlation with the diet and the prevalence of some addictions (such as alcohol consumption, for example). These features could also be linked with the level of economic development, the quality of the medical infrastructure or the particularities of the natural environment.
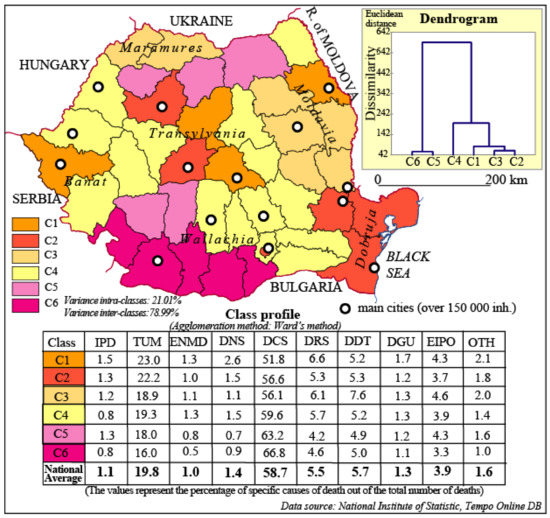
Figure 2.
Typology of the structure of mortality by cause of death in Romania (average of the 2012–2018 years). IPD—infectious and parasitic diseases; TUM—tumours; ENMD—endocrine, nutrition and metabolism diseases; DNS—diseases of the nervous system and sense organs; DCS—diseases of the circulatory system; DRS—diseases of the respiratory system; DDT—digestive disorders; DGU—diseases of the genitourinary tract; EIPO—traumatic injuries, poisoning and external causes; OTH—other causes.
The first two classes group the counties with a high degree of urbanization or in which there are important urban centres, the difference between them being given by the slightly higher incidence of circulatory system diseases—below the national average, however, in the case of class 2. Both stand out, as stated above, for the higher-than-average incidence of neoplastic tumours, a sign of their advance in the epidemiological transition, which can be explained by the presence in these administrative units of higher medical institutions and a more developed medical infrastructure. Class 1 also features significantly above-average values of respiratory tract diseases, sensitive to climatic factors or to pollution.
A similar profile can be found in class 3, which comprises two well-defined areas, the south of Moldavia and Maramureș, distinguished by the much higher-than-average weight of digestive diseases, lesions, poisonings or other external causes. The much lower value, below the average, of the neoplastic tumours can be considered, together with the specificity mentioned above, a sign of their lower level of development, closely correlated with the poorer medical infrastructure and a more vulnerable social environment.
Class 4, the most widespread, reveals a profile which can hardly be distinguished from the national average one, with a territory extending to most of Wallachia and the west of the country.
At the opposite pole, classes 5 and 6 are well represented in the southwest of the country and, less significantly, in the extreme north. What individualizes them is the very high incidence of circulatory system diseases, well above the national average, especially in the case of class 6. Possibly correlated with diet, in a context in which the quality of medical services is deficient in most counties, this cause is compensated by the much lower incidence of neoplastic tumours or of diseases of the respiratory or digestive tract.
The strong regionalization of the typology certifies the existence of some well-defined models of morbidity, disturbed only by factors such as the degree of urbanization or the development level of the public health infrastructure. The influence of these models on the dynamics of life expectancy at birth can be significant, and factors such as the above-mentioned ones become effective predictors in this regard. The obtained results support the analysis of the evolution of life expectancy by residence and gender.
3.3. Typology of the Dynamics of Life Expectancy at Birth, by Gender and Residence Area, in Romania (1990–2018)
This analysis tested hypothesis H1 and highlighted the existence of quite clearly defined regional patterns, with significant differences between the urban and rural population. Generally, the decline of the tracked indicator was lower in cities in the years 1990–2000, the tendency of recovery being earlier and the differences between types smaller, a sign of less marked disparities. By gender, there is a stronger recovery trend for the female population in the urban area.
From the perspective of their spatial distribution, the six classes are more coherent in the case of the rural population, but significantly more heterogeneous in the case of the urban one (Figure 3). In respect of the rural population, the most favourable situation is manifested by classes 1-2, grouped around the Carpathian arch. The first one, comprising Vâlcea, Suceava and Bistrița-Năsăud counties, is distinguished by the absence of decline in the years 1990–2000 and the important advance accumulated after 2000, at a level that brings it close to the values of the urban environment. Classes 3–4, with an evolution that converges towards the first group, stand out through the moderation of their recovery trend, being located in the immediate vicinity, especially in the east and southwest of the country. The last two, initially more weakly differentiated from the other four classes, are clearly distinguished by the magnitude of the decline in the years 1990–2000, especially in the case of class 6. In this way, there appeared an important gap, which could not be subsequently overcome. Towards the end of the study period, there is a tendency of convergence of classes 2–3 or classes 4–6, especially in the case of the male population. At the same time, class 1 stands out more and more clearly from the others, with slight gender differences. The general picture of the grouping of the six classes in the case of the rural population is that of a rather obvious centre-periphery gradient.
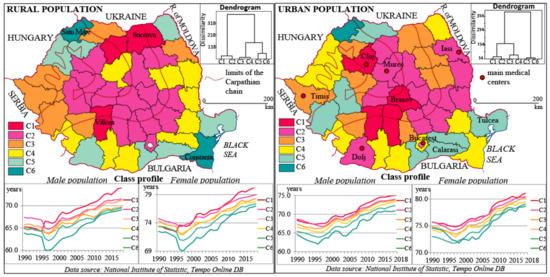
Figure 3.
Typology of the dynamics of life expectancy at birth, by gender and residential area, in Romania, between 1990 and 2018. (The dissimilarity used the Euclidean distance. The intra-class variance was of 19.73% for the urban population and of 14.24% for the rural population. The variance between classes was of 80.27% and 85.76%, respectively.)
In the case of the urban population, the first two classes reveal a comparable evolution, with a hardly felt decline in the years 1990–1995. They are the only classes that, towards the end of the period, experience an average value of over 80 years for the female population and close to 75 years in the case of the male one, a level closer to that of western states. The area formed by the two classes is quite coherent from the spatial point of view, located mainly in the central-eastern part of the country. If, in the case of some counties, the more favourable situation can be explained by the presence of some medical centres with a developed infrastructure (Cluj, Iași, Dolj, Mureș), the incidence of less economically and socially developed counties can be more difficult to grasp (Vrancea and Vaslui, for example). However, the fact that this grouping is consistent for a relatively long period of time excludes its conjunctural character; the explanation resides in the effect of its proximity to important medical centres (Covasna to Brașov, Vaslui to Iași, etc.), as well as of environmental factors, especially in the case of the Carpathian counties. Classes 3–4 have an intermediate evolution, with a more obvious decline at the beginning of the period and a moderate tendency of subsequent recovery. Less coherent from the spatial point of view, however, these classes form homogeneous clusters such as sub-Carpathian Moldavia in the NE or the one in the west of the country. Just like the previous classes, they are relatively heterogeneous, including both counties with a well-developed medical infrastructure (Timiș, Constanța) and deficient counties from this perspective (Botoșani, Teleorman, Mehedinți, etc.). This relative heterogeneity shows the need for a factorial analysis. The last two classes are distributed peripherally: in the extreme NW, where Satu-Mare county alone forms a class, marked by a massive decline in the first part of the study period, especially regarding the female population; in the SW, where Caraș-Severin and Hunedoara counties experienced a massive decline in industrial activities, especially in the mining sector; in the SE, in counties lying in the shadow cone of the capital (Giurgiu, Călărași, Ialomița) or in isolated areas (Tulcea), known for their low level of medical infrastructure development.
In conclusion, although there are similarities regarding the evolution of life expectancy at birth by gender and residential area, especially when it comes to the extremes (the largest values are recorded in Vâlcea county and the smallest in Satu Mare), we cannot talk about a clearly marked regional profile, even though we can notice more homogeneous groupings (Banat-Crișana, the SE of the country, etc.). The urban-rural polarizations in some counties are significant: a more favourable evolution in the rural area than in the urban one (Neamț, Suceava, Bistrița-Năsăud, Hunedoara, Ilfov), closely linked to the geographical factor (the mountain–sub-mountain environment) or to the positional one (Ilfov, located in the immediate vicinity of the capital); a more favourable evolution in the urban area than in the rural one (Iași, Dolj, Galați, Constanța or Cluj), explainable through the presence of important urban centres, which excessively concentrate the medical infrastructure, even at the regional level.
The results thus confirm hypothesis H1 convincingly enough. The table below provides an additional argument (see Table 2).
Table 2.
Comparative evolution of life expectancy in three categories of counties.
The results confirmed the hypothesis of the correlation between the concentration of medical activities and the increase in life expectancy, thus explaining the preservation or deepening of territorial disparities. However, in order to detect the determinants of this evolution, a more complex analysis is needed.
3.4. Factorial Analysis
The conclusions of the previous analyses justify the need to identify the factors that intervened in the dynamics of life expectancy at birth in Romania after 1990. This deepening is necessary to test hypotheses H2 and H3, reached only tangentially in the previous analyses. The eight possible explanatory factors were subject to a preliminary factorial analysis that certified the existence of a redundancy between the gross domestic product and the access to the drinking water and sewerage supply networks, as well as between the share of the population with higher education and the degree of urbanization [46,47]. For this reason, and after their collinearity was observed in the preliminary analysis, only the first factors of these couples were kept for the final analysis. In order to track the changes in the interactions between the chosen factors and the evolution of life expectancy, two main component analyses were performed for each of the two identified subperiods.
In the first decade after the fall of the totalitarian regime, in which there was an important decline in life expectancy at birth, a significantly positive correlation with the HED and FOR factors was highlighted. HED, which practically includes the degree of urbanization, as mentioned above, was strongly correlated with GDP and opposed to FT and DCS, indicating a strong influence of the level of social and economic development in creating regional disparities (Figure 4). The strong correlation between the fertility index of the female population and the life expectancy may seem surprising, but it is in agreement with the results obtained in studies on other countries [48]. Its importance is given by the connection with the process of demographic modernization. For this period, the FOR factor indicates a significant importance of the geographical environment, taking into account the high degree of afforestation of the Carpathian area.
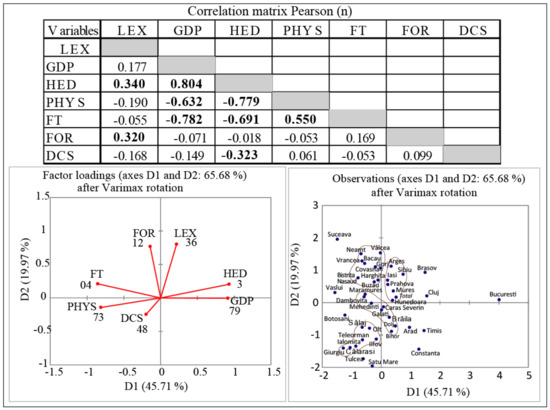
Figure 4.
Principal component analysis for the first subperiod (1990–1999). LEX—life expectancy; GDP—gross domestic product; HED—higher education; PHYS—number of physicians per 1000 inhabitants; FT—general fertility index of the female population; FOR—the share of the forest area; DCS—the share of deaths caused by diseases of the circulatory system.
In this context, the location of the capital, Bucharest, and some counties such as Cluj, Iași, Prahova and especially Sibiu and Brașov, at the top of the coordinate system, is justified by the weight of the HED factor. In the case of Suceava, Vâlcea or Neamț counties, as in the case of other counties situated in the Carpathian area, the FOR factor is the one granting them a favourable position.
The use of Varimax rotation emphasizes a number of apparent contradictions: development indicators are not always decisive in the evolution of life expectancy at birth. Counties with a high degree of urbanization and an educational level higher than the national average are located in the lower part of the coordinate system (Timiș, Constanța, Arad, etc.). The most unfavourable situation, specific to the counties in the extreme south of the country, and secondarily in the extreme northwest of the country (Satu Mare), can be regarded as a direct effect of the lower level of social and economic development. This contrast between the counties located mainly in the Carpathian area and those predominantly situated in the hilly or plain area reinforces the importance of the FOR factor for this subperiod, but also the precariousness of the medical infrastructure. D1 expresses the infrastructure and environment indicators and D2 the development ones, deficient in the above-mentioned areas. In some cases, the relatively unfavourable position can be explained by the dependence on the infrastructure of some important centres (Dâmbovița and Ilfov in relation to Bucharest, Sălaj and Bistrița-Năsăud in connection to Cluj, etc.). Most of the counties are grouped into four clusters, which largely correspond to the typology presented in the previous subsection.
In the second subperiod (2000–2018), using the same methodology, the correlations between factors changed significantly. Thus, LEX preserved a significant positive correlation with FOR, the environmental factor proving a lasting influence, whereas GDP and HED gained a much greater weight, given that PHYS maintains a negative correlation, as in the first period (Figure 5). This can be interpreted both as a deepening of the territorial disparities, especially between urban and rural areas, as revealed in the previous analyses, but also in relation to the access to the medical infrastructure, increasingly concentrated in several major centres.
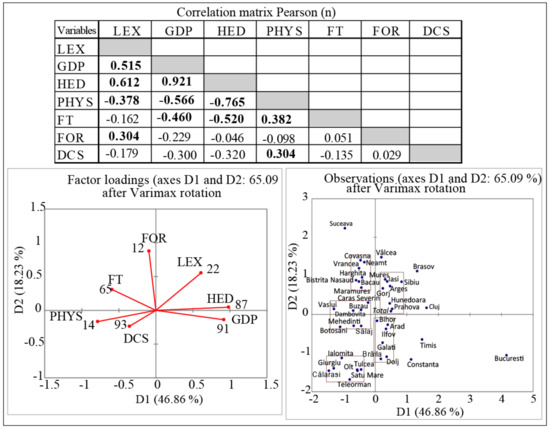
Figure 5.
Principal component analysis for the second subperiod (2000–2018).
The fact that GDP and HED became redundant explains the increased regional gaps after 2000. This evolution can be considered as an effect of the transition from a communist society, less exposed to inequalities, to a democratic society based on a market economy, where competition and competitiveness become essential factors. The weak correlation of the main cause of death (DCS) with life expectancy contrasts with its strong dependence on PHYS. This attests to the importance of medical care, unevenly distributed throughout the territory.
The factorial score along the two dimensions indicates a certain constancy of values at the territorial level. The same contrasts oppose counties with a higher level of development and a higher life expectancy at birth (Cluj, Brașov, Sibiu, Mureș, Iași) to counties with a similar economic and social profile but more deficient from the perspective of the indicator pursued (Constanța, Timis).
The shifting of the capital to the unfavourable area is significant, despite its excessive concentration of investments and the much faster increase of the incomes, advantages that did not trigger a significant progress in the quality of life. If we refer only to the urban population, the progress of life expectancy at birth was more important after 2000 in Cluj or Iași counties than in the capital, these two counties recording higher values at present. Between 2000 and 2018, Bucharest experienced an increase by 5.37 years, while Iași and Cluj by 5.62 and 6.04 years, respectively. An explanation for this situation may also be the quality of the environment, the capital being known as one of the most polluted cities in the country [49]. In conjunction with the spectacular growth in the metropolitan area of the capital (6.43 years in the same period), with a predominantly residential character, this factor becomes plausible and justifies its relatively unfavourable position. Similar situations may also have occurred in the cities of Timisoara and Constanța.
Significant progress was made in the western counties (Arad, Bihor) which at the beginning of the study period (1990) were in an unfavourable situation, growing increasingly closer to the average. The contrast between the counties in the extreme south of the country and those in the Carpathian area was still present, supported by the amplification of the social and economic disparities, but also by the quality of the environment. Thus, the values well above the average, in contrast to a level of development below the national average in counties such as Vâlcea, Suceava or Covasna, can only be correlated with the expansion of the forest areas and the reduced incidence of polluting economic activities. In the negative sense, at the opposite pole, Satu Mare county preserves its last position in respect of its absolute values, although it has improved its rank, following the same trend as other counties in the west and northwest of the country.
In order to test the degree of confidence in the results achieved, a multiple regression was performed for both periods, using LEX as a dependent variable. The values obtained are similar to those in the analysis of the main components (see Table 3). R2 was also extracted, and its dynamics changed considerably during the second period, proving that the relationship between LEX and the chosen indicators became closer, as revealed by the differences between the two periods. The adjusted value of R2 was not included in the table, the differences being insignificant.
Table 3.
Multiple regression results.
All initially selected indicators were integrated into this model. The degree of urbanization and the sewerage infrastructure, although closely related to the level of economic development represented by GDP, may be of comparative contextual interest.
Given the R2, the p-value and the significance level of 0.05, the information brought by the explanatory variables is significantly better in the period 2000–2018 than what the basic mean would reveal. Notable is the increased interdependence between life expectancy and the degree of urbanization, further confirming hypothesis H1. The spectacular rise in the dependence on the development and education level, as well as on the environmental indicator chosen, fully confirms the other two hypotheses. These results may support complementary analyses on the impact of development policies or of specific environmental factors in the context of complex processes such as the transition to a market economy or deindustrialization. The results presented converge with the international studies that point out the importance of the level of education, the access to medical infrastructure and the quality of the environment on the population’s health [50]. The European policies in this area are clearly aimed at increasing the capacity of prevention, decentralization of services and monitoring the sources of inefficiency of public health systems. The main European instrument, the EU Health Programme, underlines the need for policies for the sustainable development of public health systems, involving a continuous monitoring of the evolution of indicators such as life expectancy at birth [51]. This is what is stipulated in the European profile report [52].
4. Conclusions
Although the study was limited by the use of different, partially compatible data sources or by the incomplete, fragmentary nature of some auxiliary information, the results indicate a series of conclusions that express the evolution trends followed and confirm the formulated hypotheses.
The persistence or amplification of territorial disparities certifies the general process of regional polarization, thus verifying the H1 hypothesis. This has been regarded as a result of the adaptation to the new context of economic transition, which favours big urban centres. The stage in which Romania is at present, from the perspective of the quality of public health indicators, is one of profound changes, in line with the epidemiological and nutritional transition model verified by certain sources [53]. Although there is an important gap, from the point of view of this model, in comparison to the developed states and even to some former communist states (see [54]), the noticed trends indicate a general progress. These gaps are expected to widen in the counties that have a complex and diversified medical infrastructure, with life expectancy approaching the level of the most advanced European countries. At the opposite pole, the counties known for the precariousness of their infrastructure still show signs of relative underdevelopment.
The results of the study confirm the hypothesis of a significant correlation between the level of economic development and that of the quality of the public health infrastructure, expressed through the dynamics of life expectancy at birth (H2). However, this correlation holds true only for the last two decades, since the manifestation of the tendency of concentration and diversification of medical services in big urban centres. Without being general, this correlation also leaves room for exceptions that relate to the efficiency of the public health infrastructure, as other studies also show [41]. Nevertheless, the role of environmental factors or of the specificities that derive from lifestyle is not negligible, by exposure to specific risk factors, as some studies reveal [55].
The role of the educational level, the object of hypothesis H3, changed during the investigated period. In the first post-totalitarian decade, it was strongly correlated with the level of development and life expectancy at birth. After 2000, however, a significant correlation was observed with the fertility indicators and the incidence of cardiovascular diseases, an association also emphasized by the literature in the field [56]. This change may also be related to the democratization of the access to average or higher education institutions, including the emergence of private institution, asthe share of the population with high school or university education increased considerably (only between 2002 and 2011, there was a rise from 7.5% to 14.4% in the population with higher education, according to the carried out censuses). The hypothesis of a decreased importance of environmental factors, at least from the point of view of the indicator introduced in the analysis (weight of forest areas) is not confirmed, the correlation remaining positive throughout the study period. The local incidence of phenomena such as industrial pollution seems to have decreased with the closing down or modernization of some production capacities, as some examples show (the case of the city of Baia Mare studied by Mănoiu et al.) [57]. It is possible that the use of an indicator such as air quality indicates a significant correlation with the dynamics of life expectancy at birth, especially in the areas that used to be highly industrialized during the communist period. The indicator used in the analysis, however, illustrates the importance of the forest cover and of the mountain environment in explaining spatial differentiations in the evolution of life quality.
The conclusions presented prove that the measures meant to reduce regional gaps have become imperative, even if, after 2000, the increase in life expectancy at birth has become widespread, in line with the long-term trends noticed in developed states [58]. This study can open perspectives for the elaboration of further case studies, necessary for a more accurate determination of the causality behind the specific evolutions highlighted by these analyses. This is all the more so since the official reports on the health status of the population provide exclusively descriptive information, briefly interpreted [59]. The study demonstrates the need for a complex approach, from several perspectives, combining descriptive and factorial analyses. The issues addressed could be integrated into analysis models that define territorial disparities within the wider framework of adaptive systems. Studies in this direction are not very numerous and require a permanent improvement of the methodological setting. Within the sustainability framework, life expectancy is one of the most comprehensive indicators, measuring the progress in achieving the third Sustainable Development Goal—Good health and well-being (SDG3). It is also an outcome that results from the complex patterns of demographic, social-economic and environmental factors, and, when revealing long-term improvements, it could highlight a resilient territorial system.
Author Contributions
Conceptualization, I.M. and M.I.; methodology, I.M. and A.B.; software, data curation and resources, I.M. and A.B.; validation, formal analysis and investigation, I.M., M.I., R.-I.H.-Ș.; writing—original draft preparation, review and editing, I.M., R.-I.H.-Ș. All authors have read and agreed to the published version of the manuscript.
Funding
This research received no external funding.
Acknowledgments
The authors wish to thank the following institutions for their support: “Alexandru Ioan Cuza” University of Iași, Department of Geography; Geographical Team, Iași Branch of Romanian Academy.
Conflicts of Interest
The authors declare no conflict of interest.
References
- Bardet, J.-P.; Dupâquier, J. Histoire des Populations de l’Europe Tome III; Fayard: Paris, France, 1999. [Google Scholar]
- Mackenbach, J.P. Political conditions and life expectancy in Europe, 1900–2008. Soc. Sci. Med. 2013, 82, 134–146. [Google Scholar] [CrossRef] [PubMed]
- Cervantes, P.A.M.; López, N.R.; Rambaud, S.C. A Causal Analysis of Life Expectancy at Birth. Evidence from Spain. Int. J. Environ. Res. Public Health 2019, 16, 2367. [Google Scholar] [CrossRef] [PubMed]
- Mackenbach, J.P.; Hu, Y.; Looman, C.W.N. Democratization and life expectancy in Europe, 1960–2008. Soc. Sci. Med. 2013, 93, 166–175. [Google Scholar] [CrossRef] [PubMed]
- Zatonski, W. The East-West Health Hap in Europe: What Are the Causes? Eur. J. Public Health 2007, 2, 121. [Google Scholar] [CrossRef] [PubMed][Green Version]
- Kluge, F.A.; Goldstein, J.R.; Vogt, T.C. Transfers in an aging European Union. J. Econ. Ageing 2019, 13, 45–54. [Google Scholar] [CrossRef]
- Murray, C.J.L.; Lopez, A.D.; Naghavi, M.; Wang, H. Global, regional and national life expectancy, all-cause mortality and cause-specific mortality for 249 causes of death, 1980–2015: A systematic analysis for the Global Burden of Disease Study. Lancet 2016, 388, 1459–1544. [Google Scholar] [CrossRef]
- Auster, R.; Leveson, I.; Sarachek, D. The Production of Health: An Exploratory Study. J. Hum. Resour. 1969, 4, 411–436. [Google Scholar] [CrossRef]
- Reynolds, M.M.; Avendano, M. Social policy expenditures and life expectancy in high–income countries. Am. J. Prev. Med. 2017, 54, 72–79. [Google Scholar] [CrossRef]
- Cutler, D.M.; Lleras-Muney, A. Understanding differences in health behaviors by education. J. Health Econ. 2010, 29, 1–28. [Google Scholar] [CrossRef]
- Gradstein, M.; Kaganovich, M. Aging population and education finance. J. Public Econ. 2004, 88, 2469–2485. [Google Scholar] [CrossRef]
- Shaw, J.W.; Horrace, W.C.; Vogel, R.J. The Determinants of Life Expectancy: An Analysis of the OECD Health Data. South. Econ. J. 2005, 71, 768–783. [Google Scholar] [CrossRef]
- Kalemli-Ozcan, S.; Ryder, H.E.; Weil, D. Mortality decline, human capital investment and economic growth. J. Dev. Econ. 2000, 62, 1–23. [Google Scholar] [CrossRef]
- Trebici, V. Populația Terrei; Editura Științifică: Bucharest, Romania, 1991. [Google Scholar]
- Mureșan, C. The decrease of life expectancy at birth in Romania: Spme crisis contributions factors. Health Place 1999, 5, 187–192. [Google Scholar] [CrossRef]
- European Commission. Inequalities in access to health care. In The ESPN Report; European Commission: Brussels, Belgium, 2018; Available online: https://ec.europa-eu/social/main.jsp (accessed on 14 October 2019).
- Vlădescu, C.; Astărăstoae, V. Integrating health services within the health reform policy in Romania. Rom. J. Bioeth. 2012, 10, 78–90. [Google Scholar]
- Toader, E.; Firtescu, B.N.; Oprea, F. Determinants of Health Status and Public Policies Implications—Lessons for Romania. Transylv. Rev. Adm. Sci. 2017, 52, 128–147. [Google Scholar] [CrossRef]
- Domnariu, C. Monitorizarea Inegalităților în Starea de Sănătate a Populației României în Anul 2013; Editura Universității Lucian Blaga: Sibiu, Romania, 2014. [Google Scholar]
- OCDE/European Observatory on Health System and Policies. State of Health in the EU; OECD Publishing: Paris, France; Brussels, Belgium, 2019. [Google Scholar]
- Romania—Health Sector Reform: Improving Health System Quality and Efficiency Project; World Bank: Washington, DC, USA, 2014; Available online: http://documents.worldbank.org/curated/en/2014/03/19236433/ (accessed on 4 November 2019).
- Obrizan, M.; Wehby, G.L. Healt Expenditures and Global Inequalities in Longevity. World Dev. 2018, 101, 28–36. [Google Scholar] [CrossRef]
- Bai, R.; Wei, J.; An, R.; Li, Y.; Collett, L.; Dang, S.; Dong, W.; Wang, D.; Fang, Z.; Zhao, Y.; et al. Trends in Life Expectancy and Its Association with Economic Factors in the Belt and Road Countries—Evidence from 2000–2014. Int. J. Environ. Res. Public Health 2018, 15, 2890. [Google Scholar] [CrossRef]
- Linden, M.; Ray, D. Life expectancy effects of public and private health expenditures in OECD countries 1970–2012: Panel time series approach. Econ. Anal. Policy 2017, 56, 101–113. [Google Scholar] [CrossRef]
- Jaba, E.; Balan, C.; Robu, I.B. The Assessment of Health Care System Performance Based on the Variation of Life Expectancy. Procedia Soc. Behav. Sci. 2013, 81, 162–166. [Google Scholar] [CrossRef]
- Martín Cervantes, P.A.; Rueda López, N.; Cruz Rambaud, S. Life Expectancy at Birth in Europe: An Econometric Approach Based on Random Forests Methodology. Sustainability 2020, 12, 413. [Google Scholar] [CrossRef]
- Cui, X.; Chang, C.-T. Distribution Dynamics, Regional Differences, and Convergence of Elderly Health Levels in China. Sustainability 2020, 12, 2288. [Google Scholar] [CrossRef]
- Zheng, Y.; Chang, Q.; Yip, P.S.F. Understanding the Increase in Life Expectancy in Hong Kong: Contributions of Changes in Age and Cause-Specific Mortality. Int. J. Environ. Res. Public Health 2019, 16, 1959. [Google Scholar] [CrossRef]
- Deaton, A. The Great Escape. Health, Wealth and the Origins of Inequality; Princeton University Press: Bucharest, Romania, 2000. [Google Scholar]
- Dumitrache, L. Starea de Sănătate a Populației României. O Abordare Geografică; Univers Enciclopedic: Bucharest, Romania, 2004. [Google Scholar]
- EUROSTAT (Database Population). Available online: https://ec.europa.eu/eurostat/data/statistics-a-z (accessed on 10 June 2019).
- DEMOGRAPHICS. Available online: https://en.wikipedia.org/wiki/Demographics (accessed on 15 June 2019).
- TEMPO-ONLINE, Database of National Institute of Statistics (INS). Available online: http://statistici.insse.ro:8077/tempo-online/ (accessed on 9 June 2019).
- CNP, Database of National Forecast Comission. Available online: http://www.cnp.ro/ro/prognoze (accessed on 9 June 2019).
- Acemoglu, D.; Johnson, S. Disease and development: The effect of life expectancy on economic growth. J. Political Econ. 2007, 115, 925–985. [Google Scholar] [CrossRef]
- Chetty, R.; Stepner, M.; Abraham, S.; Lin, S.; Scuderi, B.; Turner, N.; Bergeron, A.; Cutler, D. The Association between Income and Life Expectancy in the United States, 2001–2014. JAMA 2016, 315, 1750–1766. [Google Scholar] [CrossRef]
- Ketenci, N.; Murthy, V.N.R. Some determinants of life expectancy in the United States: Results from cointegration tests under structural breaks. J. Econ. Financ. 2018, 42, 508–525. [Google Scholar] [CrossRef]
- Desbordes, R. The non-linear effects of life expectancy and economic growth. Econ. Lett. 2011, 112, 116–118. [Google Scholar] [CrossRef]
- Linden, M.; Ray, D. Aggregating bias-correcting approach to the health income relationship: Life expectancy and GDP per capita in 148 countries, 1970–2010. Econ. Model. 2017, 61, 126–136. [Google Scholar] [CrossRef]
- Hansen, C.W. Life expectancy and human capital: Evidence from the international epidemiological transition. J. Health Econ. 2013, 32, 1142–1152. [Google Scholar] [CrossRef]
- Asandului, L.; Roman, M.; Fătulescu, P. The efficiency of healthcare systems in Europe: A Data Envelopment Analysis Approach. Procedia Econ. Financ. 2014, 10, 261–268. [Google Scholar] [CrossRef]
- Bergh, A.; Nilsson, T. Good for Living? On the Relationship between Globalization and Life Expectancy. World Dev. 2010, 38, 1191–1203. [Google Scholar] [CrossRef]
- Petrukhin, I.S.; Lunina, E.Y. Cardiovascular Disease Risk Factors and Mortality in Russia: Challenges and Barriers. Public Health Rev. 2011, 33, 436–449. [Google Scholar] [CrossRef][Green Version]
- Joumard, I.; André, C.; Nicq, C.; Chatal, O. Health status determinants: Lifestyle, environment, health care resources and effciency. In OECD Economics Department Working Papers; OECD Publishing: Paris, France, 2008; Volume 626. [Google Scholar]
- Notzon, F.C.; Komarov, Y.M.; Ermakov, S.P.; Sempos, C.T.; Marks, J.S.; Sempos, E.V. Causes of declining life expectancy in Russia. JAMA Netw. 1998, 279, 793–800. [Google Scholar] [CrossRef]
- Hunter, P.R.; MacDonald, A.M.; Carter, R.C. Water Supply and Health. PLoS Med. 2010, 7, e1000361. [Google Scholar] [CrossRef] [PubMed]
- Ren, Y. The Analysis of Relationship between Urbanization and Education level Dynamic Measurement. In Proceedings of the 2017 International Conference on Economics and Management, Education, Humanities and Social Sciences (EMEHSS 2017), Hangzhou, China, 15–16 April 2017. [Google Scholar] [CrossRef]
- Chen, M.; Ching, M. A Statistical Analysis of Life Expectancy across Countries Using Multiple Regression; Sys 302 Project; Professor Tony Smith. University of Pennsylvania: Philadelphia, PA, USA, 2000; Available online: https://www.seas.upenn.edu/ese302/Projects./Project%202%20pdf (accessed on 14 October 2019).
- Iorga, G. Air Pollution Monitoring: A Case Study from Romania. In Air Quality-Measurement and Modelling; Sallis, P.J., Ed.; Intech Open: London, UK, 2016; pp. 135–162. [Google Scholar]
- Organisation for Economic Co-operation and Development. Health at a Glance: Europe 2018. Available online: https://www.oecd.ilibrary.org/social-issues-migration-health (accessed on 15 October 2019).
- European Health Report 2018: More than Numbers—Evidence for All; European Comission, EU Health Programme; WHO, Regional Office for Europe: Copenhagen, Denmark, 2018; Available online: http://www.euro.who.in/en (accessed on 12 November 2019).
- EU Health Programme—Third Healh Programme; European Comission: Brussels, Belgium, 2018; Available online: https://ec.europa.eu/health/funding/programme_en (accessed on 12 November 2019).
- McCracken, K.; Phillips, D.R. The epidemiological aging and nutritive transition. In Ageing and Place; Andrews, G.J., Phillips, D.R., Eds.; Routledge: London, UK, 2005. [Google Scholar]
- Pąj, A.; Kozela, M. Cardiovascular Disease in Central and East Europe. Public Health Rev. 2012, 33, 416–443. [Google Scholar]
- Dolea, C.; Nolte, E.; McKee, M. Changing life expectancy in Romania after the transiton. J. Epidemiol. Community Health 2002, 56, 444–449. [Google Scholar] [CrossRef]
- Dégano, I.R.; Marrugat, J.; Grau, M.; Salvador-González, B.; Ramos, R.; Zamora, A.; Marti, R.; Elosua, R. The association between education and cardiovascular disease incidence is mediated by hypertension diabetes and body mass index. Sci. Rep. 2017, 7, 12370. [Google Scholar] [CrossRef]
- Mănoiu, V.-M.; Tiscovschi, A.; Crăciun, A.-I. A deep dive into the chronic air pollution reality in Baia Mare. Part III: Air pollution effects on the local population between 1980 and 2006. Int. E-J. Adv. Soc. Sci. 2018, 4, 197–206. [Google Scholar] [CrossRef][Green Version]
- Kontis, V.; Bennett, J.E.; Mathers, C.D.; Guangquan, L.; Foreman, K.; Ezzati, M. Future life expectancy in 35 industrialised countries projections with a Bayesian model ensemble. Lancet 2017, 389, 1323–1335. [Google Scholar] [CrossRef]
- National Report of the State of Health in 2018; Ministry of Health, National Institute of Public Health and the National Center for Evaluation and Promotion of the Health Status of Population: Bucharest, Romania, 2019.
© 2020 by the authors. Licensee MDPI, Basel, Switzerland. This article is an open access article distributed under the terms and conditions of the Creative Commons Attribution (CC BY) license (http://creativecommons.org/licenses/by/4.0/).