A Case Study of Socially-Accepted Potentials for the Use of End User Flexibility by Home Energy Management Systems

 ,
,  , , ,
, , ,
Abstract
:1. Introduction
1.1. Motivation
1.1.1. Grid Optimization
1.1.2. Self-Consumption and Self-Sufficiency Optimization
1.1.3. Additional Comfort Functions
1.2. Problem and Research Need
1.3. Outline
2. Materials and Methods
2.1. Framework and HEMS Functionality
2.2. Survey Participants, Procedure, and Measures
2.3. Analysis of the Socially-Accepted Flexibility Potential
3. Results
3.1. Market Potential of the Developed HEMS
3.2. Estimation of the Socially-Accepted Potential
4. Discussion
5. Conclusions
Author Contributions
Funding
Acknowledgments
Conflicts of Interest
Abbreviations
| ACC | accessibility |
| ANX | technology anxiety |
| CMF | comfort increase |
| COB | personal conservation behavior |
| CUR | curiosity |
| EAI | Environmental Attitudes Inventory |
| HEMS | home energy management system |
| INR | interest |
| ITU | intention to use |
| M | mean |
| MON | monitoring |
| PV | photovoltaic |
| SAV | savings |
| SD | standard deviation |
| SKE | skepticism |
| SUS | sustainability |
| TAM | Technology Usage Inventory |
| TST | trust in science and technology |
| USB | usability |
| USF | usefulness |
References
- Hsieh, E.; Anderson, R. Grid flexibility: The quiet revolution. Electr. J. 2017, 30, 1–8. [Google Scholar] [CrossRef]
- Andrey, C.; Attard, P.; Bardet, R.; Fournié, L.; Khallouf, P. Mainstreaming RES Flexibility Portfolios; Technical Report; European Commission: Brussels, Belgium, 2017. [Google Scholar]
- Hall, M.; Geissler, A. Load control by demand side management to support grid stability in building clusters. Energies 2020, 13, 5112. [Google Scholar] [CrossRef]
- Finck, C.; Li, R.; Kramer, R.; Zeiler, W. Quantifying demand flexibility of power-to-heat and thermal energy storage in the control of building heating systems. Appl. Energy 2018, 209, 409–425. [Google Scholar] [CrossRef]
- Straub, A.; Volmer, E. User’s perspective on home energy management systems. Environments 2018, 5, 126. [Google Scholar] [CrossRef] [Green Version]
- Washizu, A.; Nakano, S.; Ishii, H.; Hayashi, Y. Willingness to pay for home energy management systems: A survey in New York and Tokyo. Sustainability 2019, 11, 4790. [Google Scholar] [CrossRef] [Green Version]
- Anvari-Moghaddam, A.; Monsef, H.; Rahimi-Kian, A. Optimal smart home energy management considering energy saving and a comfortable lifestyle. IEEE Trans. Smart Grid 2015, 6, 324–332. [Google Scholar] [CrossRef]
- Jiang, J.C.; Kantarci, B.; Oktug, S.; Soyata, T. Federated Learning in Smart City Sensing. Sensors 2020, 20, 6230. [Google Scholar] [CrossRef] [PubMed]
- Ellabban, O.; Abu-Rub, H. Smart grid customers’ acceptance and engagement: An overview. Renew. Sustain. Energy Rev. 2016, 65, 1285–1298. [Google Scholar] [CrossRef]
- Buchanan, K.; Banks, N.; Preston, I.; Russo, R. The British public’s perception of the UK smart metering initiative: Threats and opportunities. Energy Policy 2016, 91, 87–97. [Google Scholar] [CrossRef] [Green Version]
- Fredericks, D.; Fan, Z.; Woolley, S.; De Quincey, E.; Streeton, M. A decade on, how has the visibility of energy changed? Energy feedback perceptions from UK focus groups. Energies 2020, 13, 2566. [Google Scholar] [CrossRef]
- Park, E.S.; Hwang, B.Y.; Ko, K.; Kim, D. Consumer acceptance analysis of the home energy management system. Sustainability 2017, 9, 2351. [Google Scholar] [CrossRef] [Green Version]
- Al-Ali, A.R.; Zualkernan, I.A.; Rashid, M.; Gupta, R.; Alikarar, M. A smart home energy management system using IoT and big data analytics approach. IEEE Trans. Consum. Electron. 2017, 63, 426–434. [Google Scholar] [CrossRef]
- Elkazaz, M.; Sumner, M.; Pholboon, S.; Davies, R.; Thomas, D. Performance assessment of an energy management system for a home microgrid with PV generation. Energies 2020, 13, 3436. [Google Scholar] [CrossRef]
- Betancourt, R.O.J.; López, J.M.G.; Espejo, E.B.; Sánchez, A.C.; Laureano, E.V.; Pérez, S.S.; Aguilar, L.C. Iot-based electricity bill for domestic applications. Sensors 2020, 20, 6178. [Google Scholar] [CrossRef]
- Park, H. Human comfort-based-home energy management for demand response participation. Energies 2020, 13, 2463. [Google Scholar] [CrossRef]
- Yoo, Y.; Jung, S.; Kang, S.; Song, S.; Lee, J.; Han, C.; Jang, G. Dispatchable Substation for Operation and Control of Renewable Energy Resources. Appl. Sci. 2020, 10, 7938. [Google Scholar] [CrossRef]
- Widén, J. Improved photovoltaic self-consumption with appliance scheduling in 200 single-family buildings. Appl. Energy 2014, 126, 199–212. [Google Scholar] [CrossRef]
- Radl, J.; Fleischhacker, A.; Revheim, F.H.; Lettner, G.; Auer, H. Comparison of profitability of PV electricity sharing in renewable energy communities in selected European countries. Energies 2020, 13, 5007. [Google Scholar] [CrossRef]
- Shah, A.S.; Nasir, H.; Fayaz, M.; Lajis, A.; Shah, A. A review on energy consumption optimization techniques in IoT based smart building environments. Information 2019, 10, 108. [Google Scholar] [CrossRef] [Green Version]
- Shareef, H.; Ahmed, M.S.; Mohamed, A.; Al Hassan, E. Review on Home Energy Management System Considering Demand Responses, Smart Technologies, and Intelligent Controllers. IEEE Access 2018, 6, 24498–24509. [Google Scholar] [CrossRef]
- Ayala-Gilardón, A.; Mora-López, L.; Sidrach-De-Cardona, M. Analysis of a photovoltaic self-consumption facility with different net metering schemes. Int. J. Smart Grid Clean Energy 2017, 6, 47–53. [Google Scholar] [CrossRef]
- Han, J.; Choi, C.S.; Park, W.K.; Lee, I.; Kim, S.H. Smart home energy management system including renewable energy based on ZigBee and PLC. IEEE Trans. Consum. Electron. 2014, 60, 198–202. [Google Scholar] [CrossRef]
- Herrmann, M.R.; Brumby, D.P.; Oreszczyn, T.; Gilbert, X.M. Does data visualization affect users’ understanding of electricity consumption? Build. Res. Inf. 2018, 46, 238–250. [Google Scholar] [CrossRef]
- Machorro-Cano, I.; Alor-Hernández, G.; Paredes-Valverde, M.A.; Rodríguez-Mazahua, L.; Sánchez-Cervantes, J.L.; Olmedo-Aguirre, J.O. HEMS-IoT: A big data and machine learning-based smart home system for energy saving. Energies 2020, 13, 1097. [Google Scholar] [CrossRef] [Green Version]
- Carli, R.; Dotoli, M.; Jantzen, J.; Kristensen, M.; Ben Othman, S. Energy scheduling of a smart microgrid with shared photovoltaic panels and storage: The case of the Ballen marina in Samsø. Energy 2020, 198, 117188. [Google Scholar] [CrossRef]
- Kim, M.; Parkt, S.; Choi, J.K.; Lee, J. Energy independence of energy trading system in microgrid. In Proceedings of the 2017 IEEE Innovative Smart Grid Technologies-Asia, ISGT-Asia 2017, Auckland, New Zealand, 4–7 December 2017; pp. 1–4. [Google Scholar] [CrossRef]
- Hosseini, S.M.; Carli, R.; Dotoli, M. Robust Optimal Energy Management of a Residential Microgrid Under Uncertainties on Demand and Renewable Power Generation. IEEE Transact. Automat. Sci. Eng. 2020, 1–20. [Google Scholar] [CrossRef]
- Ford, R.; Pritoni, M.; Sanguinetti, A.; Karlin, B. Categories and functionality of smart home technology for energy management. Build. Environ. 2017, 123, 543–554. [Google Scholar] [CrossRef] [Green Version]
- Ruano, A.; Hernandez, A.; Ureña, J.; Ruano, M.; Garcia, J. NILM techniques for intelligent home energy management and ambient assisted living: A review. Energies 2019, 12, 2203. [Google Scholar] [CrossRef] [Green Version]
- Samuel, O.; Javaid, S.; Javaid, N.; Ahmed, S.H.; Afzal, M.K.; Ishmanov, F. An efficient power scheduling in smart homes using jaya based optimization with time-of-use and critical peak pricing schemes. Energies 2018, 11, 3155. [Google Scholar] [CrossRef] [Green Version]
- Oikonomou, V.; Becchis, F.; Steg, L.; Russolillo, D. Energy saving and energy efficiency concepts for policy making. Energy Policy 2009, 37, 4787–4796. [Google Scholar] [CrossRef]
- Poortinga, W.; Steg, L.; Vlek, C.; Wiersma, G. Household preferences for energy-saving measures: A conjoint analysis. J. Econ. Psychol. 2003, 24, 49–64. [Google Scholar] [CrossRef]
- Trotta, G. Factors affecting energy-saving behaviours and energy efficiency investments in British households. Energy Policy 2018, 114, 529–539. [Google Scholar] [CrossRef]
- Baedeker, C.; Piwowar, J.; Themann, P.; Grinewitschus, V.; Krisemendt, B.; Lepper, K.; Zimmer, C.; von Geibler, J. Interactive design to encourage energy efficiency in offices: Developing and testing a user-centered building management system based on a living lab approach. Sustainability 2020, 12, 6956. [Google Scholar] [CrossRef]
- Rabelhofer, M.; Pfeiffer, C.; Stöller, J. On the challenges of empowering citizens in technological innovation matters. In Proceedings of the 13th Conference on Sustainable Development of Energy, Water and Environment Systems, Palermo, Italy, 30 September–4 October 2018; pp. 1–10. [Google Scholar]
- Mancini, F.; Basso, G.L.; De Santoli, L. Energy use in residential buildings: Characterisation for identifying flexible loads by means of a questionnaire survey. Energies 2019, 12, 2055. [Google Scholar] [CrossRef] [Green Version]
- Fambri, G.; Badami, M.; Tsagkrasoulis, D.; Katsiki, V.; Giannakis, G.; Papanikolaou, A. Demand flexibility enabled by virtual energy storage to improve renewable energy penetration. Energies 2020, 13, 5128. [Google Scholar] [CrossRef]
- Stinner, S.; Huchtemann, K.; Müller, D. Quantifying the operational flexibility of building energy systems with thermal energy storages. Appl. Energy 2016, 181, 140–154. [Google Scholar] [CrossRef]
- Nuytten, T.; Claessens, B.; Paredis, K.; Van Bael, J.; Six, D. Flexibility of a combined heat and power system with thermal energy storage for district heating. Appl. Energy 2013, 104, 583–591. [Google Scholar] [CrossRef]
- Lee, E.; Baek, K.; Kim, J. Evaluation of Demand Response Potential Flexibility in the Industry Based on a Data-Driven Approach. Energies 2020, 13, 6355. [Google Scholar] [CrossRef]
- D’hulst, R.; Labeeuw, W.; Beusen, B.; Claessens, S.; Deconinck, G.; Vanthournout, K. Demand response flexibility and flexibility potential of residential smart appliances: Experiences from large pilot test in Belgium. Appl. Energy 2015, 155, 79–90. [Google Scholar] [CrossRef]
- Cao, Z.; O’rourke, F.; Lyons, W.; Han, X. Home energy management system incorporating heat pump using real measured data. Sensors 2019, 19, 2937. [Google Scholar] [CrossRef] [Green Version]
- Puchegger, M. Demonstration of a Smart Connection of Urban Electricity, Natural Gas & District Heating Networks to Functional Electricity Storage Facilities; Publishable Final Report of the Project “Hybrid Grids Demo”; Austrian Climate and Energy Fund: Vienna, Austria, 2019. [Google Scholar]
- Osier, G.; Museux, J.-M.; Seoane, P.; Verma, V. Cross-Sectional and Longitudinal Weighting for the EU-SILC Rotational Design. Available online: https://www.iser.essex.ac.uk/files/survey/ulsc/methodological-research/mols-2006/scientific-social-programme/papers/Osier.pdf (accessed on 2 September 2020).
- Statistics Austria. Register-Based Labour Market Statistics 2018—Households and Families. 2018. Available online: https://www.statistik.at/web_en/statistics/PeopleSociety/population/population_censuses_register_based_census_register_based_labour_market_statistics/index.html (accessed on 13 November 2020).
- Milfont, T.L.; Duckitt, J. The environmental attitudes inventory: A valid and reliable measure to assess the structure of environmental attitudes. J. Environ. Psychol. 2010, 30, 80–94. [Google Scholar] [CrossRef]
- Kothgassner, O.D.; Felnhofer, A.; Hauk, N.; Kastenhofer, E.; Gomm, J.; Kryspin-Exner, I. TUI. Technology Usage Inventory; Technical Report; ICARUS Research Team: Vienna, Austria, 2012. [Google Scholar]
- Davis, F.D.; Bagozzi, R.P.; Warshaw, P.R. User Acceptance of Computer Technology: A Comparison of Two Theoretical Models. Manag. Sci. 1989, 35, 982–1003. [Google Scholar] [CrossRef] [Green Version]
- Pfeiffer, C.; Rabelhofer, M. Participation in Energy Transition—Challenges within the Scope of Smart Grids. In Proceedings of the 3rd South East European Conference on Sustainable Development of Energy, Water and Environment Systems, Novi Sad, Serbia, 30 June–3 July 2018; pp. 1–9. [Google Scholar]
- Puchegger, M. Joint utilization of demand side flexibility of heating devices and heating grids with benefits for energy suppliers and customers by. In Proceedings of the 15th IAEE European Conference 2017, Vienna, Austria, 3–6 September 2017. [Google Scholar]
- Statistics Austria. Energy Consumption of Households 2017/2018. Available online: https://www.statistik.at/web_en/statistics/EnergyEnvironmentInnovationMobility/energy_environment/energy/energy_consumption_of_households/index.html (accessed on 11 June 2019).
- Statistics Austria. Stock of Buildings and Dwellings. 2017. Available online: http://www.statistik.at/web_en/statistics/PeopleSociety/housing/stock_of_buildings_and_dwellings/index.html (accessed on 13 November 2020).
- Biermayr, P.; Dißauer, C.; Eberl, M.; Enigl, M.; Leonhartsberger, K.; Maringer, F.; Moidl, S.; Schmidl, C.; Strasser, C.; Weiss, W.; et al. Innovative Energietechnologien in Österreich—Marktentwicklung 2016; Technical Report; Federal Ministry Republic of Austria for Transport, Innovation and Technology: Vienna, Austria, 2017. [Google Scholar]


| Sociodemographics | M | (SD) | % |
|---|---|---|---|
| Gender | |||
| Female | 35.90 | ||
| Male | 64.10 | ||
| Age (years) | 50.93 | (14.99) | |
| Education | |||
| Apprenticeship | 23.10 | ||
| Intermediate vocational school | 15.30 | ||
| School-leaving certificate | 30.80 | ||
| University degree | 30.80 | ||
| Housing and floor space (m2) | |||
| Flat | 78.00 | (10.98) | 22.50 |
| Single-family house | 177.60 | (52.26) | 65.20 |
| Two-family house or larger | 261.30 | (158.75) | 11.20 |
| Other | 90.00 | - | 1.10 |
| Household size | |||
| 1 person | 8.70 | ||
| 2 persons | 40.90 | ||
| 3 persons | 18.60 | ||
| 4 or more persons | 30.80 | ||
| Children living in household | |||
| None | 72.00 | ||
| 1 child | 15.80 | ||
| 2 children | 11.00 | ||
| 3 or more children | 1.20 |
| Household Type | Flat | Single-Family House | |||
|---|---|---|---|---|---|
| Type 1 | Type 2 | Type 3 | Type 4 | ||
| Heating demanda | not relevant | not relevant | not relevant | 41 | 41 |
| Space heating | |||||
| Producer | - | - | - | heat pump | heat pump |
| Thermal power b | - | - | - | 7.0 | 7.0 |
| Hot water | |||||
| Producer | hot water boiler | hot water boiler | hot water boiler | heat pump | heat pump |
| Thermal power b | 4.5 | 4.5 | 4.5 | 7.0 | 7.0 |
| Electric power b | 4.5 | 4.5 | 4.5 | 2.3 | 2.3 |
| PV system | |||||
| Peak power b | - | - | 5.0 | - | 5.0 |
| Heat storage | |||||
| Water c | 110 | 110 | 110 | 300 | 300 |
| Heating buffer c | - | - | - | 600 | 600 |
| Number of households | 823 | 213 | 24 | 131 | 15 |
| Household Type | Flat | Single-Family House | Total | |||
|---|---|---|---|---|---|---|
| Type 1 | Type 2 | Type 3 | Type 4 | |||
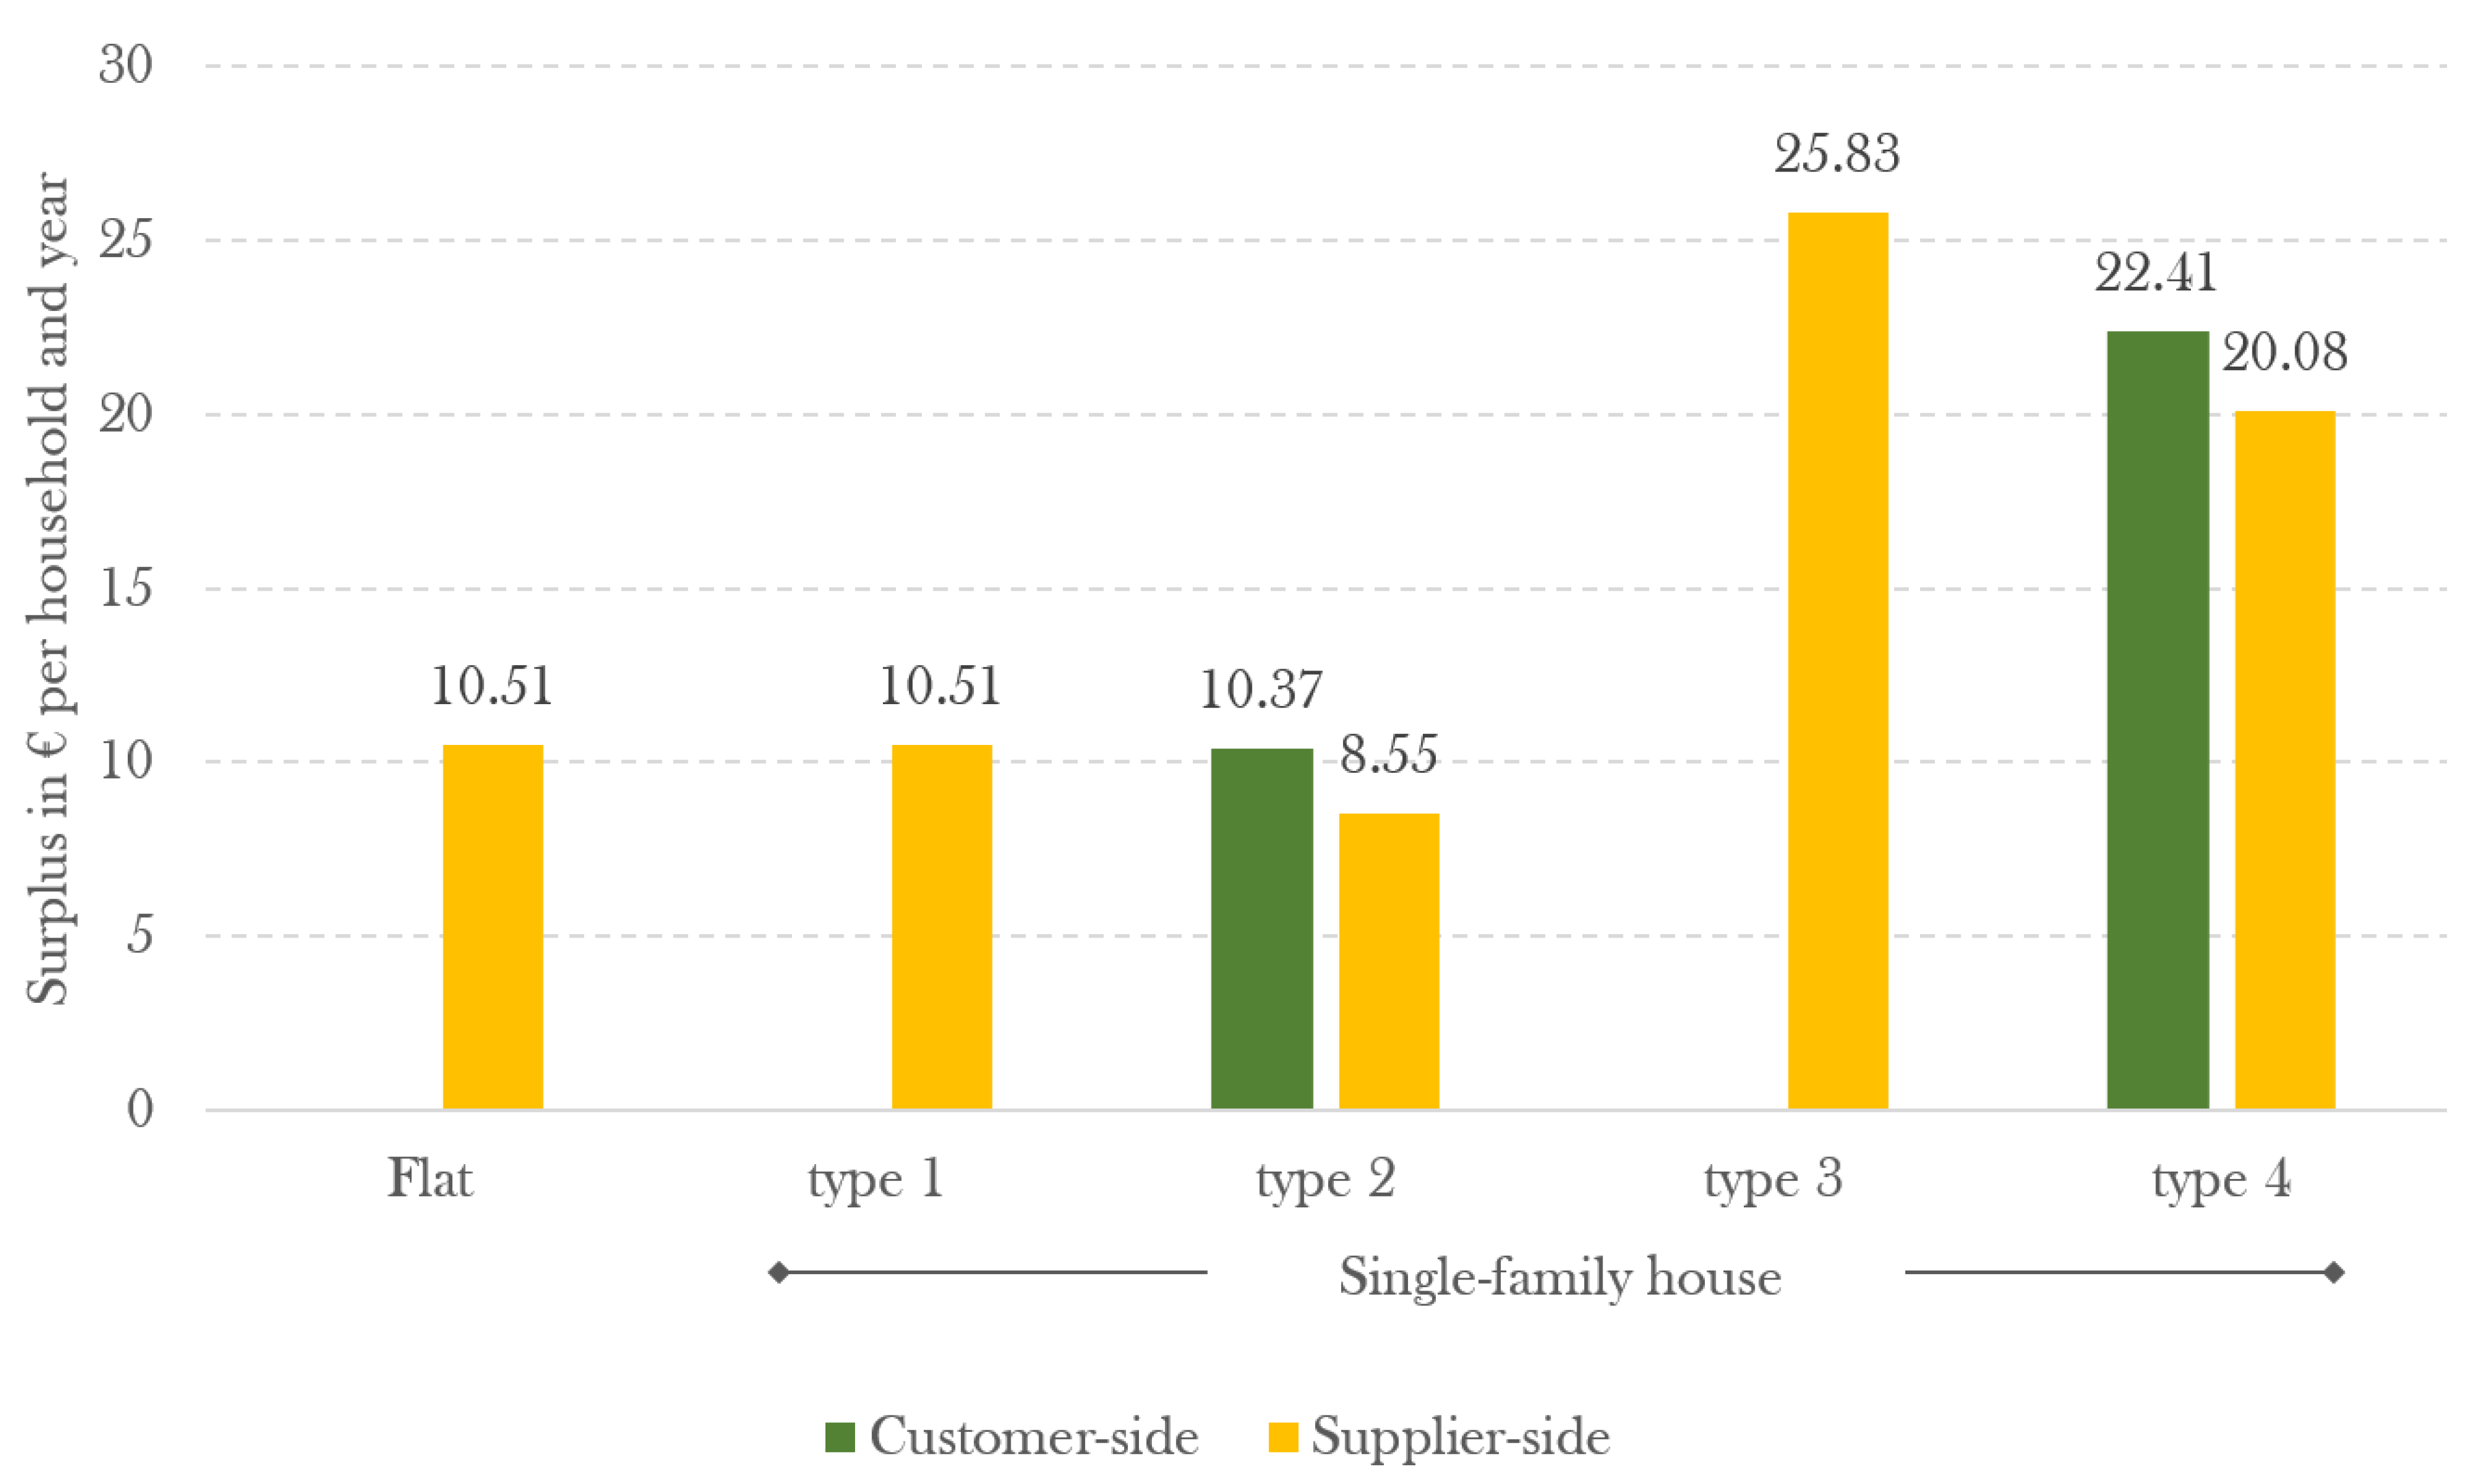
| Surplus per household | ||||||
| Customer-side a | - | - | 10.37 | - | 22.41 | |
| Supplier-side a | 10.51 | 10.51 | 8.55 | 25.83 | 20.08 | |
| Average surplus per householda | 10.51 | 10.51 | 18.92 | 25.83 | 42.49 | |
| Number of households | 823 | 213 | 24 | 131 | 15 | 1206 |
| Surplus for all households | ||||||
| Customer-side a | - | - | 248.88 | - | 336.15 | 585.03 |
| Supplier-side a | 8649.73 | 2238.63 | 205.20 | 3383.73 | 301.20 | 14,778.49 |
| Overall surplusa | 8649.73 | 2238.63 | 454.08 | 3383.73 | 637.35 | 15,363.52 |
| M | SD | 2 | 3 | 4 | 5 | 6 | 7 | 8 | 9 | 10 | 11 | 12 | 13 | 14 | ||
|---|---|---|---|---|---|---|---|---|---|---|---|---|---|---|---|---|
| 1 | COB | 4.46 | 0.42 | 0.25 * | 0.27 * | −0.01 | −0.09 | −0.20 | 0.17 | 0.17 | 0.06 | 0.24 + | 0.00 | 0.28 * | 0.26 * | 0.17 |
| 2 | TST | 3.39 | 0.72 | 0.41 ** | 0.18 + | −0.35 ** | −0.25 + | 0.33 * | 0.18 | 0.11 | 0.44 ** | 0.32 * | 0.41 ** | 0.39 ** | 0.41 ** | |
| 3 | CUR | 3.69 | 0.78 | 0.56 ** | −0.12 | −0.17 | 0.02 | 0.19 | 0.11 | 0.20 | −0.10 | −0.01 | 0.37 ** | 0.18 | ||
| 4 | INR | 3.29 | 0.77 | −0.29 ** | 0.35 ** | −0.16 | −0.03 | 0.04 | −0.04 | −0.23 | −0.06 | 0.11 | −0.13 | |||
| 5 | ANX | 2.12 | 0.66 | 0.08 | 0.06 | −0.29 * | 0.01 | −0.07 | 0.25 + | 0.01 | −0.16 | 0.05 | ||||
| 6 | SKE | 2.39 | 0.62 | −0.17 | −0.47 ** | −0.18 | −0.29 * | −0.13 | −0.16 | −0.31 * | −0.37 ** | |||||
| 7 | USF | 3.12 | 0.78 | 0.26 * | 0.28 * | 0.53 ** | 0.65 ** | 0.60 ** | 0.48 ** | 0.70 ** | ||||||
| 8 | USB | 3.61 | 0.53 | 0.54 ** | 0.44 ** | 0.14 | 0.31 * | 0.42 ** | 0.36 ** | |||||||
| 9 | ACC | 3.25 | 0.59 | 0.38 ** | 0.25 + | 0.32 * | 0.38 ** | 0.48 ** | ||||||||
| 10 | SAV | 3.99 | 0.74 | 0.57 ** | 0.79 ** | 0.82 ** | 0.52 ** | |||||||||
| 11 | CMF | 3.04 | 0.92 | 0.68 ** | 0.35 ** | 0.52 ** | ||||||||||
| 12 | MON | 3.49 | 0.71 | 0.62 ** | 0.52 ** | |||||||||||
| 13 | SUS | 4.16 | 0.65 | 0.49 ** | ||||||||||||
| 14 | ITU | 3.04 | 0.90 |
| Willing (17.20%) | Potentials (18.28%) | Reserved (38.72%) | Refusing (17.20%) | Critics (8.60%) | |
|---|---|---|---|---|---|
| Gender | |||||
| Female a | 53.33 | 57.14 | 65.63 | 33.33 | 42.86 |
| Male a | 46.76 | 42.86 | 34.38 | 66.67 | 57.14 |
| Age (years) b | 44.86 (16.65) | 54.29 (11.15) | 47.94 (13.58) | 55.43 (13.30) | 38.81 (14.01) |
| Education | |||||
| Apprenticeship a | 21.43 | 7.14 | 53.13 | 68.75 | 57.14 |
| Intermediate vocational school a | 42.86 | 21.43 | 18.75 | 6.25 | - |
| School-leaving certificate a | 21.43 | 35.71 | 12.50 | 12.50 | - |
| University degree a | 14.29 | 35.71 | 15.63 | 12.50 | 42.86 |
| Housing | |||||
| Flat a | 28.57 | 28.57 | 15.63 | 46.67 | 42.86 |
| Single-family house a | 57.14 | 50.00 | 78.13 | 53.33 | 42.86 |
| Two-family house or larger a | 14.29 | 21.43 | 6.25 | - | 14.29 |
| Household size | |||||
| 1 person a | - | 13.33 | 16.13 | 6.25 | - |
| 2 persons a | 46.67 | 40.00 | 35.48 | 43.75 | 66.67 |
| 3 persons a | 13.33 | 20.00 | 19.35 | 12.50 | 16.67 |
| 4 or more persons a | 40.00 | 26.67 | 29.03 | 37.50 | 16.67 |
| Hot water preparation | |||||
| Electric boiler a | 46.67 | 26.67 | 12.12 | 26.67 | 28.57 |
| Heat pump a | 20.00 | 13.33 | 18.18 | - | 28.57 |
| Oil a | 13.33 | 6.67 | 15.15 | 20.00 | 14.29 |
| Wood or pellet stove a | 6.67 | 6.67 | 27.27 | 6.67 | 14.29 |
| Solar thermal energy a | 6.67 | 26.67 | 12.12 | 26.67 | 14.29 |
| Other a | 6.67 | 20.00 | 15.15 | 20.00 | - |
| Hot water storage | |||||
| yes a | 100.00 | 76.92 | 89.66 | 73.33 | 85.71 |
| no a | - | 10.34 | 26.67 | 23.08 | 14.29 |
| PV | |||||
| yes a | 14.29 | 33.33 | 6.25 | 20.00 | 42.86 |
| no a | 85.71 | 66.67 | 93.75 | 80.00 | 57.14 |
| Acceptance scales (1 = strongly disagree, 5 = strongly agree) | |||||
| Intention to use c | 4.26 (0.41) | 3.04 (0.68) | 3.09 (0.54) | 2.03 (0.36) | 1.73 (0.65) |
| Personal conservation behavior c | 4.68 (0.36) | 4.41 (0.51) | 4.46 (0.33) | 4.25 (0.45) | 4.60 (0.46) |
| Trust in science and technology c | 4.14 (0.62) | 3.70 (0.67) | 3.34 (0.43) | 2.71 (0.45) | 2.88 (0.89) |
| Curiosity c | 4.14 (0.52) | 4.37 (0.47) | 3.31 (0.69) | 3.30 (0.81) | 4.07 (0.61) |
| Interest c | 3.28 (0.92) | 4.06 (0.47) | 3.00 (0.52) | 2.96 (0.68) | 4.06 (0.74) |
| Technology anxiety c | 1.87 (0.55) | 1.51 (0.43) | 2.39 (0.57) | 2.46 (0.56) | 1.84 (0.92) |
| Skepticism c | 1.98 (0.79) | 2.34 (0.44) | 2.42 (0.63) | 2.73 (0.36) | 2.73 (0.51) |
| Usefulness c | 3.93 (0.59) | 3.09 (0.60) | 3.28 (0.54) | 2.26 (0.23) | 1.86 (0.27) |
| Usability c | 4.08 (0.51) | 3.66 (0.48) | 3.47 (0.41) | 3.06 (0.38) | 3.99 (0.42) |
| Accessibility c | 3.70 (0.51) | 3.20 (0.51) | 3.25 (0.54) | 2.58 (0.43) | 3.49 (0.62) |
| Requirements scales (1 = not important at all, 5 = very important) | |||||
| Savings c | 4.86 (0.27) | 3.93 (0.67) | 4.03 (0.34) | 2.67 (0.40) | 4.24 (0.57) |
| Comfort increase c | 3.80 (0.62) | 2.45 (0.76) | 3.55 (0.44) | 1.82 (0.61) | 2.05 (0.36) |
| Monitoring c | 4.24 (0.47) | 3.29 (0.67) | 3.65 (0.38) | 2.41 (0.27) | 3.28 (0.89) |
| Sustainability c | 4.91 (0.20) | 4.36 (0.50) | 4.02 (0.45) | 3.14 (0.35) | 4.47 (0.50) |
| Household Type | Flat | Single-Family House | Total | |||
|---|---|---|---|---|---|---|
| Type 1 | Type 2 | Type 3 | Type 4 | |||
| Number of households | 823 | 213 | 24 | 131 | 15 | 1206 |
| Number of households with social acceptance | 288 | 75 | 8 | 46 | 5 | 422 |
| Surplus for all households with social acceptance | ||||||
| Customer-side a | - | - | 82.96 | - | 112.05 | 195.01 |
| Supplier-side a | 3026.88 | 788.25 | 68.40 | 1188.18 | 100.40 | 5172.11 |
| Overall surplusa | 3026.88 | 788.25 | 151.36 | 1188.18 | 212.45 | 5367.12 |
| Shiftable load | ||||||
| Per household b | 4.5 | 4.5 | 4.5 | 2.3 | 2.3 | |
| Per household type b | 1296.0 | 337.5 | 36.0 | 105.8 | 11.5 | 1786.80 |
Publisher’s Note: MDPI stays neutral with regard to jurisdictional claims in published maps and institutional affiliations. |
© 2020 by the authors. Licensee MDPI, Basel, Switzerland. This article is an open access article distributed under the terms and conditions of the Creative Commons Attribution (CC BY) license (http://creativecommons.org/licenses/by/4.0/).
Share and Cite
Pfeiffer, C.; Puchegger, M.; Maier, C.; Tomaschitz, I.V.; Kremsner, T.P.; Gnam, L. A Case Study of Socially-Accepted Potentials for the Use of End User Flexibility by Home Energy Management Systems. Sustainability 2021, 13, 132. https://doi.org/10.3390/su13010132
Pfeiffer C, Puchegger M, Maier C, Tomaschitz IV, Kremsner TP, Gnam L. A Case Study of Socially-Accepted Potentials for the Use of End User Flexibility by Home Energy Management Systems. Sustainability. 2021; 13(1):132. https://doi.org/10.3390/su13010132
Chicago/Turabian StylePfeiffer, Christian, Markus Puchegger, Claudia Maier, Ina V. Tomaschitz, Thomas P. Kremsner, and Lukas Gnam. 2021. "A Case Study of Socially-Accepted Potentials for the Use of End User Flexibility by Home Energy Management Systems" Sustainability 13, no. 1: 132. https://doi.org/10.3390/su13010132