Article

Urban Geometry Optimization to Mitigate Climate Change: Towards Energy-Efficient Buildings

1
Department of Architecture Engineering, Faculty of Engineering, Aswan University, Aswan 81542, Egypt
2
Department of Environmental Engineering, Egypt-Japan University of Science and Technology, New Borg El-Arab City, Alexandrian 21934, Egypt
*
Author to whom correspondence should be addressed.
Sustainability 2021, 13(1), 27; https://doi.org/10.3390/su13010027
Submission received: 27 September 2020 / Revised: 6 December 2020 / Accepted: 17 December 2020 / Published: 22 December 2020
(This article belongs to the Special Issue Climate Change and Sustainable Urban Environmental Planning)

Abstract

:
The density of building blocks and insufficient greenery in cities tend to contribute dramatically not only to increased heat stress in the built environment but also to higher energy demand for cooling. Urban planners should, therefore, be conscious of their responsibility to reduce energy usage of buildings along with improving outdoor thermal efficiency. This study examines the impact of numerous proposed urban geometry cases on the thermal efficiency of outer spaces as well as the energy consumption of adjacent buildings under various climate change scenarios as representative concentration pathways (RCP) 4.5 and 8.5 climate projections for New Aswan city in 2035. The investigation was performed at one of the most underutilized outdoor spaces on the new campus of Aswan University in New Aswan city. The potential reduction of heat stress was investigated so as to improve the thermal comfort of the investigated outdoor spaces, as well as energy savings based on the proposed strategies. Accordingly, the most appropriate scenario to be adopted to cope with the inevitable climate change was identified. The proposed scenarios were divided into four categories of parameters. In the first category, shelters partially (25–50% and 75%) covering the streets were used. The second category proposed dividing the space parallel or perpendicular to the existing buildings. The third category was a hybrid scenario of the first and second categories. In the fourth category, a green cover of grass was added. A coupling evaluation was applied utilizing ENVI-met v4.2 and Design-Builder v4.5 to measure and improve the thermal efficiency of the outdoor space and reduce the cooling energy. The results demonstrated that it is better to cover outdoor spaces with 50% of the overall area than transform outdoor spaces into canyons.

1. Introduction

Since the Kyoto Protocol in 1998, climate change has become the most important global challenge [1,2,3], owing mainly to the increase in world population growth in conjunction with industrial development activities [4]. Climate change is returning to increased greenhouse gas emissions, specifically CO2 emissions. Reducing energy consumption is therefore of considerable significance globally, since the largest amount of energy consumption means the burning of large quantities of fossil fuels and the release of massive amounts of greenhouse gases [5]. According to the National Institute for Public Health and the Environment in the Netherlands, if fossil fuel-generated energy still accounts for around 75% of all cooling emissions, these coolant leaks could cumulatively increase the warming impact of CO2 emissions by up to 25% by the middle of the century [6]. Previous studies indicate that new buildings have shown that carbon emissions can be lowered by more than 50% compared to buildings constructed 5–10 years ago [7,8]. The Intergovernmental Panel on Climate Change urges all responsible persons to promote their country’s mitigation strategies [9,10]. On the local level, while Egypt contributes only very little to global greenhouse gas (GHG) emission (0.6% of global emissions), GHG is one of Egypt’s main climate change parameters [11]. Egypt is listed as one of the five countries most susceptible to climate change [11]. By 2060, the maximum temperature in Cairo, Egypt’s capital, is predicted to increase by 4 °C as a consequence of global warming, and for the rest of Egypt, the increase would be 3.1 to 4.7 °C [12]. Over the duration of 1990 to 2100, the temperature increase is predicted to be 5.6 °C in an intense pollution scenario. Unless pollution falls significantly, the temperature rise will remain around 1.6 °C [11]. In recent times, decision-makers in Egypt are of the opinion that a national strategy should be put in place to ensure the adoption of the most relevant approaches to mitigating climate change in the country, i.e., effort should be directed to the promotion of zero and low-carbon energy systems to substantially minimize energy consumption, coupled with detailed strategies for adaptation and mitigation [13]. Although the climate has a major impact on outdoor and indoor thermal performance, most Egyptian research studies on climate change are still limited to agriculture, biodiversity, and conservation strategies for historical buildings and heritage sites, particularly in coastal cities such as Alexandria [14]. A few studies have addressed the impact of urban form on thermal conditions in outdoor spaces [15,16,17,18]. All these studies investigated both the impact of urban form on the outdoor spaces and energy-saving buildings.
Globally, severe heat waves that affected many European countries in 2003 caused more than 80,000 additional deaths [19] in addition to a severe increase in electricity consumption. [20,21] estimated that the climate change is responsible for a 3.6–5.5% increase in energy demand in Greece annually. The severe heat waves were repeated frequently. Due to their intensity and spatial extent, the heat waves in 2003 and 2015 were ranked as the second and sixth most severe European heat waves [22]. In 2019, heat waves in Germany caused some cities to reach 40 °C. Due to the climate change impacts on the built environment, there is a growing concern in recent years about the urban climate adaptation, especially the topics related to energy consumption. Some used a panel of several European countries [23]. Other studies addressed a specific case like a country, a city, or a sector of city. Several studies have addressed the relationship between average temperature and electricity consumption [20,24]. These studies revealed that the main value affecting the energy consumption is the extreme temperature value, whether high or low value, not the average value. In Europe, the adaptation should consider the extreme hot or cold, however in Egypt, the extreme hot is the main problem due to its climatic region. Meanwhile, climatic studies can vary from a region to another. It is important to consider each country’s specificities [20]. Moral Carcedo, 2005 [24], investigated the relationship between temperature and energy consumption by applying a transition model to analyze a Spanish case. Silav et al., 2020 [20], investigated this relationship in Portugal. Li et al., 2018 [25], addressed the impacts of climate change on energy demands in the residential sector in Nanjing in China. In this study, the authors introduced a mathematical model to provide relevant references to study the effects of temperature changes on building energy consumption.
The effect of climate change on future outdoor thermal performance is an important issue. In this regard, one of the key meteorological parameters governing human energy balance and thermal comfort is the mean radiant temperature, Tmrt, which sums up all shortwave and longwave radiation fluxes (both direct and reflected) to which the human body is exposed [26]. Tmrt’s spatiotemporal fluctuations for years to come (2070–2100) are simulated utilizing the algorithm change-factor to adjust the observed one meteorological evidence (2001–2010) to reflect simulated climate change by model Earth system/global climate model representative concentration pathways (RCP) 4.5 and 8.5 scenarios on the atmosphere. The RCP 4.5 scenario takes into consideration the radiative sum forcing stability at 4.5 Wm−2 till 2100 [27], while the RCP 8.5 scenario provides a situation of heavy use of fossil energy, culminating in 2100 (8.5 Wm−2) [28].
The urban climate is a multi-scale phenomenon. As part of the design process, it has different scales: buildings (microclimate, clusters or building groups (local scale), and settlement (mesoscale) [29]. The urban climate, which has a major impact on the outdoor occupants of the city [30,31], is directly affected by the geometrical properties of outdoor urban spaces. Achieving thermal comfort in outdoor spaces has attracted much interest in the scientific community lately. Thermal conditions of outdoor spaces are a major determinant of the patterns of space usage [32]. Outdoor conditions with less thermal comfort usually discourage participation in outdoor activities. Thermal discomfort not only raises the heat burden in the open spaces but also the heat load on the building facades, thereby requiring more energy for cooling purposes [33]. In the past, numerous research studies have focused mainly on heat mitigation strategies to control changes in air ambient temperature, although it is only one of the factors that influence the thermal comfort of outdoor spaces. Thermal comfort is a much better indicator of the thermal performance of any space [34]. In this study, thermal comfort is expressed by the physiological equivalent temperature (PET), which is an up-to-date thermal index. It is based on “human energy balance and considers the thermo-regulatory capacity of the human body to adjust to stressful microclimates” [35]. PET is an effective tool for the evaluation of the thermal component of different climates [36]. Moreover, it is considered as an outdoor thermal comfort indicator that is used to investigate the impact of urban geometrical properties on the thermal quality under different weather conditions [37,38,39]. It allows a layperson to compare the integral effects of complex external thermal conditions with his own indoor experience [35]. Table 1 highlights the PET range and grade of physiological stress on humans.
Various studies were conducted on the thermal efficiency of streets and outdoor spaces (in terms of their architectural features such as aspect ratios, orientation, shading, and canopies) in relation to the effect of their attributes on outdoor thermal efficiency. These previous studies have shown that the most relevant urban space attributes that affect urban microclimate conditions are orientation and aspect ratio (or height-to-width ratio, H/W) [40]. Many experiments were performed to determine the impact of several criteria on thermal comfort in street canyons, such as the geometry of street canyons, solar exposure, and shading. For these experiments, physiological equivalent temperature (PET) was used to evaluate thermal comfort sensitivity values [41,42]. Most of these studies indicate that shading sites are more effective than canyons spaces. For example, in a comparison between unshaded and tree-shaded locations, Matzarakis and others [43] found a substantial difference of about 15 K between PET values. Other researchers have reported findings of environmental and comfort aspects in open spaces in cities in five separate European countries, focused on field surveys and questionnaires [44]. There are also studies that examine the creation of thermal comfort by greening outdoor spaces within the urban environment [33,45,46]. However, the urban form for each region reveals a distinctive influence of climatic conditions [40]. It is very difficult to conduct thermal comfort passively, particularly in summer when it is very hot. Nevertheless, thermal comfort can be increased by alterations to urban building architecture.
It is evident from previous research that the interaction of buildings and outdoor spatial proportions has a significant effect on the thermal performance of the studied areas, impacting the sum of solar radiation and corresponding lighting, either on the façade of the building or on the level of the pedestrians. Nevertheless, in any given region, there may be a great range of microclimates in the same local area. The differentiation is mainly in the urban canopy layer influencing basic urban features (buildings, streets, trees) on scales of a few hundred meters [47]. At the time of writing, to the best of our knowledge, hardly any research on correlating between the thermal efficiency of outdoor spaces and energy efficiency based on the climate change in Egypt has been conducted. There are very few published works concerning the effect of urban geometry on human thermal comfort, especially in Upper Egypt. Moreover, most of the available studies deal with spaces with aspect ratio height (H)/width (W) >0.5, where the impact of changing urban geometry is clear [48]. The investigated case study is a rare example of space in an educational campus where public activities are held in a hot and arid environment without mitigation strategies to reduce the heat stress. As shown in Figure 1, this investigated case study has the following characteristics and dimensions; the space width = 92.5 m, buildings height = 15 m. This area takes the east-west direction with (H/W = 0.16) and sky view factor (SVF = 0.85), as well as it was divided into two platforms and two streets.
The many factors that impact energy efficiency in buildings can be divided into two classes. One class deals with all factors that focus on the building envelope such as building form, orientation, dimensions, geometry, compactness, and construction materials. All these factors have a fundamental effect on energy consumption for heating and cooling in buildings [49]. Therefore, these factors are widely investigated all over the world. The second class of factors are those that deal with the effect of the urban climate on the energy demand for cooling and heating in buildings. Urban geometry, greening, and urban pattern are the most important factors in the second class. There are some ambiguities about this class since most of the previous research focuses on the direct effect of the first class on energy consumption in buildings. In this study, however, the focus is on urban geometry attributes that impact both outdoor thermal comfort and energy demand for cooling in the adjacent buildings. There are a few studies that discuss the effect of urban climate on the energy demand for cooling and heating in nearby buildings e.g., Strømann-Andersen, 2011 [50] examined the impact of urban climate on energy demand for adjacent interior spaces, especially for heating demand, and found that urban geometry of canyons had a very significant impact on the total energy consumption, in the range of up to +30% for offices and +19% for housing. The study also highlighted the impact of dense urban built-up on energy consumption, especially for improving daylight in the adjacent interior spaces but not increasing energy consumption in these spaces. A significant relative increase in energy consumption, about 30%, was observed in the case of transformation into a dense urban area with approximately 70 kWh/m2/year. This increase in energy consumption was due to the location of the case study in Denmark. Dense urban built-up is not a suitable solution for energy efficiency in places with a cold climate, like Denmark. So, it is recommended to select wider canyons in this type of climate to save energy in the adjacent interior spaces.
On the local front, 42% of the energy in Egypt is consumed by the buildings sector. Consequently, energy conservation is a critical issue in Egypt, and decision-makers have to tackle the challenges of high energy consumption and electricity shortages, coupled with repeated reduced electricity supply between 2012–2013 [51]. Lowering energy demand in the context of climate change challenges for cooling and heating is an important issue [52,53]. Thus, improving energy efficiency in university buildings is one of the major objectives of this study. In fact, many indices are used to measure energy consumption in university buildings, e.g., the average annual energy consumption per unit area, the average annual energy consumption per capita, and carbon emission per capita [54]. The energy consumption of the New Aswan University Campus (case study) was calculated for comparison with energy consumption by other universities globally. Table 2 highlights the comparison between the average annual energy consumption of several universities in the United States, Finland, and South Korea [54].
The average annual energy consumption per m2 for Aswan University, roughly 524.5 kWh/m2, is compared to the other universities presented in the table above. This means that Aswan University’s annual average energy consumption per m2 is higher than that of universities in other parts of the world. It is, therefore, very important to reduce energy consumption at Aswan University with all the available passive solutions. One of these passive solutions is the optimization of urban geometry (which includes orientation, aspect ratio, lightweight urban roof cover, and sky view factor), which has a significant impact on thermal outdoor performance and energy consumption in adjacent buildings [55]. This paper, therefore, proposes the best strategy for control of thermal conditions for outdoor spaces and energy-efficient building conditions for urban areas in arid regions, and in particular, for the Aswan University campus.
This study seeks to contribute towards a more in-depth understanding of thermal sensation in public outdoor urban spaces dedicated to human activities, especially in Egyptian new cities located in arid regions. It reports on the results of a comprehensive study aimed at quantifying the contribution of various proposed strategies in mitigating heat stress and developing guidelines for the design of better outdoor spaces to mitigate thermal stress in existing spaces. The analysis was based on data extracted throughout the entire day. Moreover, it was expanded to study the effect of proposed cases on the energy required for cooling in the adjacent buildings under climate change scenarios.

2. Research Methods

Since the sky view factor (SVF) is considered the main parameter which affects the thermal performance of outdoor space and thus the energy consumption, the study limits to investigating scenarios affecting SVF values such as aspect ratio and lightweight urban roof cover. The scenarios were selected based on their feasibility and the literature review. Regarding the survey, measuring devices for ambient temperature and relative humidity were used, and the rest of the parameters (solar radiation, wind speed, and wind direction) were recorded using our weather station. The simulated model was calibrated to ensure its reliability before applying the suggested scenarios.

2.1. Area of Study

New Aswan University campus was chosen as a case study to investigate the impact of outdoor thermal efficiency on energy demand for cooling in adjacent buildings. New Aswan University is in New Aswan city, located in the desert area [56] (24.085296° N–32.904779° E). The city has different climatic characteristics, with the average annual temperature at 25.9 °C, while the average maximum temperature in June is 42 °C and the average annual rainfall is 1 mm [57]. Aswan University campus is located in the southwestern part of New Aswan city and has an open area of 98.507 acres (413,730.80 m2). Figure 2 shows the location of Aswan University campus.

2.2. Meteorological Data

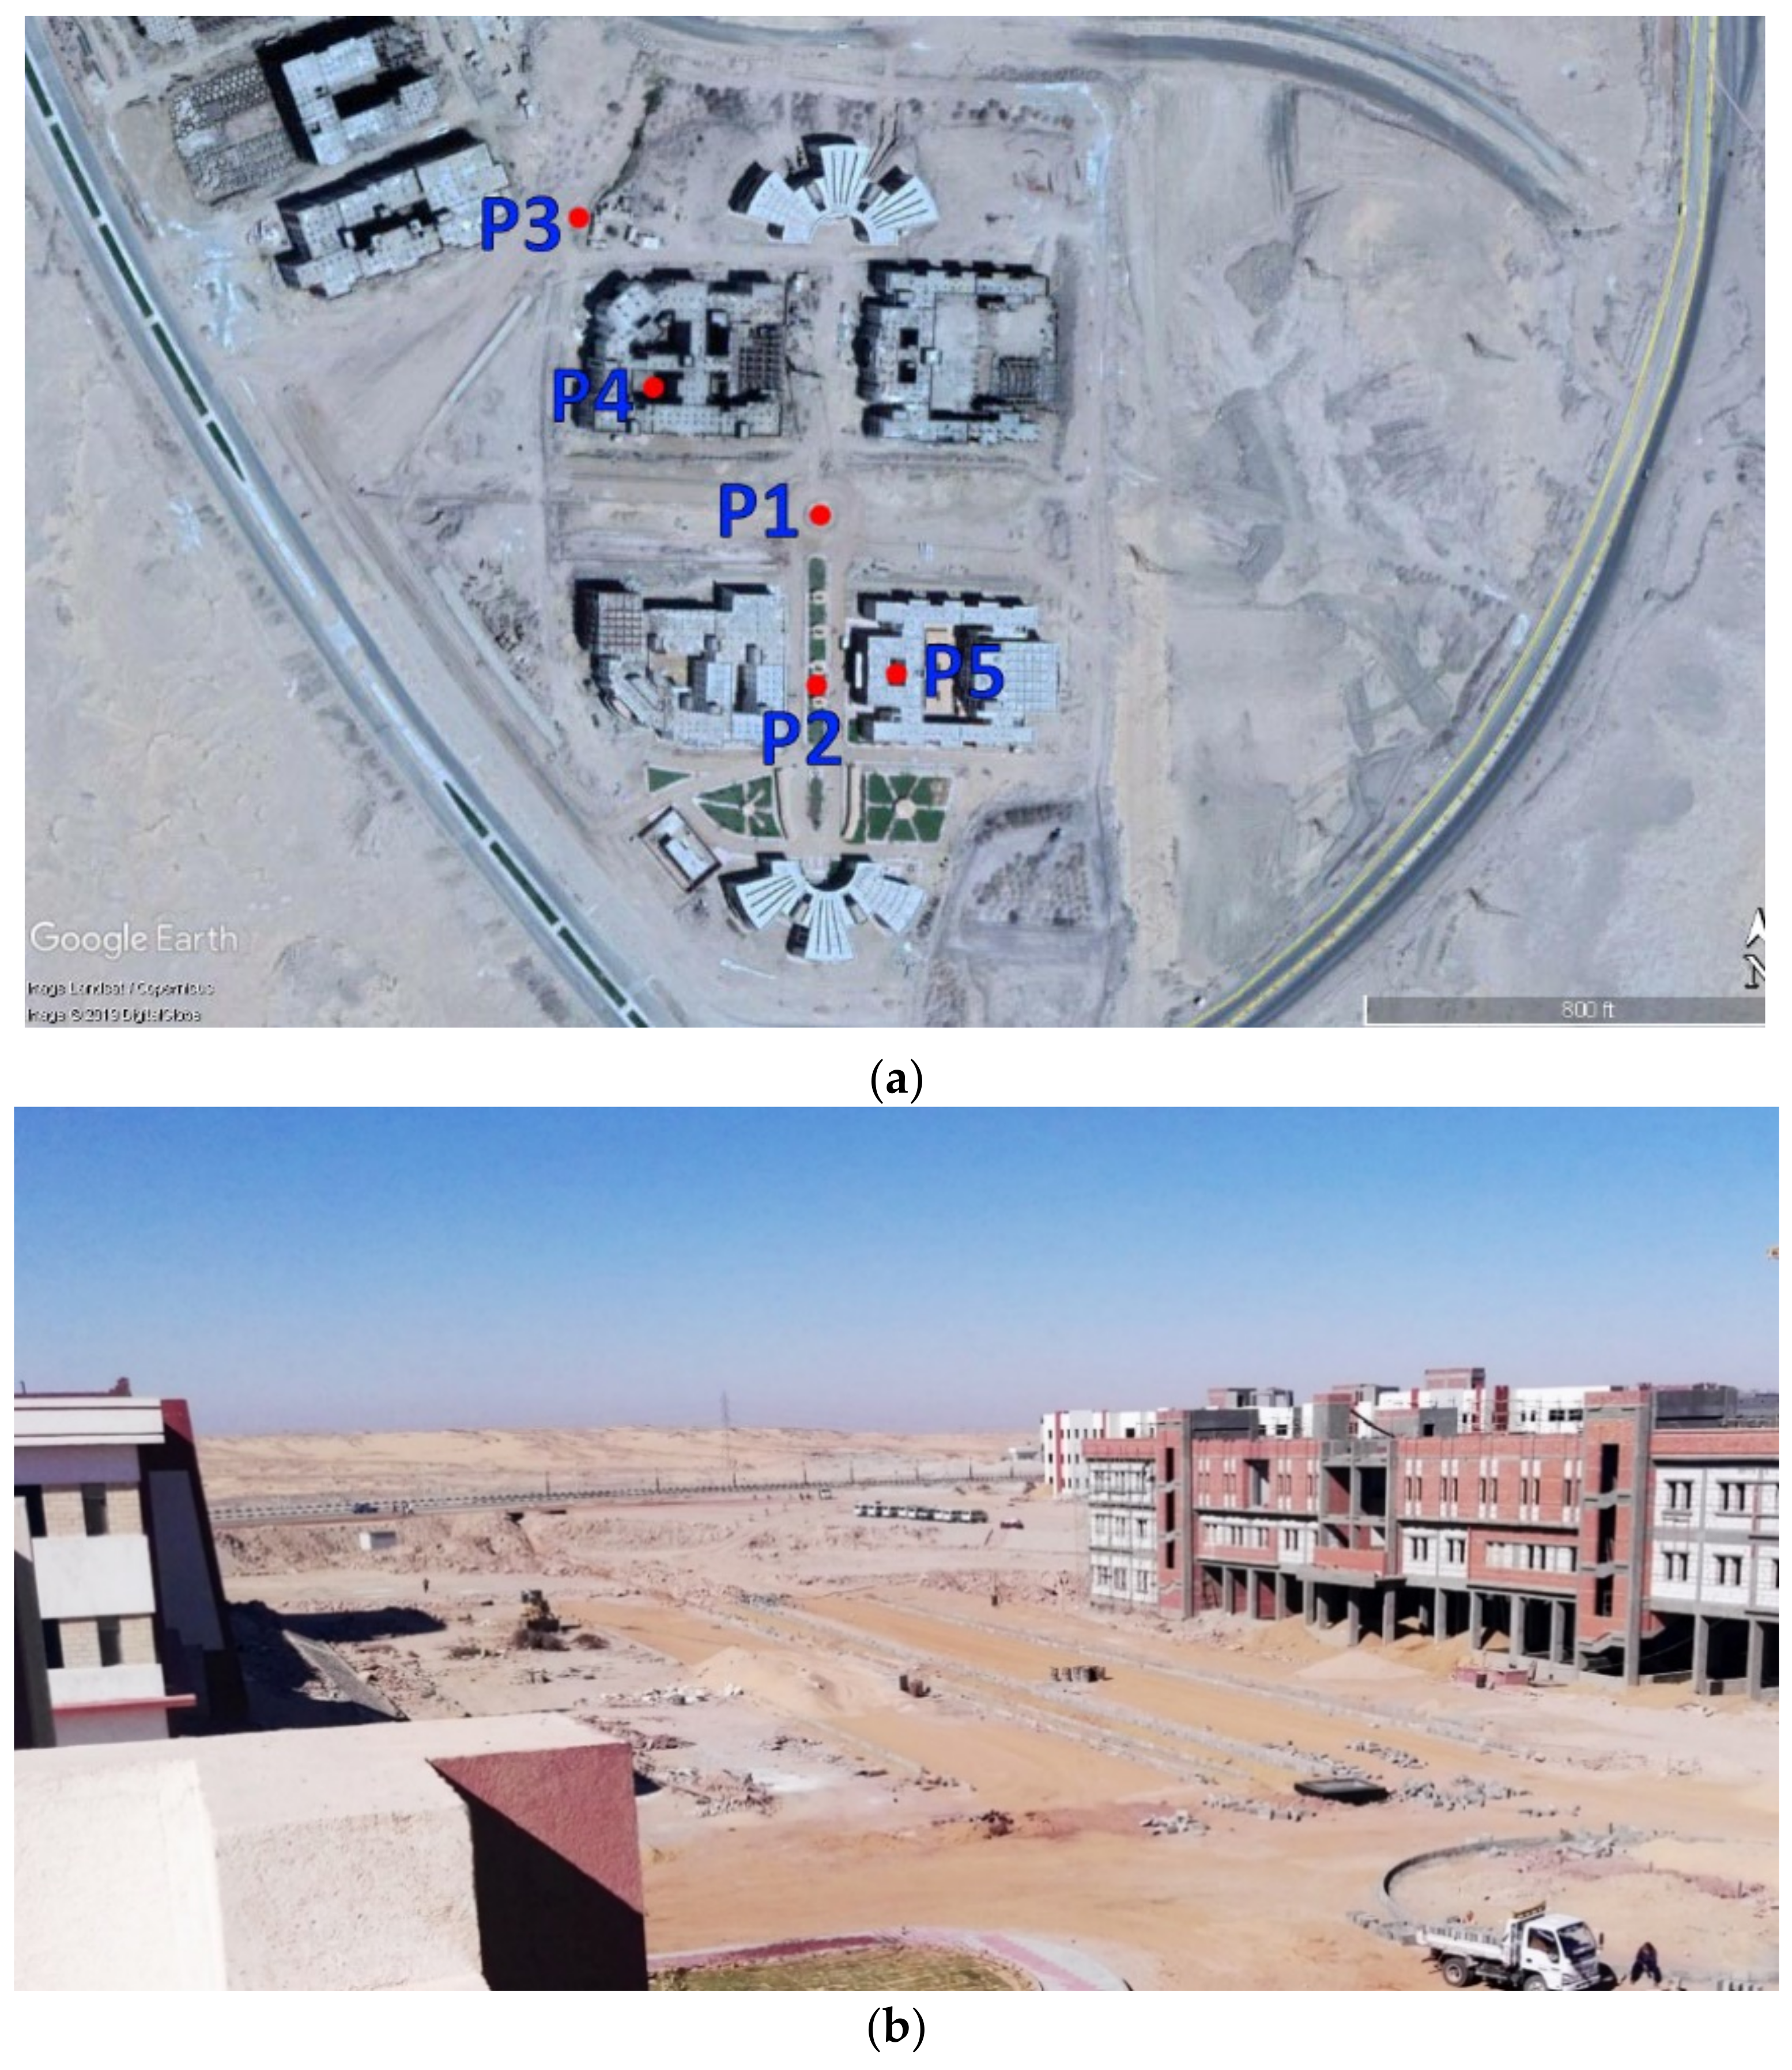
There are several methods to examine the different impacts of urban form on the microclimate parameters. The first method is based on onsite measurements [58,59]. This method tends to be limited by the conditions of their urban context. The second method is based on simulations using weather stations data [60]. However, using the weather data of off-site weather stations in simulation may miss the climatic conditions derived by the context of the samples being tested. The third method is calibrated simulations [61]. We preferred this method since it tends to balance between attaining validated results and testing various scenarios that might not be available in the existing forms either in terms of time or space. The measure campaign was conducted as a part of a research project in multiple sites in New Aswan city. The surveyed sites were in Aswan University new campus [15], and in a social residential quarter [62]. Regarding this study, the measure campaign conducted in the Aswan University new campus was used. Five points was selected as measured points (P1, P2, P3, P4, and P5 using Hobo U12 data loggers installed in handmade sunscreens mounted at a height of 1.5 m at all measurement locations as shown in Figure 3. Measurements were taken from 12 a.m. on 12th July for 48 h. The climatic conditions of New Aswan are rather homogeneous in summer. Hence, it was possible to limit the measurements to 13th and 14th of July 2018 as representative of typical hot, sunny, and cloudless conditions. A measuring campaign was held at that time on the campus construction site to validate the model in the current state. In this campaign, air temperature and relative humidity were measured. In the preliminary simulation with ENVI-met, the meteorological parameters were defined as follows:
  • 2.7 m/s was set for the wind speed at 10 m following records from the Aswan airport weather station.
  • The hourly values of air temperature and relative humidity were obtained from a data logger installed in the study site on the survey day.
  • Specific humidity at model top (2500 m, g/kg) was set to 3.7 according to the University of Wyoming website (University of Wyoming, 2017) Aswan weather station ID 62414.
  • The albedo of materials was set to 0.6, 0.2, 0.5, 0.12, 0.31 for roofs, walls of buildings, pavement, asphalt, and sand for ground.
  • The default values of ENVI-met were used for roughness length (0.01).
The validation of the model was done according to the literature, whereby the average difference between simulated and observed values is represented in root mean square error (RMSE) which describes the overarching accuracy of the model and the index of agreement (d) [63]. Where d = 1.0, it means that the simulated value equals the observed value. The data collected showed that the air temperature trends between the observations and the simulation were roughly the same; the observed peak Ta (ambient temperature) was consistently 1 to 2 °C above the simulated value. Hence, the simulated results showed good agreement with field measurements and the index of agreement d ranged between 0.96 and 0.98; the correlation (R2 > 0.96) showed that the simulation successfully captured the observed diurnal temperature trends.

2.3. Climate Change Scenarios

This study presents the local climate changes in Aswan, Egypt based on the extracted data from COSMO-CLM, a regional climate model developed by the CLM-community, a group of European research facilities based on a weather forecast model by the DWD, the German Weather Service. It can simulate meteorological parameters with a horizontal resolution of 1 to 50 km [64]. For this study, a horizontal resolution of 12.5 km was used. The output had a temporal resolution of 3 h. From a large model domain that contained the whole of Egypt, the data point for Aswan was extracted and the daily mean values for the 2 m temperature were calculated with the help of climate data operators (CDO).
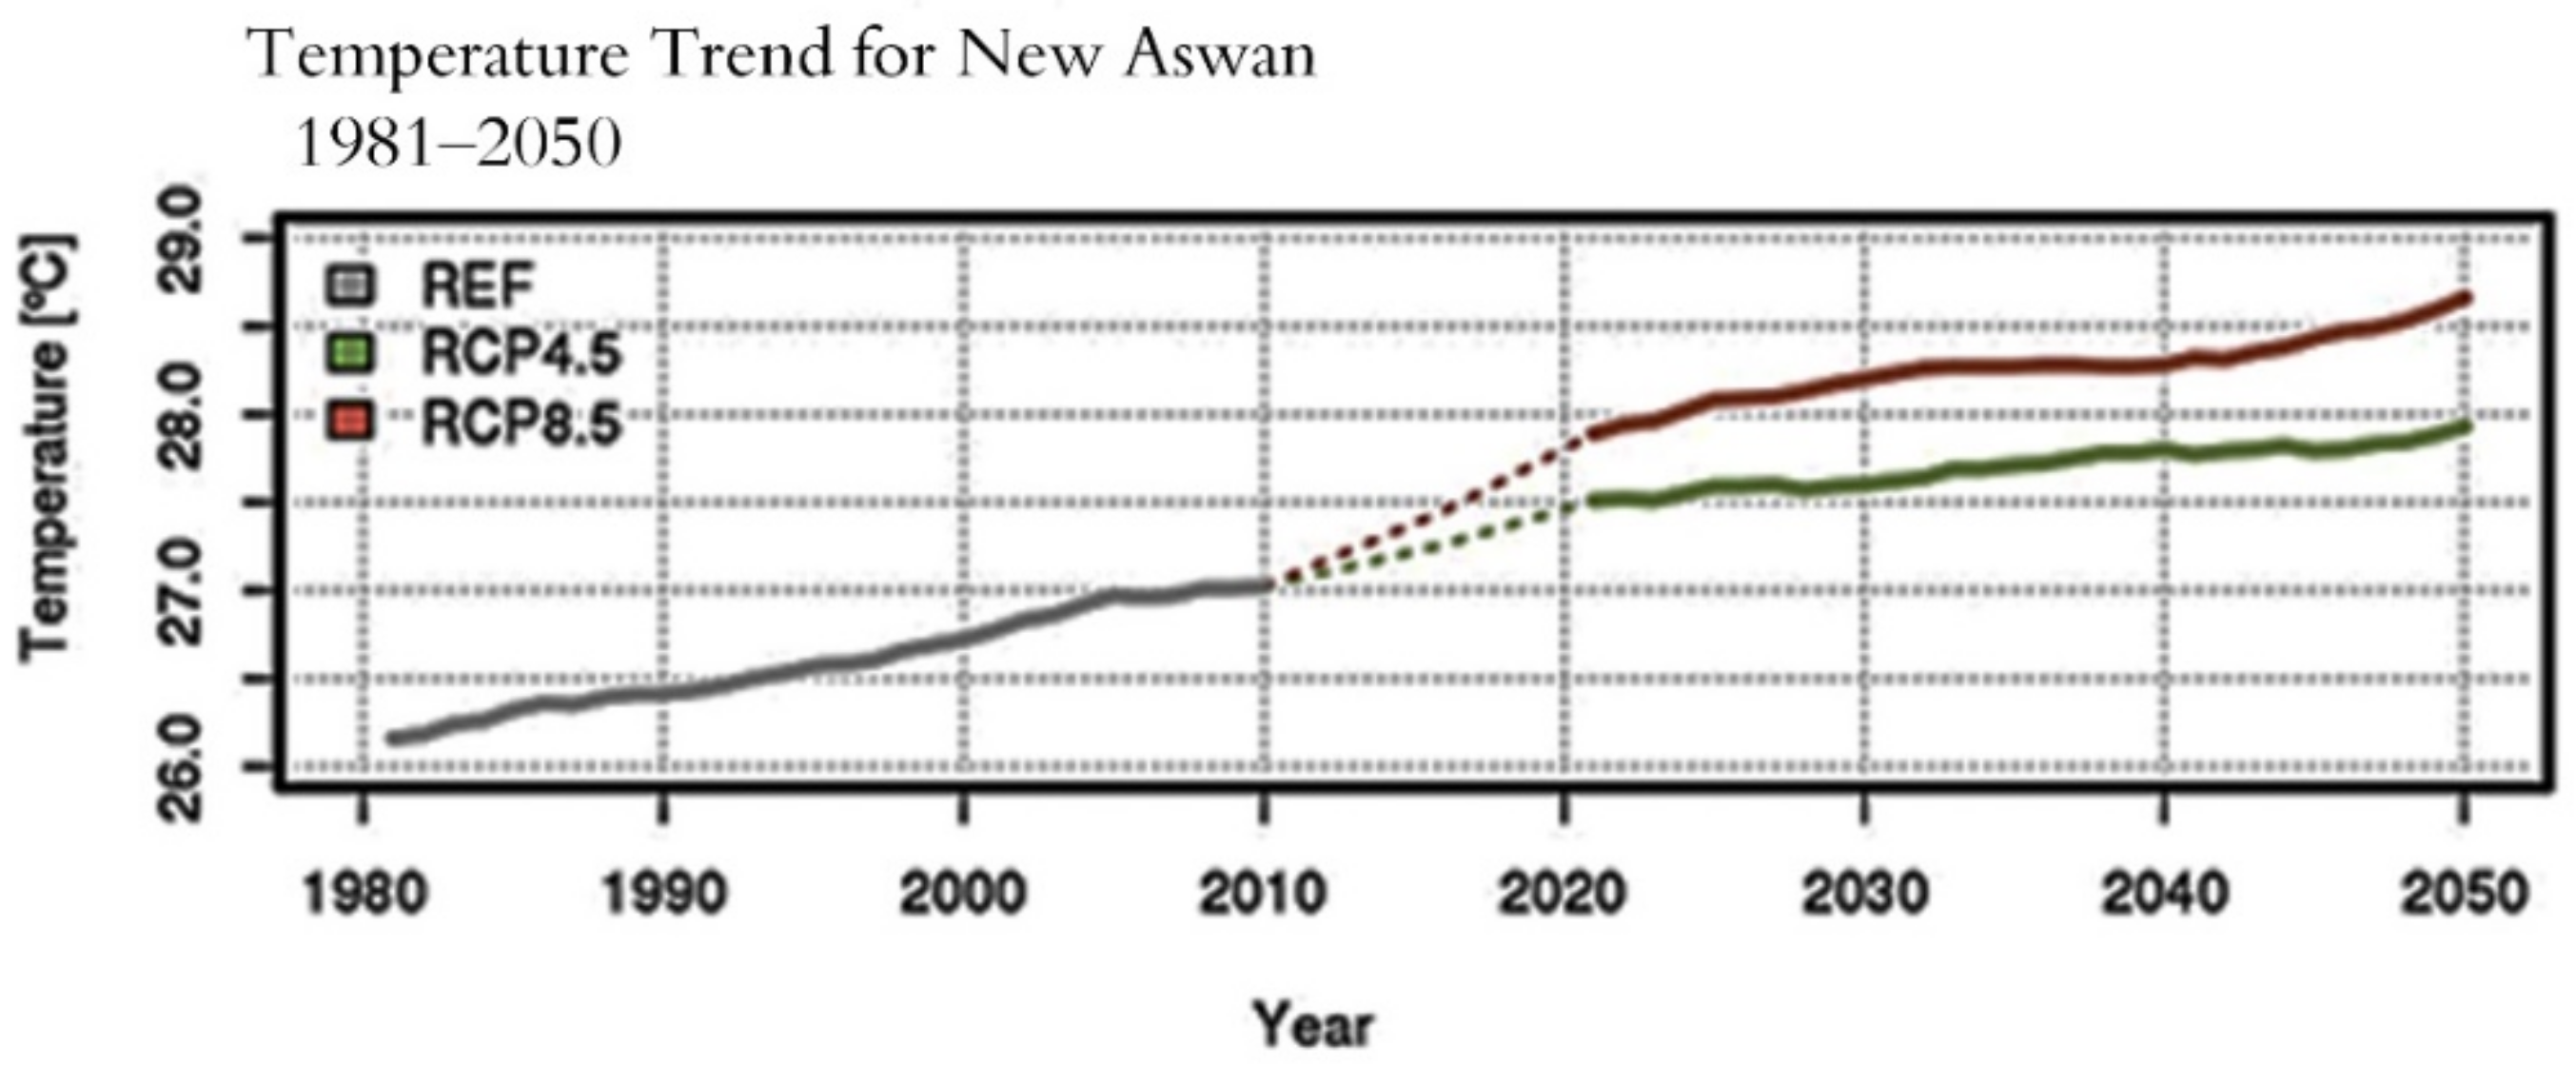
The results of this study showed significant warming in the near future for Aswan, with an increase of 2 K from 1980 till 2050 under RCP 4.5 and 2.5 K in the same period under RCP 8.5, respectively. Thus, the analysis of the temperature trend for Aswan showed a clear rise in the mean ambient temperatures during the period 1981–2050, with a rise from 26.2 to 27.9 °C under RCP 4.5 and 28.7 °C under RCP 8.5, respectively as shown in Figure 4.
The steep temperature increase on hot days and hot nights, as well as the alarming rise in occurring heat waves, will pose problems to human health. This will lead to a higher energy demand for air conditioning and thus, higher costs for the inhabitants of Aswan. Data files with different parameters as 2 m temperature, 2 m relative humidity, 10 m wind speed in m/s, and wind direction were obtained from COSMO-CLM and subsequently used as input data in ENVI-met to simulate the microclimate in the future for the study area.

2.4. Proposed Cases and Simulation Cycling

This study relied on a coupling simulation to evaluate both thermal comfort conditions for outdoor spaces and energy consumption in adjacent buildings using ENVI-met and Design Builder, respectively. Figure 5 illustrates the integration between ENVI-met and Design Builder to evaluate both outdoor thermal conditions and annual energy consumption in nearby buildings. The simulation cycle was moved through three major phases. In the first phase, a numerical simulation using ENVI-met was applied on the New Aswan University campus to evaluate the micro-climate conditions for all outdoor campus spaces to pick the hottest location on the campus.
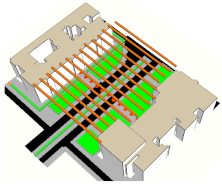
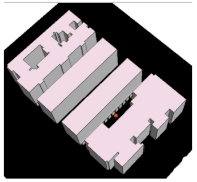
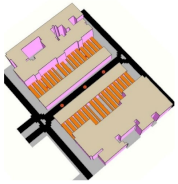
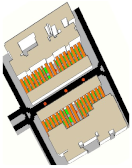
Then, the second phase demonstrated the influence of the proposed cases (PC) on the thermal comfort of the selected area in the present and future under two scenarios of climate change RCP 4.5 and RCP 8.5. The simulation process took place on 13th July 2018 and (future) 2035. In this phase, six cases were suggested to improve the thermal performance of the study area. In this respect, three proposed cases (PC1, PC2, PC3) to cover outdoor space in varying proportions (25%–50%–75%) were suggested to expand the shading area and improve the thermal conditions in the study area. With regards to the mentioned aspect ratio of the investigated case study (H/W) = 0.16. The coverage of that huge area between the buildings can be through use of simple coverings such as tents which are carried on outdoor columns located in the outer space between the investigated buildings. Using this type of coverage allows decision-makers to improve the outdoor thermal conditions, as well these types of coverage have the lowest cost among other coverages. These proposed cases reflected the first mitigation category. The fourth proposal case (PC4) reflected the second mitigation category and adopted the idea that transformation of the outer spaces into a deep canyon was assumed to enhance the thermal performance of these spaces by increasing the aspect ratio of this study area. This study added another assumption in the fifth and sixth cases (PC5, PC6), which reflected the third and fourth mitigation categories. PC5 assumed that it should be more effective to cover these canyons with an appropriate distributed roof, while PC6 had the same characteristics of PC5, but with a green surface added into the canyon. All characteristics of the proposed cases are illustrated in Table 3.
In the third phase, the extracted results of the second phase such as air temperature, relative humidity, and wind speed were used as input data. The energy demand for cooling in the adjacent buildings was calculated in this process. In this regard, for the base case and presented proposed cases, Design Builder was used for the calculation of the energy consumption of adjacent buildings in the present 2018 and future 2035 under different climate change scenarios RCP 4.5 and RCP 8.5. The adjacent buildings input data are as follows; wall to window ratio = 0.15, thermal transmittance values (U-values) of the external facades = 0.35 W/m2K, single clear glazing with thickness = 6 mm, and solar heat gain coefficient (SHGC) = 0.815 was used in the external windows.

3. Results and Discussion

The main objective of this paper is to examine approaches towards reducing energy demand for cooling in the buildings overlooking the university’s outdoor spaces by investigating the influence of urban geometry characteristics of the university’s outdoor spaces on its outdoor thermal performance. Therefore, this study investigates the impact of different urban geometry on the thermal performance of the university’s outdoor space (study area). In addition, the study also examines in depth the impact of these proposed urban geometries on the cooling energy demand in adjacent buildings.

3.1. Evaluation of Current Outdoor Thermal Performance of Whole Campus Spaces

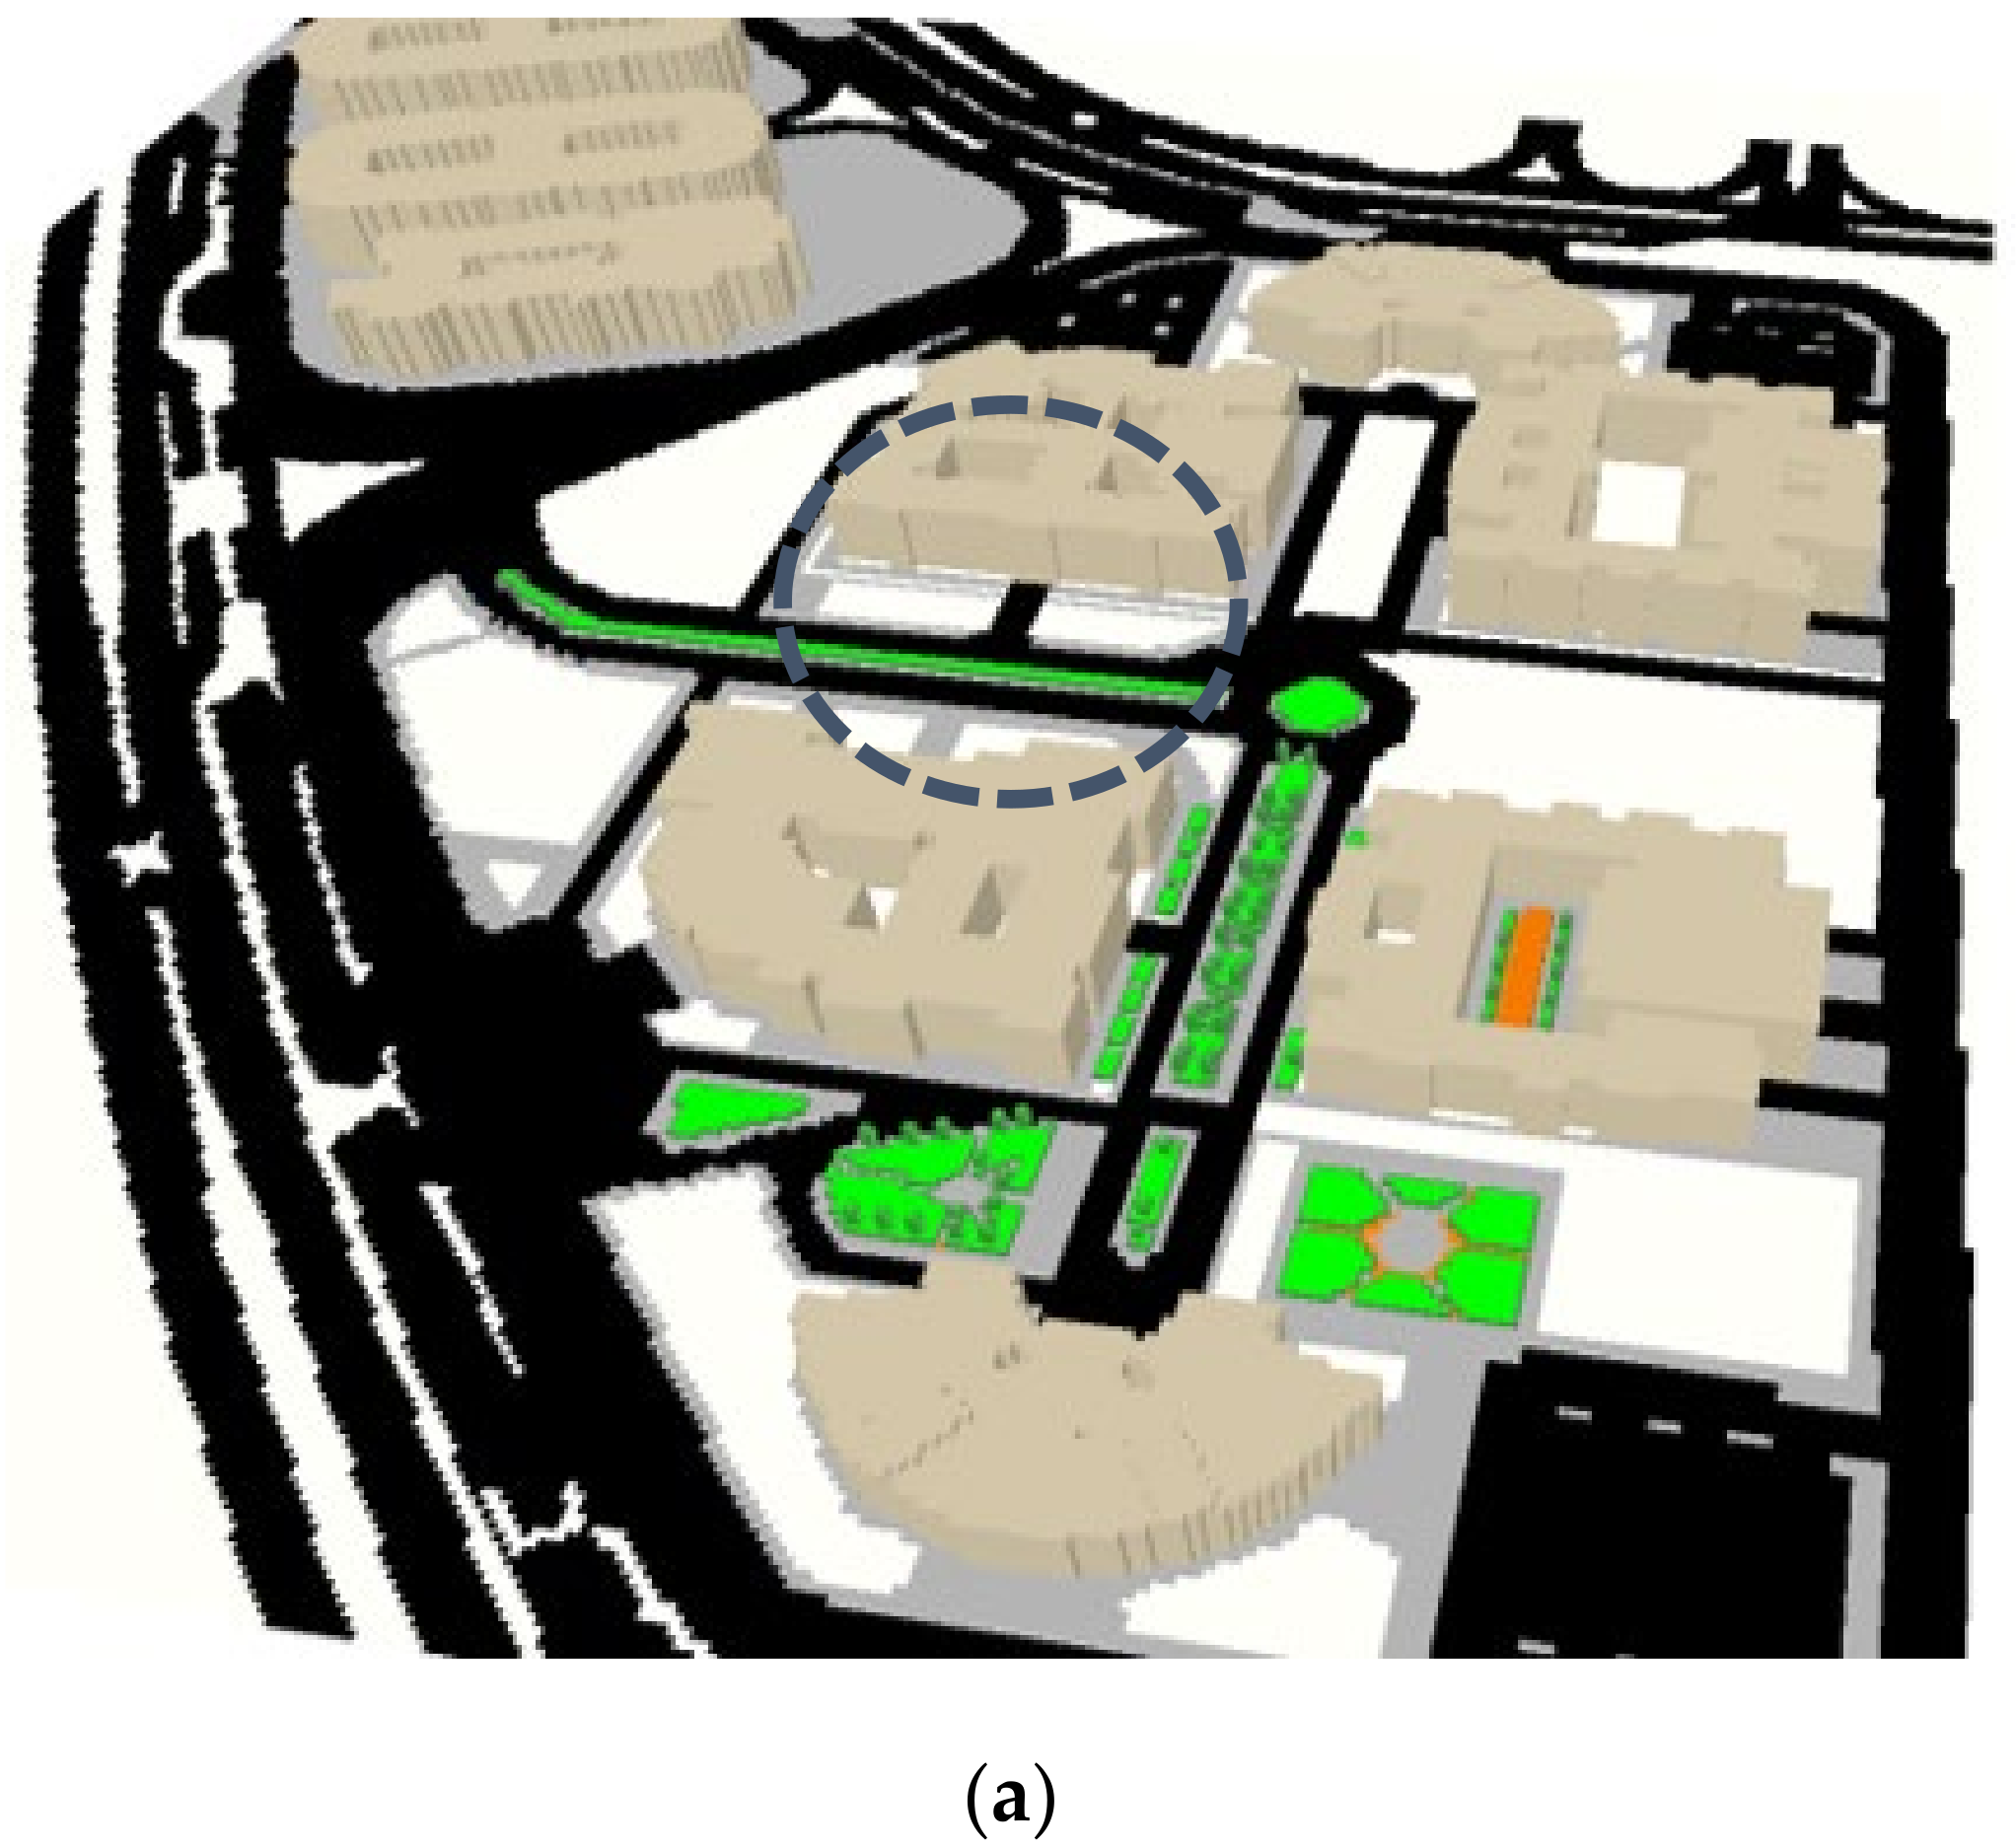
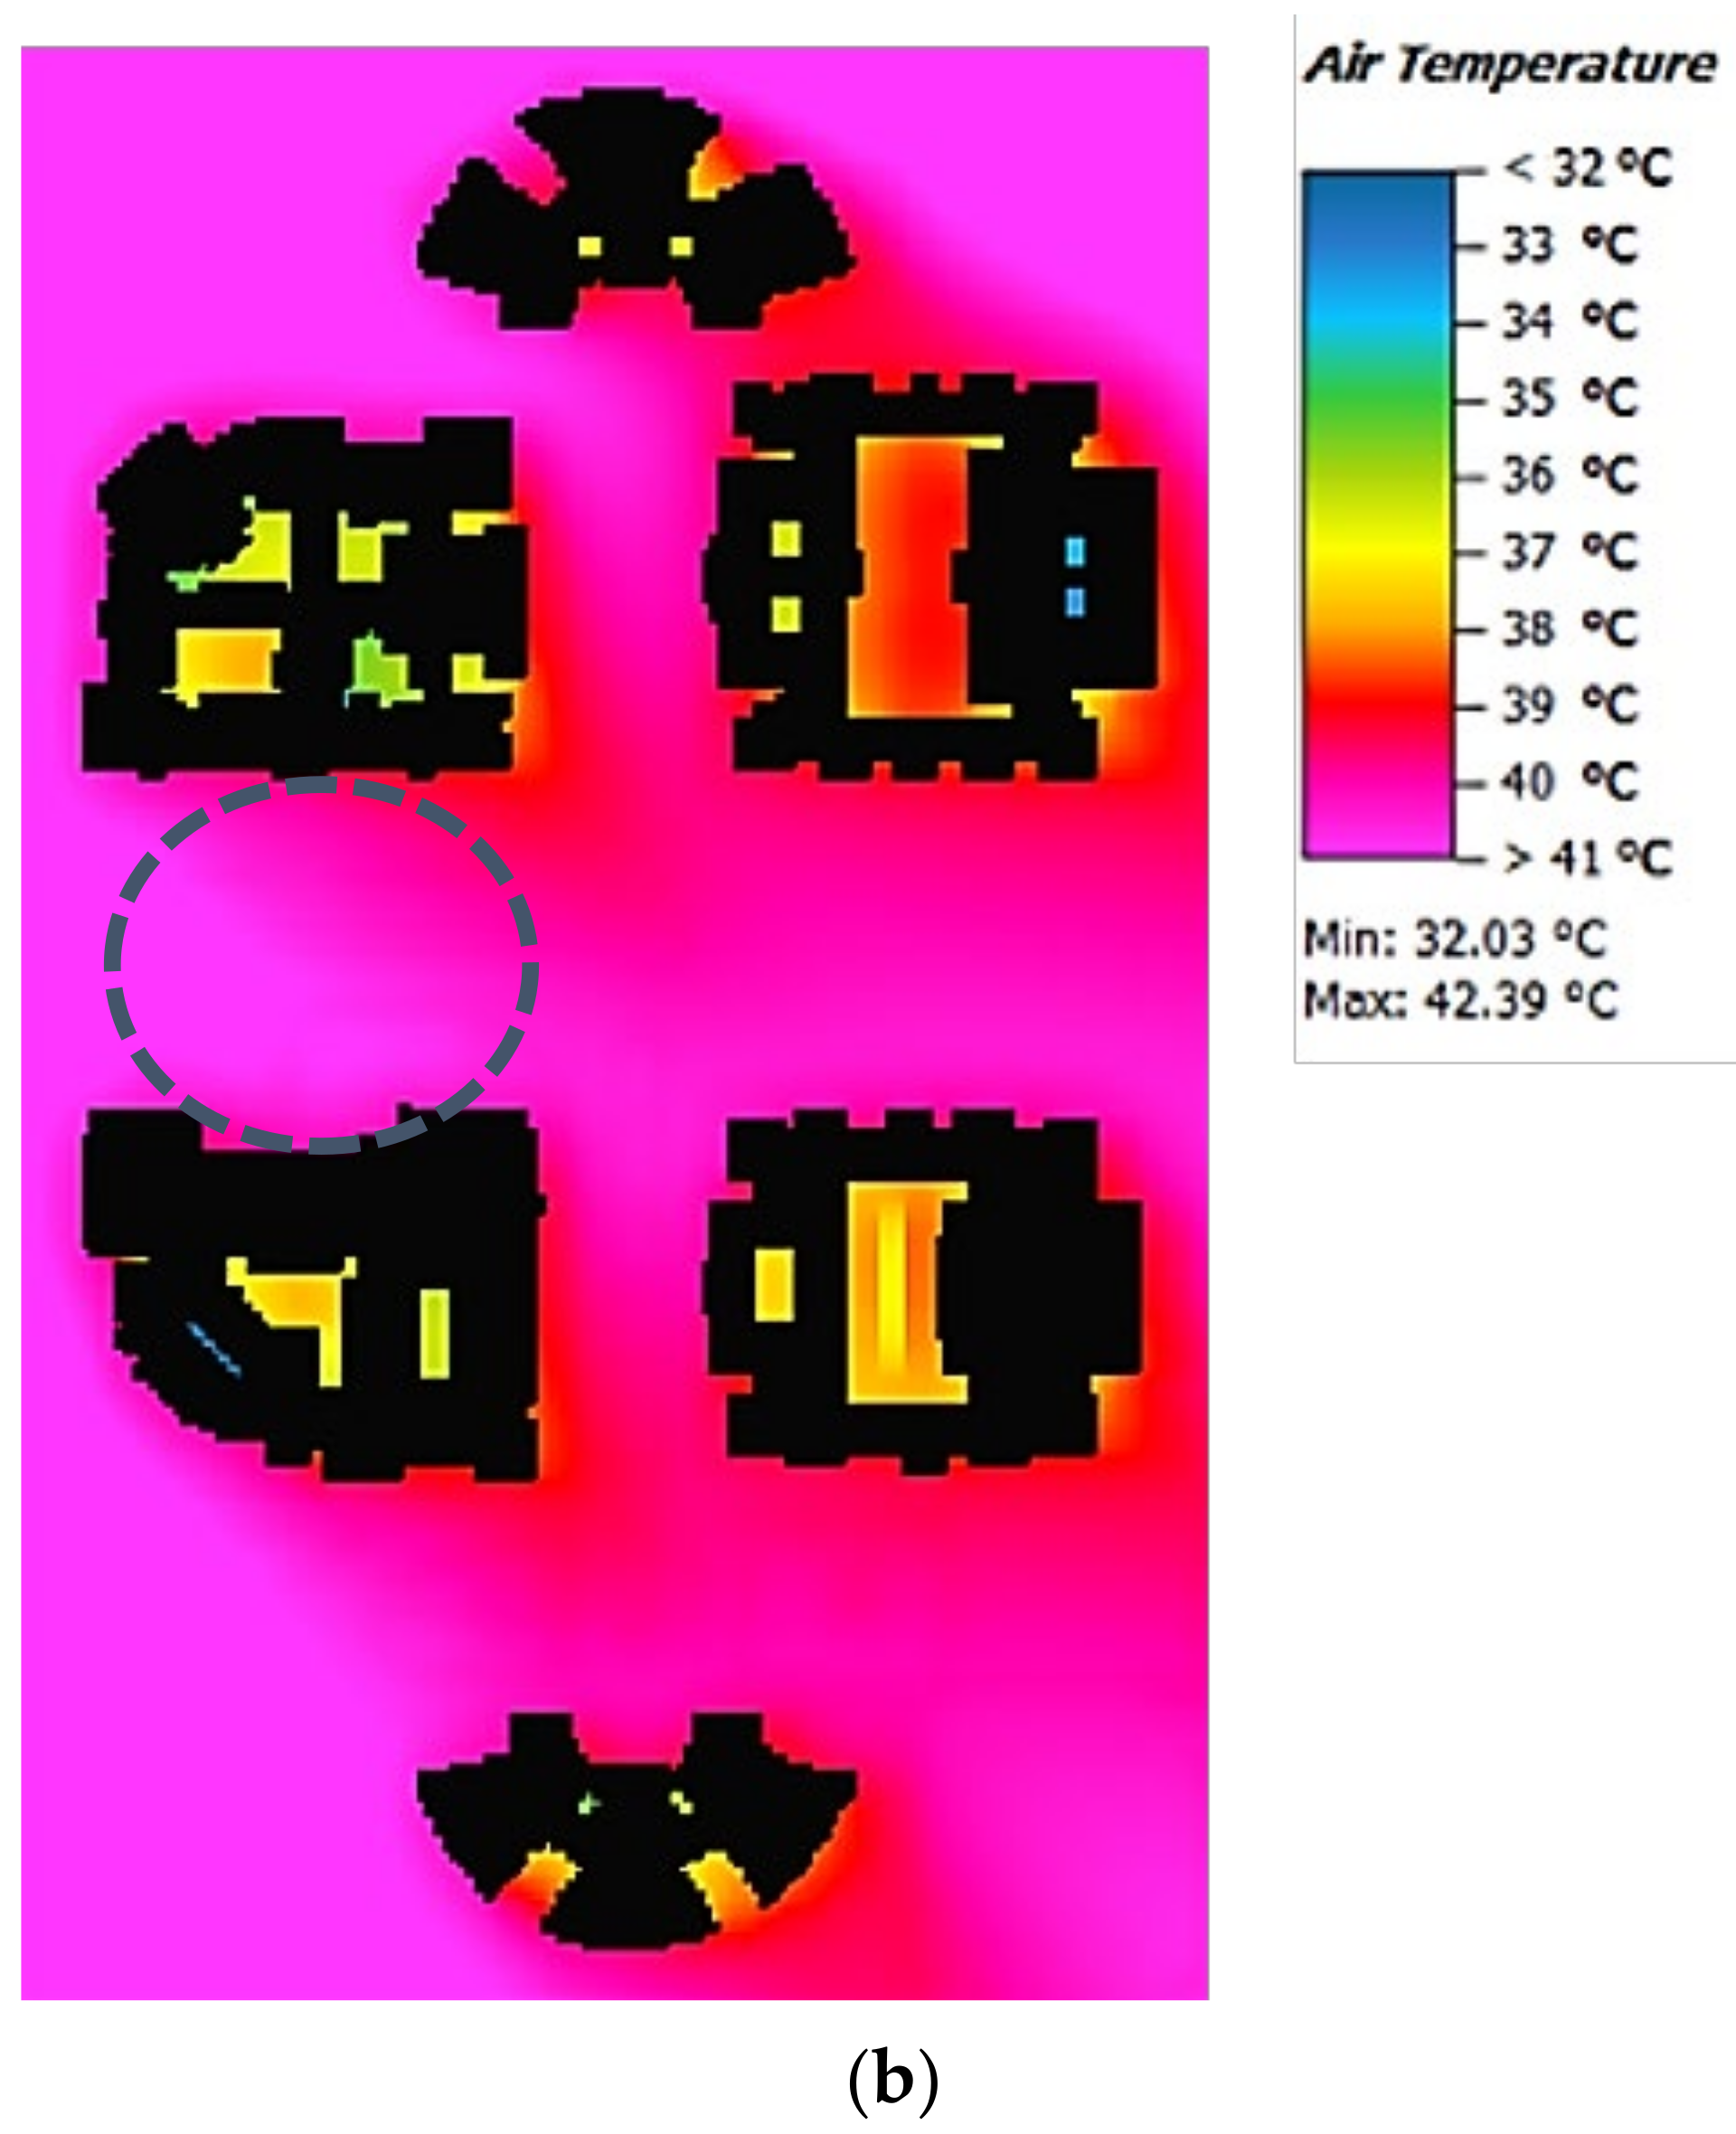
First, the current environmental conditions were analyzed to determine the main causes of thermal problems on campus. As mentioned before, several geometric variables influence outdoor space thermal behavior, such as aspect ratio, sky view factor (SVF), and orientation. The current situation reveals there are two perpendicular streets on the campus. The first street is in the N-S direction with aspect ratio = 0.16, while the second street is in the direction of the E-W with aspect ratio = 0.16. A simulation process was created for the entire campus using ENVI-met to assess the thermal performance of all campus outdoor spaces in the current situation and to determine the hottest area on the campus. It was clearly found, in terms of thermal comfort, the street with N-S direction performed slightly better than those in other direction. The hottest area was found in the street taking the east-west direction. This result was more consistent with previous research which found that, for the E-W direction, the most favored aspect ratio for outdoor spaces should be ranged between 2 to 3 [65]. Figure 6 shows the hottest area on the New Aswan University campus.

3.2. Adapted Urban Spaces to Improve Thermal Performance

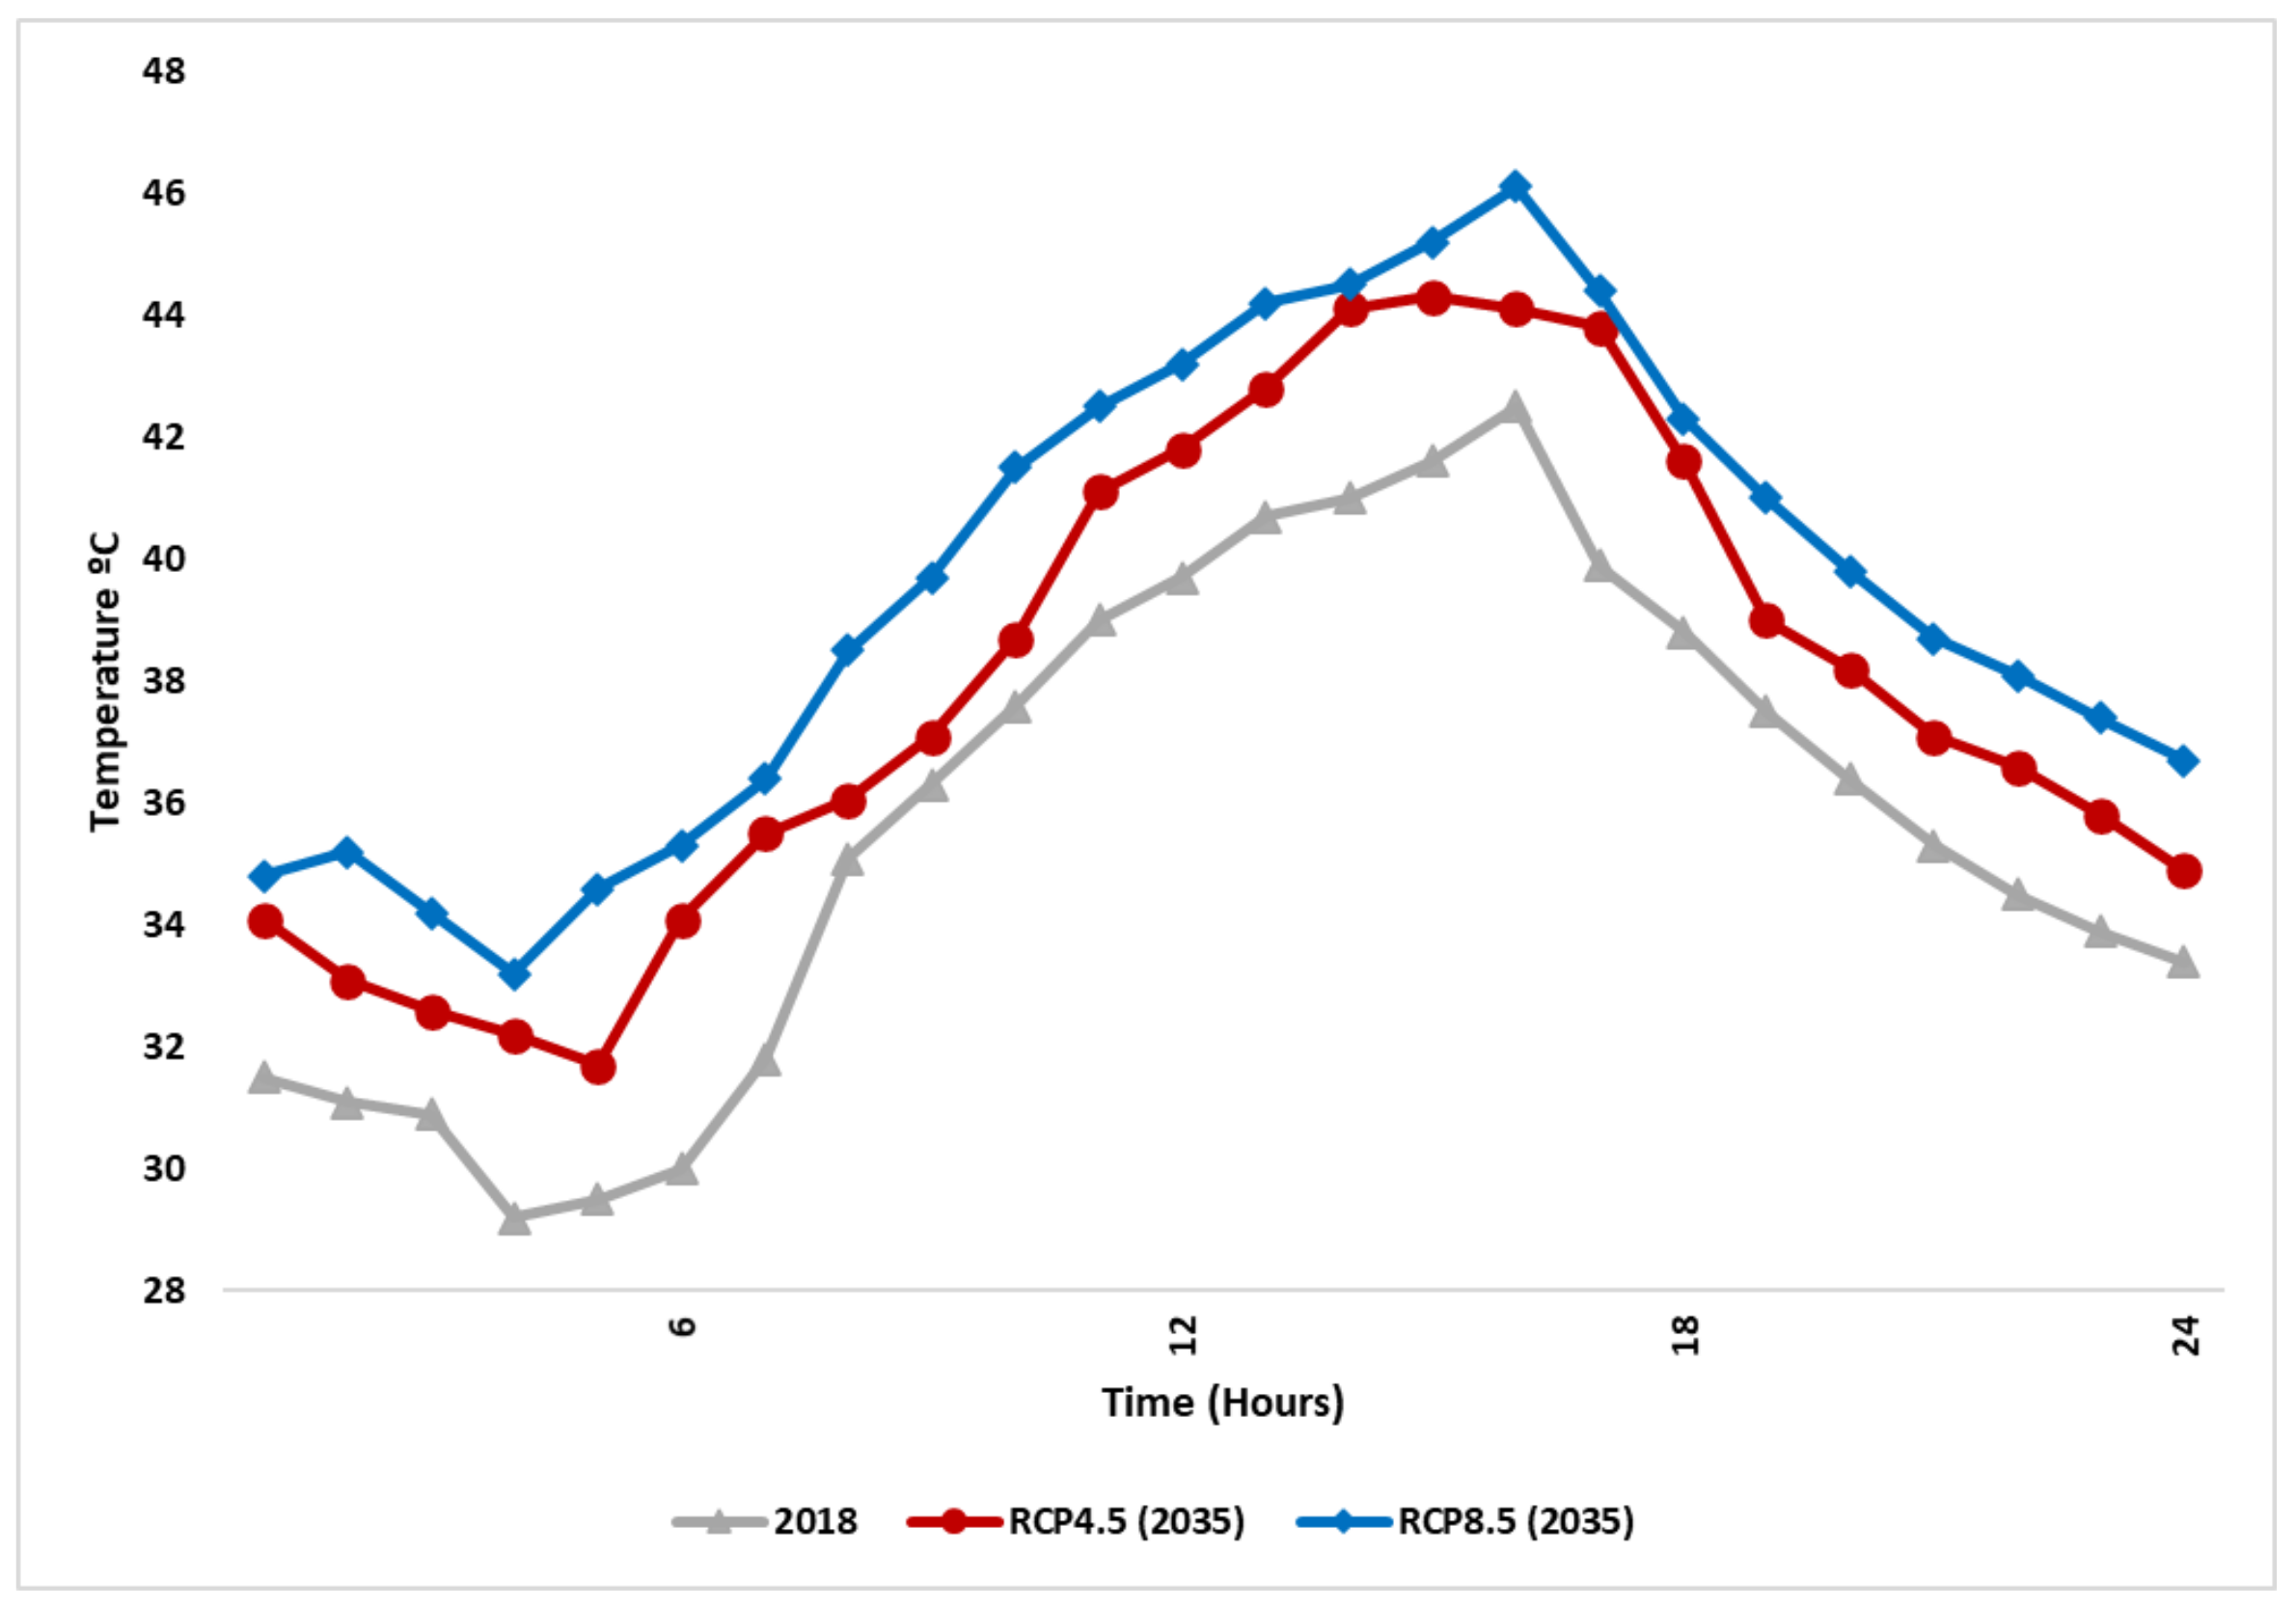
In the second phase, six proposed cases were analyzed. These proposed cases outlined four parameters of urban geometry. The shading parameter was the first parameter; the second parameter was the aspect ratio; the third parameter was merged between the first and second parameters; the fourth parameter was similar to the third parameter but with greenery added onto the ground surface. Moreover, simulation processes were conducted under different climatic conditions. Input data for simulation process in this stage were collected from Aswan Airport weather station for the present time, but extracted from COSMO-CLM for the future scenario. The findings derived from COSMO-CLM indicated a significant increase in air temperature for Aswan city in both climate change scenarios (RCP 4.5 and RCP 8.5). Extracted results from COSMO-CLM indicated that air temperature levels would increase over the day hours in the future scenario. In addition, on the 13th of July 2018, it was found that the maximum value reached 42.5 °C at 16:00, while it was projected to reach 44.3 and 46.1 °C at the same time in 2035 under the RCP 4.5 and RCP 8.5 scenarios, respectively, with an average increase ranging between 1.8–3.6 K. Such findings point out that the lack of an appropriate climate solution will have a negative impact on outdoor thermal conditions due to the impact of climate change on these areas. Figure 7 illustrates the effect of future climate change scenarios on the air temperature values in 2035.
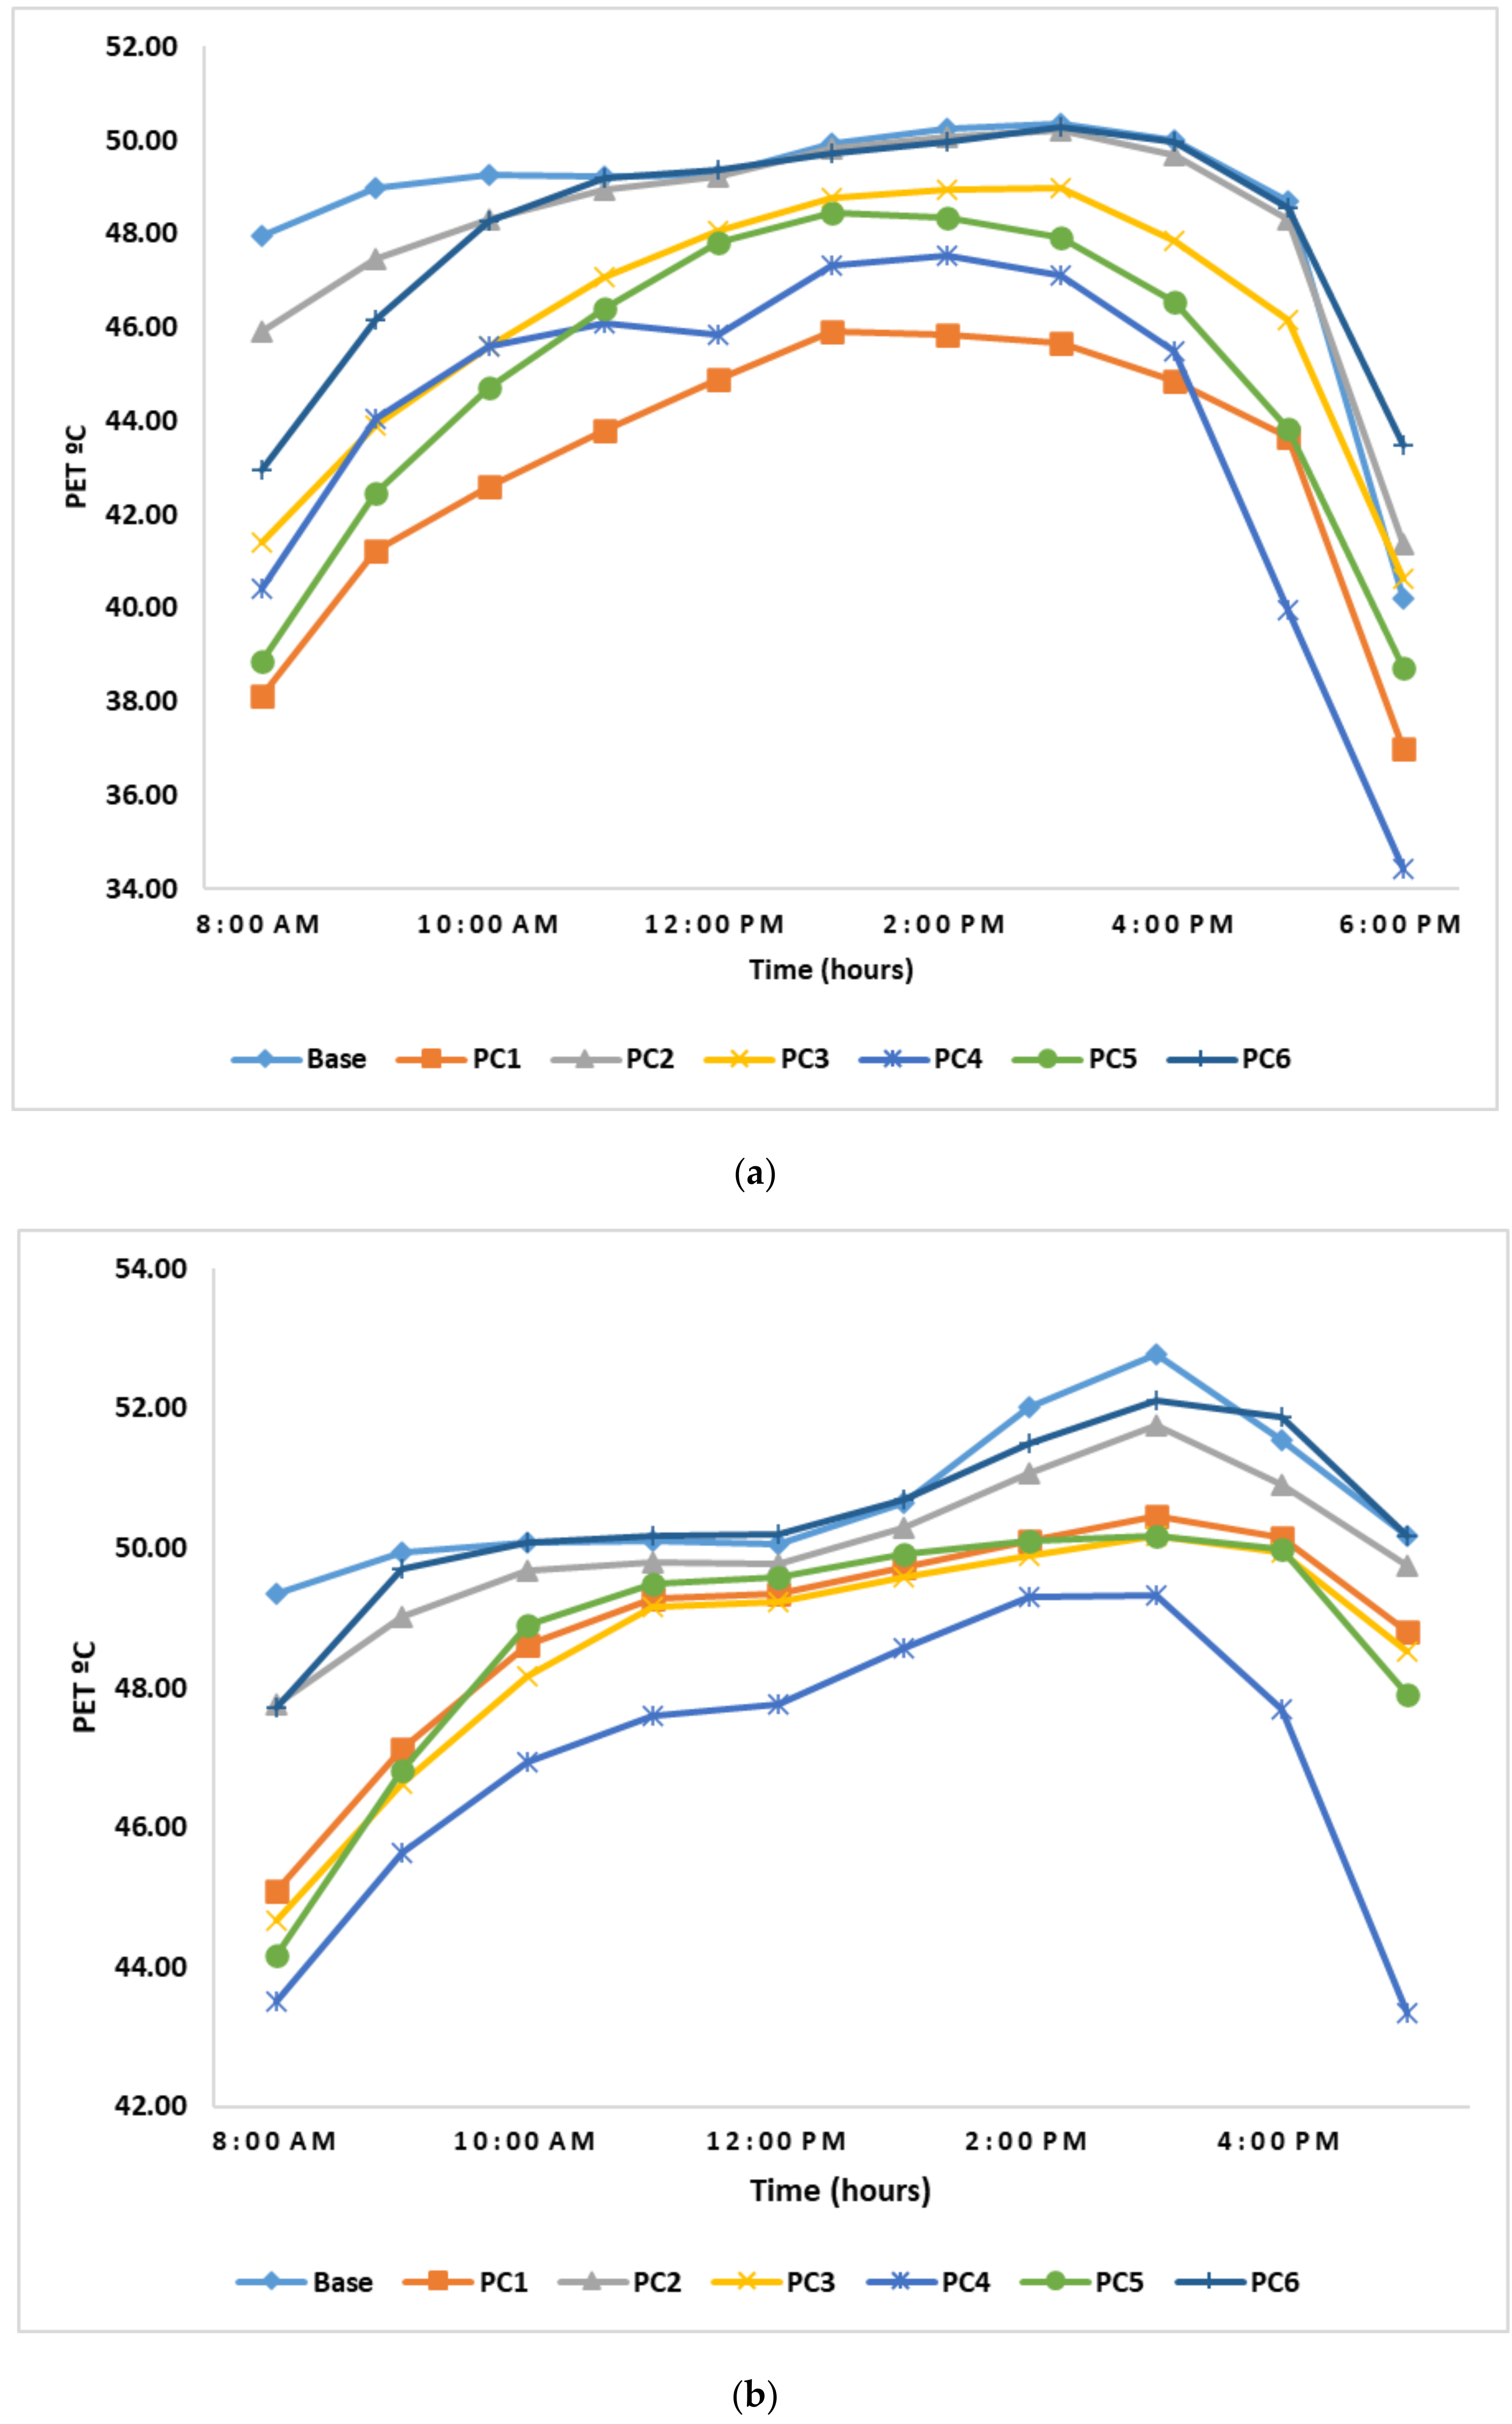
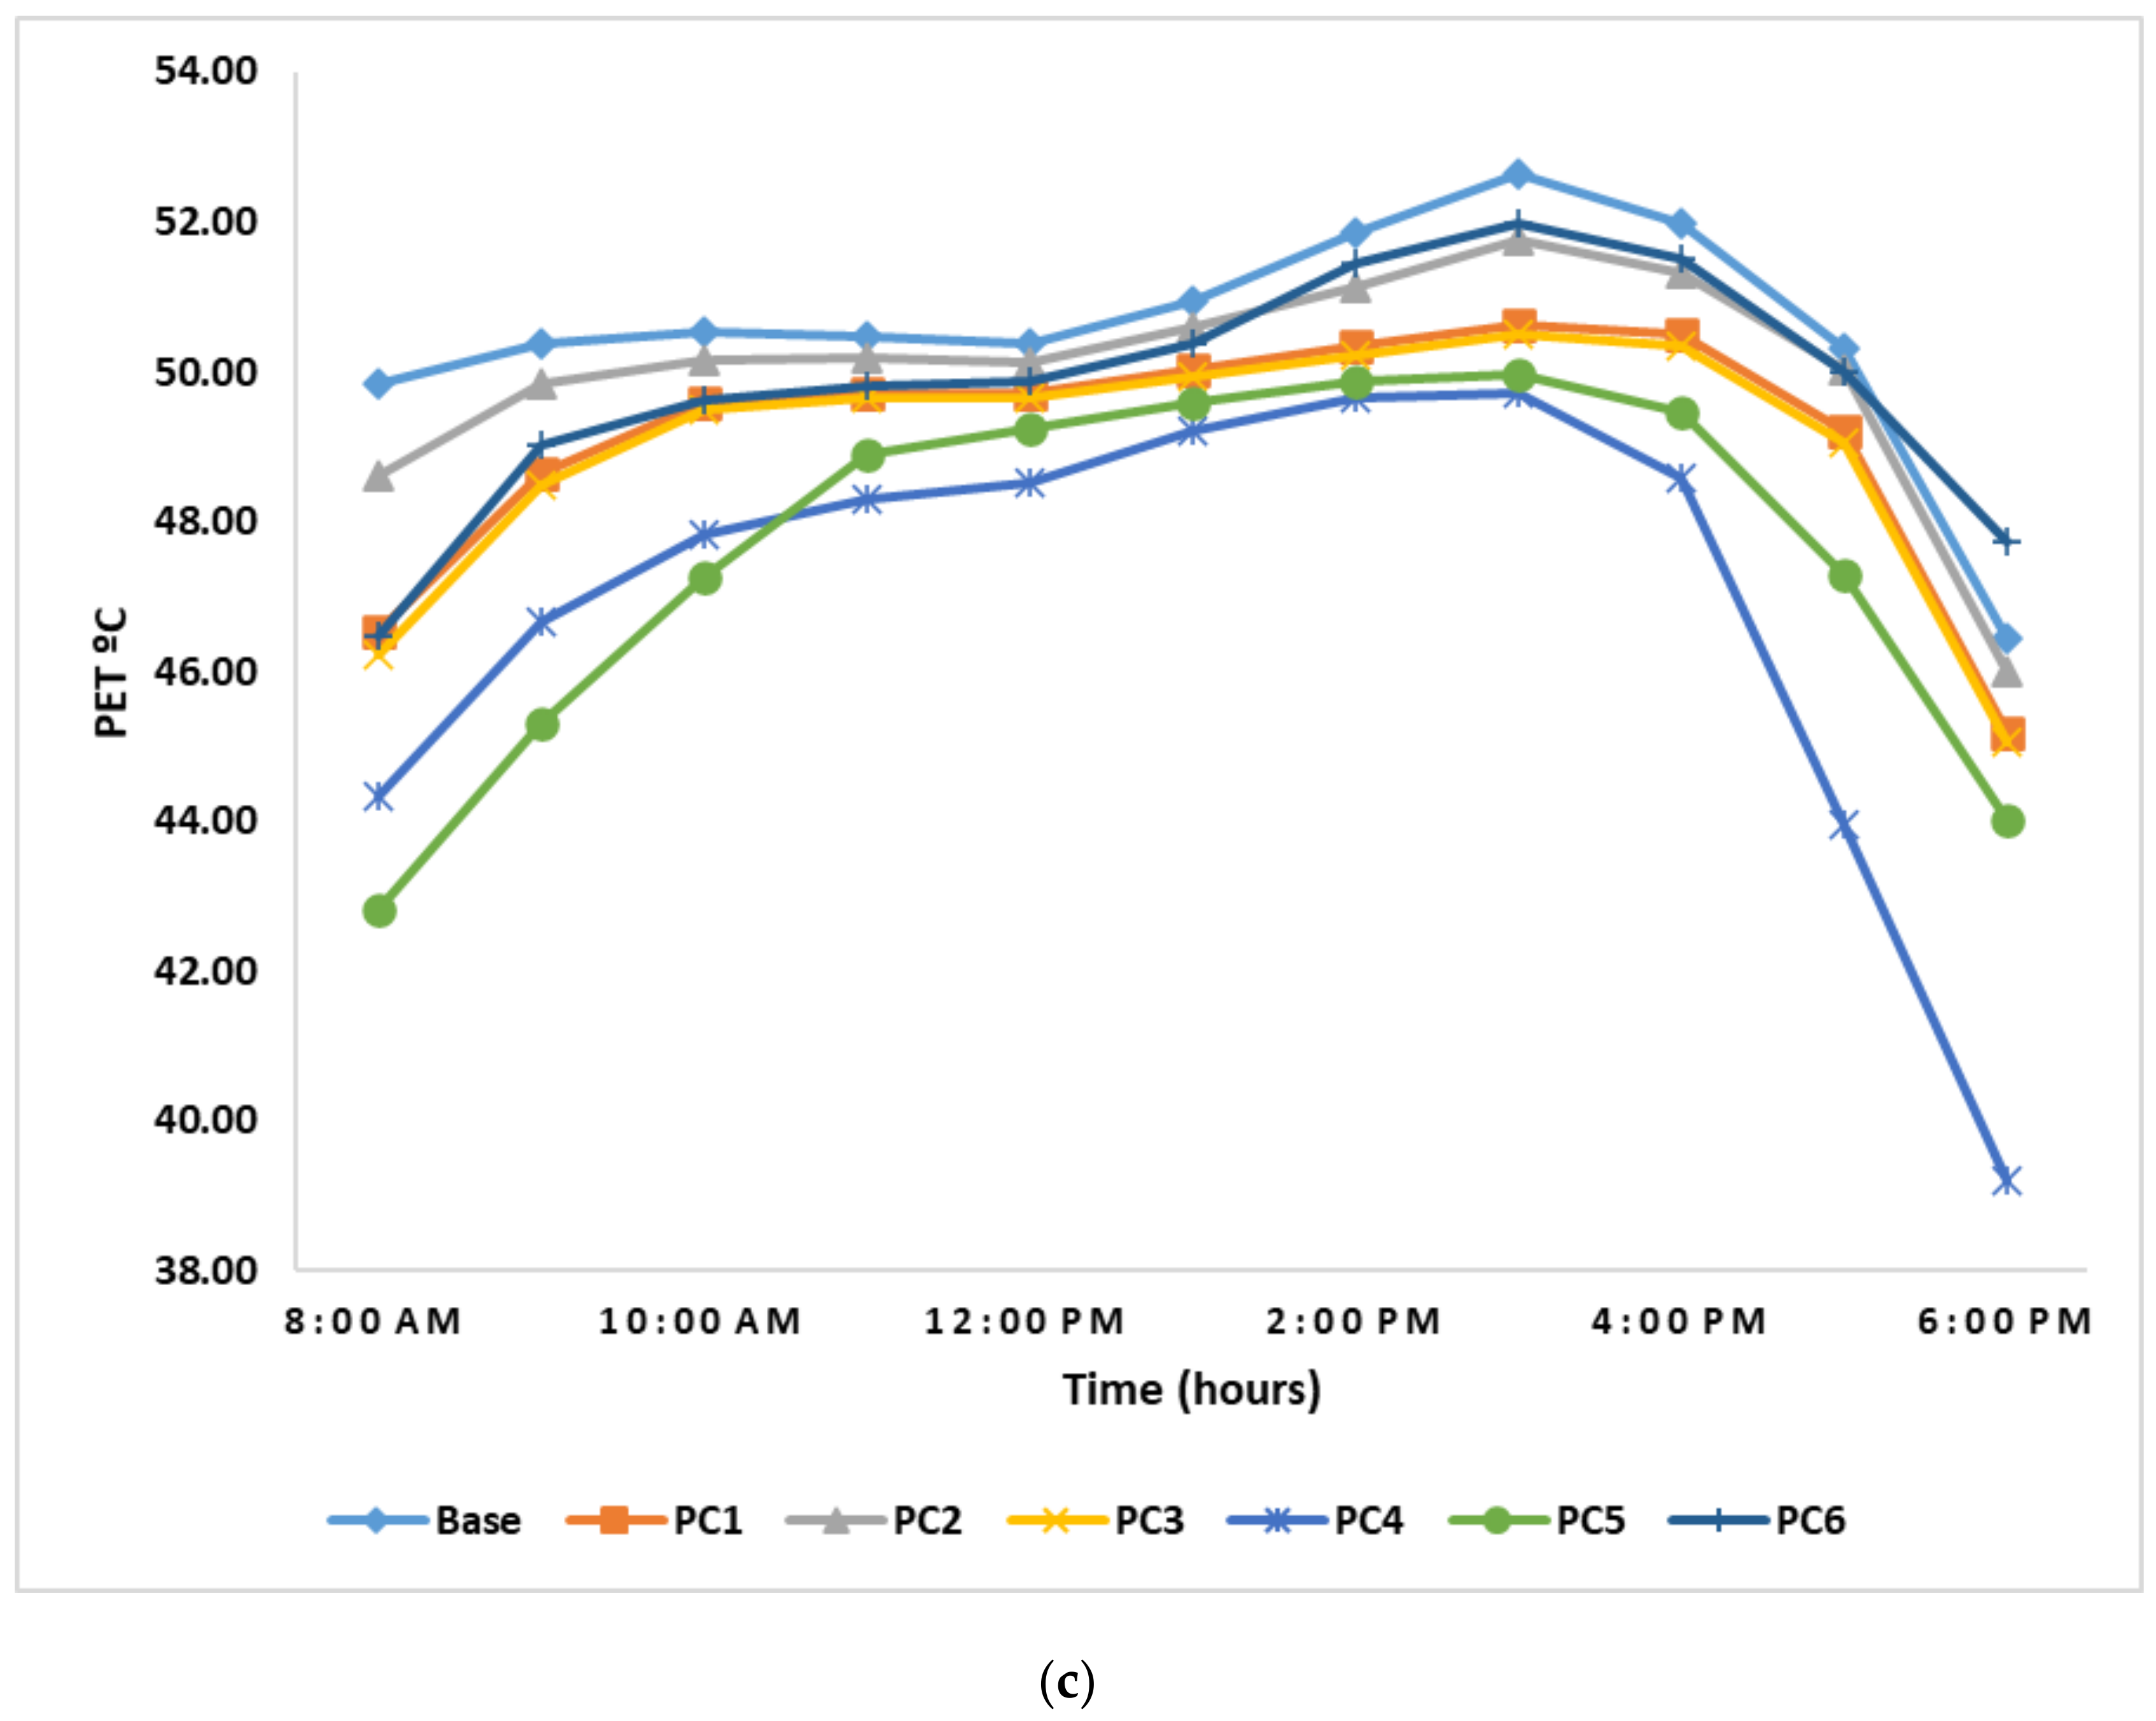
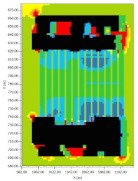
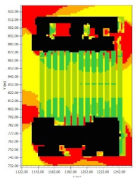
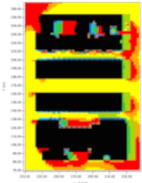
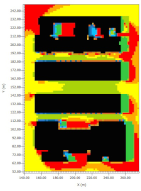
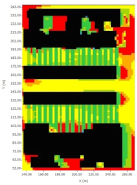
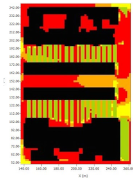
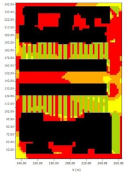
In this phase, the thermal performance of the proposed cases was evaluated using PET. It was found that all the proposed cases could improve the thermal performance of the selected areas, both at the present time and in the future. Moreover, PC1 and PC4 were the most appropriate solutions to improve the predicted thermal conditions for such spaces in arid regions in future scenarios. Nevertheless, for the present, only PC1 had priority over other scenarios, while PC4 was found to be the most appropriate scenario in the future, based on its efficiency in improving thermal performance, with an average that ranged between 4–18% in all climate change scenarios. Figure 8 and Table 4 illustrate that PET values would reach lower values in the future according to PC4. Results of PC4 showed lower PET values for 2018, RCP 4.5 (2035) and RCP 8.5 (2035) exceeded 34.42, 39.25, and 39.19 °C at 6:00 p.m., respectively. Higher values at 47.52, 49.31, and 49.7 °C were reached in the same scenarios at 3:00 p.m. This increase of future PET values will return to the heat-trapping that takes place when the space is covered by an average of 50% in combination with rising air temperatures in the coming years. Therefore, in the future, due to rising outdoor air temperatures, the higher aspect ratio of outdoor spaces would be preferred rather than sheltered outdoor spaces. It was also found that PC5 would not be an appropriate solution due to the increasing rate of heat-trapping inside these canyons in the future. Moreover, PC6 is not a recommended solution, although in these canyons, green areas were installed in conjunction with the shelter parameter. This resulted in an increase in relative humidity as well as a rise in air temperature due to heat-trapping, leading to an increase in PET values.
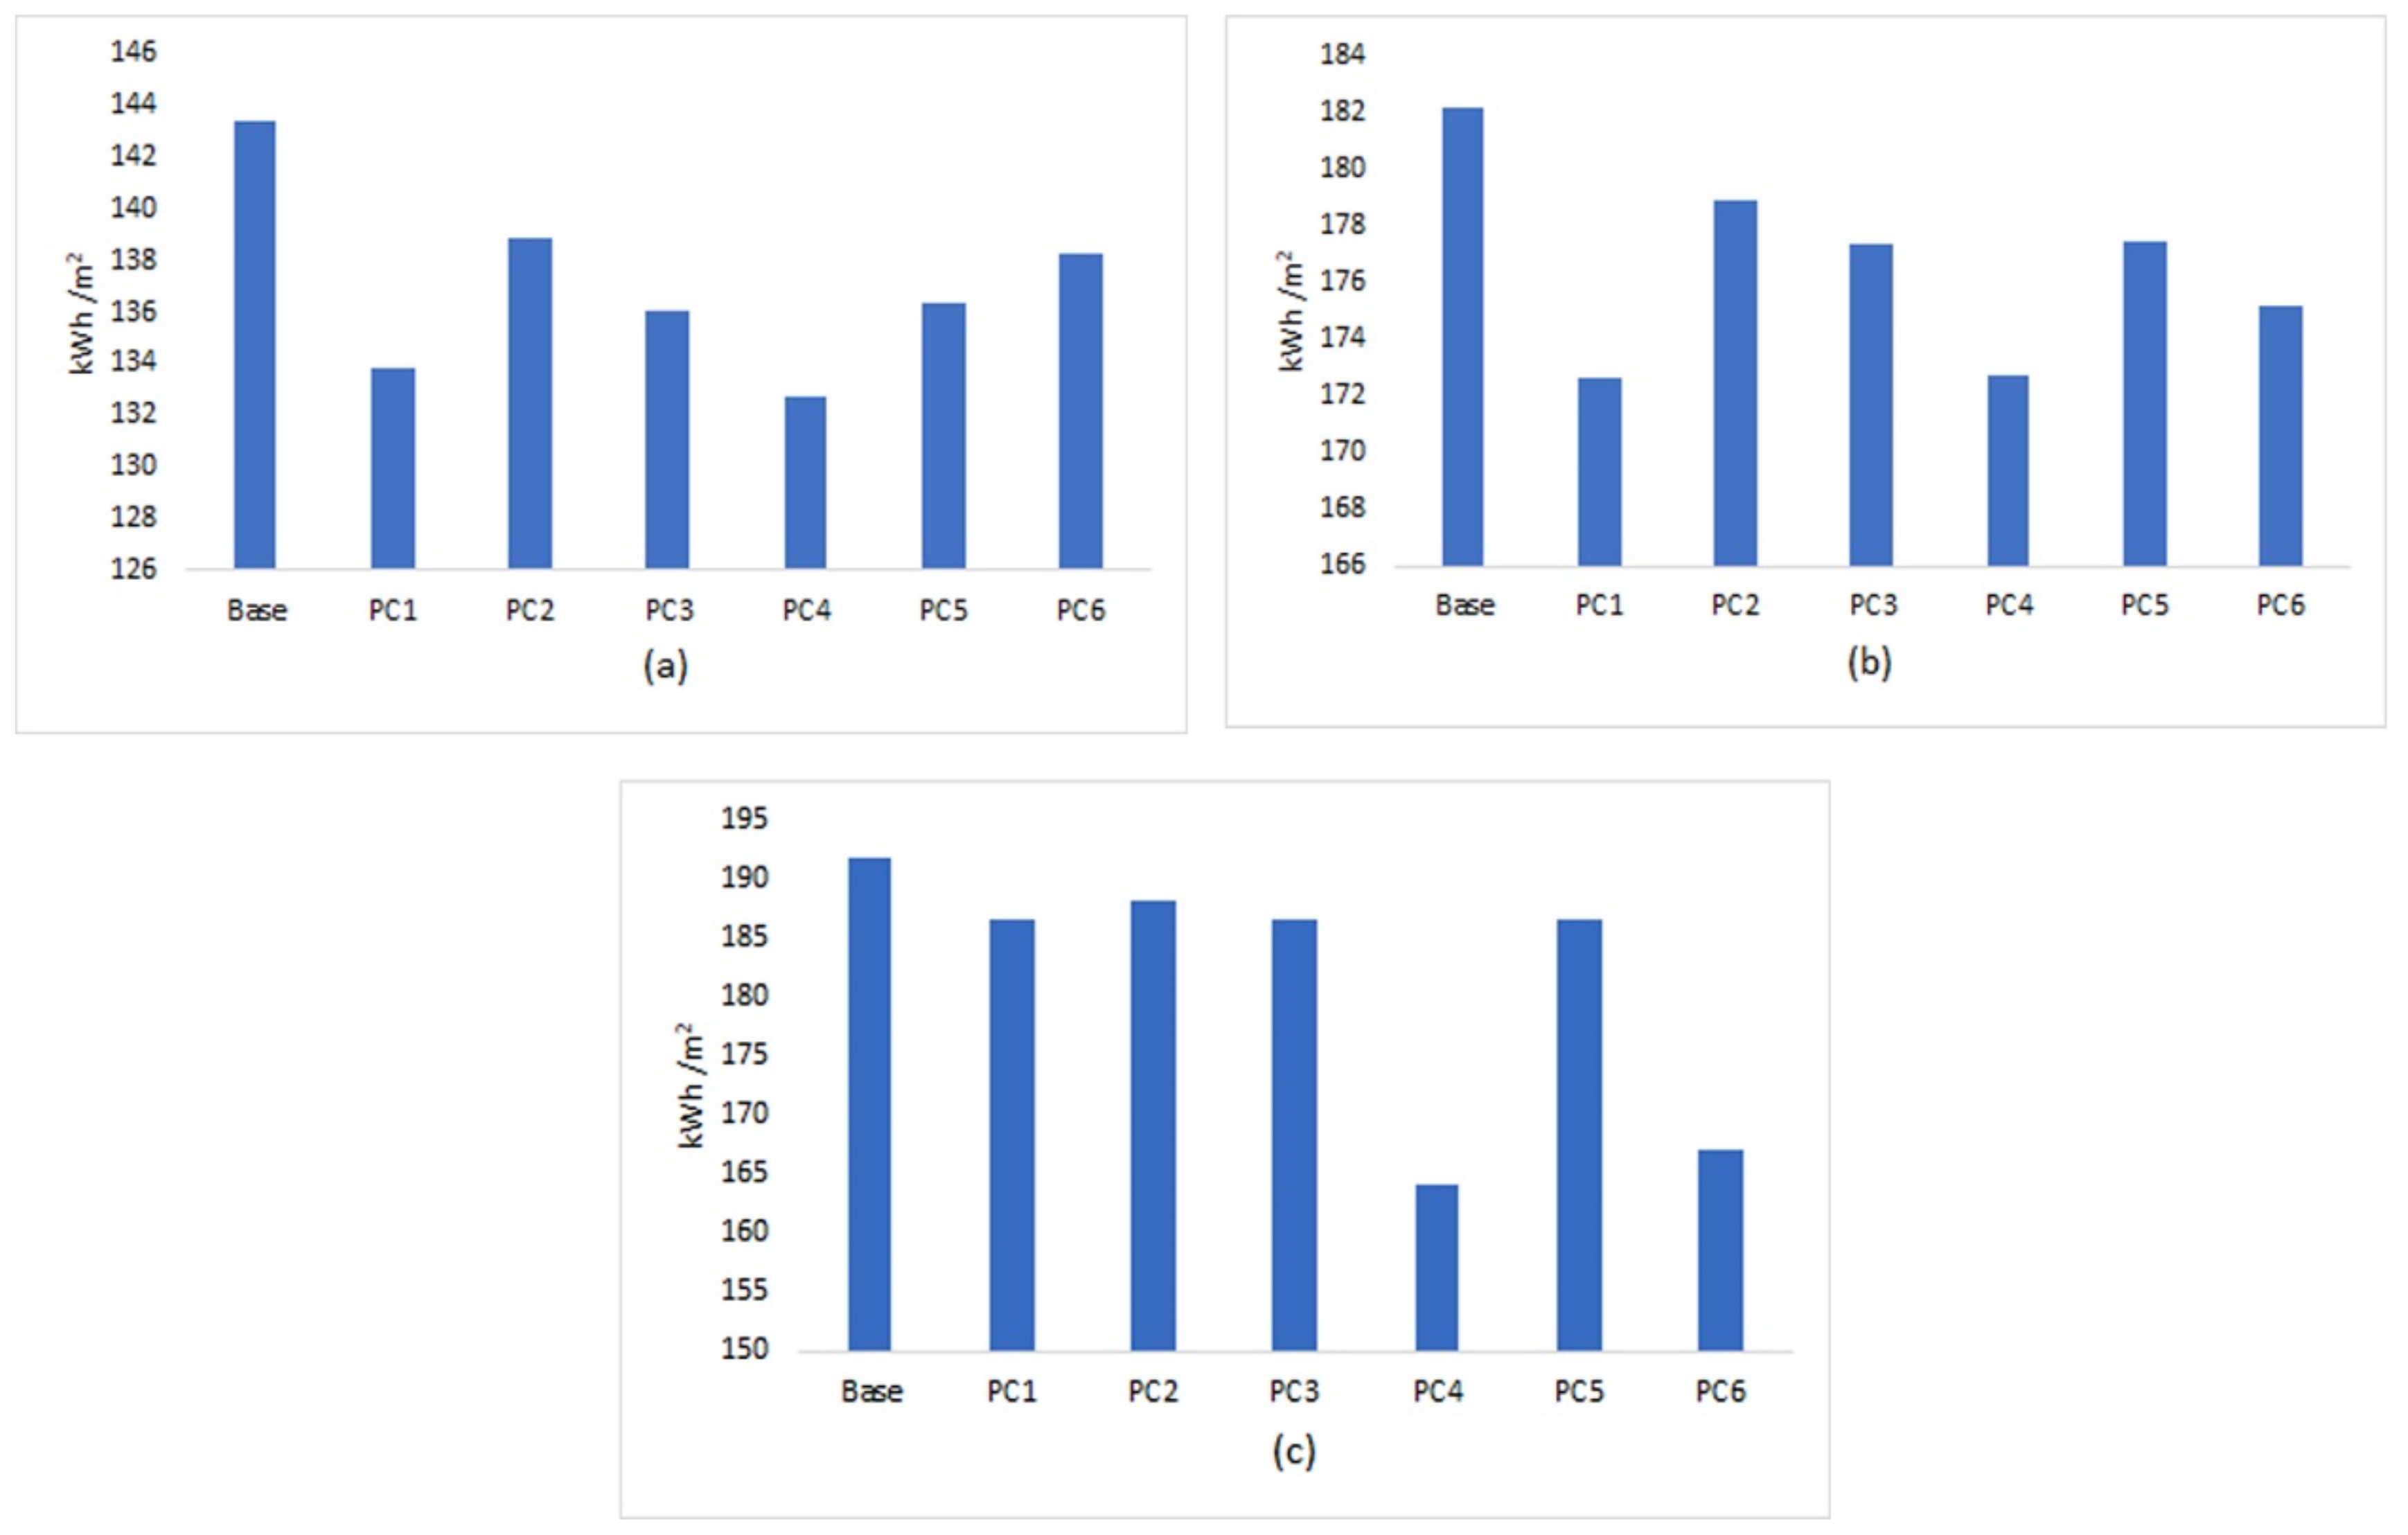
In the third phase of this study, the effect of the proposed cases on the energy demand for cooling the northern building was evaluated in the present and future scenarios. The results reflected the impact of climate change and its negative effect on energy consumption. The impact of urban geometric properties was examined to determine the total amount of energy consumption in adjacent buildings due to differences in thermal loads on building façades in each urban geometry scenario. It was found that PC1 and PC4 had almost the best effect on the outdoor thermal performance in the present as well as in the future. For PC1, the average percentage of improvement in 2018, (2035) RCP 4.5, and (2035) RCP 8.5 were 6.64%, 5.2%, and 2.79%, respectively.
In general, the results of PC1 in the present and future (2035) RCP 4.5 are more compatible with the climate, while it would not have the same effect in (2035) RCP 8.5 due to the increase of heatwaves in the RCP 8.5 scenario. The base case, however, did not compare well with PC1 and PC4 due to increasing thermal load on the building façades according to the solar inclination which is rather high, especially in summer, when it reaches more than 80°. So, many parts of building facades, especially the top floor, are subjected to a high level of thermal load. This significant amount of thermal load led to increased energy demand for cooling in the top floors and in the entire adjacent indoor spaces. Figure 9 presents the amount of energy consumption in the adjacent buildings in the present and future scenarios.

4. Conclusions

The study investigates the effect of different urban geometry on both thermal performances of outdoor spaces and the energy required for cooling in the buildings overlooking outdoor spaces. The focus is on assessing the efficiency of six proposed cases that present four main parameters. These parameters are distributed shading roof parameters, canyon parameters with higher aspect ratio values, integration between the above parameters, and adding greening to the ground surface of the integration parameter. The study shows an improvement of the outdoor thermal comfort in the case that depends on the parameter concerned with covering the outer space with a distributed roof (covering 50% of the total area of the outer space) in comparison with other studied parameters at the present time. This thermal improvement will continue in the case of meteorological temperatures recording values less than 42 °C, while dependence on the canyons becomes the best solution in the case of the meteorological temperatures exceeding that value, an inevitability in future scenarios due to climate change. So, relying on the deep canyons without any covering would prevent the occurrence of heat-trapping as well as the reduction of the area of the surfaces exposed to the intense direct solar radiation, significantly reducing the PET values inside those canyons. This result is in agreement with a previous study (Mohammed. A, 2015) [66] which found that higher solar radiation on the space surfaces led to greater heat sensitivity to the ambient air, resulting in a significant temperature increase.
In general, the study showed an improvement in the outdoor thermal comfort in all studied proposed cases; the energy consumption of the indoor spaces overlooking the studied outdoor space was decreased, with an average percentage between 1.8–14.4% in simulation cases in the present and in the future. Energy consumption for cooling is an index of the impact of urban geometry on the outer spaces. The study concluded that several useful urban geometrical strategies could be applied to Egyptian universities located in arid areas to enhance their environmental performance and energy consumption by surrounding buildings, and especially for spaces that are overlooked by urban structures. These strategies could be applied in the early stages of the building design or as a future modification in the occupancy stage.

Author Contributions

H.M. and A.R. conceived the idea and research design of this paper, acquired the data, performed the data analysis, developed and validated the model, and wrote the paper. All authors have read and agreed to the published version of the manuscript.

Funding

This research was funded by the Science and Technology Development Fund (STDF), Egypt, and the Federal Ministry of Education and Research, Germany (BMBF), ID: 23022.

Acknowledgments

This paper is based upon work supported by Science, Technology & Innovation Funding Authority (STDF) under grant “German-Egyptian Research Fund” (GERF4), ID: 23022.

Conflicts of Interest

The authors declare no conflict of interest.

References

  1. Levermore, G.J. A review of the IPCC assessment report four, part 1: The IPCC process and greenhouse gas emission trends from buildings worldwide. Build Serv. Eng. Res. Technol. 2008, 29, 349–361. [Google Scholar] [CrossRef]
  2. IPCC—Intergovernmental Panel on Climate Change. Available online: https://archive.ipcc.ch/ (accessed on 20 October 2019).
  3. Levermore, G.J. A review of the IPCC assessment report four, Part 2: Mitigation options for residential and commercial buildings. Build Serv. Eng. Res. Technol. 2008, 29, 363–374. [Google Scholar] [CrossRef]
  4. IPCC. ENVI_MET—Decoding Urban Nature—Microclimate Simulations|ENVI_MET. 2007. Available online: https://www.envi-met.com/ (accessed on 7 January 2019).
  5. Nikolic, D.; Djordjevic, S.; Skerlic, J.; Radulovic, J. Energy analyses of serbian buildings with horizontal overhangs: A case study. Energies 2020, 13, 4577. [Google Scholar] [CrossRef]
  6. Ruyssenaars, P.G.; Coenen, P.W.H.G.; Zijlema, P.J.; Arets, E.J.M.M.; Baas, K.; Dröge, R.; Geilenkirchen, G.; Honig, E.; van Huet, B.; van Huis, E.P.; et al. Greenhouse gas emissions in the Netherlands 1990–2017. In National Inventory Report 2019; RIVM: Utrecht, The Netherlands, 2019. [Google Scholar]
  7. Partridge, L.E.; Loughnane, E.J. Committed carbon—Upgrading existing buildings. Struct. Des. Tall Spec. Build. 2008, 17, 989–1002. [Google Scholar] [CrossRef]
  8. Al-Waked, R.; Nasif, M.S.; Groenhout, N.; Partridge, L. Energy performance and CO2 emissions of HVAC systems in commercial buildings. Buildings 2017, 7, 84. [Google Scholar] [CrossRef] [Green Version]
  9. Jentsch, M.F.; Bahaj, A.S.; James, P.A.B. Climate change future proofing of buildings—Generation and assessment of building simulation weather files. Energy Build. 2008, 40, 2148–2168. [Google Scholar] [CrossRef]
  10. Holmes, M.J.; Hacker, J.N. Climate change, thermal comfort and energy: Meeting the design challenges of the 21st century. Energy Build. 2007, 39, 802–814. [Google Scholar] [CrossRef]
  11. Timor-Leste National Directorate of Meteorology and Geophysics. Current and Future Climate of Timor-Leste; Pacific Climate Change Science Programme (PCCSP): Melbourne, Australia, 2015. [Google Scholar]
  12. Hassan, K.E. The Future Impacts of Climate Change on Egyptian Population, International Union for the Scientific Study of Population (IUSSP). In Proceedings of the XXVII IUSSP International Population Conference, Busan, Korea, 31 August 2013; pp. 1–15. [Google Scholar]
  13. Egypt Ministry of the Environment. Egypt’s Third National Communication under the United Nations Framework Convention on Climate Change; Government Printers: Cairo, Egypt, 2016.
  14. Mahdy, M.M.; Nikolopoulou, M.; Fahmy, M. Climate Change Scenarios Effects on Residential Buildings Shading Strategies in Egypt; Building Simulation–Towards Sustainable & Green Life: Cairo, Egypt, 2013. [Google Scholar]
  15. Galal, O.M.; Mahmoud, H.; Sailor, D. Impact of evolving building morphology on microclimate in a hot arid climate. Sustain. Cities Soc. 2020, 54, 102011. [Google Scholar] [CrossRef]
  16. Galal, O.M.; Sailor, D.J.; Mahmoud, H. The impact of urban form on outdoor thermal comfort in hot arid environments during daylight hours, case study: New Aswan. Build Environ. 2020, 45, 107222. [Google Scholar] [CrossRef]
  17. Fahmy, M.; Sharples, S. On the development of an urban passive thermal comfort system in Cairo, Egypt. Build Environ. 2009, 34, 1907–1916. [Google Scholar] [CrossRef]
  18. Fahmy, M.; El-Hady, H.; Mahdy, M.; Abdelalim, M.F. On the green adaptation of urban developments in Egypt; predicting community future energy efficiency using coupled outdoor-indoor simulations. Energy Build. 2017, 153, 241–261. [Google Scholar] [CrossRef]
  19. Muthers, S.; Laschewski, G.; Matzarakis, A. The summers 2003 and 2015 in South-West Germany: heat waves and heat-related mortality in the context of climate change. Atmosphere 2017, 8, 224. [Google Scholar] [CrossRef] [Green Version]
  20. Silva, S.; Soares, I.; Pinho, C. Climate change impacts on electricity demand: The case of a Southern European country. Util. Policy 2020, 67, 101115. [Google Scholar] [CrossRef]
  21. Mirasgedis, S.; Sarafidis, Y.; Georgopoulou, E.; Kotroni, V.; Lagouvardos, K.; Lalas, D.P. Modeling framework for estimating impacts of climate change on electricity demand at regional level: Case of Greece. Energy Convers. Manag. 2007, 48, 1737–1750. [Google Scholar] [CrossRef]
  22. Russo, S.; Sillmann, J.; Fischer, E.M. Top ten European heatwaves since 1950 and their occurrence in the coming decades. Environ. Res. Lett. 2015, 10, 124003. [Google Scholar] [CrossRef]
  23. Wenz, L.; Levermann, A.; Auffhammer, M. North–south polarization of European electricity consumption under future warming. Proc. Natl. Acad. Sci. USA 2017, 114, E7910–E7918. [Google Scholar] [CrossRef] [Green Version]
  24. Moral-Carcedo, J.; Vicéns-Otero, J. Modelling the non-linear response of Spanish electricity demand to temperature variations. Energy Econ. 2005, 27, 477–494. [Google Scholar] [CrossRef]
  25. Li, G.; Cai, L.; Chen, L.; Chen, T.; Zhang, X.; Pan, Y. Relations of total electricity consumption to climate change in Nanjing. Energy Procedia 2018, 152, 756–761. [Google Scholar] [CrossRef]
  26. Lindberg, F.; Holmer, B.; Thorsson, S. SOLWEIG 1.0–Modelling spatial variations of 3D radiant fluxes and mean radiant temperature in complex urban settings. Int. J. Biometeorol. 2008, 52, 697–713. [Google Scholar] [CrossRef]
  27. Moss, R.H.; Edmonds, J.A.; Hibbard, K.A.; Manning, M.R.; Rose, S.K.; Van Vuuren, D.P.; Carter, T.R.; Emori, S.; Kainuma, M.; Kram, T.; et al. The next generation of scenarios for climate change research and assessment. Nature 2010, 463, 747–756. [Google Scholar] [CrossRef]
  28. Moss, R.; Babiker, W.; Brinkman, S.; Calvo, E.; Carter, T.; Edmonds, J.; Elgizouli, I.; Emori, S.; Erda, L.; Hibbard, K.; et al. Towards New Scenarios for the Analysis of Emissions: Climate Change, Impacts and Response Strategies; Intergovernmental Panel on Climate Change Secretariat (IPCC): Geneva, Switzerland, 2008. [Google Scholar]
  29. Ramyar, R.; Zarghami, E.; Bryant, M. Spatio-temporal planning of urban neighborhoods in the context of global climate change: Lessons for urban form design in Tehran, Iran. Sustain. Cities Soc. 2019, 51, 101554. [Google Scholar] [CrossRef]
  30. Mahmoud, A.H.A. An analysis of bioclimatic zones and implications for design of outdoor built environments in Egypt. Build. Environ. 2011, 46, 605–620. [Google Scholar] [CrossRef]
  31. Krüger, E.L.; Minella, F.O.; Rasia, F. Impact of urban geometry on outdoor thermal comfort and air quality from field measurements in Curitiba, Brazil. Build. Environ. 2011, 46, 621–634. [Google Scholar] [CrossRef]
  32. Ali, M.M.; Moon, K.S. Structural Developments in Tall Buildings: Current Trends and Future Prospects. Archit. Sci. Rev. 2007, 50, 179–182. [Google Scholar] [CrossRef]
  33. Yang, F.; Lau, S.S.Y.; Qian, F. Thermal comfort effects of urban design strategies in high-rise urban environments in a sub-tropical climate. Archit. Sci. Rev. 2011, 54, 285–304. [Google Scholar] [CrossRef]
  34. Taleghani, M.; Sailor, D.; Ban-Weiss, G.A. Micrometeorological simulations to predict the impacts of heat mitigation strategies on pedestrian thermal comfort in a Los Angeles neighborhood. Environ. Res. Lett. 2016, 11, 024003. [Google Scholar] [CrossRef]
  35. Höppe, P. The physiological equivalent temperature—A universal index for the biometeorological assessment of the thermal environment. Int. J. Biometeorol. 1999, 43, 71–75. [Google Scholar] [CrossRef]
  36. Brosy, C.; Zaninovic, K. Quantification of climate tourism potential of Croatia based on measured data and regional modeling. Int. J. Biometeorol. 2013, 58, 1369–1381. [Google Scholar] [CrossRef]
  37. Deb, C. The significance of Physiological Equivalent Temperature (PET) in outdoor thermal comfort studies. Int. J. Eng. Sci. Technol. 2010, 2, 2825–2828. [Google Scholar]
  38. Fang, Z.; Feng, X.; Liu, J.; Lin, Z.; Mak, C.M.; Niu, J.; Tse, K.-T.; Xu, X. Investigation into the differences among several outdoor thermal comfort indices against field survey in subtropics. Sustain. Cities Soc. 2019, 44, 676–690. [Google Scholar] [CrossRef]
  39. Lau, K.K.L.; Chung, S.C.; Ren, C. Outdoor thermal comfort in different urban settings of sub-tropical high-density cities: An approach of adopting local climate zone (LCZ) classification. Build. Environ. 2019, 154, 227–238. [Google Scholar] [CrossRef]
  40. Ali-Toudert, F.; Djenane, M.; Bensalem, R.; Mayer, H. Outdoor thermal comfort in the old desert city of Beni-Isguen. Algeria. Clim. Res. 2005, 28, 243–256. [Google Scholar] [CrossRef] [Green Version]
  41. Matzarakis, A.; Rutz, F.; Mayer, H. Modelling radiation fluxes in simple and complex environments—Application of the RayMan model. Int. J. Biometeorol. 2007, 51, 323–334. [Google Scholar] [CrossRef] [PubMed]
  42. Ali-Toudert, F.; Mayer, H. Numerical study on the effects of aspect ratio and orientation of an urban street canyon on outdoor thermal comfort in hot and dry climate. Build. Environ. 2006, 41, 94–108. [Google Scholar] [CrossRef]
  43. Matzarakis, A.; Mayer, H.; Iziomon, M.G. Applications of a universal thermal index: Physiological equivalent temperature. Int. J. Biometeorol. 1999, 43, 76–84. [Google Scholar] [CrossRef] [PubMed]
  44. Nikolopoulou, M.; Lykoudis, S. Thermal comfort in outdoor urban spaces: Analysis across different European countries. Build. Environ. 2006, 41, 1455–1470. [Google Scholar] [CrossRef] [Green Version]
  45. Perini, K.; Magliocco, A. Effects of vegetation, urban density, building height, and atmospheric conditions on local temperatures and thermal comfort. Urban For. Urban Green. 2014, 13, 495–506. [Google Scholar] [CrossRef]
  46. Srivanit, M.; Hokao, K. Evaluating the cooling effects of greening for improving the outdoor thermal environment at an institutional campus in the summer. Build. Environ. 2013, 66, 158–172. [Google Scholar] [CrossRef]
  47. Andrade, H.; Alcoforado, M.J. Microclimatic variation of thermal comfort in a district of Lisbon (Telheiras) at night. Theor. Appl. Clim. 2008, 92, 225–237. [Google Scholar] [CrossRef]
  48. Bahgat, R.; Reffat, R.M.; Elkady, S.L. Energy Efficiency Design Guide for Optimal Urban Features of Open Spaces in Residential Complexes. Acad. Res. Community Publ. 2019, 3, 136–152. [Google Scholar] [CrossRef]
  49. Ayman Ragab, A.M.; Hssan, M.; Tarek, D. The Effect of Using Nano-Materials in External Openings on Energy Consumption in Hot Desert Climate. J. Eng. Sci. JES 2020, 48, 468–477. [Google Scholar]
  50. Strømann-Andersen, J.; Sattrup, P.A. The urban canyon and building energy use: Urban density versus daylight and passive solar gains. Energy Build. 2011, 43, 2011–2020. [Google Scholar] [CrossRef]
  51. Fahmy, M.; Mahdy, M.M.; Nikolopoulou, M. Prediction of future energy consumption reduction using GRC envelope optimization for residential buildings in Egypt. Energy Build. 2014, 70, 186–193. [Google Scholar] [CrossRef]
  52. Heier, J.; Bales, C.; Martin, V. Combining thermal energy storage with buildings—A review. Renew. Sustain. Energy Rev. 2015, 42, 1305–1325. [Google Scholar] [CrossRef]
  53. Hussain, S.I.; Dinesh, R.; Roseline, A.A.; Dhivya, S.; Kalaiselvam, S. Enhanced thermal performance and study the influence of sub cooling on activated carbon dispersed eutectic PCM for cold storage applications. Energy Build. 2017, 143, 17–24. [Google Scholar] [CrossRef]
  54. Ma, Y.T.; Lu, M.Y.; Weng, J.T. Energy Consumption Status and Characteristics Analysis of University Campus Buildings. In Proceedings of the 5th International Conference on Civil Engineering and Transportation 2015, Guangzhou, China, 28–29 November 2015; Atlantis Press: Amsterdam, The Netherlands, 2015. [Google Scholar]
  55. Givoni, B. Climate Considerations in Building and Urban Design; Van Nostrand Reinhold: New York, NY, USA, 1998. [Google Scholar]
  56. World Maps of Köppen-Geiger Climate Classification. Available online: http://koeppen-geiger.vu-wien.ac.at/ (accessed on 19 April 2020).
  57. Climate Data for Cities Worldwide—Climate-Data.Org. Available online: https://en.climate-data.org/ (accessed on 12 May 2019).
  58. Andreou, E.; Axarli, K. Investigation of urban canyon microclimate in traditional and contemporary environment. Experimental investigation and parametric analysis. Renew. Energy 2012, 43, 354–363. [Google Scholar] [CrossRef]
  59. Yang, F.; Qian, F.; Lau, S.S. Urban form and density as indicators for summertime outdoor ventilation potential: A case study on high-rise housing in Shanghai. Build. Environ. 2013, 70, 122–137. [Google Scholar] [CrossRef]
  60. Yahia, M.W.; Johansson, E. Evaluating the behaviour of different thermal indices by investigating various outdoor urban environments in the hot dry city of Damascus, Syria. Int. J. Biometeorol. 2013, 57, 615–630. [Google Scholar] [CrossRef]
  61. Middel, A.; Häb, K.; Brazel, A.J.; Martin, C.A.; Guhathakurta, S. Impact of urban form and design on mid-afternoon microclimate in Phoenix Local Climate Zones. Landsc. Urban Plan. 2014, 122, 16–28. [Google Scholar] [CrossRef]
  62. Mahmoud, H. Effect of Urban Form on Outdoor Thermal Comfort of Governmental Residential Buildings: New Aswan As a Case Study. Egypt. JES. J. Eng. Sci. 2019, 47, 309–325. [Google Scholar] [CrossRef]
  63. Willmott, C.J. On the validation of models. Phys. Geogr. 1981, 2, 184–194. [Google Scholar] [CrossRef]
  64. Rockel, B.; Will, A.; HenAvaise, A. The regional climate model COSMO-CLM (CCLM). Meteorol. Z. 2008, 17, 347–348. [Google Scholar] [CrossRef]
  65. Mahmoud, H.; Ghanem, H. Urban Geometry Mitigation Guidelines to Improve Outdoor Thermal Performance in Egyptian Hot Arid New Cities. JES. J. Eng. Sci. 2019, 47, 172–193. [Google Scholar] [CrossRef]
  66. Bakarman, M.A.; Chang, J.D. The Influence of Height/width Ratio on Urban Heat Island in Hot-arid Climates. Procedia Eng. 2015, 118, 101–108. [Google Scholar] [CrossRef]
Figure 1. The characteristics and dimensions of the studied case study.
Sustainability 13 00027 g001
Figure 2. Aswan University new campus in New Aswan city: (a) Aerial view of New Aswan city, (b) The planned campus for Aswan University in New Aswan city. The location of the case study area is highlighted.
Sustainability 13 00027 g002
Figure 3. Measurement locations at Aswan University new campus: (a) Arial view of part of Aswan University campus in New Aswan city. Measurement points (P1 and P2) and the investigated area [15], (b) The investigated space.
Sustainability 13 00027 g003
Figure 4. Temperature trends for New Aswan from 1981–2050 under RCP 4.5 and RCP 8.5.
Sustainability 13 00027 g004
Figure 5. Simulation cycling with ENVI-met and Design Builder in outdoor–indoor simulations.
Sustainability 13 00027 g005
Figure 6. The hottest area on the New Aswan University campus: (a) Axonometric view for the campus, (b) Thermal distribution map for whole campus. Dashed circle represents the hottest area in the campus.
Sustainability 13 00027 g006aSustainability 13 00027 g006b
Figure 7. Comparison between outdoor thermal performance of the studied area in the present (2018) and those projected for the future (2035) under different climate change scenarios.
Sustainability 13 00027 g007
Figure 8. The effect of proposed mitigation cases on the outdoor thermal comfort of the studied area on New Aswan University campus in the present and following years and scenarios: (a) 2018; (b) 2035 RCP 4.5; (c) 2035 RCP 8.5.
Sustainability 13 00027 g008aSustainability 13 00027 g008b
Figure 9. Average annual energy consumption in the adjacent buildings in the following scenarios: (a) 2018, (b) 2035 RCP 4.5, and (c) 2035 RCP 8.5.
Sustainability 13 00027 g009
Table 1. Thermal perception based on Physiological Equivalent Temperature PET range and grade of physiological stress on human beings in a typical case [36].
PET (°C)Thermal PerceptionGrade of Physiological Stress
<4Very coldExtreme cold stress
4–8ColdStrong cold stress
8–13CoolModerate cold stress
13–18Slightly coolSlight cold stress
18–23ComfortableNo thermal stress
23–29Slightly warmSlight heat stress
29–35WarmModerate heat stress
35–41HotStrong heat stress
>41Very hotExtreme heat stress
Table 2. The average annual energy consumption of several global universities.
United StatesSouth KoreaFinland
Annual average of energy
consumption per m2
490 kWh/m2210 kWh/m2229 kWh/m2
Table 3. Description of proposed urban geometry cases.
AcronymsModelDescription
PC1 Sustainability 13 00027 i001Semi sheltered with 50% distributed shaded roof
PC2 Sustainability 13 00027 i002Semi sheltered with 25% distributed shaded roof
PC3 Sustainability 13 00027 i003Semi sheltered with 75% distributed shaded roof
PC4 Sustainability 13 00027 i004Dividing the outdoor space into a street and two canyons with aspect ratio = 1.5
PC5 Sustainability 13 00027 i005Dividing the outdoor space into a street and two half shaded canyons with aspect ratio = 1.5
PC6 Sustainability 13 00027 i006Dividing the outdoor space into a street and two half shaded canyons with aspect ratio = 1.5 and with green areas added
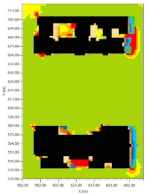
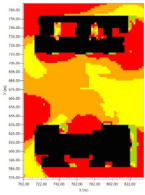
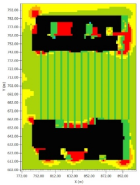
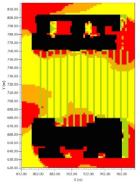
Table 4. Thermal distribution map for the selected area at 2:00 p.m. in 2018 and 2035 (RCP 4.5–RCP 8.5).
Scenarios20182035
RCP 4.5RCP 8.5
Base Sustainability 13 00027 i007 Sustainability 13 00027 i008 Sustainability 13 00027 i009
Sustainability 13 00027 i010
Minimum value = 32.38 °C
Maximum value = 61.73 °C
Minimum value = 49.75 °C
Maximum value = 70.80 °C
Minimum value = 49.49 °C
Maximum value = 70.80 °C
PC1 Sustainability 13 00027 i011 Sustainability 13 00027 i012 Sustainability 13 00027 i013
Sustainability 13 00027 i014
Minimum value = 30.30 °C
Maximum value = 57.20 °C
Minimum value = 49.38 °C
Maximum value = 68.80 °C
Minimum value = 49.13 °C
Maximum value = 68.40 °C
PC2 Sustainability 13 00027 i015 Sustainability 13 00027 i016 Sustainability 13 00027 i017
Sustainability 13 00027 i018
Minimum value = 47.82 °C
Maximum value = 66.00 °C
Minimum value = 49.62 °C
Maximum value = 70.00 °C
Minimum value = 49.38 °C
Maximum value = 69.40 °C
PC3 Sustainability 13 00027 i019 Sustainability 13 00027 i020 Sustainability 13 00027 i021
Sustainability 13 00027 i022
Minimum value = 45.78 °C
Maximum value = 64.60 °C
Minimum value = 49.35 °C
Maximum value = 68.60 °C
Minimum value = 49.10 °C
Maximum value = 68.20 °C
PC4 Sustainability 13 00027 i023 Sustainability 13 00027 i024 Sustainability 13 00027 i025
Sustainability 13 00027 i026
Minimum value = 41.77 °C
Maximum value = 65.65 °C
Minimum value = 42.00 °C
Maximum value = 65.80 °C
Minimum value = 42.89 °C
Maximum value = 66.20 °C
PC5 Sustainability 13 00027 i027 Sustainability 13 00027 i028 Sustainability 13 00027 i029
Sustainability 13 00027 i030
Minimum value = 47.28 °C
Maximum value = 66.00 °C
Minimum value = 47.40 °C
Maximum value = 68.20 °C
Minimum value = 47.64 °C
Maximum value = 68.20 °C
PC6 Sustainability 13 00027 i031 Sustainability 13 00027 i032 Sustainability 13 00027 i033
Sustainability 13 00027 i034
Minimum value = 49.20 °C
Maximum value = 73.60 °C
Minimum value = 49.87 °C
Maximum value = 76.40 °C
Minimum value = 50.14 °C
Maximum value = 77.40 °C
Publisher’s Note: MDPI stays neutral with regard to jurisdictional claims in published maps and institutional affiliations.