Abstract
A smart city describes an urban setting which aims to effectively apply ICT technologies to help improve the well-being of its citizens and reduce the negative impacts of urbanization. The priority areas considered in the Global Smart City Index (SCI) by the Institute for Management Development’s (IMD) World Competitiveness Centre were key infrastructures and technologies in (1) health and safety, (2) mobility, (3) activities (e.g., recreational spaces), (4) opportunities (work and school), and (5) governance. A smart region is a term used to extend the concept of a smart city into both urban and rural settings to promote a sustainable planning approach at the regional level. A direction that must be considered is the adoption of a “Smart Region Mobility Framework” to effectively transform our urban and rural regional transportation networks. This research study focused on the development of the smart region mobility framework for an island region group in the Philippines. The smart region goal is to integrate intelligent transportation system (ITS) platforms such as advanced public transportation system (APTS), advanced traveler information system (ATIS), and advanced rural transportation system (ARTS) to the local public transportation route plans (LPTRP) of the region. The activities include the data collection, analysis, and evaluation of multimodal regional transportation networks and social services infrastructure. The transportation network modeling process follows the four-step transportation planning process of trip generation, trip distribution, modal-split analysis, and trip assignment. Based on the analysis of 6 provinces, 16 cities, and 114 municipalities included in the study, there are two cities identified as smart city candidates. One of the smart city candidates is designated as the smart city regional center. In the context of a smart region, the available social services (e.g., employment opportunities, education, and health services) in the designated smart cities can also be made accessible to connected cities/municipalities through ease of transportation and mobility services in the region. Lastly, the study presented the implementation of data flow architecture of the smart region mobility framework, and the regional traveler information system using mobile and web application services.
1. Introduction
According to the McKinsey Global Institute (MGI), the key drivers in global growth are the emerging economies [1]. There is a wide range of research to identify the factors of sustained high economic growth among emerging economies. These studies analyzed the long-term economic growth patterns of emerging economies, while keeping track of positive outcomes and possible divergences. Outperformer economies develop a pro-growth agenda across private and public sectors with a goal of boosting productivity, income, and demand. To support a pro-growth agenda in emerging economies, mobility of goods and services in primate city and adjacent cities and provinces must be taken into consideration. Improvement in transportation systems does not only rely on building new roads and infrastructures, but also in the effective application of technology [2]. The mobility strategy must meet the ever-growing needs of citizens for innovative mobility services [3]. The growing social demand for traffic efficiency, environmental sustainability, improved safety, and convenience have steered the direction of transportation systems engineering [4]. Additionally, a new paradigm shift for a connected, green, and safe mobility services is becoming a basic requirement for consumer products and services [5].
The World Competitiveness Centre of IMD developed a Global Smart City Index (SCI) [6]. The SCI clearly states the working definition of smart cities: “A smart city describes an urban setting that applies technology to enhance the benefits and diminish the shortcomings of urbanization”. This index is an attempt to capture the various factors affecting the people living and working in the cities and how they perceive their cities are becoming better and smarter. It also recognized that cities have different levels of development, endowments, and opportunities. The priority areas considered in the index revolved in key infrastructures and technologies in (1) health and safety, (2) mobility, (3) activities (e.g., recreational spaces), (4) opportunities (work and school), and (5) governance. Some of the urban developmental strategies must be revisited to promote new ways of developing smart and sustainable urban centers.
In contemporary times, cities have shifted towards the idea of having sustainable spaces. Cities have been pushed towards the use of e-bikes and personal mobility vehicles to lessen negative environmental impacts. According to Tesoriere and Campisi [7], democratic and participatory planning are critical approaches in creating a smart and sustainable city. In this approach, mobility practitioners and experts are encouraged to use a bottom-up or grassroots approach in the implementation of mobilization projects. However, the study presented a case on the limitations of car-sharing service in Sicily (Italy). The study showed that the lack of preventive analysis in transportation demand confirms the need to conduct more studies in the analysis of sustainable spaces. The study of Garau, Masala, and Pinna [8] highlights the benchmarking of smart cities and the sustainable development of transportation systems. A quantitative method using synthetic indicators to evaluate urban mobility is being proposed. The study by Azzari et al. [9] showcased an ongoing project on smart cities governance. The analysis of smart cities governance heavily relies on the idea of smart urbanism. In this study, good governance and smart cities are the result of interactions and decision making from various social actors. Moreover, smart city governance should have a concrete framework in analyzing transportation impact, quality of life of city users, active conservation of cultural and environmental heritage, identification of active protection of city sights, optimizing the use of natural resources (e.g., water), reduction and optimization of energy consumption, and waste management.
The overall goal of the smart region mobility framework initiative is to integrate the ITS platforms such as advanced public transportation system (APTS), advanced traveler information system (ATIS), and advanced rural transportation system (ARTS) to the local public transportation route plans (LPTRP) of the region. The coverage of the study includes 6 provinces, 16 cities, and 114 municipalities. The activities include data collection, analysis, and evaluation of multimodal regional transportation networks and social services infrastructure. The transportation network modeling process follows the four-step transportation planning process namely trip generation, trip distribution, modal-split analysis, and trip assignment. The study investigates the socioeconomic data, existing transportation networks, and mobility services to identify smart city candidates and a smart city regional center. The priority areas in the SCI [6] involved key infrastructures and technologies in health and safety, mobility, recreational spaces, work and school, and governance. This study classified it into two areas: (1) transportation network infrastructure and mobility services, and (2) social services infrastructure. The available social services (e.g., employment opportunities, education, and health services) in the designated smart cities can be made accessible to connected cities/municipalities through ease of transportation and mobility services in the region. This framework aims to promote a shared, equitable, and sustainable growth of the whole region. The mapping of transportation network infrastructures (mobility) and social services infrastructure (health and safety, recreational spaces, work, school, and government) and integrating these data to technology platforms such as mobile and web applications services can improve real-time information demand from consumers and citizens. The data flow architecture and processes of the smart region mobility framework includes data sourcing, data ingesting, data processing, and data visualization. Some case studies that were presented in the study are: (1) a regional traveler information system, and (2) advanced public transportation systems that can monitor passenger demand in real-time.
The proposed framework of this research study is currently being implemented under the “Sustainable Technology-Assisted Route Planning for Region VI (STARPLAN-VI)” project, which is funded by the Department of Science and Technology, Philippine Council for Industry, Energy and Emerging Technology Research and Development (DOST-PCIEERD). It includes the data collection, analysis, and evaluation of multimodal regional transportation networks, as well as social service and government facilities in Region 6 (Western Visayas region of the Philippines). The development of a technology platform that facilitates the integration of intelligent transportation systems for multimodal regional transportation networks (land, sea, and air) together with transportation modeling, and urban/rural public transportation planning are also presented here.
2. Review of Related Literature
2.1. Smart City and Smart Region Concept
A smart city describes an urban setting which aims to effectively apply ICT technologies to help improve the well-being of its citizens and reduce the negative impacts of urbanization [6]. The priority areas considered in evaluating a smart city revolved in key infrastructures and technologies in (1) health and safety, (2) mobility, (3) activities (e.g., recreational spaces), (4) opportunities (work and school), and (5) governance. According to GlobalData [10], the challenges in an urban and smart city setting can be categorized into four basic elements (see Figure 1).
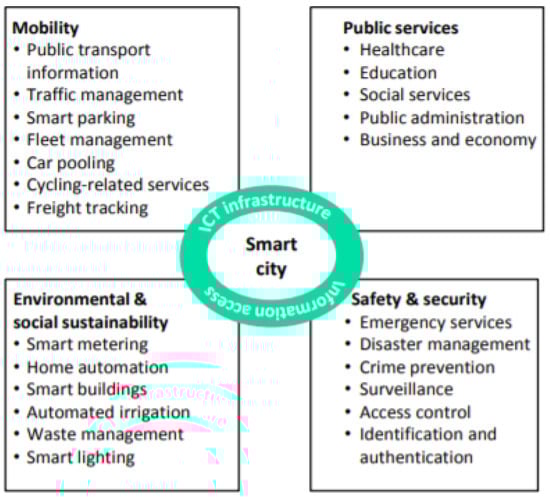
Figure 1.
Four basic elements in a smart city project: mobility, public services, environmental and social sustainability, and safety and security [10].
In the International Telecommunications Union (ITU) classification of smart city projects [10], it categorized smart city projects under three categories (see Figure 2).
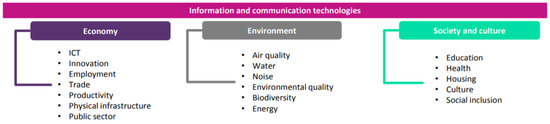
Figure 2.
ITU classification of a smart city project: economy, environment, and society and culture [10].
The competitiveness report of Poland (2018) [11] discussed the promotion of smart cities to help increase the competitiveness of cities and its economy. It described a smart city as having “hard” and “soft” areas, where the “hard” areas include the integration of communication, technology, and infrastructure, while the “soft” area include communities, education, governance, and social capital. Its operational smart city concept includes smart economy, smart governance, smart environment, smart people, smart mobility, and smart living. The study also highlights the role of urban spaces in fostering creativity and innovations, as well as an analysis of smart city projects and its financing in Europe.
In the latest global SCI [6] developed by IMD’s World Competitiveness Centre, it ranked 109 cities according to its ratings system and its components. It includes information such as (1) smart city ranking, (2) group rating, and (3) factor ratings. Each city is assigned to a group which is based on the value of its human development index (HDI). The ratings are calculated based on the performance of a city relative to other cities within the group. The top 10 global smart cities in 2020 is listed in Table 1.

Table 1.
Smart city performance overview, top 10, 2020 [6].
In this study, Manila, Philippines slid to being ranked 104th out of 109 cities in 2020, compared to its previous 94th rank in 2019 (see Figure 3). The figure shows the ranking system developed under the IMD’s SCI [6]. It includes the smart city ranking, group, rating, and factor ratings. The background information presents the HDI of the parent country (economy) of the city. It also includes the population of the city based on the UN World Cities Report for 100 cities, and Eurostat for 9 small European cities [6].
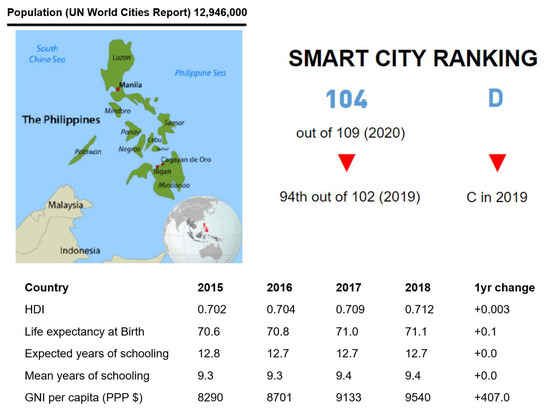
Figure 3.
Smart city index: background information of Manila City, Philippines [6].
The priority areas of a city as perceived by the respondents are shown in Figure 4. The survey respondents were asked to choose 5 out of 15 indicators which they perceived as most urgent or important to address. The methodology is described in the SCI report [6].
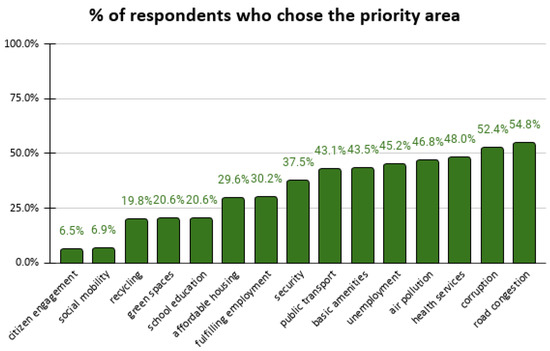
Figure 4.
Smart city index: priority areas [6].
2.1.1. Smart Region
A smart region is a term used to extend the concept of a smart city into both urban and rural settings to promote a sustainable planning approach at the regional level. In the study of Bauer et al. [12], they described the “smart region” in the context of people living in a certain region that applies technology to promote quality of living, and enhance services in the sectors of government, transportation, infrastructure, and economy. In addition to the concepts of smart city and smart region, the study of Sutriadi [13] also included the concept of smart village where the “smart concept” was introduced at various levels.
2.1.2. Smart City Case Studies
Some case studies and smart city projects across the Americas, Europe, Asia-Pacific, and Africa and the Middle East are shown in Table 2.
Table 2.
Example smart city projects and case studies.
2.2. Intelligent Transportation Systems
Advanced transportation systems have become increasingly important to sustain the growth of human society, especially in urban areas [17]. Improvement in transportation systems does not only rely on building new roads and infrastructures, but also in the effective application of technology [4]. An intelligent transportation system is the effective merging of transportation, communication, sensor, and computing technologies integrated into the transportation infrastructure, which can enhance economic productivity, and reduce traffic congestion [18].
In the study of Ezell [4], the author classified ITS into five groups: (1) Advanced Public Transportation Systems (APTS); (2) Advanced Transportation Management Systems (ATMS); (3) Advanced Traveler Information Systems (ATIS); (4) Transportation Pricing Systems; and (5) Vehicle-to-Infrastructure Integration and Vehicle-to-Vehicle Integration, also known as V2X technology. APTS includes real-time information on vehicle location [19], electronic fare payment, and public transit systems. ATMS includes adaptive traffic control signals [20], traffic operations management, ramp metering, and dynamic message signs. ATIS includes parking information systems, navigation systems, traffic route guidance, traffic information systems, weather information systems, and advanced driver assistance systems [21]. Transportation pricing systems involves congestion pricing, automatic toll collection, fee-based express lanes or highways, and variable parking fees. V2X technology includes vehicle-to-infrastructure (V2I) [22], vehicle-to-vehicle (V2V) [23], vehicle-to-roadside (V2R), vehicle-to-control center (V2C), and vehicle-to-nomadic devices (V2X) communications [24]. ICT integration is predicted to become more ubiquitous and embedded such as in in-vehicle integration [22], and automated driver systems [21].
In the study of Mercier and Handisyde [25], the authors classified ITS into four groups: (1) Advanced Public Transportation System (APTS); (2) Advanced Traveler Information System (ATIS); (3) Advanced Vehicle Control and Safety System (AVCSS); (4) and Commercial Vehicle Operation (CVO). Mercier and Handisyde’s APTS and ATIS are like Ezell’s classification. APTS includes the application of ATIS, ATMS, and AVCSS to increase the efficiency and improve the quality of service of public transportation. AVCSS technologies focused on improvement of traffic safety to reduce traffic accidents. It includes driving assistance, lateral and longitudinal control, anti-collision warning and control, and automatic highway systems [19]. CVO utilized technologies such as ATIS, ATMS, and AVCSS to improve road safety and transportation efficiency of commercial vehicle operations (e.g., buses, taxis, trucks, and ambulances). It includes fleet scheduling and management, automatic vehicle monitoring, and electronic payment.
In the study of Kim, Moon, and Suh [4], the authors classified ITS into six major categories: (1) Advanced Public Transportation System (APTS); (2) Advanced Traffic Management System (ATMS); (3) Advanced Travelers Information System (ATIS); (4) Commercial Vehicle Operation (CVO); (5) Advanced Vehicles Control System (AVCS); and (6) Advanced Rural Transportation Systems (ARTS) [26]. ATMS, ATIS, CVO, APTS, and AVCS are already in the literature of Ezell, as well as Mercier and Handisyde. South Korea’s smart mobility concept for 2025, which displays the integration of the six ITS categories, is shown in Figure 5. It also incorporates the sustainable and smart vehicle concept with a goal of being automated, connected, driverless, electrified, shared, and tailored. Big data and cloud technologies also play a big role in the smart mobility framework since a lot of sensing, communication, and control data in both in-vehicle and transportation/traffic infrastructure need to be processed in real time.
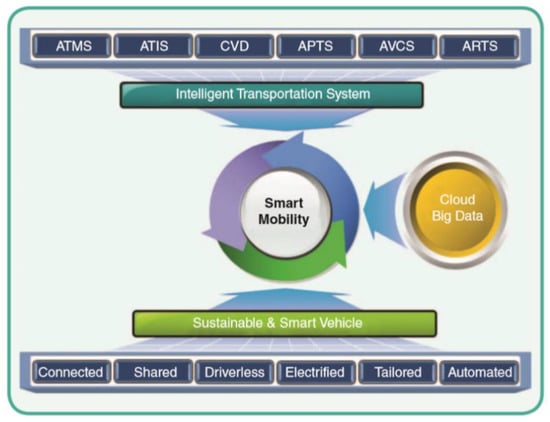
Figure 5.
The concept of smart mobility toward 2025 [4].
The global trends in ITS technology are based on communication technologies designed for efficient, safe, secure, and comfortable delivery of mobility solutions for the transportation sector. The world leaders in ITS implementation are Japan, South Korea, and Singapore. Large scale investments are being undertaken by major developed countries (US, EU, and Japan) as an effort to improve transportation system efficiency and reduce traffic congestion [27].
ITS activities in USA are coordinated by US Department of Transportation—Research and Innovation Agency (US DOT-RITA). The focus of their ITS strategic research plan is on the concept of “connected vehicles” [28]. The connectivity program is expected to considerably reduce traffic accidents by providing enhanced driving environments.
The EU’s “i2020” intelligent car initiative, which started in 2005, aims to promote safe and intelligent mobility system. It also initiated the autonomous vehicles project, safe road trains for the environment (SARTRE) [29], and, in September 2012, succeeded in autonomous vehicle platooning at a speed of 90 km/h. Other initiatives include the cooperative vehicle infrastructure system (CVIS), and cooperative systems for intelligent road safety (Coopers) [30].
The main objectives of Japan’s ITS program, which was organized in 2011, are to reduce traffic congestion by 50% by 2020 in comparison with current levels and reduce deaths due to traffic accidents to less than 2500, which is 50% of the deaths in 2010. The development of traffic safety technology through the implementation of V2X technology is demonstrated in the “advanced safety vehicle” (ASV) project [31]. Communication between vehicles and RSE are implemented by V2I technology and adaptive cruise control (ACC). The project achieved a reduction in traffic congestion using the Yamamoto highway as a testbed in 2011. The development of a new traffic control system for the Shin Tomei Expressway is also highlighted [32]. Its key features are: (1) big data high speed processing up to the minute information, which can handle approximately 5 times the usual information volume processed by existing systems; (2) emergency backup systems; and (3) highly reliable, high-speed communications networks.
South Korea’s smart mobility concept strategic plan is designed for future transportation systems [4]. It focuses on eliminating urban traffic congestion, and significantly reducing road traffic accidents. The smart mobility concept strategic plan is categorized into two major groups: (1) Transportation System Operation Technology (TSOT); and (2) Vehicle Driving Control Technology (VDCT).
In March 2015, the ITS Philippines organization was created with the aim of connecting the private and public sector together with practitioners, researchers, and academicians related to ITS [27]. The overall goal of the ITS initiative is the reduction of traffic congestion; promotion of safe and comfortable travel; and improvement of the environment [33]. The Mega Manila ITS master plan is developed through the assistance of Japan International Cooperation Agency (JICA) [27]. The nine areas of deployment for Philippines ITS is patterned with Japan ITS: (1) Advances in Navigation; (2) Support for Pedestrians; (3) Increased Efficiency in CVO; (4) Optimization of Traffic Management; (5) Assistance for Safe Driving; (6) Electronic Toll Collection Systems; (7) Support for Emergency Vehicle Operations; (8) Increased Efficiency in Road Management; and (9) Support for Public Transportation. The major transportation problems in Metro and Mega Manila are shown in Figure 6, as well as how the ITS goals can help address these problems.
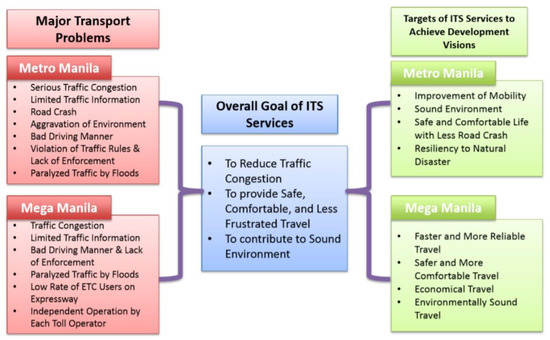
Figure 6.
ITS goals and services [27].
ITS evaluation methods [24] must have an appropriate framework to integrate it into existing transportation planning methodology [34]. The three actor groups [24] that determine the dynamics of ITS implementation [35] are shown in Figure 7. The first group is road users, which initiate consumer demand through acceptance of services. They are also a determinant on the impacts of ITS technologies in the society. The second group is the authorities, such as legal enforcement agencies, regulatory, and standard bodies. Their goal is to promote the welfare of the users and review the overall impact of such systems in the society (users and non-users). They also make sure that the policy created are within legal boundaries. They also have the responsibility to properly inform other stakeholders in the adoption and new legislation pertaining to ITS. Additionally, they may provide funding and possibly tax incentives to the involved industries and sectors. The goal is to encourage these stakeholders for fast adoption and promote growth of the industry. The third group is the vehicle and system manufacturers, which possessed knowledge and technological competence on the proposed systems. This group provides the needed technological push to grow the industry based on market demand.
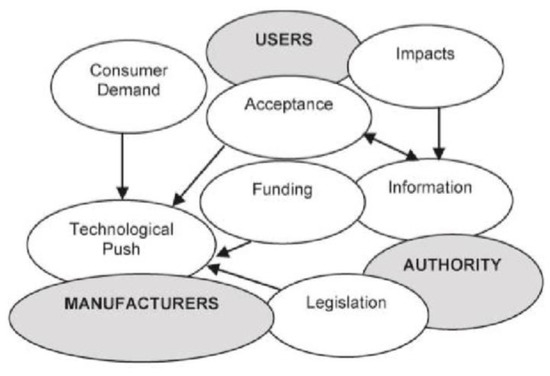
Figure 7.
Actors affecting ITS implementation [24].
2.3. Mobility-as-a-Service (MaaS)
The Mobility-as-a-Service (MaaS) concept refers to a new type of business model that caters to mobility or transportation services [36]. It has four main features which include (1) humanism, (2) integration, (3) low-carbon, and (4) sharing [37]. MaaS applies to both public and private transportation which may include bikes, buses, cars, trains, etc. It also highlights the need to drive sustainable mobility by giving emphasis on transportation with zero-carbon (e.g., bikes), and low-carbon emissions such as electric vehicles. Moreover, the MaaS direction points towards shorter routes, and more flexible transportation modes such as point-to-point transportation systems. The MaaS platform has several components that are needed to run its operations. It includes the transportation service providers, data service providers or ICT infrastructure, MaaS applications and platform operators, and government regulatory bodies. Some of the MaaS application services may include bike-sharing, booking and payment, car-pooling, car-rental, car-sharing, electronic/mobile payments, food delivery, logistics, map and navigation applications, package delivery, ride hailing, travel information, etc.
3. Methodology
The research methodology of the smart region mobility framework is presented in Figure 8. The data gathering and analysis activities require the socioeconomic data, coverage map and inventory of public transportation systems in the region, home interview surveys, and data needs for technology development. These data are used to determine the smart city candidates and smart city regional center. The transportation network modeling involves the use of the four-step transportation planning. This process is also used for the development of the local public transportation route planning of local government units (LGUs) in the region. The mobility framework also includes the development of ITS technology platforms that will be integrated to the transportation infrastructure in the region. These activities are funded and supported by the Department of Science and Technology Philippines through the Sustainable Technology-Assisted Route Planning for Region VI (STARPLAN-VI) project. The application and integration of all these components are needed for the envisioned smart region.
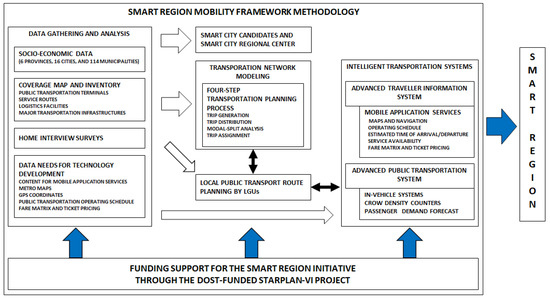
Figure 8.
Research methodology for the smart region mobility framework.
3.1. The Study Area
The study area for the implementation of the “Smart Region Mobility Framework” is in Region 6, Philippines which is also called the Western Visayas region. It is an island group composed of six provinces (Aklan, Antique, Capiz, Guimaras, Iloilo, and Negros Occidental), 16 cities, and 117 municipalities. A multimodal public transportation network (land, sea, and air transportation) is considered in the proposed framework. The map of the study area shows the four types of movement (internal, entering, exiting, and passing through) of people and goods across the region which could vary in time and space (see Figure 9).
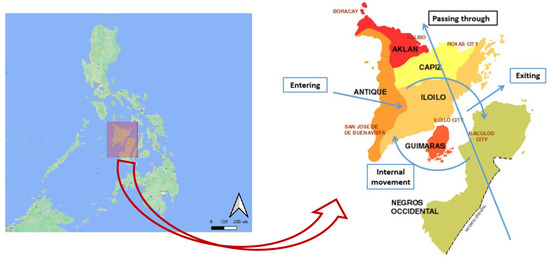
Figure 9.
A map of the Region 6 area of the Philippines.
3.1.1. Gathering Background Information
The information collected per province/city/municipality include the demographics and socioeconomic data. It includes population, income level, labor participation, employment/unemployment rates, and household travel characteristics. Data on the availability of social service infrastructures such as schools, hospitals, churches, markets, malls, hotels, and municipal/city halls, as well as recreational facilities and tourist spots are also included in data collection, analysis, and evaluation.
3.1.2. Coverage Map and Inventory of Public Transportation Terminals, Service Routes, and Other Logistics Facilities
The coverage map includes the existing land and sea transportation systems across the region. It includes the public transportation terminals, seaports/wharfs, airports, and the corresponding service routes. Other logistic facilities such as courier services, as well as registered public transportation operators, are also included.
3.1.3. Major Road Transportation Infrastructures
A list of major road transportation infrastructures (existing, under construction, and planned) in the region is also included in data collection, analysis, and evaluation.
3.2. Sustainable Technology-Assisted Route Planning for Region VI (STARPLAN-VI)
The research framework supports the development of a sustainable local public transportation route plan that integrates road and maritime transportation network of the region. The development and integration of advanced transportation technologies aims to contribute to the over-all improvement on the transportation of people, goods, and services within (internal movement) and outside the region. This research study demonstrates the integration of all the public utility vehicles (PUVs) route plans in the regional level to help sustain the implementation of the 2018 Local Public Transportation Route Plan (LPTRP) of the National Government. This framework is also aligned with the direction being pursued by the Department of Transportation (DOTr) to fully integrate all road- and sea-based transportation system including airport passenger arrivals and departures. The research also involves both the local government and local universities in the region by providing them trainings and workshops including the development of transportation manuals, and monitoring and evaluation guidelines for the long-term sustainability of the project. The research framework of STARPLAN-VI project is shown in Figure 10.
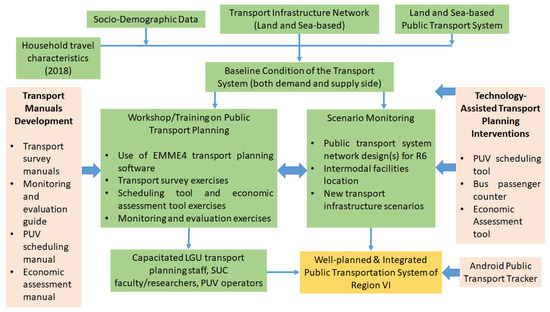
Figure 10.
The research framework of the Sustainable Technology-Assisted Route Planning for Region VI (STARPLAN-VI).
3.3. Smart Region Mobility Framework
A smart region is a network of smart cities, and other adjacent cities and municipalities connect by major urban transportation networks, as well as rural transportation networks. In the proposed framework, it has a combination of both advanced public transportation systems (APTS) [4] and advanced rural transportation systems (ARTS). A candidate smart city (e.g., smart cities 1, 2, 3, and 4) is connected by major urban transportation networks. Among the smart cities in a region, one city can be designated as the regional center. The regional center is the leading or primate city (highly urbanized, and high population density) of the region. The number of regional center/s can be dependent on the size of the region. It means that it is possible to have more than one regional center. To promote growth of the whole region, smart cities are also connected to other cities, towns, and municipalities via urban or rural transportation networks. The proposed smart region mobility framework is shown in Figure 11.
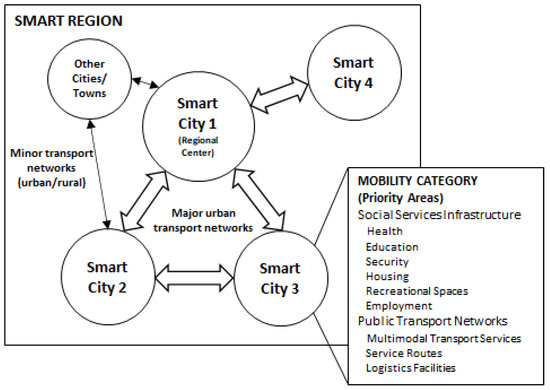
Figure 11.
Smart region mobility framework.
The priority areas in the smart mobility category include the development of social services infrastructure, and public transportation networks. Social services infrastructure includes health facilities (e.g., hospitals, and clinics), public/private education (e.g., elementary, secondary, and tertiary education, security (e.g., police stations), housing, recreational spaces (e.g., malls, hotels and restaurants, and tourist spots), and utility facilities (e.g., telecommunications, water, and energy). The public transportation networks include multimodal transportation services (land, air, and sea-based transportation) and their corresponding service routes. Logistics facilities may include courier services, delivery services, freight forwarding services, logistics services/companies, shipping company, shipping services, transportation services, trucking companies, and travel services. Another element in a smart region mobility framework is the availability and accessibility to employment opportunities. A smart city/region must cater to the mobility needs of the people and businesses.
3.4. Data Flow Architecture for the Smart Region Mobility Framework
A characteristic of a smart city/region is the effective application of advanced technologies for transportation and mobility. The data flow architecture for the smart region mobility framework is shown in Figure 12. It includes four main components: (1) data sources, (2) data ingest layer, (3) data warehouse, and (4) visualization or application services.
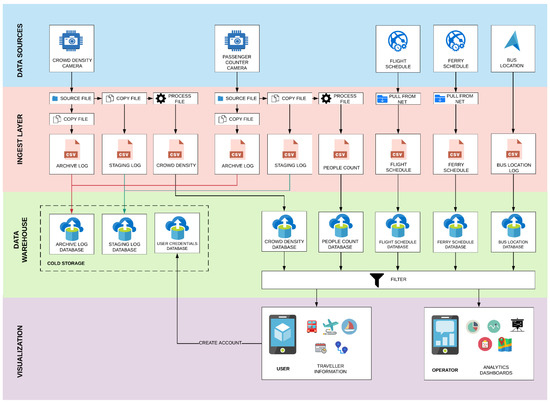
Figure 12.
Data flow architecture for the smart region mobility framework.
3.4.1. Data Sources
The primary data sources include the crowd density in each bus stop, number of passengers inside the bus, the GPS location of the buses and other land-based public transportation vehicles, and real-time ferry and flight schedules. Crowd density counters are deployed in bus stations and bus stops to estimate the density of the commuters waiting for the public transportation, while passenger counters are installed in public transportation vehicles to count the number of alighting and boarding passengers. GPS-based tracking systems provide the real-time tracking of public transportation vehicles. Public transportation fleet operators can use these data to optimally dispatch their vehicles, and to effectively manage the service routes. Real-time ferry and flight schedule are pulled from the Internet sources.
Crowd Density Estimation
The proposed process of the crowd estimation system in public transportation vehicles and stations is shown in Figure 13. It shows the relationship between the system, and its users (operators and passengers). Public transportation fleet operators can improve operation and service reliability by determining the passenger footprint in terminals/stations and inside public transportation vehicles. This will also improve passenger experience through improved travel time and availability of public transportation vehicles.
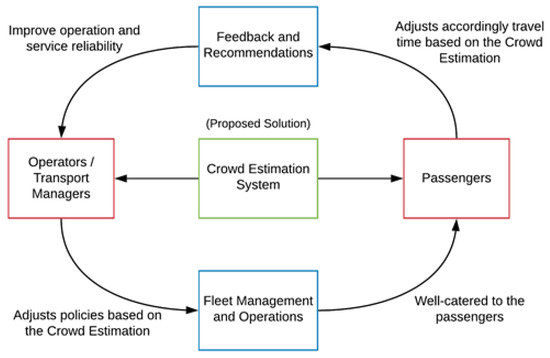
Figure 13.
Crowd estimation system.
Passenger Demand Forecast Using Crowd Density Estimation
The average number of boarding and alighting passengers in a public transportation terminal and stops can be defined as the passenger demand forecast [38]. Dwell time calculations for each public transportation vehicle can be estimated using the demand forecast. Sensor-based and/or vision-based systems [39] installed in public transportation vehicles and stations can be used to determine the demand forecast. Machine learning and computer vision technology can be used to develop the vision-based systems for people counting and crowd density estimation [40].
Boarding and Alighting Passenger Frequency
The demand forecast can be measured using the passengers per minute. It can be calculated by getting the difference of boarding and alighting passengers. The value of passenger frequency (e.g., low, moderate, or high) depends on the capacity of the transportation vehicle. Typically, the maximum allowable passenger load for a bus is 125% [41]. For example, a bus with a capacity of 60 with 25% standees has a total passenger capacity of 75. Equations (1)–(4) show the calculations to determine passenger frequency.
Using Equation (1), a total capacity of 75 (maximum allowable load is 125% of capacity) has a low passenger frequency of approximately 0.42. Using Equations (2) and (3), the moderate and high passenger frequency values are 0.63 and 1.25, respectively. The passenger frequency can be represented by the formula below.
Boarding/Alighting Time Calculation
Boarding and alighting time calculations are given in Equations (5) and (6). The sample values for TBoarding and TAlighting are shown in Table 3.
Table 3.
Sample values for TBoarding and TAlighting [42].
Load Factor
The maximum capacity of bus with 25% standing passengers is called the allowable bus load capacity. The load factor (LFac) can be calculated using Equations (7) and (8).
3.4.2. Data Ingest Layer
The data ingest layer processes incoming data streams from data sources, and routes it to their corresponding databases for storage and/or immediate use. It is the interface between data sources and data processing systems.
3.4.3. Data Warehouse
The data warehouse is composed of several databases (one for each data source). After data ingestion, each data source is stored in their corresponding database. The entire data warehouse is integrated to a cloud service platform.
3.4.4. Data Visualization (Application Services)
The data on travel and mode of transportation information can be accessed through web and mobile services. Passenger services include availability of mode of transportation, ticket prices, routes, maps, estimated time of arrival/departure, and operating schedule. Fleet operator services include tracking of public transportation fleet (land- and/or sea-based transportation), passenger demand, actual number of passengers onboard, resource utility, and fleet efficiency.
4. Results and Discussion
4.1. Demographics and Socioeconomic Data
The summary numbers of the area of study (Region 6—Western Visayas, Philippines) is listed in Table 4. It includes the total number of cities, municipalities, number of families, average income, labor participation rate, employment rate, and unemployment rate. The data was taken from the year 2018 [43]. There is high employment rate of 94.7% for a region with a 61.2% labor participation rate.
Table 4.
Summary data of Region 6, Philippines (as of the year 2018) [43].
In the smart city concept [6], people’s perspective on the opportunities and quality of work is essential for the well-being of the citizens. In the ITU classification of smart cities [10], the employment element is included under the economy category. The data on average annual income, labor participation rate, and employment/unemployment rates are some indicators that can be used to measure the readiness of a particular smart city/region.
4.2. Social Services Infrastructure Data
Another key aspect in a smart city/region framework is the quality of social services infrastructure. It includes schools, hospitals, public markets, municipal halls, police stations, and churches. Recreational places [6] such as malls, hotels and restaurants, and tourist destinations can also be included. In the ITU classification [10], the education, health, culture, and social inclusion is under the social and culture category. The relevant proximity and accessibility of such social infrastructures can help improve the satisfaction of people living in the local community, as well as tourists. The summary data on social services infrastructure for education, health, and public services is listed in Table 5. The summary data on social services for rest and recreation is listed in Table 6. These lists of social service infrastructure may need to be verified in the field once it is already safe to travel in the region due to the pandemic.
Table 5.
Summary data on social services infrastructure in the region (education, health, and public services) (as of the year 2020, gathered through Google maps).
Table 6.
Summary data on social services infrastructure in the region (rest and recreational services) (as of the year 2020, gathered through Google maps).
The data visualization of availability and accessibility of social services infrastructure in the region is shown in Figure 14. It should be noted that some provinces in the region have relatively low quantity of such services. In the smart region mobility framework, this disparity in the availability of social services can be addressed when there is improved mobility of people across cities, municipalities, and provinces. Equitable education, health, and public services can be achieved with increased mobility of goods, services, and people.
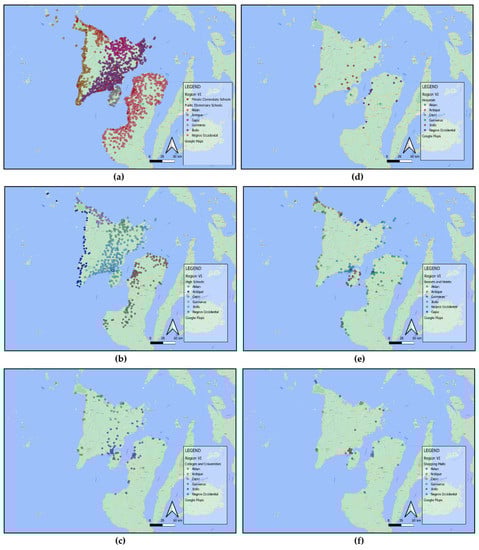
Figure 14.
Data visualization of the inventory list of social services infrastructures in the region: (a) primary education (elementary) schools, (b) secondary education (high) schools, (c) tertiary education (university/colleges) schools, (d) hospitals, (e) hotels and restaurants, and (f) tourist spots.
4.3. Coverage Map and Inventory of Public Transportation Terminals, Service Routes, and Other Logistics Facilities
The mobility aspect of a smart region framework deals with the transportation planning, modeling, analysis, evaluation, and implementation in a regional level. The main goal of the mobility criterion is the accessibility and ease in the transportation of goods, services, and people. The first step in this process is coverage mapping and inventory listing of transportation and logistics facilities (private/public). The summary data of multimodal transportation terminals and routes in the region is listed in Table 7. It includes the number of airports, seaports, riverports, wharfs, land-based transportation terminals, multimodal hubs, and other logistics facilities.
Table 7.
Summary of multimodal transportation terminals and routes (land, air, and sea) in Region VI, Philippines (as of the year 2020).
Logistics facilities and services considered here are courier services (private/government), delivery services, freight forwarding services, logistics services/companies (private/government), ports, shipping company, shipping services, transit stations, transportation services, trucking companies, and travel services.
4.4. Smart Region, Smart City Candidates, Smart City Regional Center
The study area is Region 6 or Western Visayas region of the Philippines. It has two (2) highly urbanized city centers (Iloilo and Bacolod cities), where Iloilo city is the regional center. There is a total of 16 cities and 117 municipalities in the region. The smart city candidates are the two highly urbanized centers, and smart city regional center candidate is Iloilo city (see Table 8).
Table 8.
Smart city candidates, smart city (regional center) candidate, and other cities/municipalities.
The smart city regional center, smart city candidate, and other cities/municipalities are connected by regional transportation networks (see Figure 15). The benefits of a smart city such as quality living with availability and ease of access to basic and social services (e.g., health, education, housing, and recreational spaces) can be fully realized with efficient transportation systems. In the context of a smart region, the available services (e.g., employment opportunities, education, and health services) in the designated smart cities can also be made accessible to connected cities/municipalities through ease of transportation services. The characteristic of the proposed smart region is the integration of advanced mobility services and intelligent transportation systems such as ATIS, APTS, and ARTS to local public transportation route plans of the region.
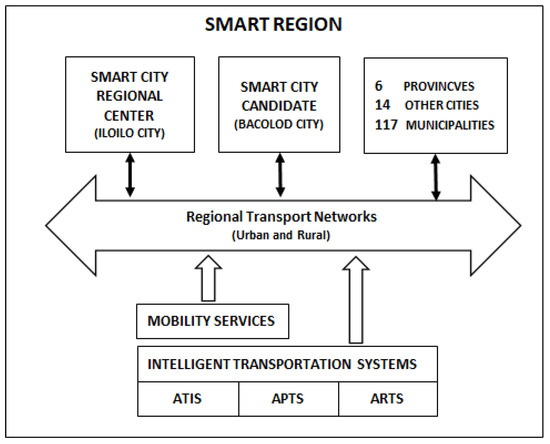
Figure 15.
Smart city regional center, smart city, and connected provinces, cities, municipalities.
The main economic drivers in the study region are in agriculture and tourism. In the report for regional economic development in the Philippines [44], it highlighted some investments and technologies in the region under the mobility category.
- The use of mobile application in managing agricultural products (crop schedule, production, and marketing);
- Development of efficient and comfortable mass transportation systems;
- Upgrading and expansion of existing airports and seaports in the region;
- Upgrading and expansion of highways and bridges in the region;
- Development of eco-cultural tourism hub, and tourism complex which includes hotels, parks, and commercial centers;
- Development of recreational centers, hospitals, and BPO offices;
- Proposal to open a direct flight from Iloilo to Guam, USA;
- Development of farm-to-market roads to allow a faster and cost-efficient to transportation agricultural goods.
4.5. Transportation Network Modeling
The regional transportation network model has network size parameters of 9 modes, 350 centroids, 7875 regular nodes, 18,523 directional links, 7 transit vehicle types, 564 transit lines, 3936 transit line segments, and 196 turn table entries. The regional transportation network model is shown in Figure 16, while the transportation network model for each of the province is shown in Figure 17.
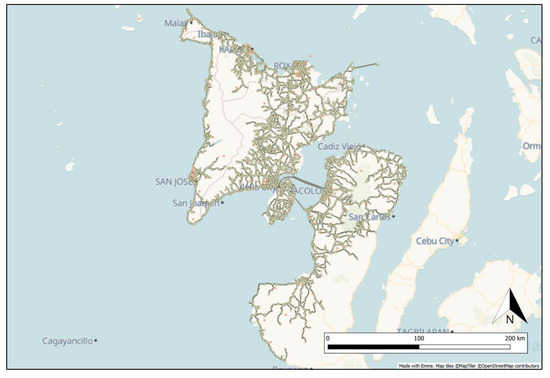
Figure 16.
Transportation network model for the region.
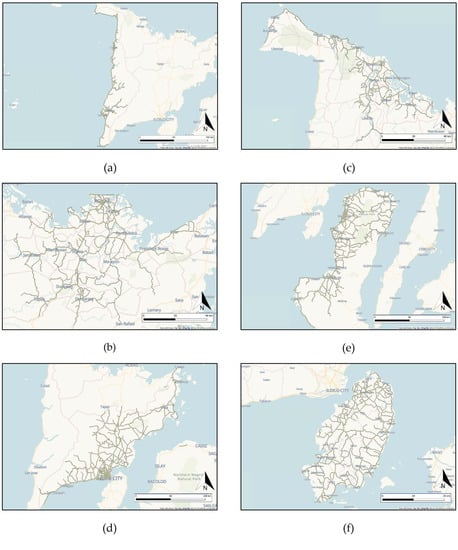
Figure 17.
Transportation network model for each province in the region: (a) Antique, (b) Capiz, (c) Aklan, (d) Iloilo, (e) Negros Occidental, and (f) Guimaras.
The region data such as passenger trips, passenger flow, and origin–destination trips are also simulated in the regional transportation network model. The sample simulation of passenger trips for Figure 18a Iloilo and Figure 18b Guimaras provinces is shown in Figure 18. The passenger flow and origin–destination trips from home interview surveys are shown in Figure 19 and Figure 20, respectively.
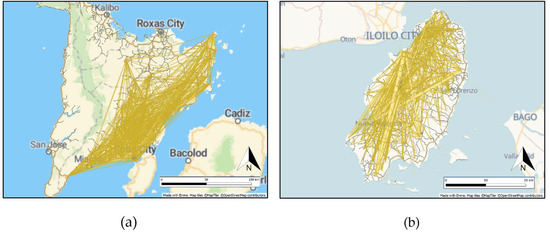
Figure 18.
Passenger trips: (a) Iloilo and (b) Guimaras.
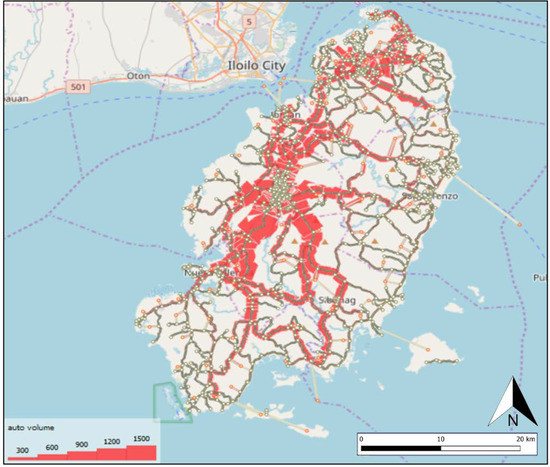
Figure 19.
Passenger flow in Guimaras province [45].
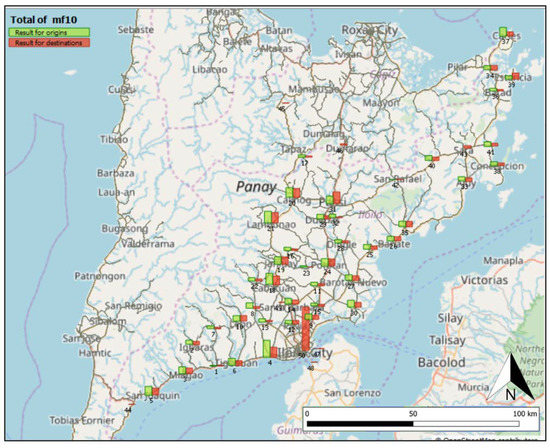
Figure 20.
Origin–destination trips.
It should be noted that this research on the smart region concept is an ongoing study, and the transportation network modeling is not yet complete since the data processing and analysis of passenger demand data obtained from the home interview surveys (HIS) at around 5% of the household population as well as roadside interview surveys along major corridors are still being processed in some of the provinces and cities. The EMME4 multimodal transportation planning software is used in the modeling process that follows the four-step transportation planning process of trip generation, trip distribution, modal-split analysis, and trip assignment. From the HIS surveys, trip generation models at the household level are developed relating trip rates to the socioeconomic characteristics of the households including income, vehicle ownership, household size, among others. Origin–destination (OD) of trips were also obtained from the HIS survey including the transportation modes used. Once all the transportation surveys are completed in the whole region, the trip movement on the network which are split into those using private vehicles and those who use the public transportation system can be modeled. The smart region concept can then be applied on how to improve regional travel in the study area.
4.6. A Case Study and Implementation of Advanced Traveler Information System (ATIS) and Advanced Public Transportation Systems (APTS) in the Region
Advanced Traveler Information System (ATIS) is one of the key development areas in Intelligent Transportation Systems (ITS). ATIS includes real-time traffic information systems, traffic route guidance and navigation systems, parking information systems, and roadside weather information systems. Another development area in ITS is the Advanced Public Transportation Systems (APTS). APTS includes real-time information on vehicle location, public transit systems, and electronic fare payment. This research study is aimed at the development of an integrated ATIS for land, sea, and air transportation. It will provide route guidance and real-time information to passengers for better decision-making regarding mode of travel, planned routes, and travel times. It will use edge devices deployed in public transportation vehicles, cloud-based information processing and storage system, and mobile application for information access.
4.6.1. Crowd Density Counters
Crowd density counters are deployed in bus stations and bus stops to estimate the density of the commuters waiting for the public transportation, while passenger counters are installed in public transportation vehicles to count the number of boarding and alighting passengers. An example of crowd density counters using video-based systems is shown in Figure 21.
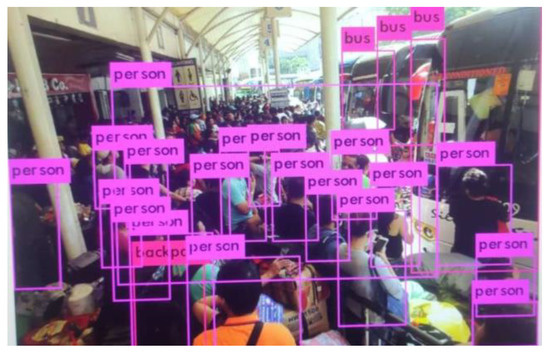
Figure 21.
Vision-based crowd density counters.
4.6.2. Mobile Application for Traveler Information
The data on travel and mode of transportation information can be accessed through mobile application services. Passenger services include availability of mode of transportation, ticket prices, routes, maps, estimated time of arrival/departure, and operating schedule.
The screen view of the traveler information mobile application services is shown in Figure 22. GPS-based tracking systems provide the real-time tracking of public transportation vehicles. Real-time ferry and flight schedule are some of the features of the mobile application services (see Figure 23).
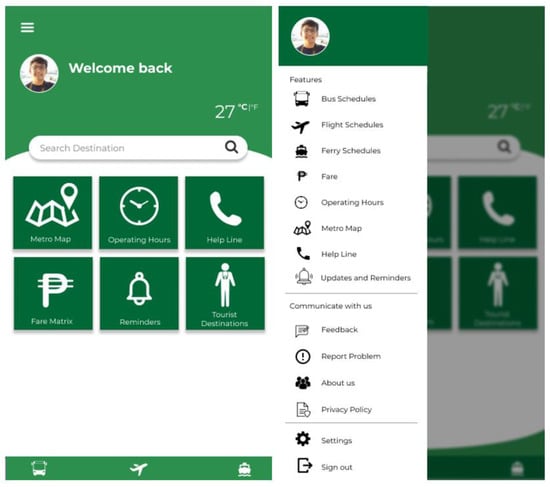
Figure 22.
Traveler information system mobile application services.
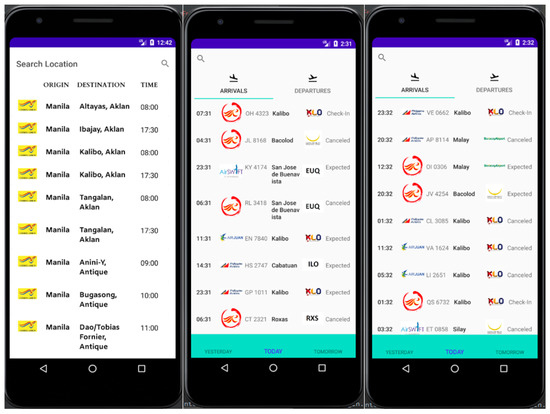
Figure 23.
Real-time flight schedule in and out of the region.
5. Conclusions
The smart region concept is an extension of the smart city studies. It is a network of smart cities, and other adjacent cities and municipalities connected by major urban transportation networks, as well as rural transportation networks. A smart city regional center is the leading city in a smart region. Depending on the size of the region (size in terms of population or land area), there can be more than one regional center in a smart region. In this study, the proposed smart region is composed of one smart city regional center (Iloilo city), another candidate smart city (Bacolod city), and a network of 6 provinces, other 14 cities, and 117 municipalities connected by a regional transportation network. Since the study area is an island region, multimodal transportation network (land-, air-, and sea-based transportation) are considered here. The entry and exit points in the region, as well as internal movement of people, goods, and services, are also considered in the transportation modeling process.
The smart city/region concept can be categorized in terms of mobility, public services, environmental and social sustainability, and safety and security. In the ITU classification of smart cities, the elements or categories are economy, environment, and society and culture. While the IMD’s classification of smart cities takes into consideration five priority areas of health and safety, mobility, activities (such as recreational spaces), opportunities, and governance. It can be shown that even though there are categories or focus areas on a smart city, the different categories have overlapping or connected functions and benefits. This study focused on the mobility category of a smart city. The smart region mobility framework deals with the transportation planning, modeling, analysis, evaluation, and implementation in the regional level. It includes priority areas for the development of social services infrastructure, and public transportation networks. The social services infrastructure includes facilities for health, education, housing, recreational spaces, and utilities. The public transportation networks include multimodal transportation services, service routes, and logistics facilities. The goal of the mobility framework is to connect the citizens to the basic amenities, social services, and employment opportunities by having an efficient and accessible public transportation networks. The relevant proximity and accessibility of such social infrastructures can help improve the satisfaction of people living in the local community, as well as tourists. In the context of a smart region, the available services (e.g., employment opportunities, education, and health services, among others) in the designated smart cities can also be made accessible to connected cities/municipalities by promoting ease of mobility of goods, services, and people across provinces, cities, and municipalities in that region.
Lastly, the application and implementation of advanced transportation technologies can help in regional and urban mobility. An Advanced Traveler Information System (ATIS) was presented here. It involves the use of crowd density and passenger monitoring systems for keeping track of boarding and alighting passengers. It also includes real-time public transportation fleet monitoring, route guidance, and navigation systems. The traveler information system is made available using mobile application services.
In the succeeding research work direction, the network effects of smart cities in regional urban and rural development will be considered. For example, under this smart region framework, when all the transportation service supply and passenger demand data are gathered and analyzed suing the EMME 4 transportation planning software, the impact assessment of proposed major transportation infrastructure projects in the region can be developed, especially in addressing the problems of poverty, unemployment, and transportation inequity. By the end of this 2-year study, we would be able to compare the impact of the current regional transportation system to the smart region transportation system being advocated by this research study.
Author Contributions
Conceptualization, R.K.C.B. and A.M.F.; methodology, R.K.C.B. and M.A.G.; software, K.C.L. and M.A.G.; validation, R.K.C.B., A.M.F., E.P.D., and M.D.E.; formal analysis, R.K.C.B. and K.C.L.; investigation, R.K.C.B., A.M.F., E.P.D., and M.D.E.; resources, A.M.F.; data curation, R.K.C.B., K.C.L., and A.M.F.; writing—original draft preparation, R.K.C.B.; writing—review and editing, R.K.C.B., M.A.G., K.C.L., M.D.E., and A.M.F.; visualization, R.K.C.B., K.C.L., and M.A.G.; supervision, A.M.F., E.P.D., and R.K.C.B.; project administration, A.M.F. and R.K.C.B.; funding acquisition, A.M.F. All authors have read and agreed to the published version of the manuscript.
Funding
This research was funded by Department of Science and Technology—Philippine Council for Industry, Energy and Emerging Technology Research and Development (DOST-PCIEERD), grant number GCOE CESDR 07 L 2TAY19-1TAY20; and De La Salle University—University Research Council Office (DLSU-URCO), grant number 20 IR S 3TAY19-3TAY20. The APC was funded by DOST-PCIEERD.
Institutional Review Board Statement
Not applicable.
Informed Consent Statement
Not applicable.
Data Availability Statement
The data on smart city index can be found in https://www.imd.org/smart-city-observatory/smart-city-index/ Accessed on (2 June 2021); and the data on regional economic development in the Philippines can be found in https://www.bsp.gov.ph/Media_And_Research/Report%20on%20Regional%20Economic%20Developments/REDP_2018.pdf Accessed on (2 June 2021).
Acknowledgments
The authors highly appreciate the Center for Engineering and Sustainable Development Research (CESDR) and Gokongwei College of Engineering (GCOE) for the material and technical support, and for providing an avenue for the researchers in the conduct of this research study.
Conflicts of Interest
The authors declare no conflict of interest.
References
- McKinsey Global Institute. Outperformers: High-Growth Emerging Economies and the Companies that Propel Them; MGI: Washington, DC, USA, 2018; pp. 1–168. [Google Scholar]
- Ezell, S. Intelligent Transportation System; Information Technology and Innovation Foundation: Washington, DC, USA, 2010. [Google Scholar]
- European Commission. Communication from the Commission to the European Parliament, the Council, the European Economic and Social Committee and the Committee of the Regions; European Union: Brussels, Belgium, 2013. [Google Scholar]
- Kim, J.; Moon, Y.-J.; Suh, I.-S. Smart Mobility Strategy in Korea on Sustainability, Safety and Efficiency toward 2025. IEEE Intell. Transp. Syst. Mag. 2015, 7, 58–67. [Google Scholar] [CrossRef]
- Brown, A. Connectivity and the Mobility Industry; Warrendale, P.A., Ed.; SAE International: Warrendale, PA, USA, 2011; pp. 113–259. [Google Scholar]
- IMD World Competitiveness Centre. Smart City Index 2020. pp. 1–124. Available online: https://www.imd.org/smart-city-observatory/smart-city-index/ (accessed on 2 June 2021).
- Tesoriere, G.; Campisi, T. The Benefit of Engage the “Crowd” Encouraging a Bottom-up Approach for Shared Mobility Rating. In Proceedings of the International Conference on Computational Science and Its Applications, Cagliari, Italy, 1–4 July 2020; pp. 836–850. [Google Scholar]
- Garau, C.; Masala, F.; Pinna, F. Benchmarking smart urban mobility: A study on Italian cities. In Proceedings of the International Conference on Computational Science and Its Applications, Banff, AB, Canada, 22–25 June 2015; pp. 612–623. [Google Scholar]
- Azzari, M.; Garau, C.; Nesi, P.; Paolucci, M.; Zamperlin, P. Smart city governance strategies to better move towards a smart urbanism. In Proceedings of the International Conference on Computational Science and Its Applications, Melbourne, Australia, 2–5 July 2018; pp. 639–653. [Google Scholar]
- GlobalData. Smart Cities in the Americas: Regional Status & Key Case Studies; Americas Insider Report; GlobalData Plc: London, UK, 2019; pp. 1–24. [Google Scholar]
- World Economy Research Institute: SGH Warsaw School of Economics. The Role of Cities in Creating Competitive Advantages; Poland Competitiveness Report 2018; SGH Publishing House: Warsaw, Poland, 2018; Chapters 13–15; pp. 219–254. [Google Scholar]
- Bauer, M.; Helbig, D.; Mokhov, V.; Eltsova, M. Smart Region concept as a solution for sustainable development for region with a rural and urban character. J. Phys. Conf. Ser. 2019, 1415, 012018. [Google Scholar] [CrossRef]
- Sutriadi, R. Defining smart city, smart region, smart village, and technopolis as an innovative concept in indonesia’s urban and regional development themes to reach sustainability. IOP Conf. Ser. Earth Environ. Sci. 2018, 202, 012047. [Google Scholar] [CrossRef]
- GlobalData. Smart Cities in Europe: Regional Status & Key Case Studies; Europe Insider Report; GlobalData Plc: London, UK, 2019; pp. 1–24. [Google Scholar]
- GlobalData. Smart Cities in Asia-Pacific: Regional Status & Key Case Studies; Asia-Pacific Insider Report; GlobalData Plc: London, UK, 2019; pp. 1–24. [Google Scholar]
- GlobalData. Smart Cities in Africa and the Middle East: Regional Status & Key Case Studies; Europe Insider Report; GlobalData Plc: London, UK, 2019; pp. 1–24. [Google Scholar]
- Lecce, V.D.; Amato, A. A Distributed Measurement System for Smart Monitoring of Vehicle Activities. In Proceedings of the 2010 IEEE Instrumentation & Measurement Technology Conference Proceedings, Austin, TX, USA, 3–6 May 2010; pp. 1–5. [Google Scholar]
- Giesecke, R.; Surakka, T.; Hakonen, M. Conceptualising Mobility as a Service. In Proceedings of the 2016 Eleventh International Conference on Ecological Vehicles and Renewable Energies (EVER), Monte Carlo, Monaco, 6–8 April 2016; pp. 1–11. [Google Scholar]
- Caravani, P.; De Santis, E.; Graziosi, F.; Panizzi, E. Communication Control and Driving Assistance to a Platoon of Vehicles in Heavy Traffic and Scarce Visibility. IEEE Trans. Intell. Transp. Syst. 2006, 7, 448–460. [Google Scholar] [CrossRef]
- Kolosz, B.W.; Grant-Muller, S.M.; Djemame, K. A Macroscopic Forecasting Framework for Estimating Socioeconomic and Environmental Performance of Intelligent Transport Highways. IEEE Trans. Intell. Transp. Syst. 2013, 15, 723–736. [Google Scholar] [CrossRef]
- Li, L.; Ding, W.; Nan-Ning, Z.; Lin-Cheng, S. Cognitive cars: A new frontier for ADAS research. IEEE Trans. Intell. Transp. Syst. 2012, 13, 395–407. [Google Scholar] [CrossRef]
- Li, K.; Chen, T.; Luo, Y.; Wang, J. Intelligent environment-friendly vehicles: Concept and case studies. IEEE Trans. Intell. Transp. Syst. 2012, 13, 318–328. [Google Scholar] [CrossRef]
- Ferreira, M.; d’Orey, P.M. On the impact of virtual traffic lights on carbon emissions mitigation. IEEE Trans. Intell. Transp. Syst. 2012, 13, 284–295. [Google Scholar] [CrossRef]
- Kolosz, B.W.; Grant-Muller, S.M. Appraisal and Evaluation of Interurban ITS: A European Survey. IEEE Trans. Intell. Transp. Syst. 2015, 16, 1070–1087. [Google Scholar] [CrossRef]
- Mercier, P. Handisyde. In Intelligent Transport Systems: EU-Funded Research for Efficient, Clean and Safe Road Transport; European Commission: Brussels, Belgium, 2010. [Google Scholar]
- Toral, S.; Torres, R.M.; Barrero, F.; Arahal, M. Current paradigms in intelligent transportation systems. IET Intell. Transp. Syst. 2010, 4, 201. [Google Scholar] [CrossRef]
- Japan International Cooperation Agency (JICA). Mega Manila Region Highway Network Intelligent Transport System (ITS) Integration Project; DPWH and MMDA: Manila, Philippines, 2013.
- RITA. Real-Time Data Capture and Management Evaluation and Performance Measures; Technical Report FHWA-JPO-11-136; ITS Joint Program Office; Research and Innovative Technology Administration; U.S. Department of Transportation: Washington, DC, USA, 2011.
- European Union. ITS Action Plan: Study Regarding Guaranteed Access to Traffic and Travel Data and Free Provision of Universal Traffic Information; Technical Report TREN/G4/FV-2008/475/01; European Commission, Directorate-General Mobility and Transport: Brussels, Belgium, 2010. [Google Scholar]
- European Union. Intelligent Transport Systems in Action; European Commission, Directorate-General Mobility and Transport: Brussels, Belgium, 2011. [Google Scholar]
- DSRC International Task Force of Japan. Study on the Next Generation ITS Radio Communication in Japan; Technical Report; International Telecommunications Union: Geneva, Switzerland, 2003. [Google Scholar]
- Ministry of Land, Infrastructure, Transport and Tourism. ITS Initiatives in Japan; Technical Report; Ministry of Land, Infrastructure, Transport and Tourism: Tokyo, Japan, 2012.
- Department of Public Works and Highways. Current State of ITS Applications in DPWH; ITS Forum: Manila, Philippines, 2018. [Google Scholar]
- Gurínová, J. Integrating Intelligent Transport Systems into the Transportation Planning Process; University Žilina, Faculty of Operation and Economics of Transport and Communications, Department of Road and City Transport: Žilina, Slovakia, 2005. [Google Scholar]
- Bekiaris, E.; Stevens, A.; Bauer, A.; Wiethoff, M. ITS implementation: From impact assessment to policy recommendations. Res. Transp. Econ. 2004, 8, 605–637. [Google Scholar] [CrossRef]
- Canale, A.; Tesoriere, G.; Campisi, T. The MAAS development as a mobility solution based on the individual needs of transport users. AIP Conf. Proc. 2019, 2186, 160005. [Google Scholar]
- Zipeng, Z.; Zhang, N. A Novel Development Scheme of Mobility as a Service: Can It Provide a Sustainable Environment for China? Sustainability 2021, 13, 4233. [Google Scholar] [CrossRef]
- Billones, R.K.C.; Sybingco, E.; Lim, L.A.G.; Culaba, A.B.; Vicerra, R.R.P.; Fillone, A.M.; Bandala, A.A.; Dadios, E.P. Vision-Based Passenger Activity Analysis System in Public Transport and Bus Stop Areas. In Proceedings of the 2018 IEEE 10th International Conference on Humanoid, Nanotechnology, Information Technology, Communication and Control, Environment and Management (HNICEM), Baguio City, Philippines, 29 November–2 December 2018; pp. 1–6. [Google Scholar] [CrossRef]
- Escolano, C.O.; Billones, R.K.C.; Sybingco, E.; Fillone, A.D.; Dadios, E.P. Passenger demand forecast using optical flow passenger counting system for bus dispatch scheduling. In Proceedings of the 2016 IEEE Region 10 Conference (TENCON), Singapore, 22–25 November 2016; pp. 1875–1878. [Google Scholar] [CrossRef]
- Billones, R.K.C.; Bandala, A.A.; Lim, L.A.G.; Culaba, A.B.; Vicerra, R.R.P.; Sybingco, E.; Fillone, A.M.; Dadios, E.P. Vehicle-Pedestrian Classification with Road Context Recognition Using Convolutional Neural Networks. In Proceedings of the 2018 IEEE 10th International Conference on Humanoid, Nanotechnology, Information Technology, Communication and Control, Environment and Management (HNICEM), Baguio City, Philippines, 29 November–2 December 2018; pp. 1–6. [Google Scholar] [CrossRef]
- Mistretta, M.; Goodwill, J.A.; Gregg, R.; DeAnnuntis, C. Best Practices in Transit Service Planning; Final Report No. BD549-38; Center for Urban Transportation Research for the Florida Department of Transportation: Tampa, FL, USA, 2009. [Google Scholar]
- Transportation Research Board. Transit Capacity and Quality of Service Manual, 3rd ed.; Bus Capacity, Transit Cooperative Research Program (TCRP) Report 165; TRB: Washington, DC, USA, 2013. [Google Scholar]
- Philippine Statistics Authority. 2020 Regional Social & Economic Trends Region VI–Western Visayas; PSA: Metro Manila, Philippines, 2020. [Google Scholar]
- Bangko Sentral ng Pilipinas–Department of Economic Research. Report on Regional Economic Developments in the Philippines 2018; BSP Department of Economic Research: Metro Manila, Philippines, 2018.
- Guimaras Province Local Government Unit. Local Public Transport Route Plan of Guimaras Province; Guimaras PLGU: Guimaras, Philippines, 2019. [Google Scholar]


Publisher’s Note: MDPI stays neutral with regard to jurisdictional claims in published maps and institutional affiliations. |
© 2021 by the authors. Licensee MDPI, Basel, Switzerland. This article is an open access article distributed under the terms and conditions of the Creative Commons Attribution (CC BY) license (https://creativecommons.org/licenses/by/4.0/).