Innovative Climate-Smart Agriculture (CSA) Practices in the Smallholder Farming System of South Africa


Abstract
:1. Introduction
2. Conceptual Framework
3. Methodology
3.1. Study Design
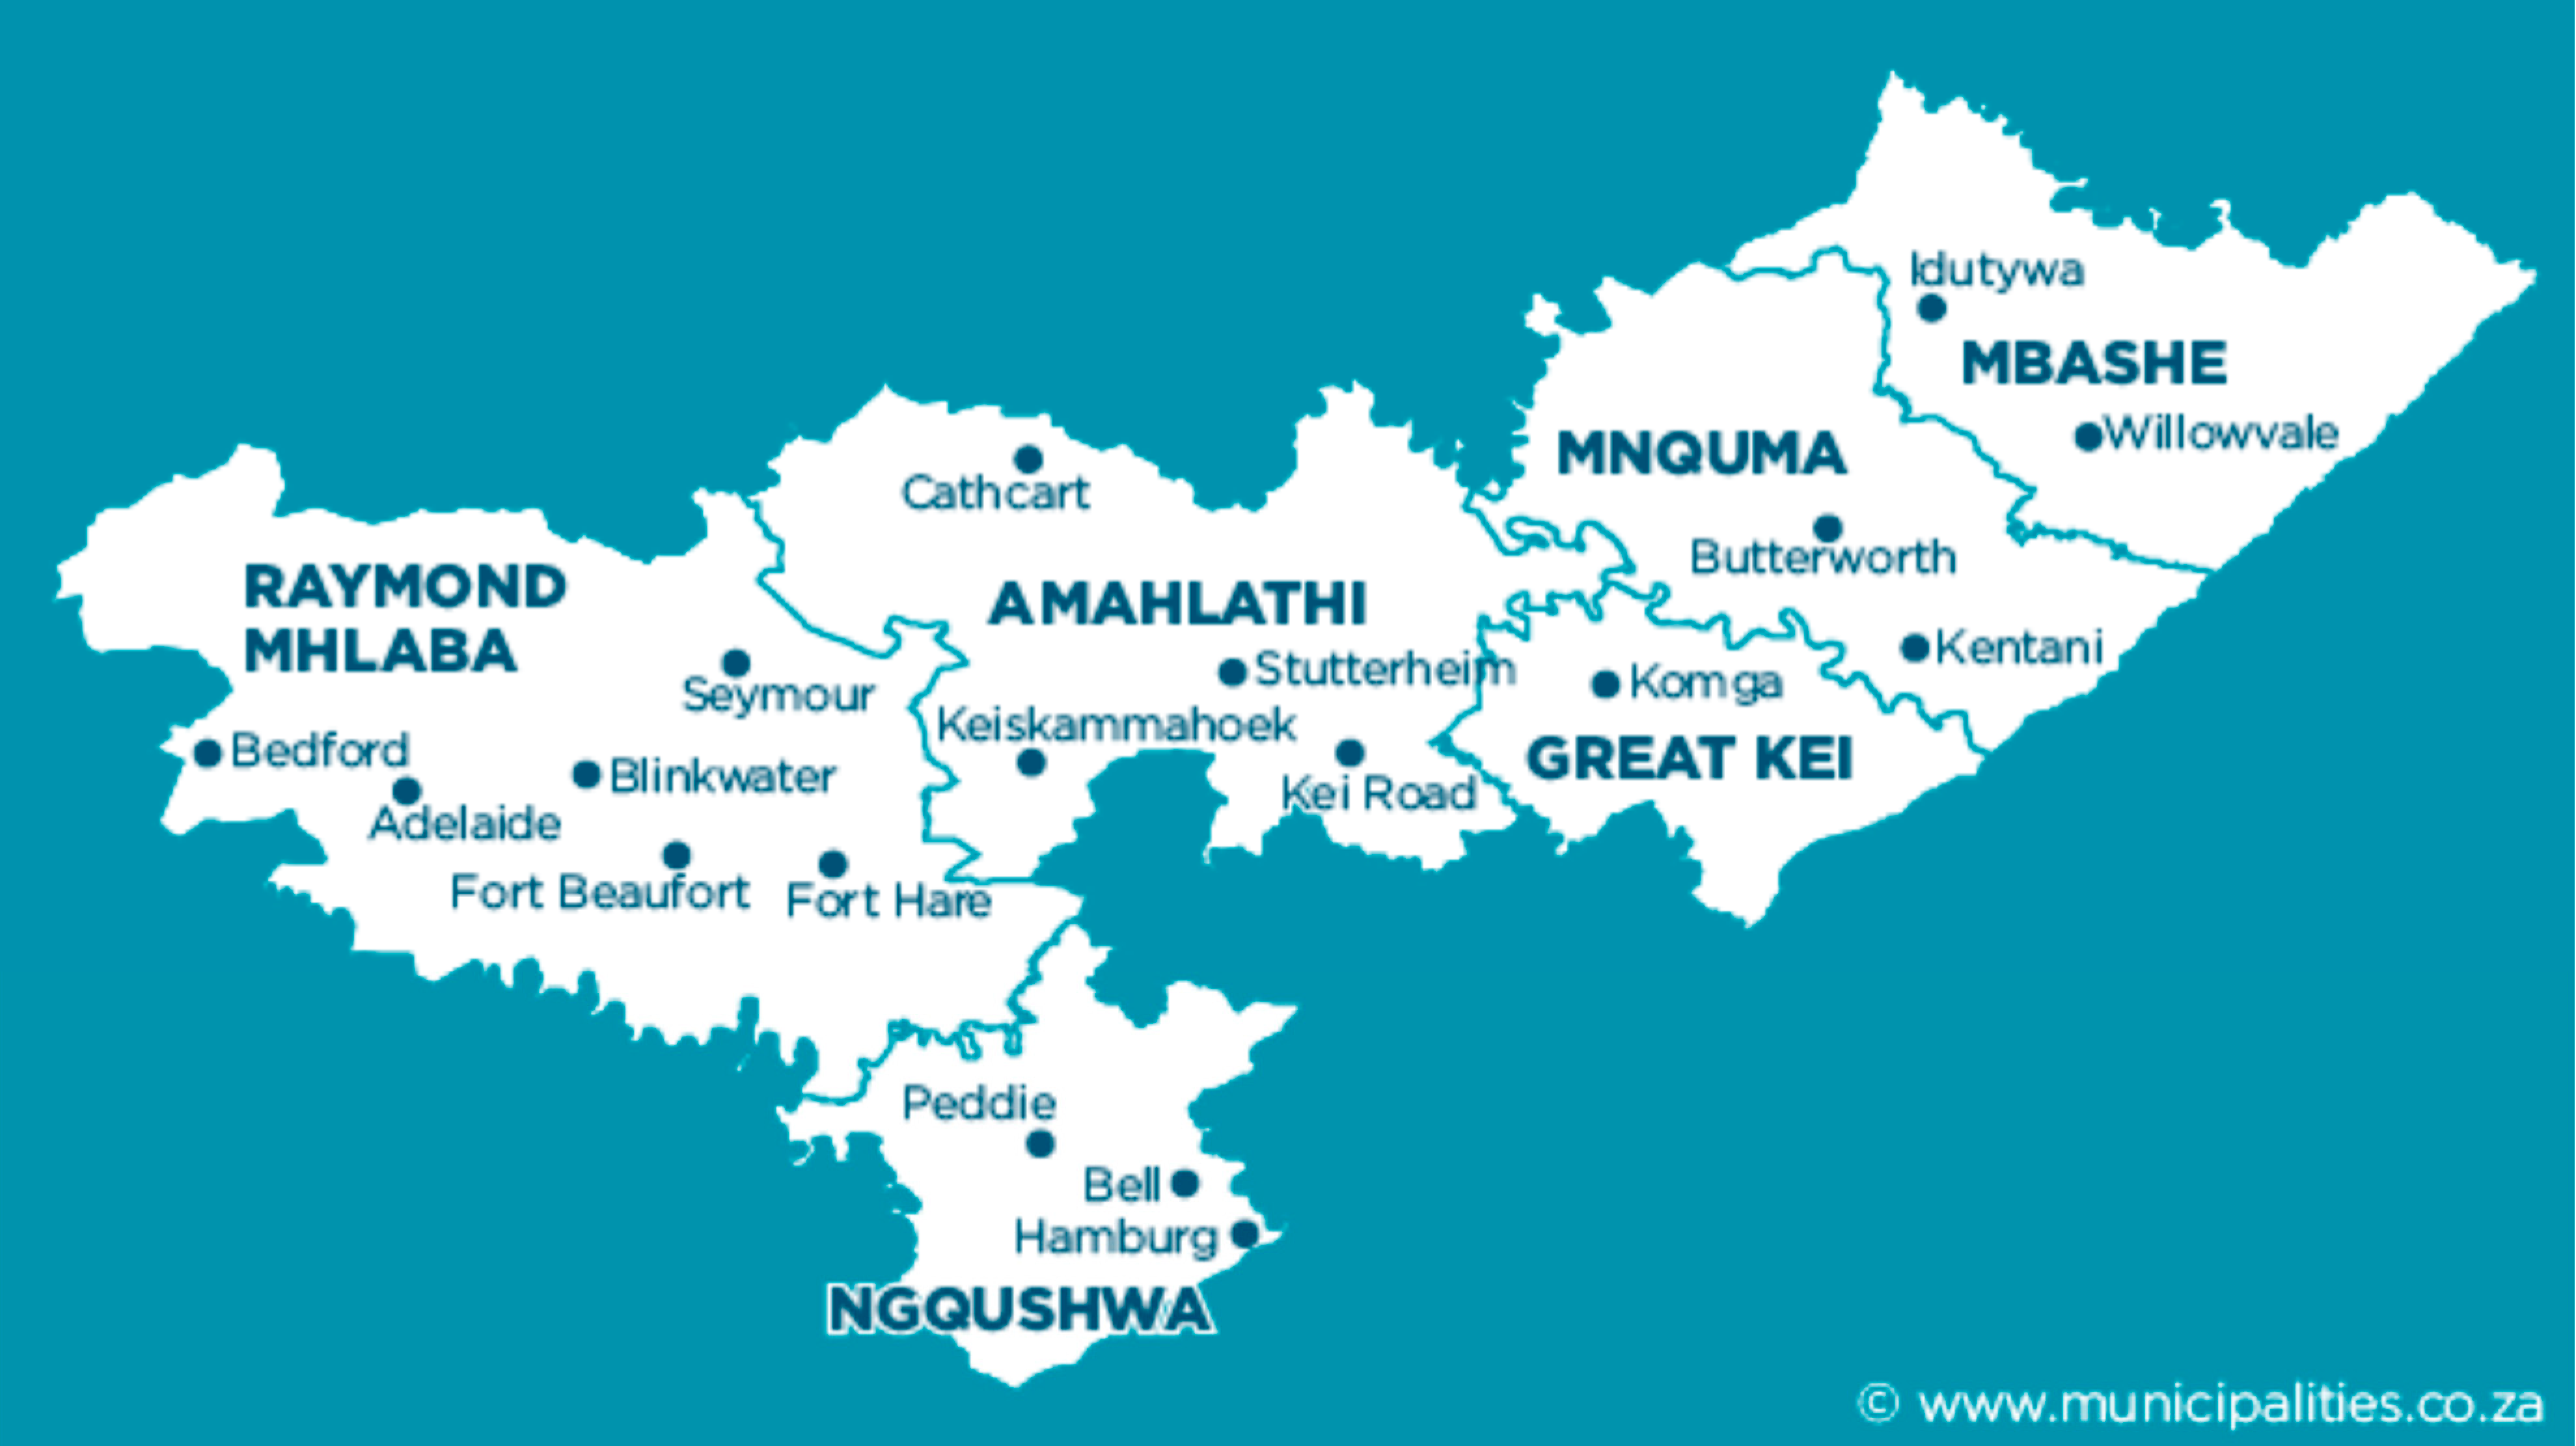
3.2. Study Areas
3.2.1. Raymond Mhlaba Local Municipality.
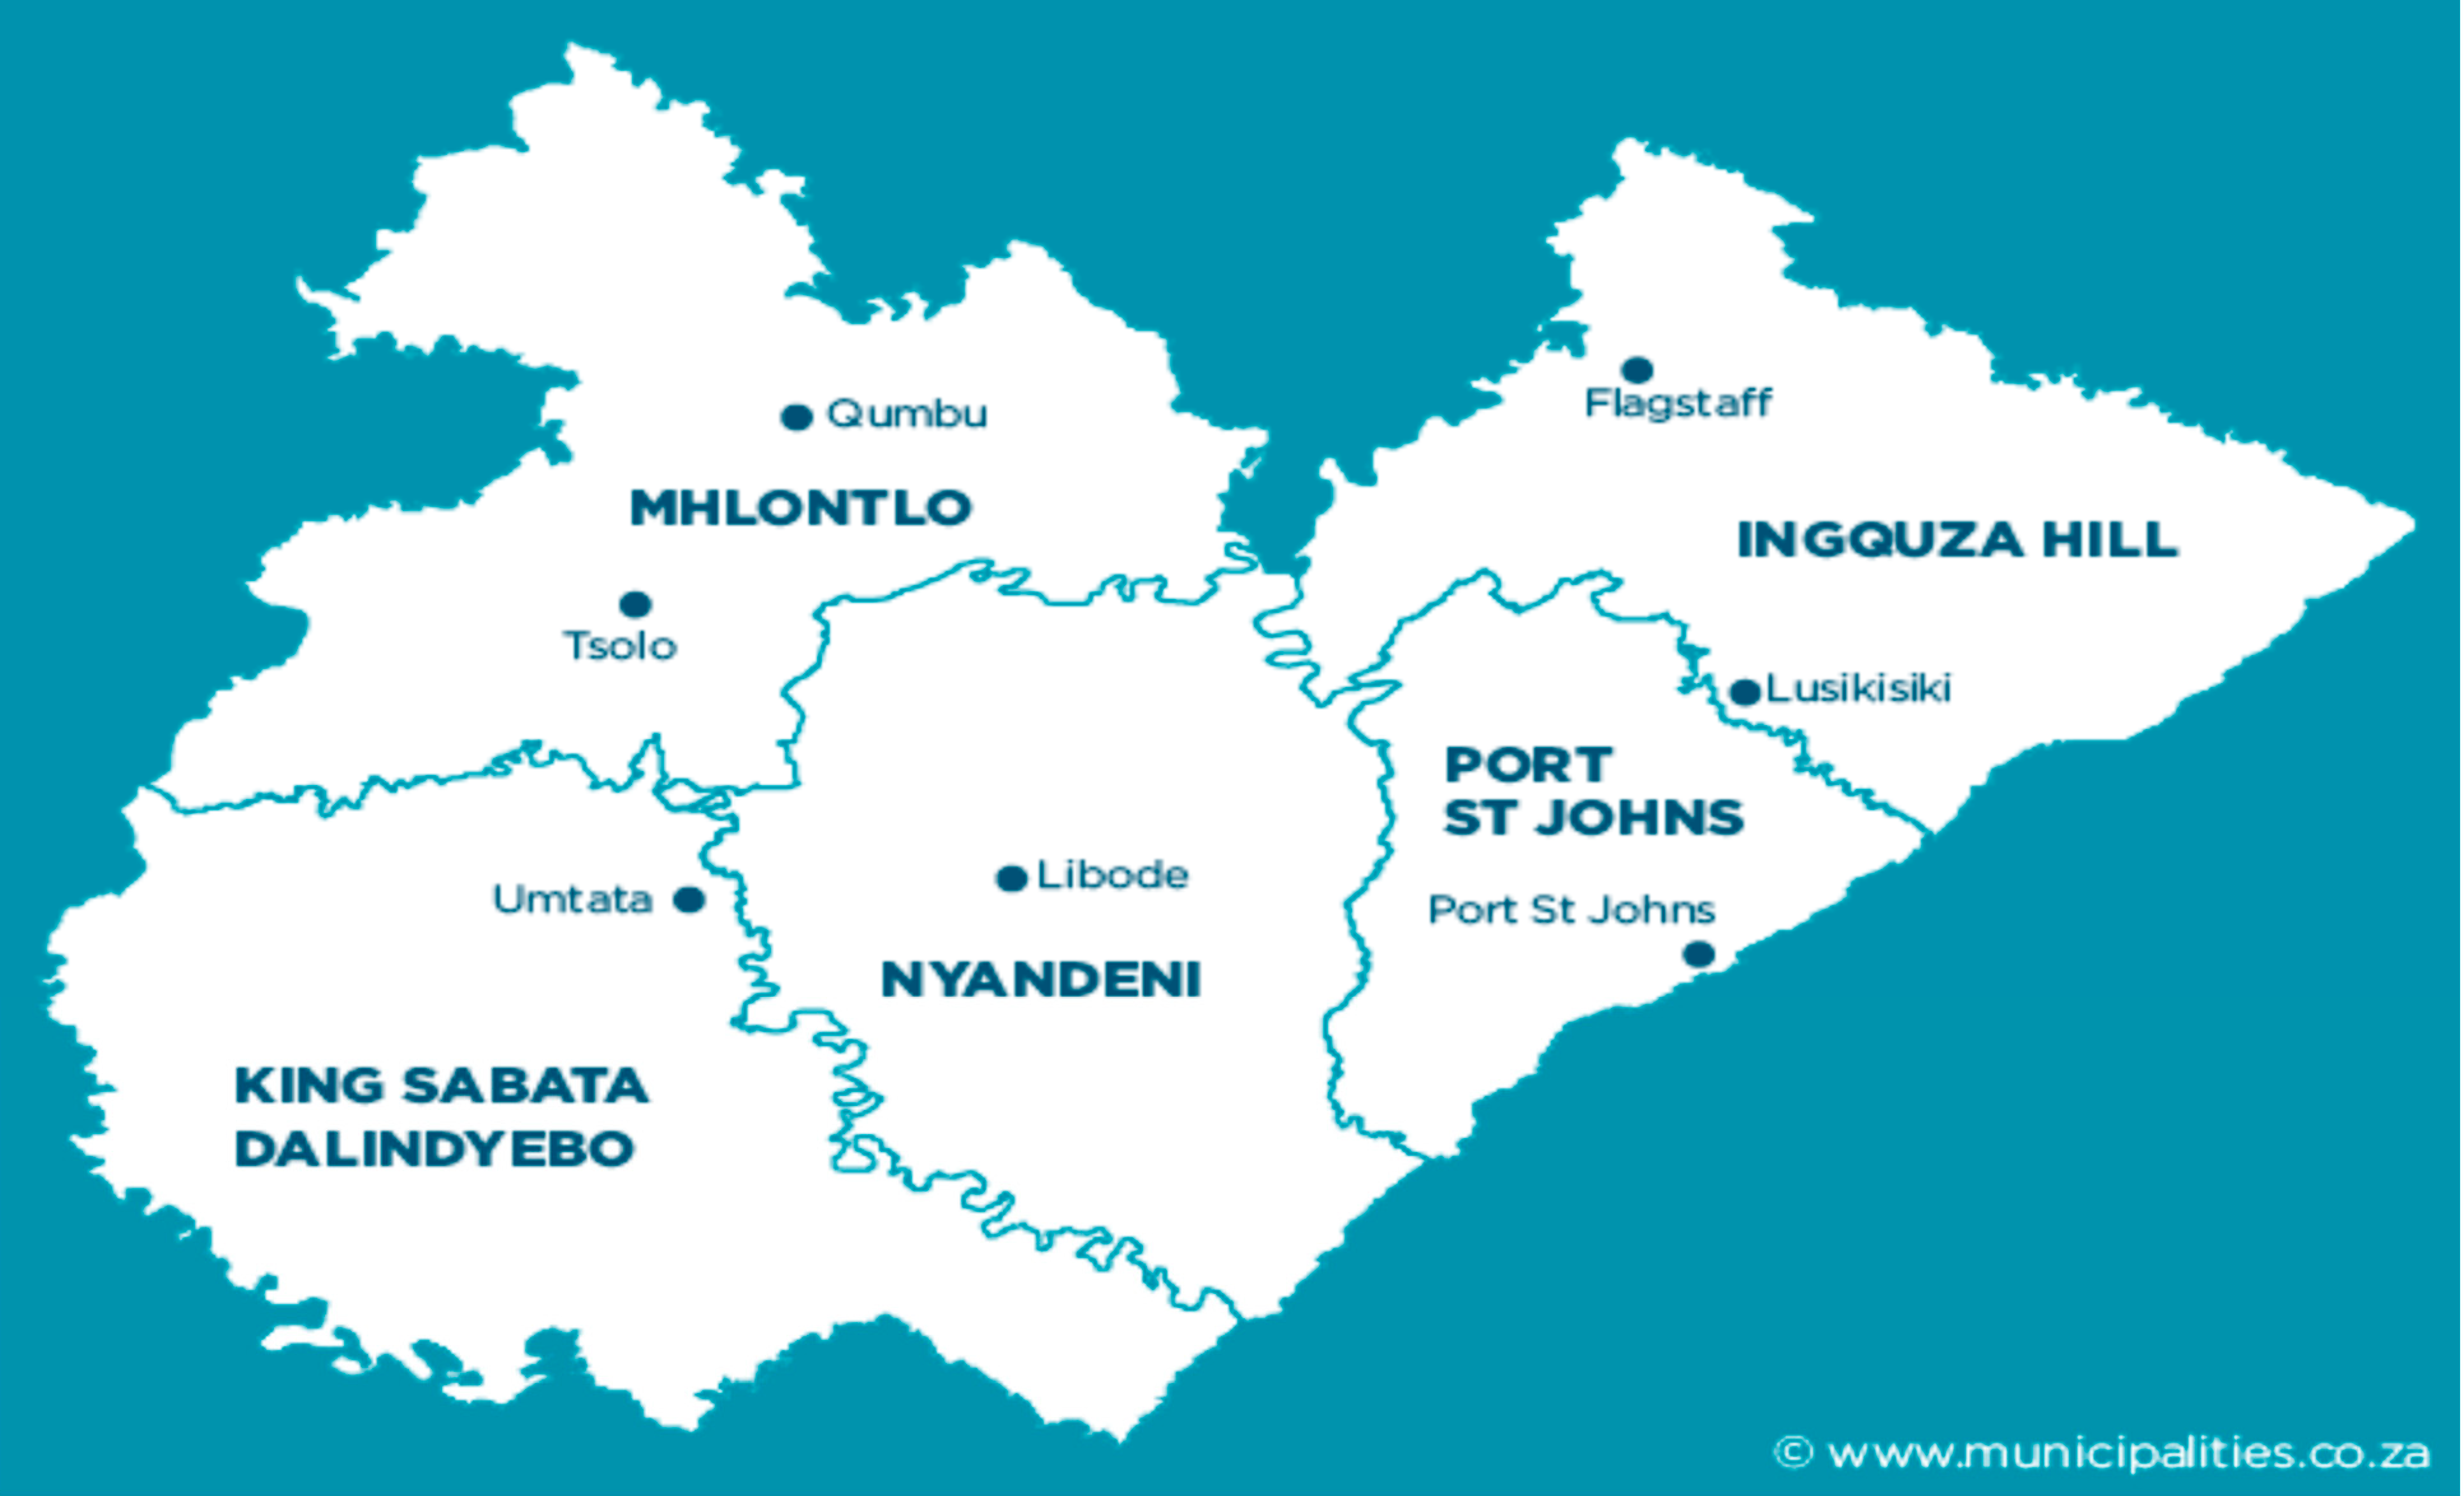
3.2.2. Port Saint Johns (PSJ) Local Municipality
3.2.3. Ingquza Hill Local Municipality
3.3. Sampling Procedure and Sample Size
3.4. Data Collection and Analysis
3.5. Analytical Framework
- no adaptation (base category for combined data),
- crop diversification and new improved crop varieties (base category for municipality data),
- soil and water conservation practices and planting trees and annual crop rotation,
- use of organic manure,
- mixed farming, crop–livestock-based diversification practices,
- all above practices.
4. Results and Discussion
4.1. Demographic and Socioeconomic Characteristics
4.2. Choice of CSA Practices by Smallholder Farmers
5. Discussions, Conclusions and Recommendations
5.1. Discussions and Conclusions
5.2. Recommendations
Author Contributions
Funding
Acknowledgments
Conflicts of Interest
References
- Ringer, C.; Zhu, T.; Cai, X.; Koo, J.; Wang, D. Climate change impacts on food security in sub-Saharan Africa: Insights from comprehensive change scenarios. In IFPRI Discussion Paper 01042; International Food Policy Research Institute: Washington, DC, USA, 2010. [Google Scholar]
- Belloumi, M. Investigating the Impact of Climate Change on Agricultural Production in Eastern and Southern African Countries; African Growth & Development Policy (AGRODEP) Working Paper; International Food Policy Research Institute (IFPRI): Washington, DC, USA, 2014; Volume 3, pp. 1–27. [Google Scholar]
- WHO. World Hunger is Still not Going Down after Three Years—More than 820 Million People are Hungry Globally; World Health Organization: Geneva, Switzerland, 2019; Available online: https://www.who.int/news/item (accessed on 18 December 2020).
- FAO; IFAD; UNICEF; WFP; WHO. The State of Food Security and Nutrition in the World 2019: Safeguarding against Economic Slowdowns and Downturns; Food and Agriculture Organization of the United Nations: Rome, Italy, 2019; pp. 1–239. [Google Scholar]
- WHO. Coronavirus Disease (COVID-19) Pandemic. Geneva, World Health Organization. Update of 19 December 2020. Available online: https://www.who.int/emergencies/diseases/novel-coronavirus-2019? (accessed on 19 December 2020).
- World Bank. Food Security and COVID-19. 2020. Available online: https://www.worldbank.org/en/topic/agriculture/brief/food-security-and-covid-19 (accessed on 19 December 2020).
- FAO. Climate-Smart Agriculture Sourcebook; Food and Agriculture Organization of the United Nations, Department NRMaE: Rome, Italy, 2013. [Google Scholar]
- Serdeczny, O.; Adams, S.; Baarsch, F.; Coumou, D.; Robinson, A.; Hare, W.; Schaeffer, M.; Perrette, M.; Reinhardt, J. Climate change impacts in sub-Saharan Africa: From physical changes to their social repercussions. Reg. Environ. Chang. 2015, 15, 1–19. [Google Scholar]
- National Research Council. Soil and Water Quality: An Agenda for Agriculture; The National Academies Press: Washington, DC, USA, 1993.
- FAO. Food Security and Agricultural Mitigation in Developing Countries: Options for Capturing Synergies; FAO: Rome, Italy, 2009; pp. 1–84. Available online: http://www.fao.org/docrep/012/i1318e/i1318e00.pdf (accessed on 19 December 2020).
- FAO. Climate-Smart Agriculture: Policies, Practices and Financing for Food Security, Adaptation and Mitigation; FAO: Rome, Italy, 2010. [Google Scholar]
- Pereira, L. Climate Change Impacts on Agriculture across Africa; Oxford Research Encyclopedia of Environmental Science: Centre for Complex Systems in Transition; Stellenbosch University: Stellenbosch, South Africa, 2017; pp. 1–35. [Google Scholar]
- Kom, Z.; Nethengwe, N.S.; Mpandeli, N.S.; Chikoore, H. Determinants of small-scale farmers’ choice and adaptive strategies in response to climatic shocks in Vhembe District, South Africa. GeoJournal 2020, 1–24. [Google Scholar] [CrossRef]
- Abegunde, V.O.; Sibanda, M.; Obi, A. Determinants of the adoption of climate-smart agricultural practices by small-scale farming households in King Cetshwayo District Municipality, South Africa. Sustainability 2019, 11, 195. [Google Scholar]
- Branca, G.; McCarthy, N.; Lipper, L.; Jolejole, M. Climate Smart Agriculture: A synthesis of Empirical Evidence of Food Security and Mitigation Benefits from Improved Cropland Management; Food and Agriculture Organisation of the United Nations: Rome, Italy, 2011. [Google Scholar]
- Kitsao, E.Z. Adoption of Climate Smart Agriculture (CSA) technologies among female smallholder farmers in Malawi. Master’s Thesis, Norwegian University of Life Sciences, Ås in Viken, Norway, 2016. [Google Scholar]
- Lipper, L.; Thornton, P.; Campbell, B.M.; Baedeker, T.; Braimoh, A.; Bwalya, M.; Caron, P.; Cattaneo, A.; Garrity, D.; Henry, K.; et al. Climate-smart agriculture for food security. Nat. Clim. Chang. 2014, 4, 1068–1072. [Google Scholar]
- Lipper, L.; McCarthy, N.; Zilberman, D.; Asfaw, S.; Branca, G. (Eds.) Climate Smart Agriculture: Building Resilience to Climate Change; Food and Agriculture Organization of the United Nations (FAO)/Springer: Rome, Italy, 2018; pp. 1–625. [Google Scholar]
- Abid, M.; Scheffran, J.; Schneider, U.A.; Ashfaq, M. Farmers’ perceptions of and adaptation strategies to climate change and their determinants: The case of Punjab province, Pakistan. Earth Syst. Dynam. 2015, 6, 225–243. [Google Scholar]
- Bahinipati, C.S.; Venkatachalam, L. What drives farmers to adopt farm-level adaptation practices to climate extremes: Empirical evidence from Odisha, India. Int. J. Disaster Risk Reduct. 2015, 14, 347–356. [Google Scholar]
- Komba, C.; Muchapondwa, E. Adaptation to Climate Change by Smallholder Farmers in Tanzania; Environment for Development, Discussion Paper Series; EfD DP 15e12; University of Gothenburg: Gothenburg, Sweden, 2015. [Google Scholar]
- Abegunde, V.O.; Sibanda, M.; Obi, A. The dynamics of climate change adaptation in sub-Saharan Africa: A review of Climate-Smart Agriculture among Small-Scale Farmers. Climate 2019, 7, 1–23. [Google Scholar]
- De Wit, M. The Perception of and adaptation to climate change in Africa. In CEEPA Discussion Paper No. 10, CEEPA; University of Pretoria: Pretoria, South Africa, 2006. [Google Scholar]
- Yesuf, M.; Di Falco, S.; Deressa, T.; Ringler, C.; Kohlin, G. The Impact of Climate Change and Adaptation on Food Production in Low-Income Countries: Evidence from the Nile Basin, Ethiopia, EDRI; International Food Policy Research Institute (IFPRI) & Ethiopia Development Research Institute (EDRI): Washington, DC, USA, 2008. [Google Scholar]
- Nhemachena, C.; Hassan, R. Micro-Level Analysis of Farmers’ Adaptations to Climate Change in Southern Africa; IFPRI, Environment and Production Technology Division, International Food Policy Research Institute: Washington, DC, USA, 2007; Available online: https://www.researchgate.net/publication/5056602_MicroLevel_Analysis_of_Farmers’_Adaptation_to_Climate_Change_in_Southern_Africa (accessed on 12 December 2020).
- Gandure, S.; Walker, S.; Botha, J.J. Farmers’perceptions of adaptation to climate change and water in a Southern African rural community. Econ. Dev. 2012. [Google Scholar] [CrossRef]
- Deressa, T.T.; Hassan, R.M.; Ringler, C.; Alemu, T.; Yesuf, M. Analysis of the Determinants of Farmers’ Choice of Adaptation Methods and Perceptions of Climate Change in the Nile Basin of Ethiopia; IFPRI Discussion Paper No. 798; International Food Policy Research Institute: Washington, DC, USA, 2008. [Google Scholar]
- Juana, J.; Kahaka, Z.; Okurut, F. Farmers’ Perceptions and Adaptations to Climate Change in Sub-Sahara Africa: A Synthesis of Empirical Studies and Implications for Public Policy in African Agriculture. J. Agric. Sci. 2013, 5, 121–135. [Google Scholar]
- Acquah-de Graft, H. Farmers’ perceptions and adaptation to climate change: A willingness to pay analysis. AGRIS on-line Papers in Economics and Informatics, Czech University of Life Sciences Prague, Faculty of Economics and Management. J. Agri. Sci. 2011, 3, 1–9. [Google Scholar] [CrossRef]
- Acquah-de Graft, H.; Onumah, E. Farmers’ perceptions and adaptations to climate change: An estimation of willingness to pay. Agris 2011, 3, 31–39. [Google Scholar]
- Fosu-Mensah, B.; Vlek, P.; Manschadi, M. Farmers ‘Perceptions and Adaptation to Climate Change: A Case Study of Seky edumase District in Ghana. World Food System—A Ccontribution from Europe; Centre for Development Research (ZEF), University of Bonn: Bonn, Germany, 2010. [Google Scholar]
- Mandleni, B.; Anim, F. Perceptions of Cattle and Sheep Framers on Climate Change and Adaptations in the Eastern Cape Province of South Africa. J. Hum. Ecol. 2011, 34, 107–112. [Google Scholar]
- Deressa, T.T.; Hassan, R.M.; Ringler, C.; Alemu, T.; Yesuf, M. Determinants of farmers’ choice of adaptation methods to climate change in the Nile Basin of Ethiopia. Glob. Environ. Chang. 2009, 19, 248–255. [Google Scholar]
- Kabubo-Mariara, J. Climate change adaptation and livestock activity choices in Kenya: An economic analysis. Nat. Resour. Forum. 2008, 32, 131–141. [Google Scholar]
- Mideksa, T.K. Economic and distributional impacts of climate change: The case of Ethiopia. Global Environ. Chang. 2009, 20, 278–286. [Google Scholar]
- Sofoluwe, N.; Tijani, A.; Baruwa, O. Farmers’ Perception and Adaptations to Climate Change in Osun State, Nigera. Afr. J. Agric. Res. 2011, 6, 4789–4794. [Google Scholar]
- Bryan, E.; Deressa, T.T.; Gbetibouo, G.A.; Ringler, C. Adaptation to climate change in Ethiopia: Options and constraints. Environ. Sci. Policy 2009, 12, 413–426. [Google Scholar]
- RMFRIDP. Raymond Mhlaba Final Reviewed Integrated Development Plan 2020–2021. 2020. Available online: http://www.raymondmhlaba.gov.za/system/files/data/IDP-SDBIP/June-2020/Final%20IDP%202020-2021.pdf (accessed on 3 March 2021).
- StatsSA. Census of Commercial Agriculture. 2017; Eastern Cape Financial and Production Statistics. Available online: http://www.statssa.gov.za/publications/Report-11–02–03/Report-11–02- (accessed on 12 December 2020).
- StatsSA. Port St. John Municipality. 2020. Available online: http://www.statssa.gov.za/?page_id=993&id=port-st-johns-municipality (accessed on 12 December 2020).
- StatsSA. Ingquza Hill Local Municipality. Available online: http://www.statssa.gov.za/?s=municipality+population&sitem=statistics+by+place&pg=2&paged=4 (accessed on 12 December 2020).
- Greene, W.H. Econometric Analysis, 4th ed.; Prentice Hall: Englewood Cliffs, NJ, USA, 2000. [Google Scholar]
- Matebeni, F. Measuring rural household food security in the Nkonkobe Local Municipality, Eastern Cape Province of South Africa. Master’s Dissertation, Faculty of Agricultural Science, Stellenbosch University, Stellenbosch, South Africa, 2018. [Google Scholar]
- FAO. The role of women in agriculture. In ESA Working Paper No. 11–02; Food and Agriculture Organization of the United Nations: Rome, Italy, 2011. [Google Scholar]
- Mcata, B. The Role of Home Gardens in Enhancing Food Security in Rural and Urban Areas: A case study of Nkonkobe Municipality, Eastern Cape-South Africa. Master’s Dissertation, Faculty of Science and Agriculture, University of Fort Hare, Alice, South Africa, 2012. [Google Scholar]
- Muchara, B. Analysis of food value chain in smallholder crop and livestock enterprises in Eastern Cape Province of South Africa. Master’s Dissertation, Faculty of Science and Agriculture, University of Fort Hare, Alice, South Africa, 2011. [Google Scholar]
- Onyeneke, R.U.; Igberi, C.O.; Uwadoka, C.O.; Aligbe, J.O. Status of climate-smart agriculture in southeast Nigeria. GeoJournal 2018, 83, 333–346. [Google Scholar]
- Maddison, D. The Perception of and Adaptation to Climate Change in Africa; Policy Research Working Paper, No WPS 4308; The World Bank: Washington, DC, USA, 2007. [Google Scholar]
- Obi, A. Smallholder agriculture and prosperity: Trade-offs, synergies and everything in between. In Professorial Inaugural Lecture 5 October 2015; University of Fort Hare: Alice, South Africa, 2015. [Google Scholar]
- Adger, W.N.; Dessai, S.; Goukken, M.; Nelson, D.R.; Wreford, A. Are there social limits to adaptation to climate change? Clim. Chang. 2009, 93, 335–354. [Google Scholar]


| Variable Name Dependent Variable | Type of Measurement | Prior Expectations |
|---|---|---|
| CSA Practices | ||
| Independent variables | ||
| Gender of HH | Dummy | + |
| Age of HH | Actual number in years | + |
| Educational level of HH | Years spent in school | +/− |
| Household size | Actual number | + |
| Land size | Continuous | +/− |
| Farming experience | Continuous | + |
| Access to climate change information | Dummy | + |
| Access to credit | Dummy | + |
| Access to extension services | Dummy | +/− |
| Distance to market | Dummy | +/− |
| Farmer’s group membership | Dummy | + |
| Socioeconomic Characteristics | Raymond Mhlaba | PSJ | Ingquza Hill | |||
|---|---|---|---|---|---|---|
| Frequency (N = 86) | % | Freq. (N = 56) | % | Freq. (N = 69) | % | |
| Gender | ||||||
| Female | 49 | 57.0 | 35 | 63.5 | 40 | 58.0 |
| Male | 37 | 43.0 | 21 | 37.5 | 29 | 42.0 |
| Total | 86 | 100 | 56 | 100 | 69 | 100 |
| Highest educational level | ||||||
| No formal education | 9 | 10.5 | 11 | 19.6 | 6 | 8.7 |
| Primary education | 47 | 54.7 | 24 | 42.9 | 17 | 24.6 |
| Secondary education | 28 | 32.6 | 21 | 37.5 | 43 | 62.3 |
| Tertiary education | 2 | 2.3 | 0 | 0 | 3 | 4.3 |
| Total | 86 | 100 | 56 | 100 | 69 | 100 |
| Household size | ||||||
| 1–5 | 63 | 73.3 | 32 | 57.1 | 40 | 58.0 |
| 6–10 | 23 | 26.7 | 22 | 39.3 | 25 | 36.2 |
| 11–15 | 0 | 0.0 | 1 | 1.8 | 4 | 5.8 |
| >15 | 0 | 0.0 | 1 | 1.8 | 0 | 0 |
| Total | 86 | 100 | 56 | 100 | 69 | 100 |
| Occupation | ||||||
| Farmer | 23 | 26.7 | 21 | 37.5 | 39 | 56.5 |
| Wage employment | 10 | 11.6 | 6 | 10.7 | 15 | 21.7 |
| Employed | 18 | 20.9 | 10 | 17.9 | 8 | 11.6 |
| Unemployed | 35 | 40.7 | 19 | 33.9 | 7 | 10.1 |
| Total | 86 | 100 | 56 | 100 | 69 | 100 |
| Independent Variables | No Adaptation | Soil and Water Conservation and Annual Crop Rotation | Organic Manure and Crop Diversification | Mixed Farming and Livestock-Based Diversification Strategies | All Strategies | |||||
|---|---|---|---|---|---|---|---|---|---|---|
| Coefficient | Sig | Coefficient | Sig | Coefficient | Sig | Coefficient | Sig | Coefficient | Sig | |
| Intercept | 63.233 | 0.982 | 22.259 | 0.994 | 3.380 | 0.416 | 17.762 | 0.003 | 34.376 | 0.990 |
| Age | −0.251 | 0.218 | −0.080 | 0.084 * | −0.39 | 0.440 | −0.133 | 0.082 * | −0.240 | 0.971 |
| Membership in farmers’ group | −9.294 | 0.759 | −0.551 | 0.542 | −1.179 | 0.250 | −0.378 | 0.802 | −3.419 | 0.983 |
| Extension services | −9.199 | 0.776 | 0.990 | 0.360 | 0.965 | 0.423 | −1.896 | 0.237 | 0.768 | 0.996 |
| Occupation | −2.247 | 0.622 | 2.306 | 0.036 ** | 3.210 | 0.009 *** | 0.725 | 0.666 | 6.727 | 0.973 |
| Education | 8.472 | 0.839 | −0.935 | 0.531 | −0.158 | 0.923 | −0.084 | 0.964 | 35.708 | 0.928 |
| Farm experience | −1.027 | 0.622 | −1.131 | 0.207 | −1.237 | 0.224 | −0.190 | 0.887 | 0.043 | 1 |
| Farm systems | 2.487 | 0.270 | −3.851 | 0.002 *** | −4.054 | 0.003 *** | −0.021 | 0.989 | 1.568 | 0.989 |
| Climate change info | −55.462 | 0.984 | −16.746 | 0.995 | −1.633 | −10.390 | −73.513 | 0.979 | ||
| Household size | −0.058 | 0.975 | 1.888 | 0.039 ** | 1.888 | 0.073 * | 1.228 | 0.431 | 0.702 | 0.998 |
| Independent Variables | No Adaptation | Soil and Water Conservation and Annual Crop Rotation | Organic Manure and Crop Diversification | Mixed Farming and Livestock-Based Diversification Strategies | All Strategies | |||||
|---|---|---|---|---|---|---|---|---|---|---|
| Coefficient | Sig | Coefficient | Sig | Coefficient | Sig | Coefficient | Sig | Coefficient | Sig | |
| Intercept | 19.206 | 0.997 | −3.588 | 1.000 | −6.735 | 0.999 | −13.088 | 0.998 | 10.225 | 0.998 |
| Age | 0.000 | 0.996 | 0.050 | 0.452 | 0.610 | 0.081 * | 0.006 | 0.998 | −0.077 | 0.606 |
| Membership in farmers’ group | −3.910 | 0.082 * | −2.909 | 0.193 | −2.282 | 0.307 | −3.259 | 0.210 | −4.174 | 0.238 |
| Extension services | −1.733 | 0.277 | −0.473 | 0.765 | −1.960 | 0.260 | −1.550 | 0.419 | −0.268 | 0.403 |
| Occupation | 0.230 | 0.893 | 0.808 | 0.630 | 0.858 | 0.590 | 0.598 | 0.766 | −0.406 | 0.865 |
| Education | 3.474 | 0.130 | 3.198 | 0.161 | 4.79 | 0.042 ** | 17.098 | 0.988 | 1.381 | 0.710 |
| Farm experience | 0.678 | 0.661 | 1.654 | 0.261 | −0.623 | 0.694 | 2.691 | 0.153 | −0.375 | 0.909 |
| Farm systems | 1.151 | 0.522 | −16.368 | 0.986 | 1.201 | 0.485 | −0.212 | 0.920 | 1.371 | 0.637 |
| Climate change info | −19.291 | 0.995 | −2.359 | 1.000 | 9.869 | 0.998 | −3.612 | −23.648 | 0.994 | |
| Household size | 0.901 | 1 | 3.285 | 0.999 | −14.081 | 0.997 | 1.532 | 1.000 | 18.369 | 0.996 |
| Independent Variables | No Adaptation | Soil and Water Conservation and Annual Crop Rotation | Organic Manure and Crop Diversification | Mixed Farming and Livestock-based Diversification Strategies | All Strategies | |||||
|---|---|---|---|---|---|---|---|---|---|---|
| Coefficient | Sig | Coefficient | Sig | Coefficient | Sig | Coefficient | Sig | Coefficient | Sig | |
| Intercept | 3.826 | 0.814 | 9.306 | 0.118 | −20.760 | 0.320 | −6.405 | 0.995 | 45.581 | 0.271 |
| Age | −0.027 | 0.553 | −0.096 | 0.026 ** | −0.046 | 0.287 | −0.098 | 0.093 * | −0.476 | 0.214 |
| Membership in farmers’ group | 0.909 | 0.602 | 2.935 | 0.242 | 1.319 | 0.459 | 1.573 | 0.502 | −2.781 | 0.661 |
| Extension services | −8.267 | 0.314 | −9.797 | 0.236 | −7.134 | 0.386 | −8.651 | 0.301 | −13.720 | 0.198 |
| Occupation | 1.682 | 0.555 | −2.182 | 0.223 | 3.353 | 0.741 | 1.571 | 0.636 | −1.658 | 0.836 |
| Education | −1.797 | 0.350 | −1.096 | 0.548 | 3.261 | 0.700 | −3.242 | 0.124 | −10.621 | 0.228 |
| Farm experience | −0.985 | 0.343 | −1.340 | 0.156 | 0.008 | 0.993 | −0.665 | 0.590 | −5.758 | 0.146 |
| Farm systems | −6.193 | 0.327 | −0.533 | 0.584 | −1.174 | 0.236 | −2.104 | 0.247 | −10.410 | 0.175 |
| Climate change info | −1.015 | 0.705 | 4.206 | 0.545 | 15.523 | 12.425 | 0.990 | −8.017 | 0.132 | |
| Household size | 6.385 | 0.647 | 1.426 | 0.348 | 7.051 | 0.606 | 6.514 | 0.703 | 6.579 | 0.796 |
| Variables | RRR | Std. Err. | Z | P > |z| | [95% conf. Interval] | |
|---|---|---|---|---|---|---|
| 1 (base outcome). No Adaptation | ||||||
| 2. Crop Diversification | ||||||
| Age | 0.9658853 | 0.0175859 | −1.91 | 0.057 * | −0.9320252 | 1.000975 |
| Household size | 0.7618357 | 0.0736889 | −2.81 | 0.005 *** | 0.6302727 | 0.9208612 |
| No. of children | 1.651443 | 0.2381629 | 3.48 | 0.001 *** | 1.244823 | 2.190886 |
| Farm size | 1.156666 | 0.3999146 | 0.42 | 0.674 | 0.5873632 | 2.277765 |
| Climate change info | 2.18998 | 1.26397 | 1.36 | 0.174 | 0.706578 | 6.787662 |
| Access to extension | 1.371496 | 1.234076 | 0.35 | 0.726 | 0.2351156 | 8.00033 |
| Extension visits | 1.324938 | 0.3577056 | 1.04 | 0.297 | 0.7805283 | 2.249066 |
| Farm group membership | 6.329912 | 4.264825 | 2.74 | 0.006 *** | 1.69003 | 23.70833 |
| Cc13 | 1.178133 | 1.437016 | 0.13 | 0.893 | 0.1078822 | 12.86586 |
| Constant | 0.2460182 | 0.6079592 | −0.57 | 0.570 | 0.0019386 | 31.22144 |
| 3. Soil and Water Conservation, Tree Planting and Crop Rotation | ||||||
| Age | 0.9701846 | 0.0201717 | −1.46 | 0.145 | 0.9314436 | 1.010537 |
| Household size | 0.8436013 | 0.0897635 | −1.60 | 0.110 | 0.684802 | 1.039225 |
| No. of children | 1.713724 | 0.2655604 | 3.48 | 0.001 *** | 1.264846 | 2.321902 |
| Farm size | 1.411189 | 0.5206913 | 0.93 | 0.351 | 0.6847225 | 2.908412 |
| Climate change info | 3.121419 | 2.284822 | 1.56 | 0.120 | 0.7435118 | 13.10437 |
| Access to extension | 0.3877754 | 0.4142336 | −0.89 | 0.375 | 0.047786 | 3.146733 |
| Extension visits | 1.033097 | 0.3203525 | 0.11 | 0.916 | 0.5625908 | 1.897098 |
| Farm group membership | 6.368277 | 4.793164 | 2.46 | 0.014 ** | 1.456647 | 27.8413 |
| Cc13 | 1.60 × 10⁻⁷ | 0.0003095 | −0.01 | 0.994 | 0 | 0 |
| Constant | 1153066 | 2.23 × 10⁹ | 0.01 | 0.994 | 0 | 0 |
| 4. Organic Manure | ||||||
| Age | 0.9191328 | 0.0284377 | −2.73 | 0.006 *** | 0.8650523 | 0.9765943 |
| Household size | 0.5748322 | 0.1122283 | −2.84 | 0.005 *** | 0.3920625 | 0.8428046 |
| No. of children | 1.816063 | 0.3749842 | 2.89 | 0.004 *** | 1.211638 | 2.722003 |
| Farm size | 0.0102919 | 0.0165304 | −2.85 | 0.004 *** | 0.0004419 | 0.2396947 |
| Climate change info | 9.628336 | 9.914467 | 2.20 | 0.028 ** | 1.279541 | 72.45167 |
| Access to extension | 1.831736 | 2.747764 | 0.40 | 0.687 | 0.0968248 | 34.65289 |
| Extension visits | 0.5365399 | 0.3843529 | −0.87 | 0.385 | 0.1317771 | 2.184562 |
| Farm group membership | 2.754705 | 2.529491 | 1.10 | 0.270 | 0.455475 | 16.66041 |
| Cc13 | 1.13 × 10⁻⁷ | 0.000276 | −0.01 | 0.995 | 0 | 0 |
| Constant | 3.59 × 10⁷ | 8.77 × 10⁻¹⁰ | 0.01 | 0.994 | 0 | 0 |
| 5. Mixed Farming—Crop–Livestock Integration | ||||||
| Age | 0.971378 | 0.0309254 | −0.91 | 0.362 | 0.9126176 | 1.033922 |
| Household size | 0.6878722 | 0.1244885 | −2.07 | 0.039 * | 0.4824592 | 0.9807424 |
| No. of children | 1.403407 | 0.2854353 | 1.67 | 0.096 | 0.9420198 | 2.090775 |
| Farm size | 1.088701 | 0.714239 | 0.13 | 0.897 | 0.3009403 | 3.938554 |
| Climate change info | 0.353286 | 0.3247828 | −1.13 | 0.258 | 0.0582908 | 2.141178 |
| Access to extension | 71.54411 | 130.8409 | 2.34 | 0.020 ** | 1.985563 | 2577.888 |
| Extension visits | 2.759015 | 1.575731 | 1.78 | 0.076 | 0.9007724 | 8.450704 |
| Farm group membership | 2.371864 | 2.486541 | 0.82 | 0.410 | 0.3039021 | 18.51169 |
| Cc13 | 86.45048 | 120.5724 | 3.20 | 0.001 *** | 5.618208 | 1330.261 |
| Constant | 0.0000368 | 0.0001569 | −2.39 | 0.017 ** | 8.57 × 10⁻⁹ | 0.1576295 |
| 6. All CSA Practices | ||||||
| Age | 0.9557315 | 0.0230582 | −1.88 | 0.061 | 0.91159 | 1.00201 |
| Household size | 0.764272 | 0.0963427 | −2.13 | 0.033 * | 0.5969625 | 0.9784731 |
| No. of children | 1.87237 | 0.3157592 | 3.72 | 0.000 *** | 1.345376 | 2.605791 |
| Farm size | 2.356742 | 0.9105252 | 2.22 | 0.026 ** | 1.105226 | 5.025428 |
| Climate change info | 2.476592 | 1.867663 | 1.20 | 0.229 | 0.5648602 | 10.85845 |
| Access to extension | 0.6575272 | 0.7879001 | −0.35 | 0.726 | 0.0627969 | 6.884769 |
| Extension visits | 0.5033642 | 0.2331093 | −1.48 | 0.138 | 0.20309 | 1.247602 |
| Farm group membership | 5.740974 | 4.767332 | 2.10 | 0.035 * | 1.12757 | 29.22991 |
| Cc13 | 3.298846 | 4.19877 | 0.94 | 0.348 | 0.2722407 | 39.9734 |
| Constant | 0.1498677 | 0.4627316 | −0.61 | 0.539 | 0.0003528 | 63.66177 |
Publisher’s Note: MDPI stays neutral with regard to jurisdictional claims in published maps and institutional affiliations. |
© 2021 by the authors. Licensee MDPI, Basel, Switzerland. This article is an open access article distributed under the terms and conditions of the Creative Commons Attribution (CC BY) license (http://creativecommons.org/licenses/by/4.0/).
Share and Cite
Obi, A.; Maya, O. Innovative Climate-Smart Agriculture (CSA) Practices in the Smallholder Farming System of South Africa. Sustainability 2021, 13, 6848. https://doi.org/10.3390/su13126848
Obi A, Maya O. Innovative Climate-Smart Agriculture (CSA) Practices in the Smallholder Farming System of South Africa. Sustainability. 2021; 13(12):6848. https://doi.org/10.3390/su13126848
Chicago/Turabian StyleObi, Ajuruchukwu, and Okuhle Maya. 2021. "Innovative Climate-Smart Agriculture (CSA) Practices in the Smallholder Farming System of South Africa" Sustainability 13, no. 12: 6848. https://doi.org/10.3390/su13126848