1. Introduction
The creation and consolidation of the HbbTV (hybrid broadcast broadband television) standard is generating scientific interest about its global implications in audiovisual and specific advertising, and how it can be reached more effectively for the consumer. It is the reason we consider it important to develop an experiment to detect the reaction and emotion of the spectators in front of a sample of ads, some of which include HbbTV options. The research questions are the following: does the order of the insertion of the interactive ads with different formats alter the emotional results in the audience? Is the intrusive content of interactive advertising formats decisive for obtaining acceptance from the viewer?
Increasing the chances of advertising profitability is the focus of most of the research. That higher return is usually associated with the emotions generated in the final consumer. Regarding interactivity and emotions, various investigations have been developed, both focused on audiovisuals and social networks. Thus, an investigation determined a relationship between emotion and attention [
1]. The link between attention and emotion was also evident in an experiment on television advertising [
2].
Neuromarketing is the main axis of experimental research on emotional reactions [
3], which includes the study of the cortex [
4] in the viewing of television advertisements [
5]. Facial expressions (specifically, happiness and sadness) in videos on YouTube have also been studied through Facial Coding [
6], as has the way in which emotion can influence the perception of YouTubers and in social networks [
7]. The image (in this case, photography) allows us to analyze the culinary style [
8]. Some research on face processing shows how people, in just 100 milliseconds, manage to intuitively generate judgments based on elements of the face’s physiognomy; these, in turn, are fast and intuitive [
9], and influence psychological processes such as confidence and perceived competence [
10].
According to Wang, Chen and Cao [
11], face processing supports our ability to understand the emotional implications of changes in the muscles of the face, this being a highly developed skill in human beings thanks to its evolutionary and social importance. Contreras, Banaji and Mitchell [
12] highlighted the discovery of a region in the brain that responds mainly to faces, called the fusiform gyrus, which has high cortical representation. This was an important step in cognitive neuroscience, as it has been shown that in this region more neuronal activity is generated when it comes to familiar faces, such as when recognized actors or comedians appear in a television commercial. On the other hand, Plutchik [
13] defines emotions as a state of psychological excitement with cognitive aspects derived from the context. Neuroscience classifies emotions as primary and secondary: the primary ones are accompanied by universal facial expressions or gestures, independent of culture, and the secondary ones are the result of the combination of several primaries.
Kayser [
14] defines the facial expression of emotions as the spontaneous and involuntary manifestation of an emotional experience that is shown subconsciously. To report an emotion that is being experienced, first of all, one must understand and note that this experience is caused by some type of sensation, and then one must interpret it. Many times, instead of the emotion as such, a feeling is reported, representing a filtered version of the feeling. The somatic marker theory proposed by Antonio Damasio states that emotions are presented as a visceral state that precedes the conscious processing of emotion [
15]. These sensations are derived from the response of the limbic system. The amygdala is the most involved structure; these states are associated with experience, and they create a memory trace, leading to the appearance of markers in similar situations. These approaches demonstrate the inherent connection between the brain and the body, and how bodily states such as facial expressions or physiological responses inform us about derived emotional states [
16].
The interactivity of the ads, and the excitement that they can bring as a springboard to success, imply the availability of a data flow, which is essential in the Broadband Society and cloud journalism [
17,
18]. We are in a phase of a digital services package: television, internet and telephony, the so-called triple-play [
19], the predecessor of the quintuple play (television, fixed and mobile internet, fixed and mobile telephony) [
20]. In this context, HbbTV is a synthesis of the collaboration between audiovisual and telecommunications, enthroning interactivity [
21].
In this context of the coexistence between the Internet and television, the data confirm the growing trend towards hybridization, led by the rise in the consumption of non-linear television and video on demand [
22]. It will collaborate with sustainability, as the COVID-19 pandemic has shown thanks to virtualizations and content consumption at home. In this sense, it is relevant to analyze the kind of content to consolidate this home activity and to fight against carbon footprints.
Second-screen services (for example, using a smartphone or tablet) encourage viewers to have new interaction formulas in which users incorporate TV content as a common thread. Therefore, standard solutions are proposed for secondary image services that are synchronized with the content of the broadcast [
23]. The user enjoys an enhanced streaming experience enriched with multimedia, text and social internet content on multiple devices. The end-to-end solution delegates the maintenance of sessions in the cloud to a server to couple and synchronize HbbTV applications and second applications based on HTML5, which overcomes the existing heterogeneous network interface barriers with current technological alternatives.
The confirmation of the technological viability of HbbTV encourages the advertising industry to investigate possible applications and possibilities for monetization. For advertising agencies, the combination of content and actions on social networks is a major obstacle that is linked to applications and content companies on the Internet (Over The Top or OTT). Advertising media agencies analyze possible changes in consumer buying behavior, while the first interactive advertising tests were carried out in Germany (ProSieben and RTL) in 2014 [
24]. Based on these tests and the growing number of metrics on the Internet, a real-time data controller is being developed which offers options for daily trading and programmatic buy inserts. The detector is shown without a watermark, that is, a steganographic formula that hides information about possible illegal uses of digital services.
In general, the incipient tests of interactive inserts (which allow the viewer to communicate with the content through the remote control) are inspired by or are identical to the indicators measured on the Internet. The most basic is the click-through rate, that is, the click/impression ratio. With HbbTV, the click-through rate reaches 6%, as evidenced by tests on the television channel 8Madrid, a thematic channel specializing in cinema, which broadcasts in the community of Madrid. Another measure is visibility, that is, the visibility of an ad. The expansion of ad blockers could affect the results of this indicator, although it is currently observed that, with HbbTV, minutes of zapping multiply the efficiency of the interaction between the viewer and the conversion, in addition to providing greater monetization [
25].
Access frequency (the number of effects per individual device) is another indicator to consider. In HbbTV tests, in 2015, in Germany and Spain, 90% of the audience engaged before the fifth time. The success approaches 100% with a twelve-time presentation. In terms of schedules, the mornings are more effective. In fact, a campaign in Spain for Letsbonus showed that the acquisition through HbbTV was more comfortable for the viewer on the second screen than on the main screen [
26].
HbbTV research began with the communicative and technological analysis of the standard, usability [
27], spatial navigation [
28] and educational applications [
29,
30,
31]. Another study that can be developed in the short term is the influence of 4K television on interactive solutions. With that in mind, Vodafone introduced its Vodafone Spain 4K TV service in 2018 to provide the most advanced user experience. In fact, Vodafone was the first operator in Spain to offer 4K channels and content on-demand. One of the keys to interactivity is the user interface, which is more visual and intuitive, and which supports multiple simultaneous recordings of content in the cloud.
Research shows that broadcasters use HbbTV to measure consumer viewing behavior more accurately [
32], posing certain privacy risks by revealing personal preferences. This describes a method to monitor viewing behavior without the knowledge and consent of the user. This method is possible on most channels using HbbTV without the user actively starting the HbbTV application. Such data can also be collected on an encrypted WiFi network.
As a new platform, HbbTV is a challenge for software developers. In general, such a standard requires a new software design in a very short time, supported by efficient and appropriate testing and verification over time. Furthermore, the designed system must be efficiently ported to different platforms and functionally verified with minimal effort. For this reason, a software architecture was proposed that simplifies the product development process and can be evaluated on a device compatible with HbbTV [
33].
HbbTV compatibility means that broadcasters can run dedicated Smart TV apps as a browser overlay on their TV channels. The HBB Next project and the HbbTV 2.0 standardization reflect the future call of the standard. HBB Next designs and implements several next-generation HbbTV frameworks, including multi-user identification, synchronization between media and device streams, multi-user recommendations, custom application reputation ratings and cloud download. The functions of HbbTV 2.0 are divided into four categories: browser, terminal, additional display and media. Support for the second screen, media synchronization and user identity management play a prominent role in HbbTV 2.0 [
34]. The consolidation of interactive culture [
35], in content production and circulation [
36] and consumer typologies [
37], completes the research framework carried out on HbbTV.
2. Materials and Methods
The research is experimental in nature. The enterprise Conforama (which is well known in Spain, in the sector of furniture, and is used to insert ads in the principal broadcasting channels) participated as an advertiser, and Blanquerna-URL and CECABLE (Center for Cable Studies) participated as academic and methodological advisers. The research, which was carried out in laboratories in Blanquerna (Barcelona, Spain) and the Universidad Pontificia Bolivariana (Medellín, Colombia) during 2020 and early 2021 (a time marked by the rigidities of the COVID-19 pandemic) consisted in the viewing of a block of ads between which three Conforama with interactive HbbTV formats were inserted, in order to detect the reaction and emotion of the spectators.
In order to calculate the sample, Idescat data were taken into account, and the corresponding projection was made by gender (women and men) and by age group (15 to 24 years, 25 to 34 years, 35 to 44 years, 45 to 54 years and 55 to 64 years) (
Table 1). The members of the sample (
n = 71) randomly filled out a questionnaire beforehand (which included questions about TV consumption, conventional TV and the use of platforms, the terminal used to receive TV contents, the availability of smart or HbbTV TV, preferences and ideas about advertising), and immediately afterwards they underwent the experiment, which consisted of viewing the series of nine advertisements.
Based on the data published in the National Institute of Statistics on the distribution of the population of this community in 2019 (
https://www.idescat.cat/pub/?id=aec&n=253&lang=es, accessed on 20 December 2020), five relevant age groups were the objects of study, between 15 and 64 years of age. The age group under 15 years of age was dismissed due to their low consumption of television. The section over 64 years of age was rejected because they are the ones that correspond to the highest consumption of this medium and, on the contrary, the ones with the least connection with interactive television. Thus, the aim was to focus the study on age groups with television consumption closer to the average. Each of the five age groups encompass 10-year age groups.
Once established into the five age groups, it was calculated, populationally, what percentage of inhabitants belonged to each of the groups and, in addition, what percentage were men or women. With this information, a study group of n = 71 was determined. Although from the point of view of quantitative research the sample is reduced, the true value of the sample resides in the individualized qualitative research that was created from the analysis of emotional reactions to the stimulus of interactive ads. With this, the sample corresponds to a statistical representation, and was adjusted to the reality of the studied community (sampling fear quotas).
The selection of the participants was carried out in a non-probabilistic way within the professional, academic and/or family environments of the researchers.
The previous questionnaire asked about the number of hours of daily television consumption (including conventional TV and digital platforms such as Netflix or HBO, both on weekdays and weekends), the approximate proportion between conventional TV and the rest of the platforms, the type of device on which most of this content is consumed (TV in the living room, TV in another area of the house, desktop computer, laptop used at home, laptop used outside the home, mobile phone at home, mobile phone away from home), the availability of Smart TV (and the use of its technical possibilities), the opinion on TV advertising, the cause of annoyance or liking for advertising, the preferred types of ads and the format of the preferred ad.
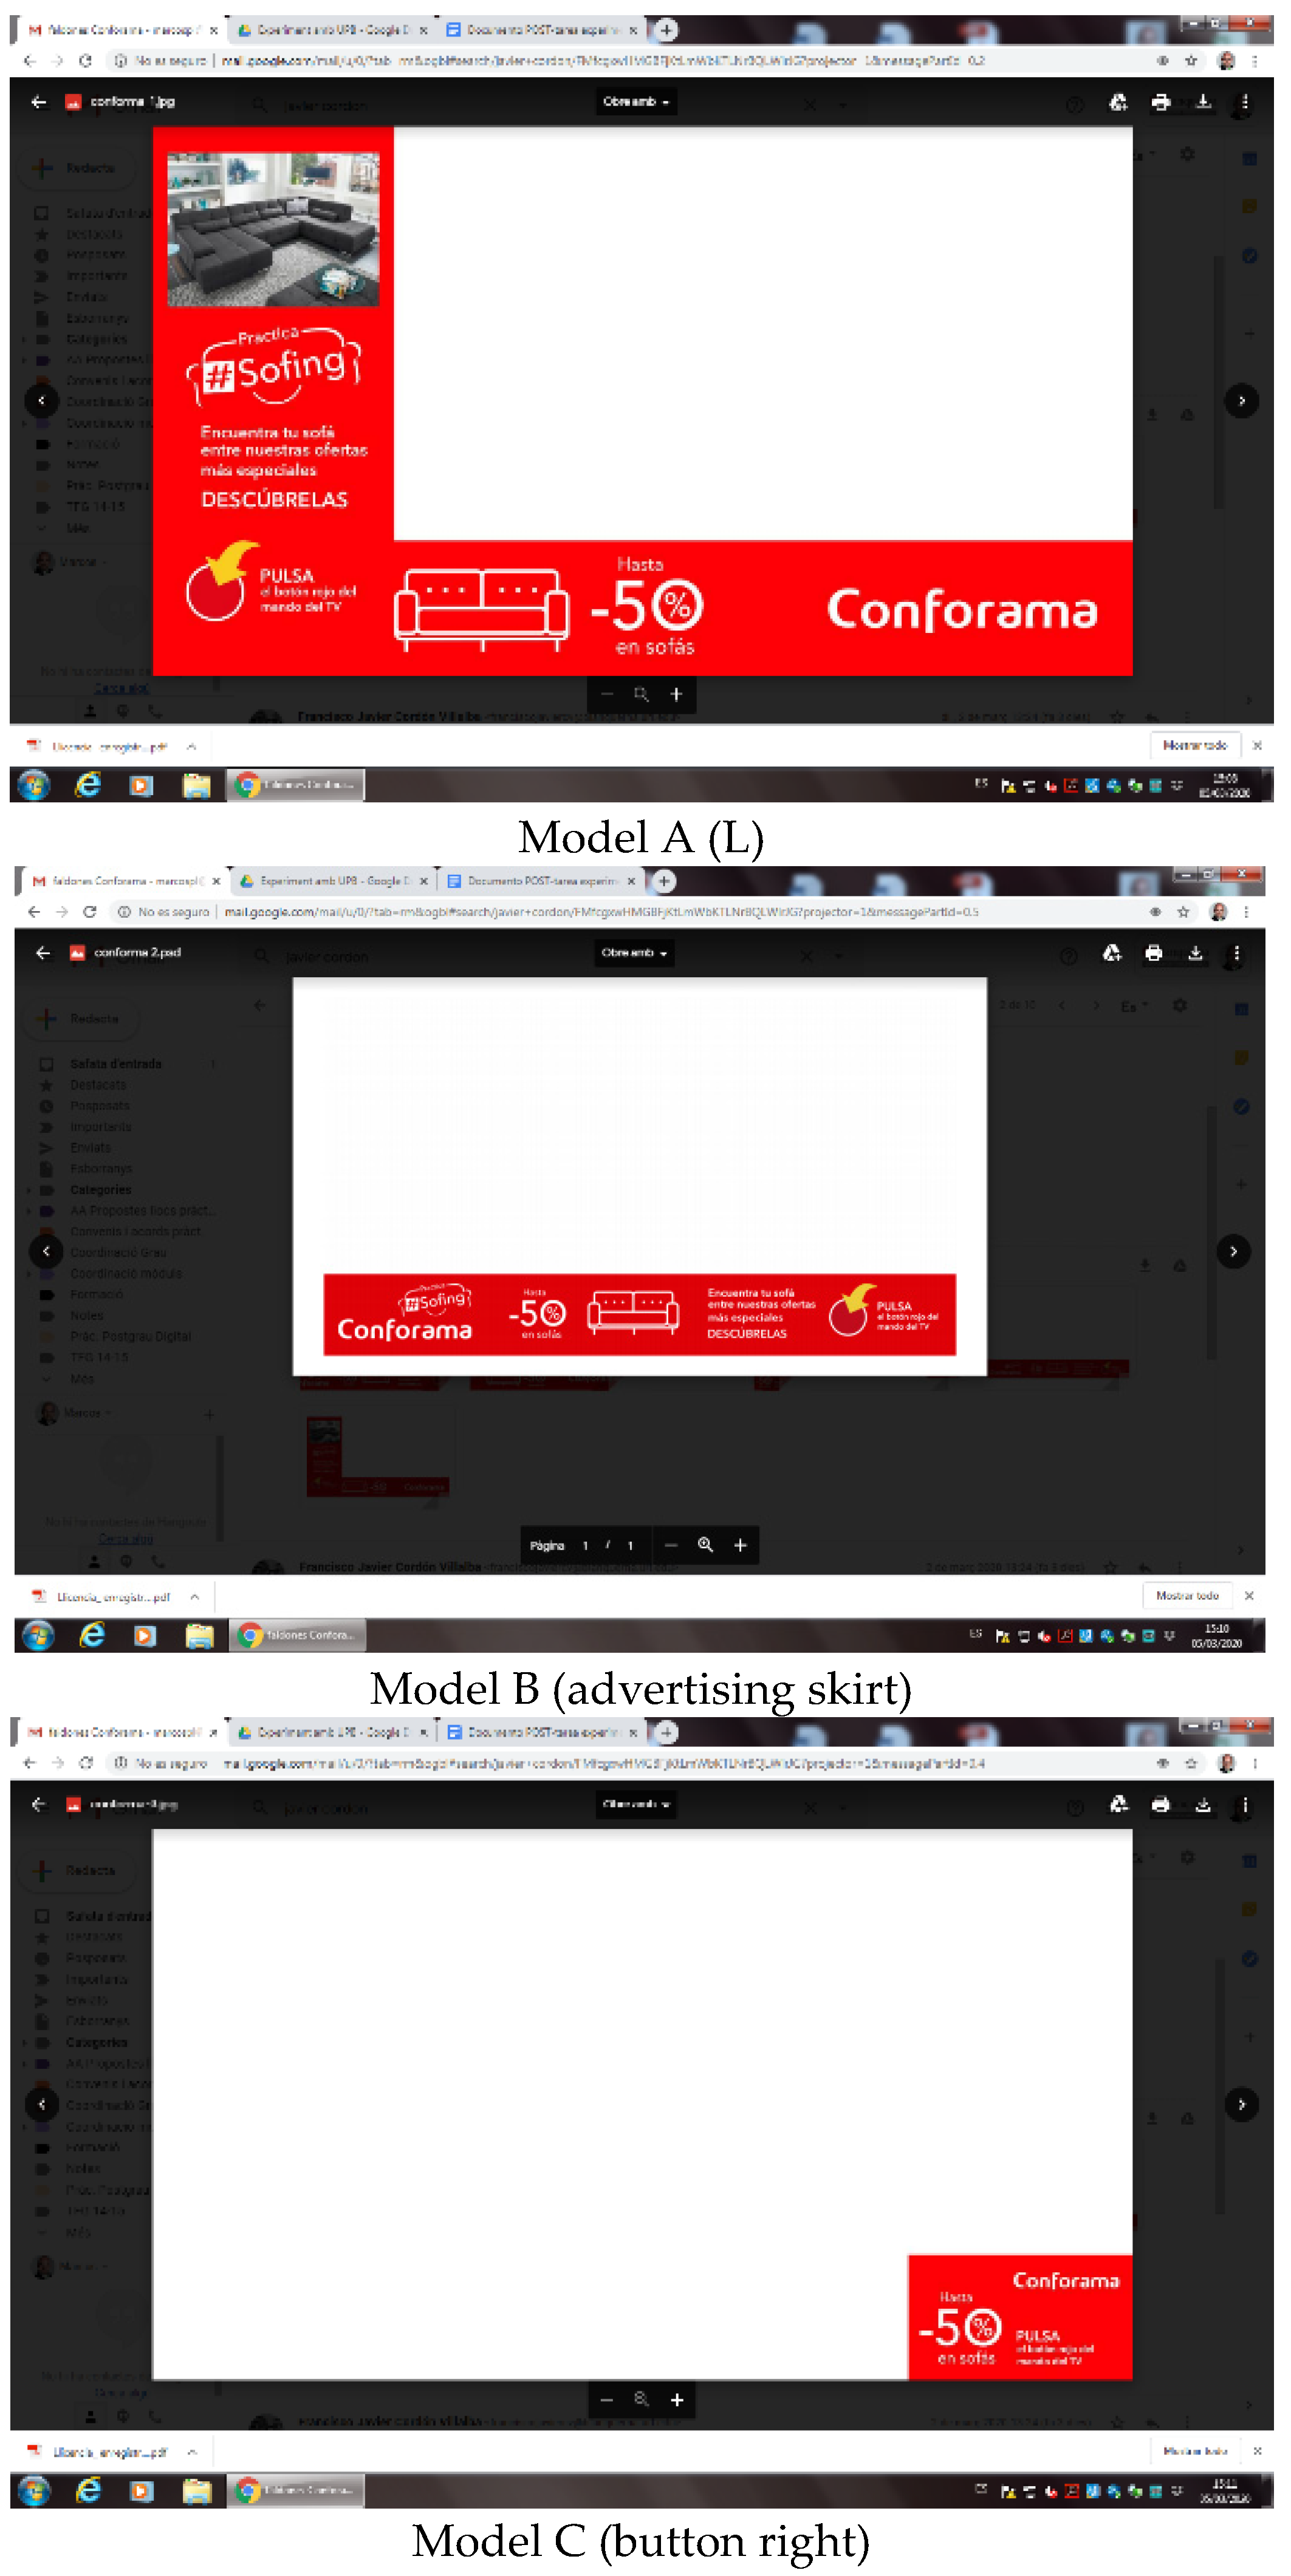
In the experiment, in a lab room of Blanquerna University, a clutch of conventional advertisements was created, among which an interactive advert was placed, with three versions (A = piece type L, B = piece type skirt and C = piece type button to the right) of the brand Conforama (image one). Ads from different sectors were chosen (chosen randomly after a previous neutrality test) so as not to condition the reaction of the members of the sample. In order to ensure balance, and that the type of ad content did not condition the response, combined sequences (ABC, ACB, BAC, BCA, CAB, CBA) were created. The ads belonged to the following companies, taking the first sequence as the basis: Suv Peugeot 2008, Mutua Madrileña, Interactivo A (Conforama), O2 Telefonía, Cola Cao Noir, Interactivo B (Conforama), Somat, Pullmantur cruises and interactive C (Conforama). The rotations combined the ad units: rotation 1, ABC (1, 2, A, 4, 5, B, 7, 8, C); rotation 2, ACB (1, 2, A, 4, 5, C, 7, 8, B); rotation 3, BAC (1, 2, B, 4, 5, A, 7, 8, C); rotation 4, BCA (1, 2, B, 4, 5, C, 7, 8, A); rotation 5, CAB (1, 2, C, 4, 5, A, 7, 8, B); and rotation 6, CBA (1, 2, C, 4, 5, B, 7, 8, A). The blocks totaled 3 minutes in length.
The facial images of the individuals were recorded. These recordings were digitally processed in Colombia, using a program that allows the identification of emotional reactions. It is the FaceReader 8™ software from the Dutch company Noldus (Wageningen, the Netherlands), which infers emotions through the measurement of 511 involuntary muscles of the face. This phase was developed in the Laboratory of Neuroscience and Consumer Behavior of the Universidad Pontifica Bolivariana after 6 h of purification and 10 h of graphing with the sample of 71 participants.
FaceReader 8™ is a piece of software which analyzes facial expression patterns with up to 90% accuracy [
38] and with this we intended to obtain objective answers in real-time in relation to the emotional aspect of the attitude towards the stimulus presented; in this case, the television spots. The software recognizes and evaluates facial expressions through the movements recorded by a camera and encodes muscle movements in a base of 44 action units (AU) identified by anthropologist Paul Ekman [
39]. In addition, it reconstructs the face in a three-dimensional X, Y, Z space, based on a 500-point finite element model.
It allows a robust and reliable measurement of seven facial reaction patterns, which represent seven basic patterns of emotion: angry, contempt, happy, displeased, sad, scared and surprised; it also considers a neutral state that indicates a lack of emotion [
38].
(p. 72)
It also measures the dimensions of valence (positive and negative emotions) and arousal (the degree of activation of the emotion) [
40]. The FaceReader 8™ provides additional information to conventional consumer tests in which interview or survey questionnaires are normally used.
After viewing the advertisements, the individuals in the sample filled out another questionnaire in which they were asked about the advertisement they preferred or that attracted more attention, about the detection of something special on the screen, about whether the Conforama ad offered interaction, about the most attractive formats of interaction (
Figure 1), if they would have interacted if they had a remote control, and what a spot should have in order for them to interact, i.e., a raffle or a direct prize.
It was intended to determine the emotional reactions when viewing the advertisements. These reactions are classified like this, adapting (combining anger and contempt in one variable) the indicators of [
38]: happy, sad, angry, surprised, scared and disgusted. In this way, the advertisers are offered guidance on the type of interactive ad that is most attractive.
The starting hypotheses were the following:
Hypothesis 1 (H1). The order of insertion of interactive ads with different formats does not alter the emotional result.
Hypothesis 2 (H2). Less intrusive interactive advertising formats generate more acceptance from the viewer.
3. Results
In the treatment of the images on the viewing of the advertisements, the result is cumulative, because during the viewing of the advertisements various emotions could be combined.
The results of the experiment with the FaceReader 8™ reflect a predominance of the feeling of anger (36%), ahead of sadness (27%), happiness and disgust (12%), surprise (11%), and fright (2%) (
Figure 2). Those reactions are spontaneous, motivated by the content of the ads.
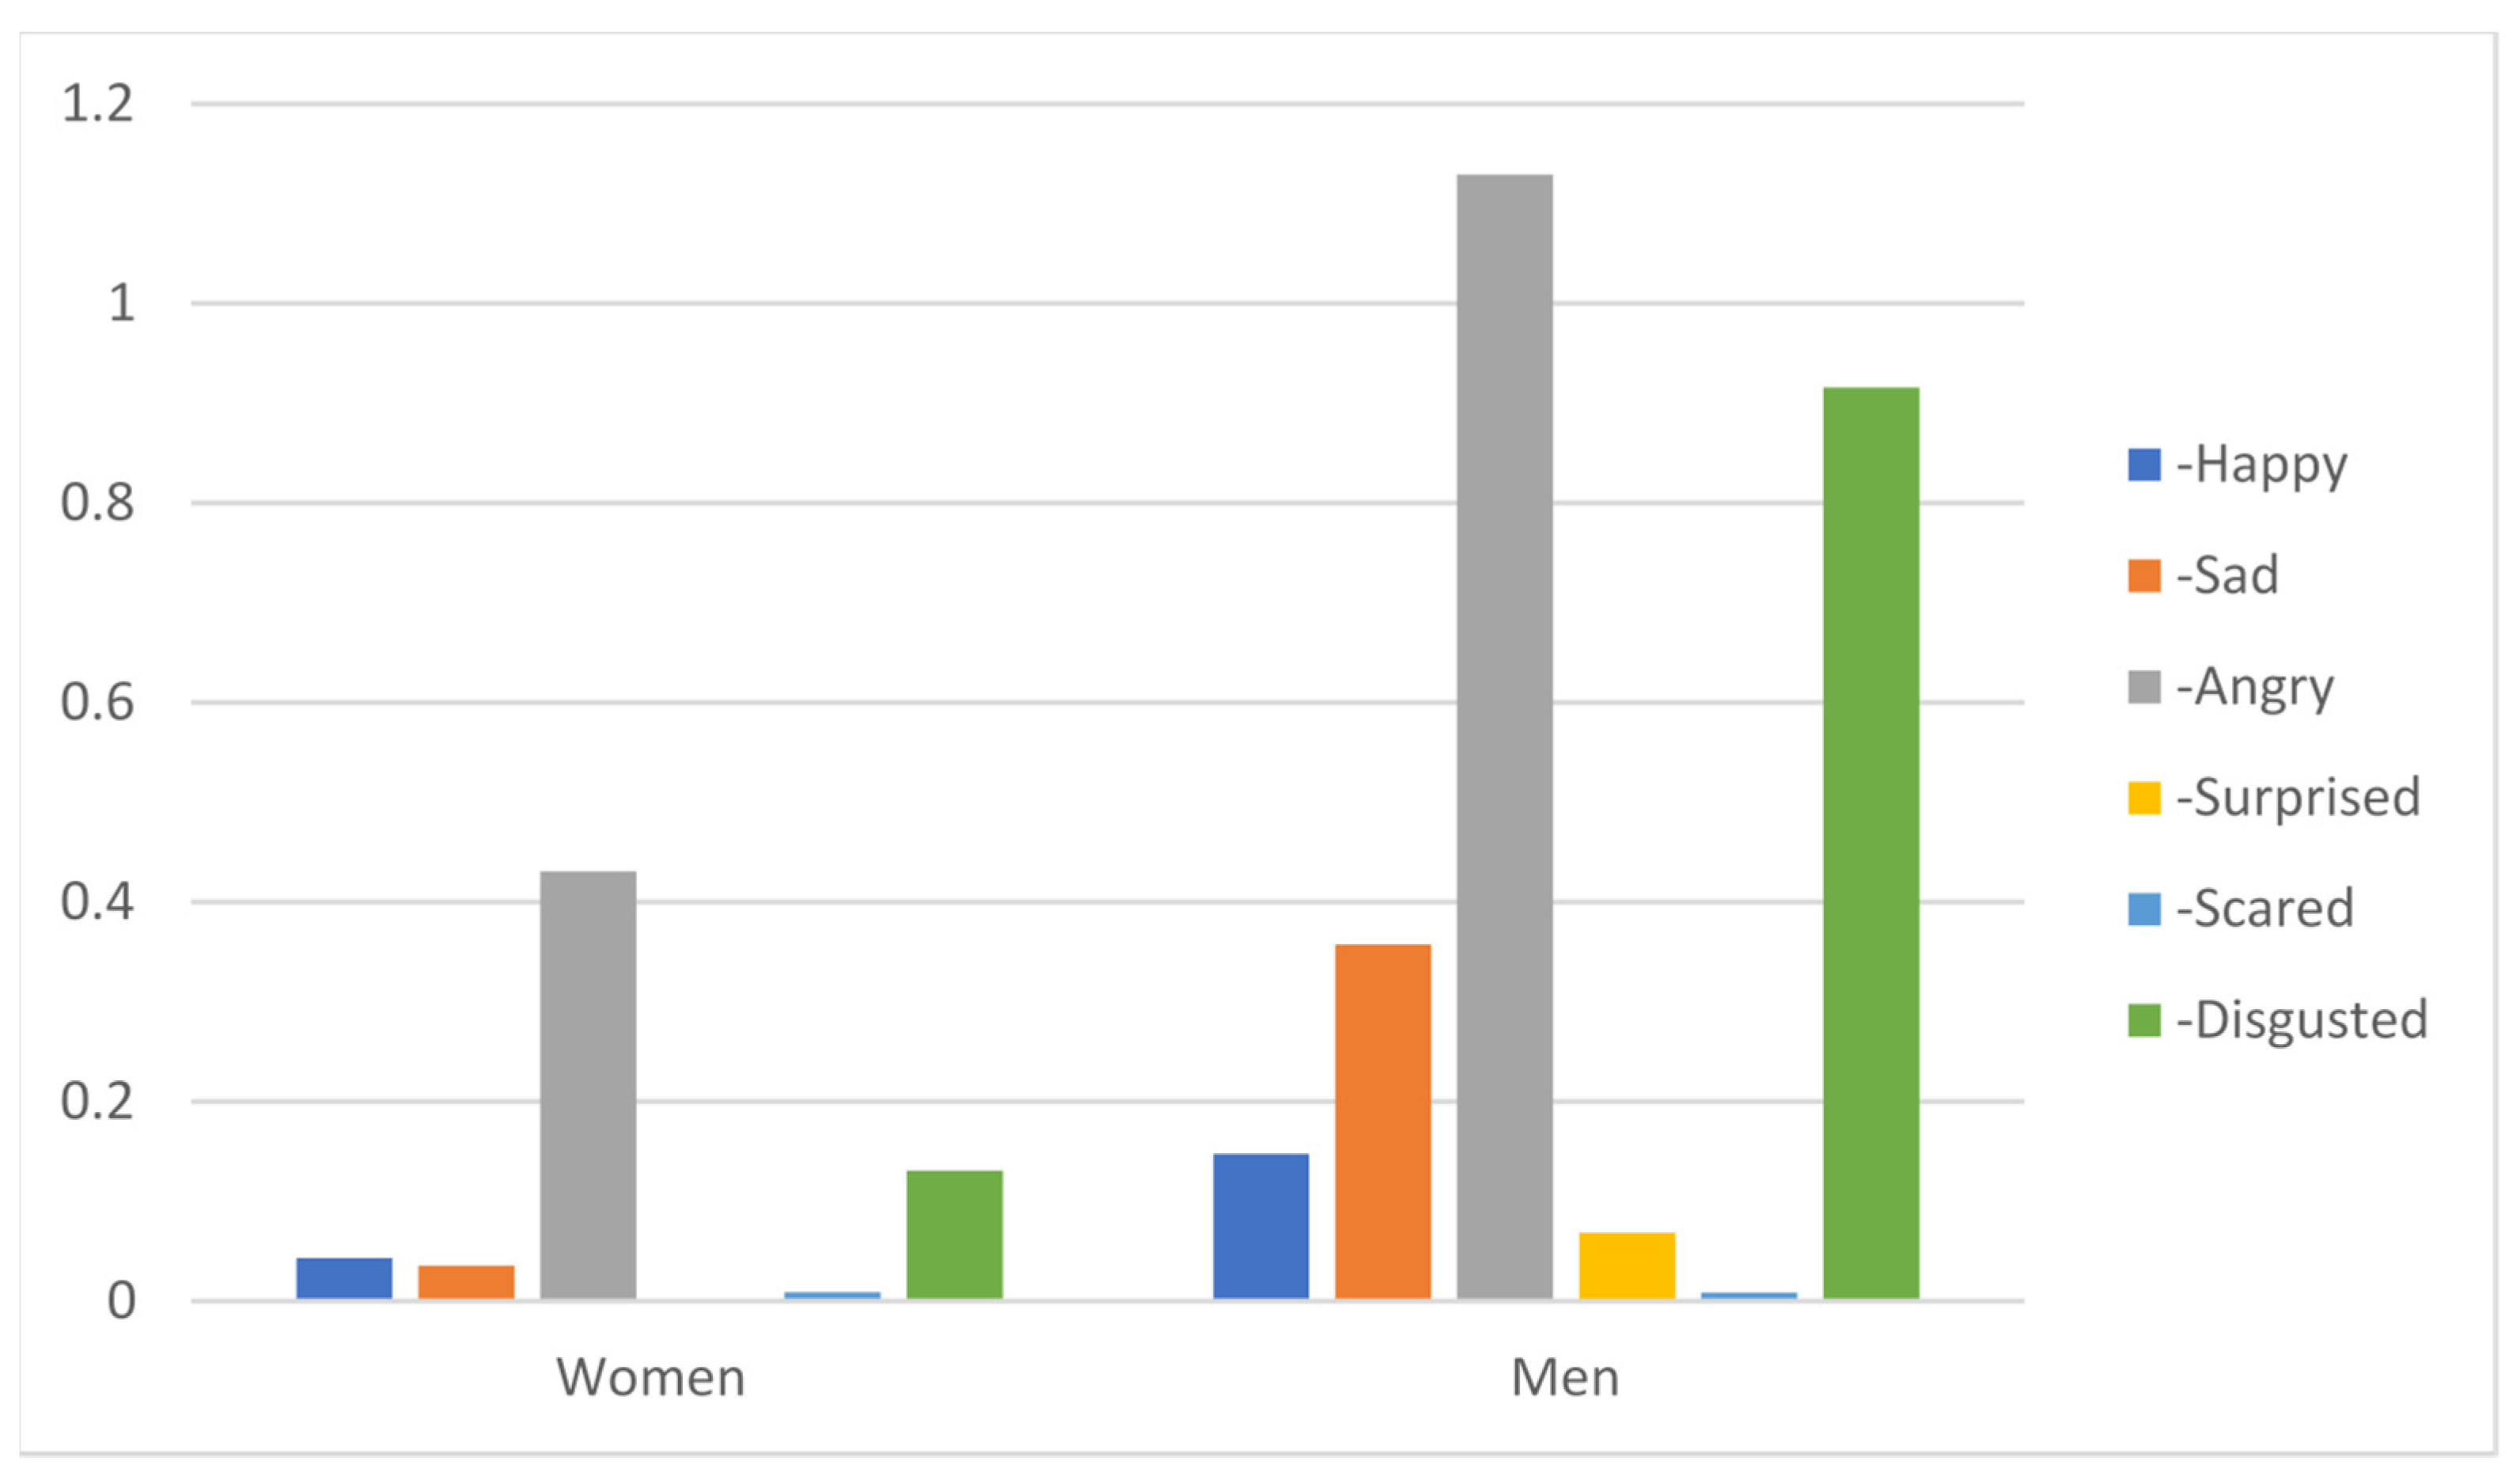
When the members of the sample viewed the advertising block in the ABC order, in the interactive advertisement in the L format (
Figure 3), anger was predominant, especially in the female gender, ahead of sadness and disgust. On the other hand, in the male gender, sadness predominated, slightly above anger or rage. In third place, the feeling of happiness was placed, probably due to the storytelling of the Conforama advertisements, in which two well-known comedians in Spain appear, who arouse ambivalent emotions. In the skirt format (
Figure 4) anger is triggered, and in the button on the right (
Figure 5), happiness is clearly imposed, both in women and in men. As was found in the subsequent qualitative test, this is due to the type of content of the ad, which generates one emotion or another. Therefore, the key to success is not due so much to the formats but to their content.
Interestingly, in the ACB order, the emotion of anger is maintained (and also extended to the male gender) in the L format (
Figure 6). It is curious that in the button on the right format (
Figure 7) happiness collapses and gives way to anger, and in the skirt format (
Figure 8) sadness reappears in men.
In the BAC order, anger monopolizes the sentiment of women and men. The growth of the feeling of sadness is noticeable in the BCA order in all three formats, and in the male gender. On the other hand, in the CAB order, in women, happiness governs in all three formats, and in men anger also governs in all three. In the order CBA, in women, the leading feeling is that of disgust (in the button on the right and L) and anger (skirt), while in men, sadness (button on the right and L) and disgust (skirt) governs. Based on the results obtained, H1 is validated (the order of the insertion of the interactive ads with different formats does not alter the emotional result).
Overall, in the sum of both sexes (
Table 2), anger dominates (in 11 of 18 cases, that is, 61.11%), followed by sadness (22.22%), disgust (11, 11%) and happiness (5.55%). In the L format, anger governs (66.66%), ahead of sadness and disgust (both with 16.66%). In the skirt format, anger also shows 66.66%, and sadness shows 33.33%. In the right button format, anger accumulates 50% of emotions, and happiness, sadness and disgust accumulate 16.66%.
Therefore, from a certain perspective, the right button (the least intrusive) becomes the one that generates the most acceptance. In the light of these data, H2 is validated, albeit in a tenuous way (the less intrusive interactive advertising formats generate more acceptance in the viewer).
4. Discussion and Conclusions
In any case, the insertions of advertisements into HbbTV carried out in a real way and scientifically analyzed in Spain [
26,
35] and Germany [
24] reflect that the best option is the exclusive block, or the last position in an ad unit, for reasons of greater attention and also for the reason of safeguarding the natural viewing time of the rest of the ads in the block.
The second criterion is the format. HbbTV mainly uses L-shaped, skirt and button inserts, in the image and likeness of what can happen on a web page, demonstrating the growing integration between audiovisual language and that of the Internet. This research shows that less intrusive interactive advertising formats generate more acceptance in the viewer. This is curious, because a priori it seems that more instructive formats can obtain more engagement with users, but this was not the case in this research. Nevertheless, this was a pioneering experiment, and we need more research to confirm this trend. Likewise, we must take into consideration other factors, for example the qualitative prolife of consumers, or the audience background. This means that a consumer of an occidental and democratic country (with a lot of broadcasting tradition) than a consumer of a country with a limited offer are not the same.
Furthermore, the development of interactivity and the use of digital terminals can improve sustainability from a socioeconomic point of view. With the COVID-19 pandemic, the hours of human beings following television and Internet contents have increased. Telecommuting is collaborating with environmental care, and HbbTV is the best audio-visual example of this trend. Consolidations of HbbTV will help sustainability.
A disturbing aspect of the research is that the most common emotions were negative, led by anger. This can be attributed to the content of the ad, starring characters that generate conflicting feelings, in line with what was stated by [
12]. This, added to a certain negative predisposition towards advertising, may explain this result. In any case—and this is positive—emotion is generated, and it has been proven that this and attention go hand in hand [
1]; in this, audiovisual companies might find a clue for their advertising creations.
For future research, it may be useful to combine new formats in interactive ads, to incorporate blocks with more or fewer insertions, to compare the results with exclusive blocks, or to have types of ads with a variety of storytelling, in order to try to outline what it is that the audience wants and what format (and narrated story) is the most profitable in terms of ad conversion.
The audiovisual market has been in demand in recent years for scientific research to guide the creatives of media agencies and television networks to more effectively impact audiences.
In this context, the emergence of HbbTV has raised high expectations in terms of the implementation of new advertising languages that exploit the potential of interactivity, one of the central axes of the digital ecosystem.
The scientific criteria upon which to focus experiments that help companies in terms of technology transfer are basically two: the location of the ad and its format. Regarding the location, this research shows that, apparently, the order of insertion of interactive ads with different formats does not alter the emotional result of the viewer. By way of limitation, more experiments would have to be carried out combining other types of ad, both in content and in the sector to which it belongs.


 ,
, 


