Abstract
The interlocking and packing of aggregate particles play a key role in achieving high level of linear viscoelastic properties and rutting resistance in asphalt mix for sustainable pavements. In this study, the quantitative effect of fractured aggregate particles (FAPs) on loading (i.e., 500 kPa normal stress), along with the resilience properties of asphalt mixes, was evaluated. Linear and nonlinear stress behaviors of aggregates (from direct shear test) and asphalt mixes (from resilient modulus test) were analyzed. A new quantitative parameter (linear stress ratio), i.e., linear stress (Pi)/maximum stress (Pmax), is proposed to be used in selection of aggregates for asphalt mixes. It was observed that 15.5% increase in FAPs caused 19.5% increase in ϕ and 70.7% increase in linear stress ratio (LSR). The same content of FAPs resulted in 29.4% and 36% increases in total resilient modulus (MRT) and 34.2% and 24.5% increases in instantaneous resilient modulus (MRI) for 0.1 and 0.3 s load durations, respectively. The proposed LSR is observed to be superior to conventionally used ϕ for aggregate resistance in design of flexible pavements.
1. Introduction
Roads comprise particulate composite materials, i.e., aggregate and binder []; among them, the aggregate is a primary factor influencing road performance [,], as hot mix asphalt (HMA) consists of 94 to 95% of aggregate by mass. Aggregates are the main structural framework of asphalt pavements, which absorb the stresses induced by the vehicles. It is important to mention that shape of aggregate particles plays a key role in controlling the performance of asphalt mixes []. The Marshall method is still used for the preparation of asphalt mixes worldwide, and the key parameters considered in design are VMA, VFA, air voids, density, stability and flow. These parameters are related to the packing characteristics of the aggregate particles which further relate to the shape and texture of particles. The relationships between Marshall stability and morphological properties of aggregates are well documented in literature [].
The quality of asphalt mix depends upon the morphology, densification and interlocking between the aggregate particles [,,,,,]. The performance of asphalt pavement is affected by the gradation of the aggregate []. The increase in proportion of fractured aggregate particles causes enhancement in HMA Marshall stability []. Geometry of aggregate particles can be defined by three parameters, namely form, angularity and texture. Angularity depicts the sharpness of the coarse aggregate particles and plays a critical role in enhancement of rutting resistance of asphalt pavement. The use of an aggregate imaging system is considered a precise method for the measurement of aggregate angularity, but its cost is an obstacle for its wide implementation []. ASTM D5821 [] can be used to describe the fractured faces of aggregate particles depicting angular, rough and broken surfaces. The physical properties of coarse aggregate such as angularity, size and shape of the particles affect the performance of asphalt mixes significantly []. The surface texture of coarse aggregate particles has a significant effect on the resilient modulus []. Irregular morphology of aggregate causes an increase in resilient modulus of asphalt mix at 25 °C [].
The packing of aggregate depicts the level of density, which is strongly related to the strength of aggregate and the resilience of the asphalt mix. In a sand–gravel mix, a lesser quantity (e.g., 10%) of gravel is representative of the floating condition, and by increasing the gravel quantity, the void ratio decreases and reaches the minimum void ratio level. If the sand–gravel mix shows minimum void ratio, the gravel particles are considered in nonfloating condition. The close packing of gravel particles in nonfloating condition shows higher friction angle and higher shear stresses [].
The resistance of aggregate structure (shape and angularity) to deformation is more important than the volumetric properties of aggregates []. Dense sand–gravel mixtures with different shapes of coarse particles show different angles of internal friction (ϕ) and impart variable extent of elastic properties to asphalt mixes. The rounded particles present lower ϕ, whereas the angular particles show higher values of ϕ due to interlocking of sharp edges. ϕ varies from 28.5 to 35° for rounded uniform particles and from 34 to 46° for angular well-graded particles for loose and dense conditions, respectively []. The internal friction of gravel can be assessed from the size and shape of aggregate particles []. A minor change in shear strength was observed when increasing the maximum size of gravel from ¾ to 3 inch in 20% gravel plus 80% sand mix, but no change was observed in 50% gravel plus 50% sand mix []. This shows that interlocking and angularity of aggregate are the significant factors for enhancement in ϕ as compared to the increase in maximum particle size. The ϕ values for low to high relative densities may range from 22 to 45° for rounded sandy material and 27 to 52° for angular gravelly material []. An increase in round gravel content from 10 to 50% in sand–gravel mix caused an increase in angle of internal friction from 35 to 43° with corresponding increase in density from 1.62 to 1.66 g/cm3. Increase in angular gravel content from 10 to 50% caused an increase in angle of internal friction from 34 to 45° with increase in density from 1.62 to 1.66 g/cm3 []. The angularity of aggregates improves the resistance to permanent deformation in asphalt pavements []. The increase in angularity of coarse aggregate causes a significant decrease in permanent deformation and rutting index []. Increase in aggregate angularity also causes reduction in fracture damage due to higher content of bitumen required in mix deign [].
In recent years, various researchers carried out experimentation regarding the stiffness of asphalt mixes, which is based on the properties of asphalt constituents, i.e., aggregate and asphalt binder [,,,,,,,,,,,,]. Many studies have explored the effects of different types of aggregate and gradations on resilient modulus (MR) of asphalt mixes. The MR of asphalt mix is significantly affected by the change in aggregate type and gradation [].
In mechanistic–empirical design and analysis of flexible pavements, the stiffness properties of aggregate in different layers are related to stresses and strains induced by the vehicle loads []. The main outcome of stress–strain behavior of pavement materials is MR, which is an essential parameter to be used for the assessment of rutting and fatigue in pavements [,]. MR is the key input parameter used for the design and performance of flexible pavements []. MR is evaluated in the laboratory by repeated loading applied on the specimens of asphalt mixes in different waveforms; haversine waveform is usually employed as it closely simulates the traffic loading on pavements [,]. MR is considerably affected by the loading type, loading time (vehicle speed) and mix type [,]. MR of asphalt mixes was significantly improved by using coarse aggregates with more irregular morphologies at 25 °C []. Good correlation between MR and the maximum aggregate size can be observed when aggregates having maximum size of 3/8, 1/2, 3/4, 1 and 1.5 inches are used []. If the diameter/maximum nominal aggregate size ratio increases, the resilient modulus of asphalt mixes decreases [,].
It is not realistic to consider the asphaltic layer as linear viscoelastic and other layers as elastic during viscoelastic analysis of pavements []. The nonlinear behavior of pavement materials was cited by different researchers []. Heavy truck loading induces the nonlinear viscoelastic deformation due to very high stresses on the wearing surface of flexible pavements. The nonlinear deformations are very critical in the prediction of damage for flexible pavements []. The deformation curve of haversine waveform shows viscoelastic and viscoplastic portions. The viscoelastic portion of a haversine curve further comprises linear viscoelastic and nonlinear viscoelastic deformation when subjected to repeated loads due to heavy traffic [,]. The asphalt mixes in flexible pavements show viscoelastic, i.e., elastic and viscous (time-dependent), characteristics that are significant for durability of flexible pavements []. ASTM D7369 [] explains that traffic loading causes instantaneous deformation (for a very short interval of time) and total deformation (during total duration of application of load) in pavements.
Rare experimentation is seen in the literature on the effect of fractured aggregate particles (FAPs) on the instantaneous and total deformation caused by traffic loading for 0.1 and 0.3 s load durations at 25 °C.
It is well established that resilient modulus depends on the properties of binder and aggregates. It is also observed that quantity of FAPs of coarse aggregate or friction angle cannot characterize the interlocking of aggregate. So, instead of ϕ, aggregate should be characterized by a new parameter that may be used to precisely predict the relation of aggregate properties with resilience of asphalt mixes.
The specific objectives of the study were as follows:
- Proposing a new parameter “linear stress ratio” (LSR), i.e., linear stress (Pi)/maximum stress (Pmax), for quality control in aggregate selection for asphalt mixes.
- Determining the effect of fractured aggregate particles (FAPs) on
- Friction angle and linear stress ratio of aggregates;
- Stability, indirect tensile strength (ITS) and resilient modulus of the asphalt mixes.
- Determining the relation of friction angle and linear stress ratio of aggregate with resilience properties of asphalt mixes.
2. Materials and Methods
The materials used in this research are the asphalt binder and single type of aggregate for gradations containing different proportions of fractured aggregate particles (FAPs). The fractured particles comprised particles of different shapes and angularity.
2.1. Aggregate
The aggregate samples of diverse particle sizes with high crushing strength and impact value were selected from a limestone quarry. These aggregates have been predominantly used in the construction of pavement subjected to heavy traffic loads []. Four wearing course (WC) gradations were employed in this study. The gradations included D-4, D-5 (ASTM D3515) [], SP-B (Superpave) [] and MS-2 (Asphalt Institute) []. The characterization of aggregates was performed using various tests, including flakiness index, elongation index, Los Angeles abrasion value, water absorption, soundness, uncompacted voids and sand equivalent.
The fractured aggregate particles (FAPs) in the coarse aggregate were determined by ASTM D5821 []. The FAPs determine the extent of interlocking between the aggregate particles. The increase in interlocking indicates the enhancement in indirect tensile strength (ITS) and stiffness properties, i.e., instantaneous resilient modulus (MRI) and total resilient modulus (MRT), of asphalt mixes. It was observed that increase in FAPs and ϕ caused enhancement in ITS, stability, MRI and MRT. The FAPs were selected manually and visually to prepare samples of D-4, SP-B, D-5 and MS-2 as shown in Figure 1 and Figure 2. The angularity was observed to be in the order of D-4 > SP-B > D-5 > MS-2. The visual extent of angularity and number of outer edges can be seen from top view of aggregate particles presented in Figure 1 and Figure 2. The number of main outer edges are in the increasing trend along the order of D-4, SP-B, D-5 and MS-2. The FAPs of D-4 gradation have fewer edges in the top view of aggregates. D-4 gradation showed angles less than 45° between the edges, depicting high interlocking. MS-2 gradation showed angles greater than 90° between the edges, which resulted in almost rounded shapes of particles. Hence, the D-4 gradation presented higher interlocking as compared to MS-2. The numbers of edges on the outer periphery of typical particles are 3, 5, 6 and 7 for D-4, SP-B, D-5 and MS-2, respectively, as seen from top view of aggregates (Figure 1). Figure 2 presents the close arrangement and packing of coarse aggregate particles of D-4, SP-B, D-5 and MS-2, showing the possible shearing lines depicting the decrease in interlocking for the order D-4, SP-B, D-5 and MS-2. The increased interlocking as seen in D-4 gradation may result in higher resistance during shearing of aggregate. Ultimately, a higher level of shearing resistance is expected in case of D-4 as compared to MS-2.
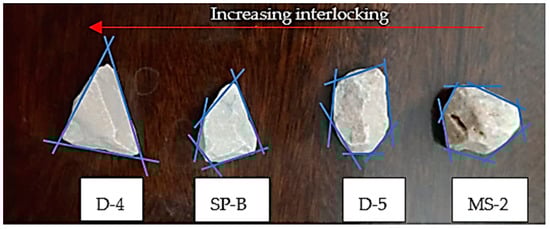
Figure 1.
Typical shapes of particles of D-4, SP-B, D-5 and MS-2 (top view).
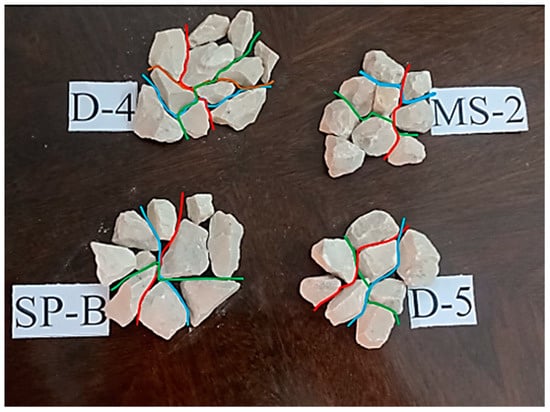
Figure 2.
Shape and packing of aggregate particles shown in samples of D-4, SP-B, D-5 and MS-2 (top view).
Figure 1 and Figure 2 show the shapes, projections and packing of aggregate particles as observed from top view. However, the side view of the particle surface boundary (contour) is also needed for the complete comparison of projections from the top and side views. A simple, prompt and approximate assessment of undulations and projections was used. A container was selected with depth and width more than two times the maximum size of aggregate particles. The length of container was able to accommodate at least four particles. The container was filled with wet plaster of Paris that was leveled horizontally. The gravel particles were placed on the fresh wet surface of plaster of Paris and pressed up to a predetermined reference line for one face and a second face near each other. The 3D imprint of the gravel was obtained for both faces. One line of imprints showed the first face and the other line showed the second face. Then, the surface of plaster of Paris was cut vertically, showing the contour of the side face of particles which was made clearly visible by ink marker line. The comparative number of projections (undulations) were counted for each particle of samples selected from four gradations. The projections of particles were compared with each other, which depicted the friction and interlocking level of each gradation. This method is approximate and provides a prompt and fair comparison of the interlocking level of aggregate particles in the field without using costly and time-consuming imaging methods. Figure 3 shows the contour of the side view for one face of coarse aggregate particles for D-4, SP-B, D-5 and MS-2 gradations. The vertical contour line in Figure 3 shows the large angles between faces of MS-2 and small angles between faces of D-4 gradation. D-4 gradation exhibited the greater interlocking potential of fractured particles.
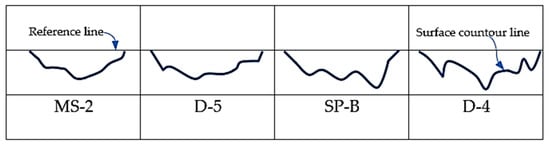
Figure 3.
Contour of surface of coarse aggregate particles (side view).
It is observed that all approaches used for quality assessment of aggregates in Figure 1, Figure 2 and Figure 3 are qualitative and can be used as supportive techniques with ASTM D5821, which is the quantitative method for the selection of aggregates on a quality basis.
The proposed qualitative assessment for the selection of aggregates in the field can be applied to support the quantitative criteria of ASTM D5821 in the following steps:
- Place the aggregate particles of different samples on the horizontal surface and select the aggregate with fewer edges with angles less than 45° (2D view of Figure 1).
- Make the manual arrangement of aggregate particles with possible dense packing and draw possible shear planes as observed from the top view. Select the sample with fewer shear planes (2D view of Figure 2).
- Make the contour of side view of 3D cavity obtained by pressing the particle in wet plaster of Paris as shown in Figure 3. Select the sample with the higher number of projections observed in the contour line of the surface of particles.
The above-mentioned three steps will enable selecting the aggregate sample with maximum resistance between particles to achieve the high quality of asphalt mixes. After completing the assessment of aggregates in the above three steps, the four-step quantitative procedure of ASTM D5821 should be applied for the determination of FAPs. The proposed three-step procedure in this study is the qualitative preassessment for high resistance of angular aggregate particles before performing the quantitative ASTM D5821 test. The proposed study on aggregate particles makes it possible to use 2D and 3D supportive criteria before performing the ASTM D5821 test. This study of aggregate particles, if used as a supportive criterion for ASTM D5821, will be helpful to select the aggregate sample expected to exhibit more resistive behavior in direct shear tests. The high resistance behavior of aggregate particles will result in asphalt mixes with high resistance to vehicle loads.
Direct Shear Test
The direct shear test is most commonly used for the determination of shear strength of gravels. In this research, large-scale direct shear test was performed for the mix of fine and coarse aggregates. The size of direct shear box was 300 by 300 by 200 mm. The samples were prepared at maximum dry density (γdmax). The large box direct shear test method was used for aggregate testing in this study []. The gap size was set to D85 (aggregate size at which 85% material is smaller) for each sample based on the gradation curve. D85 was selected due to the frictional interface, and it is also related to the review of test methods presented in standard ASTM D5321 []. The load cells and LVDTs were calibrated before testing. The shear displacement was 8 mm, and the test was performed at strain rate of 0.425 mm/min. The samples were subjected to normal stresses of 300, 400 and 500 kPa, which corresponded to light, medium and heavy vehicle loads. The same range of normal stress was adopted in all tests to assess the effect of gravel proportion and content of FAPs. For each normal load, the corresponding shear stress was evaluated for a specific range of shear displacement, i.e., 8 mm. Angle of internal friction (ϕ) was determined for each specimen according to the best-fit line of the Mohr–Coulomb (MC) failure envelope.
2.2. Asphalt Binder
Asphalt binder of 40/50 penetration grade was selected for this research. Asphalt binder was characterized by conventional tests such as penetration test (ASTM D5) [], softening point test (ASTM D36) [], ductility test (ASTM D113) [], flash point test (ASTM D92) [] and others.
The performance-based properties of asphalt binder were evaluated using AASHTO-M 320 [] performance grade (PG) binder specifications. These properties were determined using several types of equipment, including rotational viscometer (RV), dynamic shear rheometer (DSR), rolling thin film oven (RTFO), pressure aging vessel (PAV) and bending beam rheometer (BBR). The test conditions are briefly described in the following lines.
To check the mixability and workability of the asphalt binder, rotational viscosity test was performed in accordance with AASHTO-T 316 []. The rotational viscosity values were determined at seven temperatures ranging from 125 to 185 °C.
The rheological properties of the asphalt binder were determined using dynamic shear rheometer (DSR) as per AASHTO-T 315 []. The DSR test was performed under controlled-stress loading condition using 1.59 Hz frequency at high (46–82 °C) and intermediate (7–31 °C) temperature ranges. Samples were tested in three aging conditions, i.e., original, rolling thin film oven (RTFO) aged and pressure aging vessel (PAV) aging conditions. To simulate the short-term aging of binder, RTFO test was performed as per AASHTO-T 240 []. The PAV test was conducted on short-term aged samples following AASHTO-R 28 [] to simulate the long-term aging effects.
Low-temperature cracking performance of asphalt binder was evaluated using BBR test in accordance with AASHTO-T 313 []. PAV-aged samples were evaluated for creep stiffness (S) and m-value at three temperatures: −6, −12 and −18 °C. The low-temperature performance grade was determined using S and m values.
2.3. Asphalt Mixes
Marshall Mix Design
Marshall mix design method as per ASTM D6926 [] was used for the determination of optimum bitumen content (OBC) of asphalt mixes. The target air voids were kept at 4%. All volumetric parameters were checked against the recommended values at 4% air voids.
Aggregate gradations with optimum bitumen content (OBC) were blended to prepare asphalt mixes by Marshall mix design method. Four wearing course (WC) asphalt mixes involving 40/50 binder and four gradations D-4, SP-B, D-5 and MS-2 were utilized for the determination of volumetric properties and OBC. After the blending process, the mixes were left in an oven for four hours at 135 ± 3 °C to meet the short-term aging criteria. Gyratory compactor was used for the preparation of specimens for indirect tensile strength (ITS) and resilient modulus (MR) test as per AASHTO-T 312 []. The specimens were compacted at a constant vertical pressure of 600 ± 18 kPa using 30 ± 0.5 revolutions per minute. Internal angle of 1.16 ± 0.02 degrees was maintained during the compaction process. Two hundred five gyrations were applied to prepare the specimens.
2.4. Indirect Tensile Strength (ITS) Test
To determine the tensile properties of WC asphalt mixes prepared by gyratory compaction, indirect tensile strength (ITS) test was performed as per ASTM D6931 []. The ITS values of asphalt mixes were evaluated at 25 °C using a universal testing machine (UTM). The UTM is a computer-controlled hydraulic machine that consists of a loading assembly and a temperature-controlled chamber (Figure 4). A compressive load along a diametrical plane through two opposite loading strips was applied to determine the ITS of the samples. The specimens were conditioned for 4 h prior to testing in the temperature-controlled chamber. The specimens of wearing course had 50.4 mm thickness and 99 mm diameter. ITS was calculated using Equation (1).
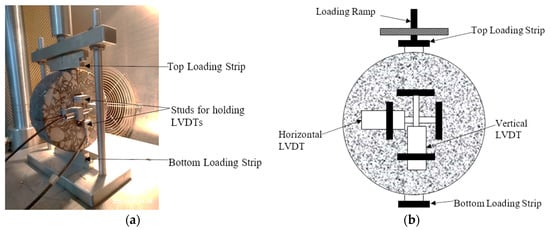
Figure 4.
(a) Resilient modulus test setup, (b) schematic for test.
- St = indirect tensile strength of specimen (kPa);
- P = maximum value of load taken by specimen before failure (N);
- D = diameter of specimen (mm);
- T = thickness of specimen (mm).
2.5. Resilient Modulus (MR) Test
MR test as per ASTM D7369 was conducted on WC asphalt mixes for the evaluation of instantaneous resilient modulus (MRI) and total resilient modulus (MRT). MR values of asphalt mixes were determined using a universal testing machine (UTM), as shown in Figure 4. The specimens were loaded along the diametral axis through a top-loading strip. The dimension of the loading strip was 12.7 mm.
Throughout the conditioning and testing period, the test temperature of 25 ± 0.5 °C was maintained in the temperature-controlled chamber. Linear variable differential transducers (LVDTs) and the load cell were used to measure and record the deformations and applied loads, respectively. The load and deformation measurements were monitored continuously through a data acquisition system (capable of recording 500 scans per second). The measurement of both horizontal and vertical deformations of the specimens was conducted by mounting two LVDTs on each face with glued studs. The LVDTs were mounted between gauge points along the horizontal and vertical diameters, maintaining a gauge length of 43 mm. To ensure the horizontal and vertical alignment of LVDTs, an alignment device was used and the diametral axes were marked.
The specimens were conditioned in the temperature-controlled chamber for 6 h prior to testing. A cyclic haversine loading pattern at frequencies of 0.1 and 0.3 Hz was applied with 0.9 and 0.7 s rest periods, respectively. The total load was taken as sum of the cyclic load and the contact load (i.e., load to keep the sample in touch with loading plunger of the UTM) in each loading sequence. The magnitude of the cyclic load was calculated as 10% of ITS of each mix. After 100 cycles of preconditioning, the resilient modulus was reported as the average of first five consecutive cycles (having less than 1% change). The preconditioning of specimen was performed applying 100 cycles initially along the diametral axis followed by rotating the specimen through 90°.
The total resilient modulus was calculated using Equation (2) and Poisson’s ratio calculated from Equation (3) [].
- MR = total resilient modulus, MPa;
- t = thickness of specimen, mm;
- μ = total Poisson’s ratio (calculated using Equation (3));
- Pcyclic = peak cyclic load applied to the specimens, N;
- Pcyclic = Pmax − Pcontact;
- Pmax = maximum applied load, N;
- Pcontact = contact load, N;
- = total recoverable horizontal deformation, mm;
- .
3. Results
The test results of aggregate properties, analysis of binder and performance of asphalt mixes are presented in the following paragraphs.
3.1. Aggregate Test Results
Figure 5 presents the gradation curves of the aggregate showing different quantities of fractured aggregate particles (FAPs). These curves fall in the well-known aggregate size bands, i.e., D-4, D-5, SP-B and MS-2. The properties of aggregate are presented in Table 1. The maximum densities (Table 2) of the four aggregate gradations were determined by the rodded compaction method. Maximum density, angle of internal friction and quantity (by weight) of fractured aggregate particles (ASTM D5821) [] were evaluated for all gradations and are presented in Table 2.
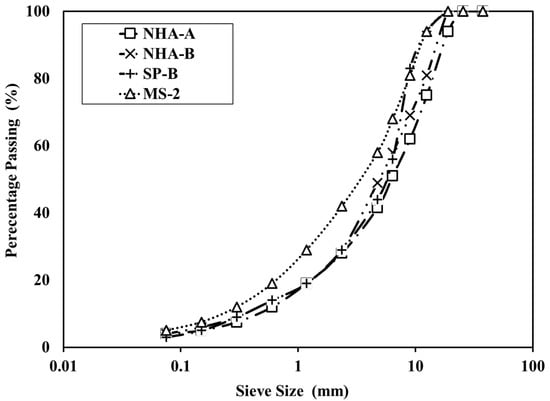
Figure 5.
Gradation curves of D-4, SP-B, D-5 and MS-2.

Table 1.
Physical properties of aggregate.
Table 2.
Fractured particles, maximum density and friction angle of aggregate gradations.
D-4, SP-B, D-5 and MS-2 gradations were characterized for use in asphalt mixes based on coarse proportion of FAPs. D-4 gradation was selected for detailed analysis of elastic parameter determined from the initial portion of the load–deformation curve. The D-4 gradation was further divided in six proportions, namely D-4-70, D-4-74, D-4-78, D-4-82, D-4-86 and D-4-90. These six proportions comprised FAPs as 70%, 74%, 78%, 82%, 86% and 90%, which resulted in angles of internal friction (ϕ) of 37.8, 40.6, 44.6, 46.5, 52 and 56°, respectively. The stress–strain curves of direct shear tests conducted on D-4-70 to D-4-90 proportions are presented in Figure 6.
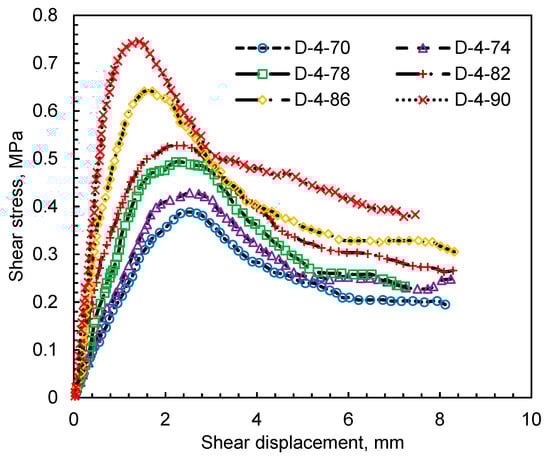
Figure 6.
Typical stress–strain curves of direct shear test at 500 kPa normal stress.
Presented in Figure 7 are the stress–strain curves of direct shear tests performed on MS-2, D-5 and SP-B gradations. The detailed evaluation of linear stress ratio, i.e., linear stress (Pi)/maximum stress (Pmax), for SP-B is also shown in Figure 7, where Pi represents the slope of linear stress. The results of direct shear tests carried out in this study are congruent to published literature [].
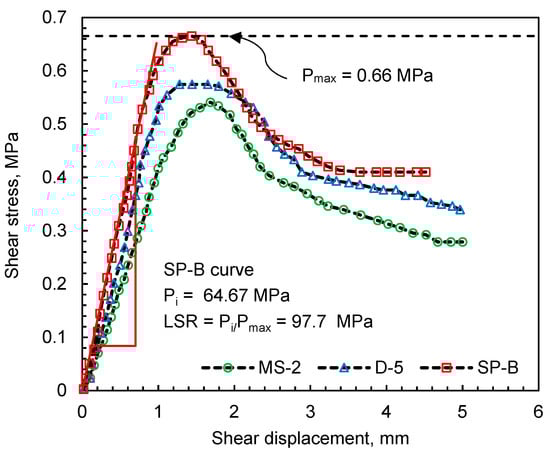
Figure 7.
Typical stress–strain curves of direct shear test at 500 kPa normal stress for validation.
3.2. Asphalt Binder Test Results
Conventional tests such as penetration, flash point, ductility, softening point and solubility were used to analyze the asphalt binder (Table 3).
Table 3.
Asphalt binder tests results.
The values of rotational viscosities determined at seven temperatures (i.e., 125, 135, 145, 155, 165, 175 and 185 °C) are given in Table 4. It was observed that the binder had rotational viscosity lower than 3000 cp at 135 °C and passed the acceptance criteria specified by AASHTO-M 320 [].
Table 4.
Performance characteristics of asphalt binder.
Using the DSR test, the rheological characteristics of the asphalt binder were evaluated, namely complex shear modulus (G*), phase angle (δ), rutting parameter (G*/sin δ) and fatigue parameter (G*sin δ). To specify the high-temperature performance grade as per AASHTO-M 320 [], the rutting parameters of the original and RTFO-aged binders and the fatigue parameter of the PAV-aged binder were used. The true grade temperature is 72 °C in original, 68.8 °C in RTFO-aged and 24 °C in PAV-aged condition. The BBR test was performed at −6 to −18 °C after long-term aging process.
3.3. Asphalt Mix Test Results
This study investigated different properties of asphalt mixes such as Marshall stability, flow, air voids (AV), voids in mineral aggregate (VMA), voids filled with asphalt (VFA), resilient modulus and indirect tensile strength. The results of volumetric properties and optimum bitumen content are presented in Table 5. The stability ranging from 1251 to 1401 kg, flow ranging from 11.2 to 13.5 mm, VMA ranging from 12.56 to 13.67%, VFA ranging from 61 to 67.5%, OBC ranging from 3.82 to 4.46%, unit weight ranging from 2349 to 2378 kg/m3 and air voids 4% were observed.
Table 5.
Volumetric properties of asphalt mix.
Presented in Figure 8 are the average indirect tensile strength (ITS) values of three replicates of each mix with standard deviation. The results represent the effect of aggregate gradation on the resistance of asphalt mixes to tensile loads. In Figure 8, each mix shows a different value of ITS due to the difference in aggregate gradations.
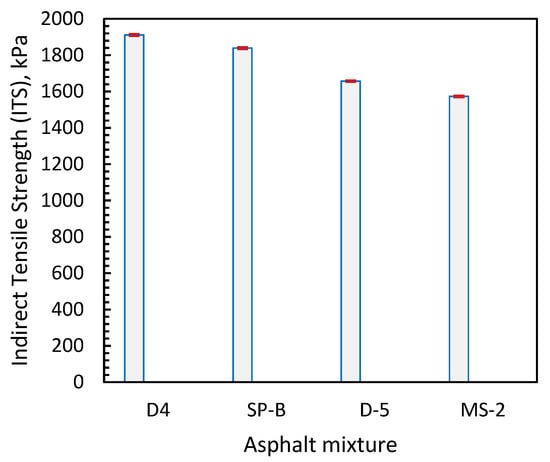
Figure 8.
Indirect tensile strength of asphalt mixes.
The typical haversine deformation curves for asphalt mixes for 0.1 and 0.3 s durations corresponding to D-4, SP-B, D-5 and MS-2 are presented in Figure 9 and Figure 10, respectively. Data recording was performed as 500 data points per second for 0.1 s load duration by UTM software. Different loads were applied to specimens of asphalt mixes. All data points of load and deformation with respect to time are shown in Figure 9 and Figure 10. The rest periods corresponding to T-C, T-55 and T-D were 40%, 55% and 90%, respectively.
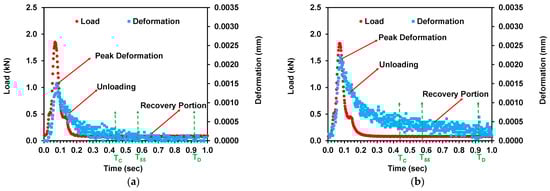
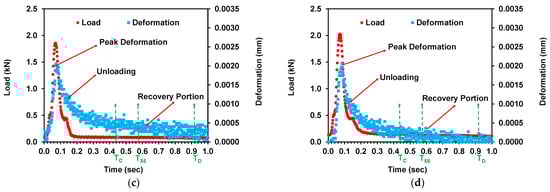
Figure 9.
Typical haversine net deformation waveform for WC at 25 °C for 0.1 s load duration: (a) D-4; (b) SP-B; (c) D-5; (d) MS-2.
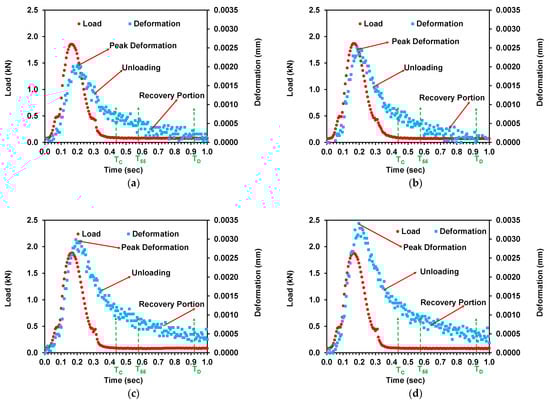
Figure 10.
Typical haversine net deformation waveform for WC at 25 °C for 0.3 s load duration: (a) D-4; (b) SP-B; (c) D-5; (d) MS-2.
4. Discussion
The selection of aggregates for use in asphalt mixes is always considered a critical task. Aside from strength properties, morphological properties of aggregates play a significant role regarding resistance of flexible pavements to vehicle loads. It was aimed to propose a new parameter covering the linear and nonlinear stress–strain behavior of aggregates. For this purpose, research was conducted in a scientific way to propose linear stress ratio (LSR) for the selection of aggregates for asphalt mixes. As a first step, newly proposed qualitative criteria were applied for the assessment of shape, angularity and interlocking for four wearing course (WC) gradations. The aggregate proportions satisfying the qualitative criteria were subjected to a second set of criteria (quantitative) regarding determination of FAPs as per ASTM D5821. After the selection of FAPs, the aggregates were characterized in the laboratory to determine their physical properties. The direct shear tests were carried out to propose a new parameter, i.e., linear stress ratio (LSR). The LSR helped in selection of aggregates during sample preparation for asphalt mixes for determination of their resilience properties. The above-mentioned scientific sequence of the study is discussed in detail with appropriate reasoning in the following paragraphs.
New qualitative criteria were applied for the assessment of shape, angularity and interlocking of aggregates for four gradations, i.e., D-4, SP-B, D-5 and MS-2, as shown in Figure 1, Figure 2 and Figure 3. As per proposed criteria, the D-4 gradation showed higher number of edges, small angles between the edges and large number of projections in comparison with SP-B, D-5 and MS-2. Hence, the D-4 gradation showed maximum angularity among four selected gradations. The aggregate gradations satisfying these qualitative criteria were subjected to the determination of FAPs as per ASTM D5821. D-4, SP-B, D-5 and MS-2 gradations were prepared with different quantities of FAPs. The four gradation curves shown in Figure 5 are representative of typical construction extremes of aggregate gradations used in the pavement industry.
After the selection of aggregates, the physical properties of aggregates, such as flakiness index, elongation index, Los Angeles abrasion value, water absorption, soundness and uncompacted voids, were determined. The results of these properties are summarized in Table 1. The results presented in Table 1 show that aggregate physical properties are in acceptable ranges adopted in pavement design and construction.
Table 2 shows that the quantity of FAPs is related to the density of aggregates. It was observed that an increase in FAPs caused an increase in density due to increase in extent of interlocking between the aggregate particles. D-4, SP-B, D-5 and MS-2 gradations having different densities were subjected to direct shear tests for the evaluation of friction and interlocking between the particles.
Presented in Figure 6 and Figure 7 are the stress–strain curves of direct shear tests to simulate the behavior of aggregate used in asphalt mix. The load-to-deformation ratio (Pi) of each stress–strain curve was determined from the initial portion of stress–deformation curve. The peak stress (Pmax) in the direct shear tests presents the maximum load to overcome the resistive forces and interlocking of particles of material being sheared. Before the Pmax is attained, the stress–deformation curve passes through the initial linear stress–deformation phase and nonlinear stress–deformation phase. The nonlinear phase starts from the end of linear phase and depicts the range of nonlinear stress required to move the particles for a larger rate of deformation as compared with linear phase. Pmax encloses the effect of both phases (i.e., linear and nonlinear) and is related to the angle of internal friction (ϕ). However, the Pi depicts the ratio of linear stress to deformation in the linear phase. Hence, the linear stress ratio (LSR), i.e., Pi/Pmax, shows the overall effect of both the linear and nonlinear phases. It is observed that by using ϕ in the selection of aggregate, the linear stress–deformation behavior of aggregate is ignored, but this linear behavior is significant in the performance of asphalt mixes. Hence, the newly introduced parameter, i.e., LSR, is very important in selecting the aggregate with higher linear stress–deformation behavior. LSR comprises the linear and nonlinear portions of the stress–strain curve; hence, it is beneficial to use LSR in aggregate selection instead of ϕ.
Figure 6 shows that the maximum shear stress was observed in the case of D-4-90 proportion of D-4 gradation as it contained angular shapes of particles and the maximum quantity of FAPs. ϕ of aggregates was evaluated by performing large box direct shear tests for the six proportions of D-4 gradation containing FAPs ranging from 70 to 90%, which resulted in ϕ ranging from 37.8 to 56° at a maximum density of aggregate ranging from 2478 to 2508 kg/m3.
Figure 7 shows that among three gradations, namely SP-B, D-5 and MS-2, the shear stress in the case of SP-B was observed to be on the higher side due to higher content of FAPs among these three gradations.
Analysis was conducted on the stress–strain curves of Figure 6 and Figure 7. It was observed that ϕ of D-4-90 is 48% higher than that of D-4-70, whereas the Pi of D-4-90 is 350% higher than that of D-4-70, which shows an interesting outcome: the elastic portion of the stress–deformation curve in case of Pi is more significant than the total loading phase of the stress–deformation curve (linear and nonlinear) in case of ϕ.
The increase in maximum density caused an increase in ϕ for all gradations. ϕ for each gradation is presented in Table 2 along with corresponding FAPs and maximum density. The densities of D-4 and MS-2 gradations were observed to be highest and lowest among the four gradations, respectively. It was observed that the FAPs significantly affected the ϕ values. It was noted that the stress–strain curve of direct shear test comprised linear and nonlinear portions, whereas ϕ is usually determined only from maximum values of shear stress. Hence, the use of ϕ alone is not justified in the selection of aggregates.
After the study of the effect of FAPs on ϕ, the effect of FAPs on indirect tensile strength (ITS) of asphalt mixes was also studied. As can be seen in Figure 8, which presents the ITS of D-4, SP-B, D-5 and MS-2, the gradation with the highest content of FAPs, i.e., D-4, showed the highest ITS. It is inferred that the higher interlocking in D-4 coarse particles presents higher strength in asphalt mixes.
Figure 9 and Figure 10 show the loading deformation curves of asphalt mixes comprising D-4, SP-B, D-5 and MS-2 aggregate gradations. It was observed that the D-4 gradation with higher FAP content caused lower deformation in response to applied load as compared with SP-B, D-5 and MS-2 at both 0.1 and 0.3 s load durations in MR tests. The lower deformation in D-4 gradation was caused due to higher extent of interlocking and angular shapes of D-4 aggregate particles. The deformation curves of 0.1 s load duration shown in Figure 9 present lower deformation as compared with the curves of 0.3 s load duration presented in Figure 10. It is inferred that the moduli at 0.1 s load duration were comparatively higher than those at 0.3 s load duration. The higher deformations result from the higher magnitudes of loads at both 0.1 and 0.3 s load durations. All asphalt mixes show different trends of deformations due to different contents of FAPs in four gradations, i.e., D-4, SP-B, D-5 and MS-2. Instantaneous and total resilient moduli (MRI and MRT) were evaluated using these deformation curves from instantaneous and total deformations, respectively.
After discussion of the results of aggregates presented in Figure 5, Figure 6 and Figure 7 and results of asphalt mixes in Figure 8, Figure 9 and Figure 10, the relationships between FAPs and properties of aggregates and asphalt mixes are significant to consider.
First of all, the relation of FAPs with density of aggregate is presented in Figure 11, which shows that the quantity of FAPs in six proportions of D-4 (D-4-70 to D-4-90) is clearly related with density of aggregates. The increase in FAPs causes an increase in density due to close packing and high level of interlocking in D-4-70 to D-4-90 gradations. The relationship between FAPs and density for D-4-70 to D-4-90 gradations is validated by the SP-B, D-5 and MS-2 gradations.
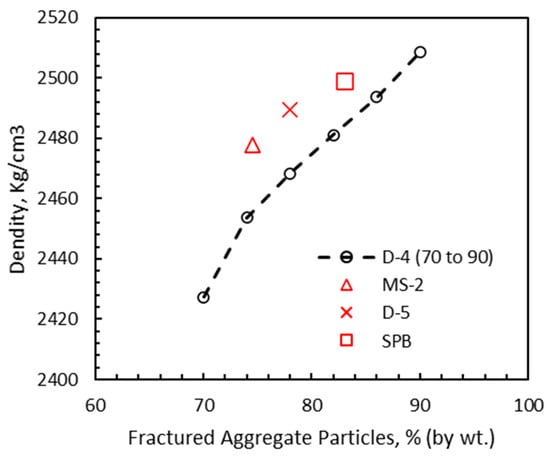
Figure 11.
Relation of fractured particles with density of aggregates.
The relationship between angle of internal friction (ϕ) and γdmax is presented in Figure 12. It can be observed that ϕ increased with the increase in dry densities of six proportions of D-4 (D-4-70 to D-4-90). In the same way, the measured angles of internal friction of SP-B, D-5 and MS-2 validate the trend of the six D-4 proportions presented in Figure 12.
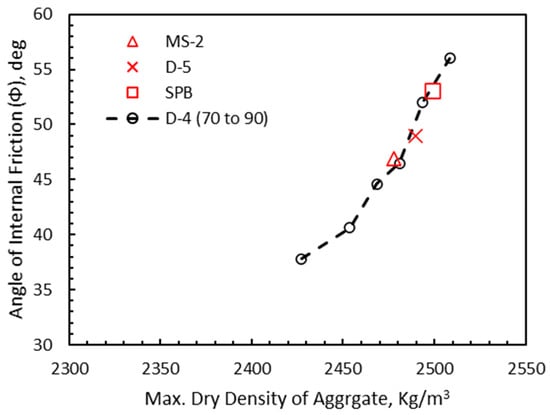
Figure 12.
Max. dry density of aggregate (γdmax) vs. angle of internal friction (ϕ).
It can be observed in Figure 13 that ϕ increased with the increase in fractured aggregate particles (FAPs) in six proportions of D-4 (D-4-70 to D-4-90). The measured ϕ values for SP-B, D-5 and MS-2 validate the trend of ϕ for the D-4-70 to D-4-90 proportions, as shown in Figure 13.
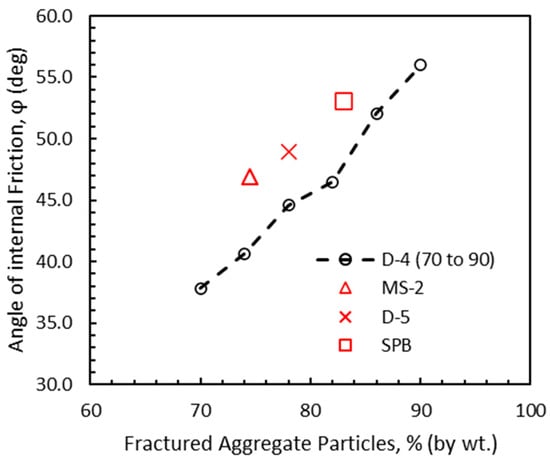
Figure 13.
Fractured particles (%) vs. ϕ of aggregate.
The linear stress ratio (LSR) of aggregate closely simulates the resilient modulus (MR) of asphalt mixes due to the representation of linear and nonlinear stress–strain behavior in both parameters. Hence, it is inferred that the correlation between Pi/Pmax and FAPs can be represented the relationship between MR and FAPs confidently. The relationship between Pi/Pmax and FAPs is shown in Figure 14. It can be observed that a strong correlation exists for Pi/Pmax vs. FAPs with R2 = 0.9795, validated by MS-2, D-5 and SP-B gradations. It can also be noted that validation points are very close to the predicted line of correlation, which shows that the proposed correlation can be used confidently.
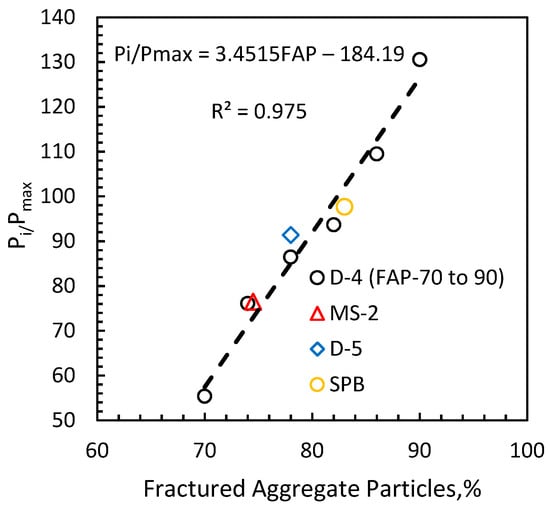
Figure 14.
LSR vs. FAPs correlation.
After establishing the strong relation of FAPs and LSR, it was intended to relate the aggregate and asphalt mixture properties so that the performance of asphalt mixes can be assessed from aggregate behavior. For this purpose, the binder was analyzed by different laboratory tests. The results of conventional tests presented in Table 3 showed penetration 45, flash point 333 °C, ductility 123 cm, softening point 50.7 °C and solubility 99.92%, which agree well with the ASTM D946 [] specifications for penetration-graded asphalt binder. The standard deviation and coefficient of variation of results were within the ASTM limit. It should be noted that three replicates of the selected binder are reported in Table 3 for each test. The differences between the results among the replicates were minor as the tests were carefully conducted by a single operator, replicating a similar environment. Table 4 shows the results revealing that the binder has rotational viscosity lower than 3000 cp at 135 °C and passed the criteria specified by AASHTO-M 320. The S and m-values of the binder were used to specify the low-temperature performance grade as per AASHTO-M 320. The low temperature determined from the BBR test is −10.1 °C. The binder was graded as PG 64-16.
It can be observed from Table 5 that D-4 has a higher stability value than the other wearing course (WC) mixes due to the higher content of FAPs and the higher extent of interlocking in FAPs. The higher stability of D-4 may be attributed to the higher proportion of fractured particles of coarser aggregate of D-4. The stability of asphalt mixes investigated in this study was in the order of D-4 > SP-B > D-5 > MS-2. The relation of FAPs of coarse aggregate with stability is shown in Figure 15, which shows that the stability of the asphalt mix increased with the increase in FAPs determined as per ASTM D5821. The relations between the Marshall mix design parameters (i.e., density and stability) and percentage of FAPs presented in Figure 11 and Figure 15 are important to be used as supportive inferences for Marshal mix design procedures being used worldwide.
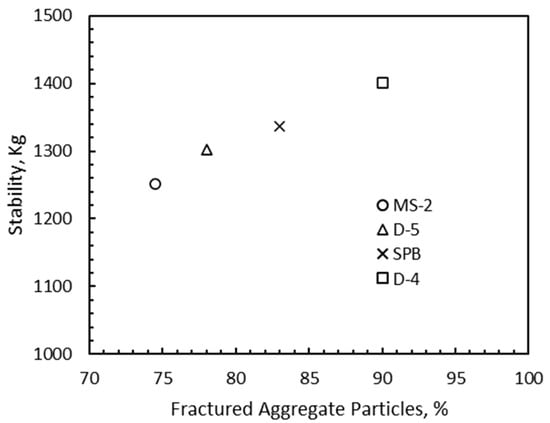
Figure 15.
Marshall stability vs. FAPs.
It can be observed in Figure 16 that the indirect tensile strength (ITS) of asphalt mix having D-4 aggregate gradation is higher than that of other mixes. The higher ITS of D-4 may be credited to the higher content of fractured particles in the coarser aggregate of D-4 as compared to other mixes. The D-4 gradation has particles with a high level of interlocking, which results in high resistance between the particles. Consequently, the high resistance of aggregate particles presents high indirect tensile strength (ITS) of the resulting asphalt mixture. The ITS of asphalt mixes investigated in this study is in the order of D-4 > SP-B > D-5 > MS-2 based on the ITS values.
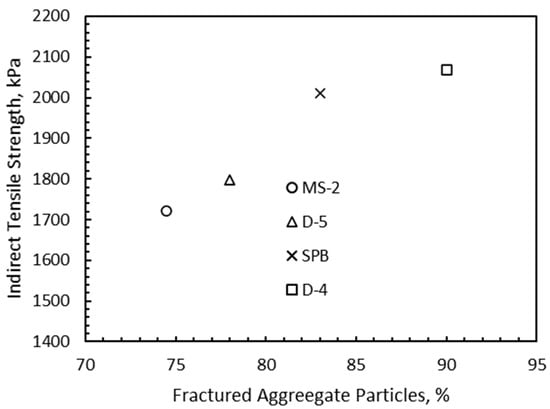
Figure 16.
Indirect tensile strength (ITS) vs. FAPs.
Presented in Figure 17 is the typical evaluation of instantaneous and total deformation along with corresponding instantaneous and total loads for 0.1 s load duration for asphalt mix as per ASTM D7369. For simplicity and ease in calculations, the mean value data points are shown in Figure 17, which presents the complete calculation of the resilient moduli (MRI and MRT) based on the procedure given in ASTM D7369. It can be observed that the value of MRI, 10,042 MPa, is higher than the value of MRT, 7921 Mpa, for 0.1 s load duration for the specimen of wearing course (WC).
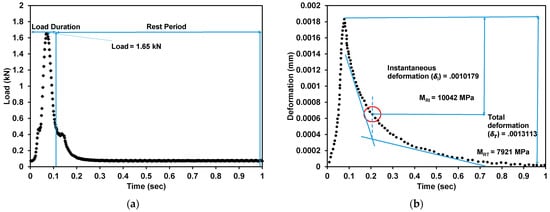
Figure 17.
Typical haversine load and deformation waveforms at 25 °C: (a) load of SP-B at 0.1 s; (b) deformation of SP-B at 0.1 s.
Figure 18 shows an increase in instantaneous resilient modulus from 22.08 to 28.71% as compared with the total resilient modulus. As presented in Figure 18, coarse aggregate proportions of 74.5%, 78%, 83% and 90% for wearing course (WC) blended with 40/50 binder grade at 25 °C at 0.1 s showed the total resilient moduli of 6190, 6731, 7921 and 8010 MPa and instantaneous resilient moduli of 8254, 9621, 10,042 and 11,072 MPa, respectively. As presented in Figure 18, coarse aggregate proportions of 74.5%, 78%, 83% and 90% for WC at 0.3 s showed the total resilient moduli of 4258, 4603, 5123 and 5801 MPa and instantaneous resilient moduli of 5974, 6234, 6824 and 7445 MPa, respectively. The results of resilient modulus test are congruent to the modulus of asphalt mix stated in past research [] at 0.1 to 0.5 Hz from 15 to 20 °C. The results of this study regarding resilient modulus also match the study of this modulus [] at 25 °C; however, some difference is due to differences in asphalt mixes. The present research shows resilient modulus values matching the modulus values found in a study of asphalt mixes [] at 20 °C and 0.1 to 0.5 Hz loading frequency.
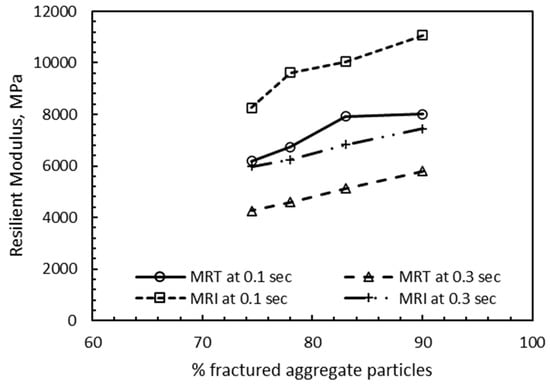
Figure 18.
Effect of fractured aggregate particles on MRI and MRT.
The indirect tensile strength (ITS) is correlated with MRI and MRT for 0.1 and 0.3 s load durations, as presented in Figure 19. It can be observed from Figure 19 that MRI and MRT increase with an increase in ITS. MRI values were observed to be higher as compared with MRT due to the lesser amount of deformation resulting in the case of MRI. It was found that MRI increased 25.5% for WC for 0.1 s load duration, whereas MRT increased 22.7% for WC for 0.1 s load duration against ITS values ranging from 1721 to 2068 kPa at 25 °C with 40/50 binder grade. It was also observed that for 0.3 s load duration, MRI increased 19.6%, whereas MRT increased 26.5% with ITS values ranging from 1721 to 2068 kPa for WC.
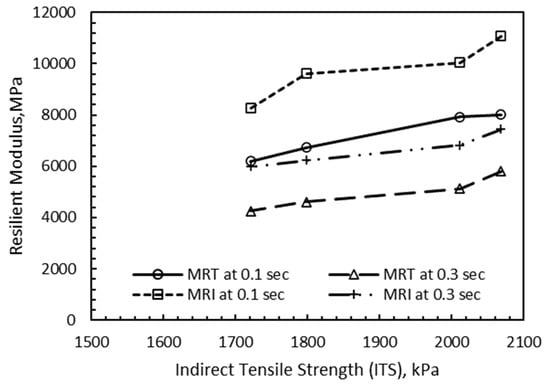
Figure 19.
Effect of indirect tensile strength on MRI and MRT of asphalt mix.
The relation presented in Figure 20 shows that MRI and MRT increased 25.5% and 22.7% for WC for 0.1 s load duration against stability values of 1251 to 1401 kg for WC. It can also be observed from Figure 20 that MRI and MRT increased 19.6% and 26.5%, respectively, for WC for 0.3 s load duration against stability values of 1251 to 1401 kg.
Figure 20.
Effect of stability on MRI and MRT of WC.
Figure 21 presents the increase in MRI and MRT at 0.1 s load duration as 25.5% and 22.7% bulk density (unit weight) values of 2349 to 2378 kg/m3 for WC at 25° C with 40/50 binder grade. It can also be observed from Figure 21 that for 0.3 s load duration, MRI and MRT increased 19.6% and 26.5% for WC against bulk density values of 2349 to 2378 kg/m3.
Figure 21.
Effect of bulk density on MRI and MRT of WC mixes.
The resilient moduli (MR) of asphalt mixes related to FAPs, ITS, stability and density present good relation for the assessment of a costly parameter, MR, from low-cost laboratory tests. Hence, the results of this study can be utilized to economize the determination of pavement design parameters.
It was also intended to analyze the effect of fractured aggregate particles (FAPs) on the elastic and viscoelastic behavior of asphalt mixes. Asphalt mixes are viscoelastic in behavior [,,]. Viscoelastic deformation in asphalt mix comprises linear viscoelastic and nonlinear viscoelastic portions. The nonlinear viscoelastic deformation mainly starts after the removal of load and is the continuing recoverable portion of total deformation (ASTM D7369) []. The linear portion is important in the way that it is fully recovered and shows good quality of asphalt mix. The reduced nonlinear viscoelastic portion and the enlarged linear viscoelastic region were observed in the case of asphalt mixes with an enhanced proportion of FAPs. The maximum elastic property may be used against dynamic loading on the flexible pavements. Figure 22 and Figure 23 show the evaluation of linear and nonlinear viscoelastic deformations resulting from dynamic loading applied in the haversine pattern for 0.1 and 0.3 s load durations. Figure 22 shows 40.3% linear viscoelastic deformation and 59.7% nonlinear viscoelastic deformation at 0.1 s load duration for WC mix. Figure 23 presents 46.75% linear viscoelastic deformation and 53.25% nonlinear viscoelastic deformation at 0.3 s load duration for WC mix. It is also seen in Figure 22 and Figure 23 that part of the nonlinear viscoelastic deformation remains after the load removal, so this deformation may play a critical role in the initiation of deformation to be added to the nonrecoverable part of the stress–deformation curve. The results are congruent to available literature [].
Figure 22.
Linear and nonlinear viscoelastic deformation for WC at 0.1 s load duration.
Figure 23.
Linear and nonlinear viscoelastic deformation for WC at 0.3 s load duration.
In this research, the effect of the increase in FAPs of coarse aggregate in proportions ranging from 74.5 to 90% on the linear and nonlinear viscoelastic deformation was also explored. The linear viscoelastic deformation for 0.1 s duration for WC was observed to increase from 54.6 to 68.2%, whereas nonlinear viscoelastic deformation decreased from 45.4 to 31.8%.
It was also observed that increases in FAPs and ϕ caused an increase in linear viscoelastic deformation and a decrease in nonlinear viscoelastic deformation. As the nonlinear viscoelastic deformation imparts permanent deformation, it is very important to quantify the nonlinear viscoelastic deformation in comparison with FAPs and ϕ. It is worth mentioning that an increase in FAPs increased the linear viscoelastic deformation and decreased the nonlinear viscoelastic deformation of the asphalt mixes, which is a novel achievement in the area of sustainable flexible pavement construction. An increase in the viscoelastic properties of asphalt mixes retards the rutting and fatigue in pavements, making them durable on a long-term basis.
Two novel relations, i.e., ϕ vs. MR and LSR (Pi/Pmax) vs. MR, are presented in Figure 24 and Figure 25, respectively.
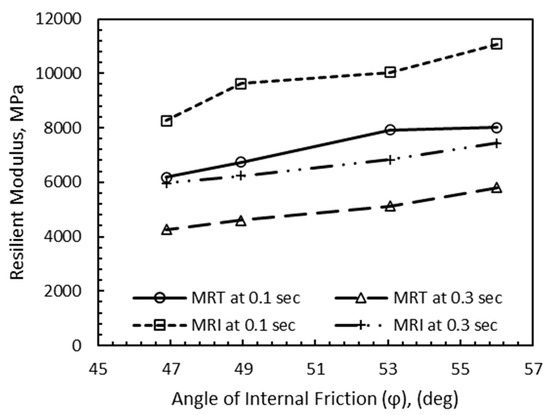
Figure 24.
Angle of internal friction vs. resilient modulus.
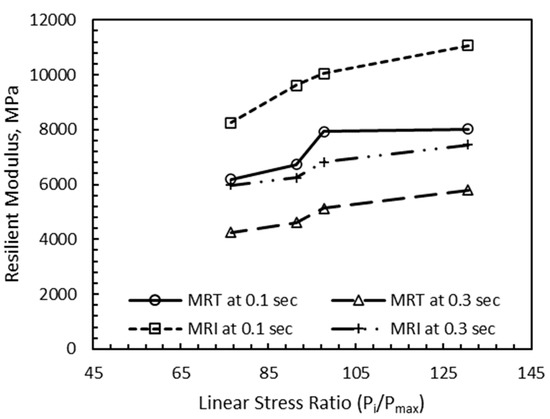
Figure 25.
Linear stress ratio vs. resilient modulus.
The MR increases with the increase in ϕ and Pi/Pmax. Hence, the increase in the frictional property (ϕ) and linear stress ratio (Pi/Pmax) of aggregate caused a considerable increase in the resilience of flexible pavements.
The experimental data of this study were checked statistically using Grubbs’ test (Grubbs, 1969) []. No anomaly was detected in the data of the tests conducted in this research. Identification of the anomalies and assessment of their origin is very important to make correct interventions.
A computationally strong approach similar to the maximum likelihood estimation-based Bayesian dynamic linear model [] was also applied for the detection of anomalies in the data of this study; it showed no sensor fault and no abnormal behavior of aggregate samples and asphalt mixture specimens during testing.
More durable aggregates are the prerequisite to achieve high-quality asphalt mixes. Asphalt mix designers and practicing engineers use the ASTM D5821 method for determining fractured particles. This method is not able to distinguish between the angularity of aggregates composed entirely of particles with two or more fractured faces. The present study proposes additionally adopting qualitative parameters such as the maximum number of edges and the high resistive arrangement of aggregate particles. After the selection of aggregate by qualitative assessment, the quantitative parameter for prediction of resistance between the particles, i.e., linear stress ratio (LSR), can be applied. The use of LSR is more scientific, objective and simple approach to select aggregate with high resistance caused by geometrical characteristics such as angularity, close packing of particles, surface irregularities and aggregate form shown by the collective behavior of the aggregate. The higher LSR of aggregate resulting from interlocking will enable the designers to achieve high values of rutting resistance, resilient modulus, stability and indirect tensile strength. By adopting the LSR parameter, pavement designers can save the great cost of image analysis tests. Image analysis has the disadvantage of testing the individual aggregate particles instead of their collective behavior as achieved by the LSR parameter.
5. Conclusions
The well-known aggregate gradations used worldwide, i.e., D-4, SP-B, D-5 and MS-2, were studied to evaluate the effect of the quantity of fractured aggregate particles (FAPs) on the stability and resilience characteristics of wearing course (WC) asphalt mixes. Single bitumen and aggregate types were selected in order to clearly differentiate the outcome parameters of asphalt mix testing. Based on analysis of the data from this research, the following conclusions are drawn:
- The shapes of aggregate particles having small angles between edges proved to be a significant factor in the increase in interlocking between particles resulting in an increase in resilience and friction angle of the aggregate, as seen in the case of D-4 gradation.
- A new parameter for aggregate quality, “linear stress ratio” (LSR), i.e., Pi/Pmax, is proposed. LSR is proved to be superior to the conventionally used friction angle parameter, ϕ, due to its incorporation of both elastic (by Pi) behavior and frictional (by Pmax) behavior of aggregate. The elastic and frictional properties of aggregate are strongly related to the stability and resilience properties of asphalt mixes.
- It was observed that a 15.5% increase in fractured particles (by mass) caused:
- ○
- A 19.5% increase in the angle of internal friction (ϕ) and a 70.7% increase in the linear stress ratio of the aggregate due to enhancement in interlocking between particles.
- ○
- Increases of 29.4% and 36% in total resilient modulus (MRT) for 0.1 and 0.3 s load durations and corresponding instantaneous resilient modulus (MRI) increases of 34.2% and 24.5% for 0.1 and 0.3 s load durations of vehicles on asphalt pavements.
- ○
- Increases of 11.5% and 21.3% in Marshall stability and indirect tensile strength (ITS), respectively.
- ○
- An increase in linear viscoelastic deformation from 54.6 to 68.2% and a decrease in nonlinear viscoelastic deformation from 45.4 to 31.8% as a way forward towards sustainability and durability of flexible pavements.
Author Contributions
Conceptualization, M.A.R. and A.H.K.; methodology, M.A.R., A.H.K., Z.u.R.; validation, M.A.R., A.H.K. and Z.M.; formal analysis, M.A.R.; investigation, M.A.R.; resources, A.H.K., Z.u.R., Z.M.; data curation, M.A.R.; writing—original draft preparation, M.A.R.; writing—review and editing, A.H.K., Z.u.R.; visualization, M.A.R., A.I.; supervision, A.H.K., A.I.; project administration, A.H.K., Z.u.R.; funding acquisition, A.I. All authors have read and agreed to the published version of the manuscript.
Funding
The authors are grateful to Highway Research and Training Center (HRTC), National Highway Authority (NHA), Pakistan, for necessary funding.
Institutional Review Board Statement
Not applicable.
Informed Consent Statement
Not applicable.
Data Availability Statement
The data presented in this study are available on request from the corresponding author.
Conflicts of Interest
The authors declare no conflict of interest.
References
- Ren, J.; Yin, C. Investigating mechanical characteristics of aggregate structure for road materials. Int. J. Pavement Eng. 2020. [Google Scholar] [CrossRef] [Green Version]
- Shen, S.; Yu, H. Analysis of aggregate gradation and packing for easy estimation of hot-mix-asphalt voids in mineral aggregate. J. Mater. Civ. Eng. 2010, 23, 664–672. [Google Scholar] [CrossRef]
- Shen, S.; Yu, H. Characterize packing of aggregate particles for paving materials: Particle size impact. Constr. Build. Mater. 2011, 25, 1362–1368. [Google Scholar] [CrossRef]
- Brown, E.R.; McRea, J.L.; Crawley, A.B. Effect of aggregates on performance of bituminous concrete. ASTM 1989, 1016, 34–63. [Google Scholar]
- Cui, P.; Xiao, Y.; Yan, B.; Li, M.; Wu, S. Morphological characteristics of aggregates and their influence on the performance of asphalt mixture. Constr. Build. Mater. 2018, 186, 303–312. [Google Scholar] [CrossRef]
- Ferreira, J.L.S.; Lucas, F.A.L.; Soares, J.B. A tool to design rutting resistant asphalt mixes through aggregate gradation selection. Constr. Build. Mater. 2020, 236, 1–13. [Google Scholar] [CrossRef]
- Shi, L.; Wang, D.; Wang, J.; Jiang, Z.; Liang, H.; Qin, X. A new method for designing dense skeleton asphalt mixture based on meso parameter. Adv. Civ. Eng. 2020, 3841291. [Google Scholar] [CrossRef] [Green Version]
- Shi, L.; Wang, D.; Lin, P.; Sun, X.; Qin, X. Meso-structural evaluation of asphalt mixture based on pore cellular structure model. Int. J. Pavement Eng. 2021, 9, 1–4. [Google Scholar] [CrossRef]
- Li, J.; Guo, W.; Meng, A.; Han, M.; Tan, Y. Investigation on the micro deformation mechanism of asphalt mixtures under high temperatures based on a self-developed laboratory test. Materials 2020, 13, 1791. [Google Scholar] [CrossRef]
- Zhang, S.; Pei, J.; Li, R.; Wen, Y.; Zhang, J. Investigation on comparison of morphological characteristics of various coarse aggregates before and after abrasion test. Materials 2020, 13, 492. [Google Scholar] [CrossRef] [Green Version]
- Shi, L.; Yang, Z.; Wang, D.; Qin, X.; Xiao, X.; Julius, M.K. Gradual meso-structural response behaviour of characteristics of asphalt mixture main skeleton subjected to load. Appl. Sci. 2019, 9, 2425. [Google Scholar] [CrossRef] [Green Version]
- Zhu, F.; Han, J.; Zhang, S.; Dong, W. A new method for the aggregate proportion calculation and gradation optimization of asphalt-treated base (ATB-25). Math. Probl. Eng. 2021, 9709070. [Google Scholar] [CrossRef]
- Field, F. Effect of percent crushed variation in coarse aggregates of bituminous mixes. Assoc. Asph. Paving Technol. Proc. 1958, 27, 294–322. [Google Scholar]
- Souza, L.T.; Kim, Y. Effects of Aggregate Angularity on Mix Design Characteristics and Pavement Performance; Department of Civil Engineering, University of Nebraska-Lincoln: Lincoln, NE, USA, 2019. [Google Scholar]
- ASTM International. ASTM D5821-13, Standard Test Method for Determining the Percentage of Fractured Particles in Coarse Aggregate; ASTM International: West Conshohocken, PA, USA, 2017. [Google Scholar]
- Ji, J.; Zhai, P.; Zheng, W.; Suo, Z.; Xu, Y. A laboratory investigation in to the effects of coarse aggregate angularity on performance of WMA. Adv. Mater. Sci. Eng. 2018, 1326945. [Google Scholar] [CrossRef] [Green Version]
- Xu, D.; Zhang, D.; Zhuang, X. Investigation of the coarse aggregate texture property using an improved Laplacian smoothing algorithm. J. Test. Eval. 2021, 49, 1879–1896. [Google Scholar] [CrossRef]
- Pan, T.E.; Tutumluer, S.H.; Carpenter, P. Effect of coarse aggregate morphology on the resilient modulus of hot-mix asphalt. Transp. Res. Rec. J. Transp. Res. Board 2005, 1929, 1–9. [Google Scholar] [CrossRef]
- Simoni, A.; Guy, T.H. The direct shear strength and dilatancy of sand–gravel mixtures. Geotech. Geol. Eng. 2006, 24, 523–549. [Google Scholar] [CrossRef]
- Chen, J.; Li, H.; Wang, L.; Wu, J.; Huang, X. Micromechanical characteristics of aggregate particles in asphalt mixtures. Constr. Build. Mater. 2015, 91, 80–85. [Google Scholar] [CrossRef]
- Terzaghi, K.; Peck, R.B. Soil Mechanics in Engineering Practice; John Wiley and Sons: New York, NY, USA, 1948. [Google Scholar]
- Hennes, R.G. The Strength of Gravel in Direct Shear. In Symposium on Direct Shear Testing of Soils; Tschebotarioff, G., Ed.; ASTM International: West Conshohocken, PA, USA, 1953; pp. 51–62. [Google Scholar] [CrossRef]
- Holtz, W.G.; Gibbs, H.J. Triaxial shear test on pervious gravelly soils. J. Soil Mech. Found. Div. 1956, 82, 1–22. [Google Scholar] [CrossRef]
- Holtz, W.G. Discussion of “Effect of particle shape and texture on the strength of non-cohesive aggregates” by H. C. Morris. ASTM Spec. Tech. Publ. 1959, 254, 363–364. [Google Scholar]
- Yagiz, S. Brief note on the influence of shape and percentage of gravel on the shear strength of sand and gravel mixtures. Bull. Eng. Geol. Environ. 2011, 60, 321–323. [Google Scholar] [CrossRef]
- Link, R.E.; Kuo, C.Y. Correlating permanent deformation characteristics of hot mix asphalt with aggregate geometric irregularities. J. Test. Eval. 2002, 30, 136–144. [Google Scholar]
- Leon, L.P.; Charles, R. Aggregate angularity on the permanent deformation zones of hot mix asphalt. Glob. J. Res. Eng. 2015, 3, 25–29. [Google Scholar]
- Souza, L.T.; Kim, Y.R.; Souza, F.V.; Castro, L.S. Experimental testing and finite-element modeling to evaluate the effects of aggregate angularity on bituminous mixture performance. J. Mater. Civ. Eng. 2012, 24, 249–258. [Google Scholar] [CrossRef] [Green Version]
- Czech, K.; Gardziejczyk, W. Dynamic stiffness of bituminous mixtures for the wearing course of the road pavement—A proposed method of measurement. Materials 2020, 13, 1973. [Google Scholar] [CrossRef] [Green Version]
- Wu, Z.; Zhang, C.; Xiao, P.; Li, B.; Kang, A. Performance characterization of hot mix asphalt with high RAP content and basalt fiber. Materials 2020, 13, 3145. [Google Scholar] [CrossRef]
- Li, L.; Jiang, X.; Lin, Y.; Yan, H. A prediction model on viscoelastic fatigue damage of asphalt mixture. Materials 2020, 13, 3782. [Google Scholar] [CrossRef]
- Iwański, M. Effect of hydrated lime on indirect tensile stiffness modulus of asphalt concrete produced in half-warm mix technology. Materials 2020, 13, 4731. [Google Scholar] [CrossRef]
- Mackiewicz, P.; Mączka, E. The impact of water and road salt with anti-caking agent on the stiffness of select mixes used for the road surface. Materials 2021, 14, 1345. [Google Scholar] [CrossRef]
- Złotowska, M.; Nagórski, R.; Błażejowski, K. Concept of similarity method for prediction of fatigue life of pavement structures with HiMA binder in asphalt layers. Materials 2021, 14, 480. [Google Scholar] [CrossRef]
- Crisman, B.; Ossich, G.; Lorenzi, L.D.; Bevilacqua, P.; Roberti, R. A laboratory assessment of the influence of crumb rubber in hot mix asphalt with recycled steel slag. Sustainability 2020, 12, 8045. [Google Scholar] [CrossRef]
- Woszuk, A.; Wróbel, M.; Bandura, L.; Franus, W. Brick debris dust as an ecological filler and its effect on the durability of asphalt mix. Materials 2020, 13, 5023. [Google Scholar] [CrossRef] [PubMed]
- Skotnicki, L.; Kuźniewski, J.; Szydlo, A. stiffness identification of foamed asphalt mixtures with cement, evaluated in laboratory and in situ in road pavements. Materials 2020, 13, 1128. [Google Scholar] [CrossRef] [PubMed] [Green Version]
- Chomicz-Kowalska, A.; Maciejewski, K.; Iwański, M.M. Study of the simultaneous utilization of mechanical water foaming and zeolites and their effects on the properties of warm mix asphalt concrete. Materials 2020, 13, 357. [Google Scholar] [CrossRef] [Green Version]
- Skaf, M.; Pasquini, E.; Revilla-Cuesta, V.; Ortega-López, V. Performance and durability of porous asphalt mixtures manufactured exclusively with electric steel slags. Materials 2019, 12, 3306. [Google Scholar] [CrossRef] [Green Version]
- White, G. A synthesis on the effects of two commercial recycled plastics on the properties of bitumen and asphalt. Sustainability 2020, 12, 8594. [Google Scholar] [CrossRef]
- Omranian, S.R.; Hamzah, M.O.; Pipintakos, G.; Van den bergh, W.; Vuye, C.; Hasan, M.R.M. Effects of short-term aging on the compactibility and volumetric properties of asphalt mixtures using the response surface method. Sustainability 2020, 12, 6181. [Google Scholar] [CrossRef]
- Elliot, R.P.; Ford, M.C.; Ghanim, M.; Tu, Y.F. Effect of aggregate gradation variation on asphalt concrete mix properties. Transp. Res. Rec. 1991, 1317, 52–60. [Google Scholar]
- AASHTO. Guide for Design of Pavement Structures; AASHTO: Washington, DC, USA, 1993. [Google Scholar]
- Shalaby, A.; Liske, T.; Kavussi, A. Comparing back-calculated and laboratory resilient moduli of bituminous paving mixtures. Can. J. Civ. Eng. 2004, 31, 988–996. [Google Scholar] [CrossRef]
- Loulizi, A.; Flintsch, G.W.; Al-Qadi, I.L.; Mokarem, D.W. Comparing resilient modulus and dynamic modulus of hot-mix asphalt as material properties for flexible pavement design. Transp. Res. Rec. 2006, 23, 161–170. [Google Scholar] [CrossRef]
- ASTM International. ASTM D7369, Standard Test Method for Determining the Resilient Modulus of Bituminous Mixtures by Indirect Tension Test; ASTM International: West Conshohocken, PA, USA, 2020. [Google Scholar]
- Tahmoorian, F.; Yeaman, J.; Mirzababaei, M. Comparisons of the Resilient Moduli of Asphalt Mixes Containing Recycled Materials through Empirical and Experimental Methods. J. Mater. Civ. Eng. 2020, 32, 04020255. [Google Scholar] [CrossRef]
- Peters-Davis, K.; Timm, D. Recalibration of the Asphalt Layer Coefficient; NCAT Rep. No. 09-03; National Center for Asphalt Technology: London, UK, 2009. [Google Scholar]
- Kaseer, F.; Yin, F.; Arámbula-Mercado, E.; Martin, A.E. Stiffness characterization of asphalt mixtures with high recycled material content and recycling agents. Transp. Res. Rec. 2017, 2633, 58–68. [Google Scholar] [CrossRef]
- Clyne, T.R.; Li, X.; Marasteanu, M.O.; Skok, E.L. Dynamic and Resilient Modulus of MN/DOT Asphalt Mixtures; Publication MN/RC–2003-09; Minnesota Department of Transportation: Saint Paul, MN, USA, 2003. [Google Scholar]
- Liu, Q.; Oeser, M. The Influence of Mixing Conditions on the Macro-Scale Homogeneity of Asphalt Mixtures Blended with Reclaimed Asphalt Pavement (RAP). Materials 2021, 14, 4137. [Google Scholar] [CrossRef]
- Brown, E.R.; Bassett, C.E. Effects of maximum aggregate size on rutting potential and other properties of asphalt-aggregate mixtures. Transp. Res. Rec. 1990, 1259, 107–119. [Google Scholar]
- Lim, C.T.; Tan, S.A. Specimen size effects on the diametrical mechanical testing of cylindrical asphalt mixes. J. Test. Eval. 1995, 23, 436–441. [Google Scholar]
- Bagampadde, U.; Isacsson, U.; Kiggundu, B.M. Impact of bitumen and aggregate composition on stripping in bituminous mixtures. Mater. Struct. 2006, 39, 303–315. [Google Scholar] [CrossRef]
- Kim, J.; Roque, R.; Byron, T. Viscoelastic analysis of flexible pavements and its effects on top-down cracking. J. Mater. Civ. Eng. 2009, 21, 324–332. [Google Scholar] [CrossRef]
- Collop, A.C.; Scarpas, A.; Kasbergen, C.; Bondt, A. Development and finite element implementation of stress-dependent elastoviscoplastic constitutive model with damage for asphalt. Transp. Res. Rec. 2003, 1832, 96–104. [Google Scholar] [CrossRef]
- Ban, H.; Im, S.; Kim, Y.R. Non-linear viscoelastic approach to model damage-associated performance behaviour of asphaltic mixture and pavement structure. Can. J. Civ. Eng. 2013, 40, 313–323. [Google Scholar] [CrossRef]
- Luo, X. Characterization of Fatigue Cracking and Healing of Asphalt Mixtures. Ph.D. Thesis, Texas A & M University, College Station, TX, USA, 2012. [Google Scholar]
- Luo, R.; Liu, H.; Zhang, Y. Characterization of linear viscoelastic, nonlinear viscoelastic and damage stages of asphalt mixtures. Constr. Build. Mater. 2016, 125, 72–80. [Google Scholar] [CrossRef] [Green Version]
- Mackiewics, P.; Szydlo, A. Viscoelastic parameters of asphalt mixtures identified in static and dynamic tests. Materials 2019, 12, 2084. [Google Scholar] [CrossRef] [Green Version]
- Abbas, S.; Munir, M.J.; Kazmi, S.M.S.; Khitab, A.; Ashiq, S.Z.; Arshad, M.T. Engineering characteristics of widely used coarse aggregates in Pakistan: A comparative study. Pak. J. Eng. Appl. Sci. 2017, 20, 85–93. [Google Scholar]
- ASTM International. ASTM D3515, Standard Specification for Hot-Mixed, Hot-Laid Bituminous Paving Mixtures; ASTM International: West Conshohocken, PA, USA, 2009. [Google Scholar]
- Halladay, M. The strategic highway research program: An investment that has paid off. Public Roads 1998, 61, 11–17. [Google Scholar]
- Asphalt Institute. Mix Design Methods for Asphalt Concrete and Other Hot-Mix Types; Asphalt Institute: Lexington, KY, USA, 1997. [Google Scholar]
- American Society for Testing Materials. ASTM D3080. Standard Test Method for Direct Shear Test of Soils Under Consolidated Drained Conditions; American Society for Testing Materials: West Conshohocken, PA, USA, 2011. [Google Scholar]
- ASTM International. ASTM D5321 / D5321M-20, Standard Test Method for Determining the Shear Strength of Soil-Geosynthetic and Geosynthetic-Geosynthetic Interfaces by Direct Shear; ASTM International: West Conshohocken, PA, USA, 2020. [Google Scholar]
- ASTM International. ASTM D5, Standard Test Method for Penetration of Bituminous Materials; ASTM International: West Conshohocken, PA, USA, 2020. [Google Scholar]
- ASTM International. ASTM D36, Standard Test Method for Softening Point of Bitumen (Ring-and-Ball Apparatus); ASTM International: West Conshohocken, PA, USA, 2014. [Google Scholar]
- ASTM International. ASTM D113, Standard Test Method for Ductility of Asphalt Materials; ASTM International: West Conshohocken, PA, USA, 2017. [Google Scholar]
- ASTM International. ASTM D92, Standard Test Method for Flash and Fire Points by Cleveland Open Cup Tester; ASTM International: West Conshohocken, PA, USA, 2018. [Google Scholar]
- American Association of State Highway and Transportation Officials. AASHTO-M 320, Standard Specification for Performance-Graded Asphalt Binder; American Association of State Highway and Transportation Officials: Washington, DC, USA, 2017. [Google Scholar]
- American Association of State Highway and Transportation Officials. AASHTO-T 316, Standard Method of Test for Viscosity Determination of Asphalt Binder Using Rotational Viscometer; American Association of State Highway and Transportation Officials: Washington, DC, USA, 2019. [Google Scholar]
- American Association of State Highway and Transportation Officials. AASHTO-T 315, Standard Method of Test for Determining the Rheological Properties of Asphalt Binder Using a Dynamic Shear Rheometer; American Association of State Highway and Transportation Officials: Washington, DC, USA, 2010. [Google Scholar]
- American Association of State Highway and Transportation Officials. AASHTO-T 240, Standard Method of Test for Effect of Heat and Air on a Moving Film of Asphalt Binder (Rolling Thin-Film Oven Test); American Association of State Highway and Transportation Officials: Washington, DC, USA, 2013. [Google Scholar]
- American Association of State Highway and Transportation Officials. AASHTO-R 28, Standard Practice for Accelerated Aging of Asphalt Binder Using a Pressurized Aging Vessel (PAV); American Association of State Highway and Transportation Officials: Washington, DC, USA, 2012. [Google Scholar]
- American Association of State Highway and Transportation Officials. AASHTO-T 313, Standard Method of Test for Determining the Flexural Creep Stiffness of Asphalt Binder Using the Bending Beam Rheometer (BBR); American Association of State Highway and Transportation Officials: Washington, DC, USA, 2011. [Google Scholar]
- ASTM International. ASTM D6926, Standard Practice for Preparation of Asphalt Mixture Specimens Using Marshall Apparatus; ASTM International: West Conshohocken, PA, USA, 2010. [Google Scholar]
- American Association of State and Washington Highway Transportation Officials. AASHTO-T 312, Standard Method of Test for Preparing and Determining the Density of Asphalt Mixture Specimens by Means of the Superpave Gyratory Compactor; American Association of State and Washington Highway Transportation Officials: Washington, DC, USA, 2019. [Google Scholar]
- ASTM International. ASTM D6931, Standard Test Method for Indirect Tensile (IDT) Strength of Asphalt Mixtures; ASTM International: West Conshohocken, PA, USA, 2007. [Google Scholar]
- Mirza, M.W.; Graul, R.A.; Groeger, J.L.; López, A. Theoretical evaluation of poisson’s ratio and elastic modulus using indirect tensile test with emphasis on bituminous mixtures. Transp. Res. Rec. 1997, 1590, 34–44. [Google Scholar] [CrossRef]
- ASTM International. ASTM D4791-19, Standard Test Method for Flat Particles, Elongated Particles, or Flat and Elongated particles in Coarse Aggregate; ASTM International: West Conshohocken, PA, USA, 2019. [Google Scholar]
- ASTM International. ASTM C131/C131M-20, Standard Test Method for Resistance to Degradation of Small-Size Coarse Aggregate by Abrasion and Impact in the Los Angeles Machine; ASTM International: West Conshohocken, PA, USA, 2020. [Google Scholar]
- ASTM International. ASTM C127-15, Standard Test Method for Relative Density (Specific Gravity) and Absorption of Coarse Aggregate; ASTM International: West Conshohocken, PA, USA, 2015. [Google Scholar]
- ASTM International. ASTM C88/C88M-18, Standard Test Method for Soundness of Aggregates by Use of Sodium Sulphate or Magnesium Sulphate; ASTM International: West Conshohocken, PA, USA, 2018. [Google Scholar]
- ASTM International. ASTM C 1252-17, Standard Test Methods for Uncompacted Void Content of Fine Aggregate (as Influenced by Particle Shape, Surface Texture, and Grading); ASTM International: West Conshohocken, PA, USA, 2017. [Google Scholar]
- ASTM International. ASTM D 2419-14, Standard Test Method for Sand Equivalent Value of Soils and Fine Aggregate; ASTM International: West Conshohocken, PA, USA, 2017. [Google Scholar]
- ASTM International. ASTM D 946/D946 M-20, Standard Specification for Penetration-Graded Asphalt Binder for USE in Pavement Construction; ASTM International: West Conshohocken, PA, USA, 2020. [Google Scholar]
- ASTM International. ASTM D 2042-15, Standard Test Method for Solubility of Asphalt Materials in Trichloroethylene; ASTM International: West Conshohocken, PA, USA, 2015. [Google Scholar]
- Li, P.; Zheng, M.; Wang, F.; Che, F.; Li, H.; Ma, Q.; Wang, Y. Laboratory performance evaluation of high modulus asphalt concrete modified with different additives. Adv. Mater. Sci. Eng. 2017, 217, 7236153. [Google Scholar] [CrossRef] [Green Version]
- Lytton, R.L.; Gu, F.; Zhang, Y.; Luo, X. Characteristics of undamaged asphalt mixtures in tension and compression. Int. J. Pavement Eng. 2018, 19, 192–204. [Google Scholar] [CrossRef] [Green Version]
- Sun, Y.; Gu, B.; Gao, L.; Li, L.; Guo, R.; Yue, Q.; Wang, J. Viscoelastic mechanical responses of HMAP under moving load. Materials 2018, 11, 2490. [Google Scholar] [CrossRef] [PubMed] [Green Version]
- Grubbs, F.E. Procedures for detecting outlying observations in samples. Technometrics 1969, 11, 1–21. [Google Scholar] [CrossRef]
- Zhang, Y.M.; Wang, H.; Wan, H.P.; Mao, J.X.; Xu, Y.C. Anomaly detection of structural health monitoring data using the maximum likelihood estimation-based Bayesian dynamic linear model. Struct. Health Monit. 2020, 1475921720977020. [Google Scholar] [CrossRef]
Publisher’s Note: MDPI stays neutral with regard to jurisdictional claims in published maps and institutional affiliations. |
© 2021 by the authors. Licensee MDPI, Basel, Switzerland. This article is an open access article distributed under the terms and conditions of the Creative Commons Attribution (CC BY) license (https://creativecommons.org/licenses/by/4.0/).