Article

LED versus HPS Lighting: Effects on Water and Energy Consumption and Yield Quality in Lettuce Greenhouse Production

1
Division Biosystems Engineering, Faculty of Life Sciences, Albrecht Daniel Thaer-Institute of Agricultural and Horticultural Sciences, Humboldt-Universität zu Berlin, Albrecht-Thaer-Weg 3, D-14195 Berlin, Germany
2
Max Planck Institute for Chemical Ecology, Hans-Knöll-Straße 8, D-07745 Jena, Germany
*
Author to whom correspondence should be addressed.
Sustainability 2021, 13(15), 8651; https://doi.org/10.3390/su13158651
Submission received: 24 June 2021 / Revised: 16 July 2021 / Accepted: 20 July 2021 / Published: 3 August 2021

Abstract

:
High-pressure sodium (HPS) lighting is increasingly replaced by LED lighting in lettuce greenhouse cultivation. In contrast to HPS lighting, LEDs do not heat radiation. Therefore, the leaf temperature is significantly lower under LEDs. This raises the question of whether LED lighting has a positive impact on the reduction in water consumption during lettuce production. In this paper, we investigated this question and found that the water consumption of lettuce produced under LEDs was significantly lower (−15%) than under HPS without loss of yield. We also found that supplementary lighting increases the concentrations of caffeoylquinic acid, dicaffeoyltartaric acid, dicaffeoylquinic acid and that of the total phenolic compounds in lettuce leaves by 61%, 39%, 163% and 38%, respectively. Only the LED fixture was also efficient enough to increase the concentration of caffeoyltartaric acid (+24%). Most of the phenolic compounds showed a very strong positive correlation with the chlorophyll concentration in lettuce, which predominated in the leaves exposed to the LED lighting. Based on these facts, we conclude that by optimizing the light composition, more sustainable plant production, higher concentrations of chlorophyll and some phenolic compounds are possible.

1. Introduction

Lettuce plants are produced during winter seasons in greenhouses and in indoor farming without natural light all year round. This is only possible through the use of supplementary light, where carbon arc lamps were one of the first assimilation lights developed and used at the end of the 19th century [1]. These have a bluish light spectrum but also emit UV radiation. These type of lamps were supplemented by incandescent filament lamps and by the first low-pressure discharge lamps at the beginning of the 20th century [1]. Since the 1960s, HPS lamps were the number one supplementary lighting in greenhouses due to their low acquisition costs [2], although HPS lamps emit a lot of heat and should, therefore, not be placed too close to plants to avoid plant damage. In addition to HPS lamps, other lamps such as fluorescent and metal halide lamps emitting white broad light are also used as supplementary lighting to cultivate plants [1]. However, light emitting diodes (LEDs) have become more and more important in recent years, because they are more energy efficient and emit less heat radiation towards the plants, which means they can be brought closer to the plants compare to HPS lighting [3]. While HPS lighting primarily emits yellow and orange, but only a slightly bluish light (~5%) [4], LED lighting can be constructed to match the photosynthesis action spectrum of a leaf [5], for instance the action spectrum of lettuce leaves according to McCree [6]. In the past, many groups have shown that lettuce growth under LED lighting is equal or better than growth under HPS, which is well summarized by Bantis, et al. [7].
In contrast to LEDs, HPS lightings also emit a substantial amount of heat radiation. This part of the spectrum is absorbed by water in the leaves. As a consequence, the leaf temperature of plants grown under HPS lighting is typically two to three degrees Celsius warmer than under LED lighting [8]. At low and moderate air temperature, an increase in leaf temperature is welcomed by horticulturists because it accelerates photosynthesis. However, higher leaf temperatures also increase stomatal conductance and, consequently, water evaporation through the leaves. One can, therefore, assume that lettuce produced under HPS requires more water than under LEDs. The high water consumption in vegetable production recently gained more attention because of water shortages due to increasing temperatures [9]. A better water use efficiency is also one of the central arguments of advocates of vertical farming and hydroponic systems [10]. However, at the moment there is only indirect evidence that plants growing under LEDs consume less water [11,12].
Based on these data, we postulate that lettuce grown under LEDs ought to consume less water and energy but produce a higher or equal yield compared to HPS lighting. To confirm these assumptions, we determined the water and energy consumption and the water use efficiency, among other things, and compared them with each other depending on the light source. In this study, we tested the absorption spectrum caused by a new LED fixture that we developed recently [13]. The emission spectrum of this LED fixture meets the wavelengths from 400 to 750 nm and in certain wavelengths approximates the absorption spectrum of chlorophylls and other photosynthetic pigments in lettuce leaves. This fixture was used to grow lettuce plants in a greenhouse and compare lettuce head diameter and fresh weight, number of leaves dry matter, as well as chlorophyll concentrations to plants grown under HPS lighting supplemented to the natural light. We assume that the chlorophyll concentration can be increased when the light composition caused by LEDs is optimized. We monitored also the levels of phenolic acids and flavonoids since these are common indicators of plant stress [14]. Lettuce is no exception. Heat and cold stress, high light intensities and lack of water increase the content of phenols, while low light conditions reduce it [15,16]. One of the most prominent group of phenolic compounds in lettuce is caffeic acid and its derivatives [17]. Previous studies indicate that the content of individual caffeic acid derivatives increase if nitrogen access is limited [18] and when CO2 levels increase [19]. Furthermore, we correlated the concentrations of chlorophyll with that of phenolic compounds to answer the question of why the phenols change.

2. Materials and Methods

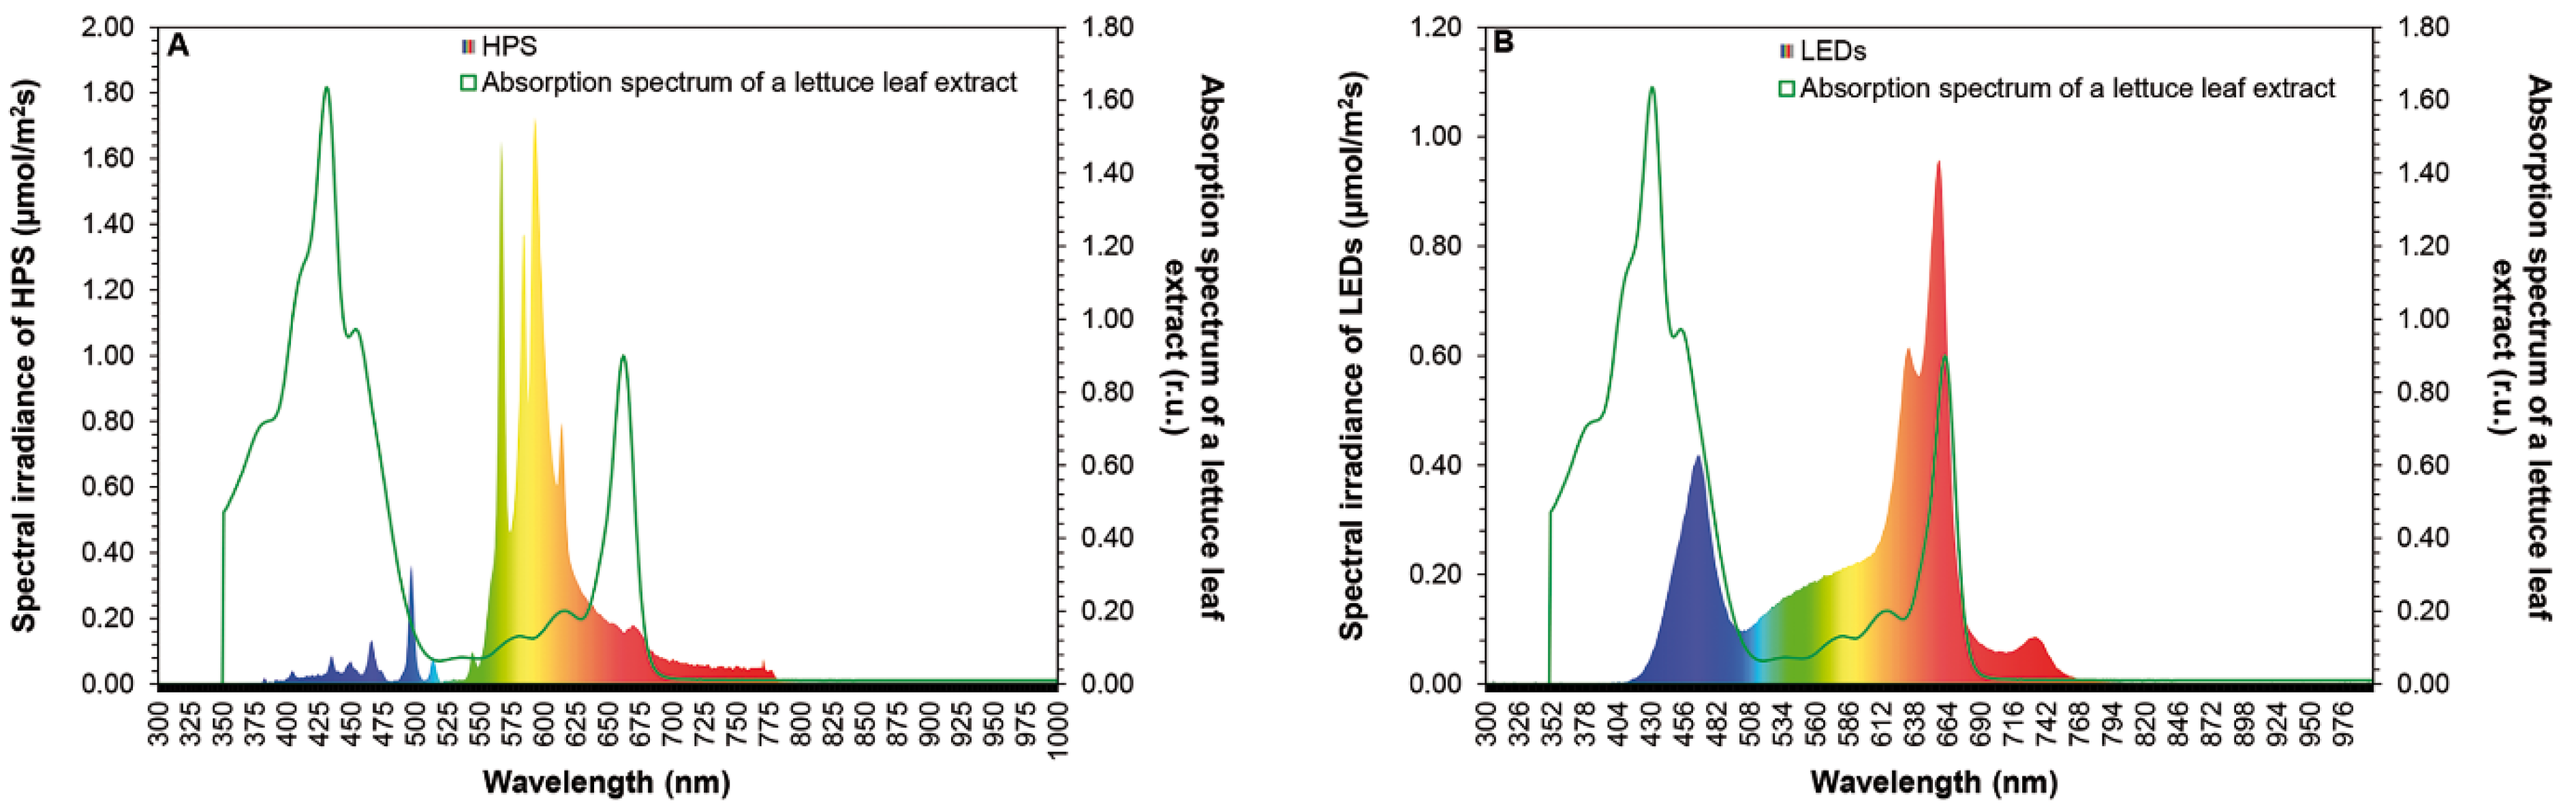
2.1. Overhead-Lighting

The chlorophyll absorption spectrum of acetone extracts (n = 4) were measured as described previously [20]. Twelve ml of acetone (100%) were added to an aliquot of 0.5 g fresh lettuce material. Afterwards, it was firstly homogenized (Ultra-Turrax T 25, Jahnke & Kunkel, IKA-Labortechnik; Staufen, Germany) for 1 min at 14,000 rpm and then centrifuged for 15 min (5000 rpm), where this procedure was performed twice. The supernatants were given in a 25 mL volumetric flask and filled up with acetone (100%) to a maximum of 25 mL. The sample extractions were measured from 300 nm to 100 nm with a spectrophotometer (Model 690, Gamma Analysen Technik GmbH; Bremerhaven, Germany) and the absorption spectrum can be seen in Figure 1. Based on these results, an LED fixture with an emission spectrum that matches partially the wavelength range of the photosynthetic active radiation (PAR) and, in certain parts, approximates the absorptions spectrum of chlorophylls and other photosynthetic pigments in lettuce leaves was designed (Figure 1). The LED fixture was manufactured with 14 LEDs (Roschwege GmbH, Greifenstein, Germany), which were combined with zoom lenses (B & M Optics GmBH, Limburg, Germany). These have a radiation angle of 60°. The LED fixture caused an average photobiological photon flux density (PBFD, measured from 350 to 800 nm) of 55 µmol m−2 s−1 at a distance of 1.8 m between the installed lamp and the cultivation table. In detail, the LED fixture was manufactured with three warm white (3000 K) and three cool white LEDs (6000 K), two blue LEDs and two red multichip LEDs (380–840 nm), two LEDs (630 nm), three LEDs (660 nm) and one LED (720 nm). Each LED had an output of 10 W. The LED fixture was designed as a box shape and had the following dimensions: length = 50 cm, width = 20 cm and depth = 15 cm. This LED fixture was compared to a HPS lamp (SON-T Agro 400, Koninklijke Philips N.V., Amsterdam, The Netherlands), which had an output of 400 W. The emission spectrum of the HPS lamp is also given in Figure 1, and the light intensity in the PBFD range of the HPS lighting was the same as mentioned for the LED fixture at a distance of 1.8 m.

2.2. Experimental Set-Up

Before the multi-leaf lettuce (Lactuca sativa L., cv. Descates RZ) (Rijk Zwaan, De Lier, The Netherlands) were transferred into a 75 m2 cabin of a research Venlo-type greenhouse at Humboldt-Universität zu Berlin, the seeds were germinated in perlite (Perligran premium, Knauf Aquapanel GmbH, Dortmund, Germany) as substrate in a separate propagation cabin in the same greenhouse (15 February 2019). After germination, the seedlings were transferred to pots (d = 13 cm, v = 1 L). These were filled with a horticultural substrate (substrate 1, Klasmann-Deilmann GmbH, Geeste, Germany). The lettuce plants were grown in the propagation cabin and were exposed to the same growing conditions. The daytime target temperature was 19 °C and the night-time target temperature was set at 17 °C. A relative humidity of 60% was maintained with a fogging system, and HPS lamps were used as an additional light system which was switched on for 15 h from 6 a.m. to 9 p.m. The plants remained in this propagation cabin until they formed four true leaves. This plant stage was the starting point for the lightning experiments referred to as planting (10 March 2019). As such, the potted lettuce plants were transferred into a 75 m2 compartment and placed on cultivation tables.
The experiments consisted of three treatments: natural light as control, natural light plus HPS and natural light plus LEDs. Each light treatment was replicated three times. Each plot had the size of 1 m2 on which 16 lettuce plants were placed. The individual plots were each 3 m apart. The temperature set-points were the same as mentioned above. To avoid plant damages, the ventilation was opened when the temperature increased above 23 °C. CO2 was not enriched. During the experiment, the temperature was never below 17 °C. A maximum daytime temperature of 27 °C was reached in April. The energy screen was used as a standard to save energy, which was closed if the global radiation was below 2 W/m2. The plants were fertilized as needed. The substrate moisture was measured with an analogue tensiometer (Tensiometer, Step Systems GmbH, Nürnberg, Germany). The suction tension was set to 120 hPa. If this was exceeded in the substrate, the substrates within the pots were fertilized to their field capacity. The nutrient solution was mixed according to the protocol of Göhler and Molitor [21] and contained 540 mg/L Ca(NO3)2, 850 mg/L KNO3, 128 mg/L MgSO4, 180 mg KH2PO4 and 60 mg/L Fe-Chelate (Fetrilon Combi 1, Compo Expert, Münster). Supplementary LED and HPS lighting were switched on every day between 6 a.m. and 9 p.m.

2.3. Energy and Water Consumption

The energy consumption caused by the LED fixture and the HPS lamp was measured with a power consumption meter (VOLTCRAFT RT-110, Conrad Electronic SE, Hirschau, Germany). The energy consumption was measured over the entire experimental period and is expressed as kJ for the energy consumption per hour or MJ for the total energy consumption regarding one LED fixture or one HPS lighting switched on for 49 days.
As described above, if a suction tension of 120 hPa in the substrate was exceeded, the substrates within the pots were fertilized to their field capacity. The amount of nutrient solution needed to reach this substrate state was recorded and summed up weekly to obtain the water consumption per lettuce plant depending on different light treatments. The water consumption is expressed as mL/plant. After harvest, water use efficiency (WUE) was determined as the ratio between plant fresh weight and the volume of total water consumption. The results are expressed as g fresh weight (FW)/L H2O.

2.4. Assessment of Plant Growth Characteristics

The lettuce head diameter of 30 plants per light treatment (10 per plot) was measured weekly. The diameter of the lettuce head was obtained from the average of two measurements using a folding ruler, where the cardinal direction was used as orientation for the measurements. After 49 days, eight plants per plot were randomly selected and harvested to determine leaf number and fresh weight. Only wilted or damaged leaves were removed. All other leaves longer than 1 cm were counted. Afterwards, the leaves from each lettuce head were dried in a ventilated oven at 105 °C for one day. The dry matter content was calculated by the ratio of dry mass to the fresh mass and is expressed in percentages.

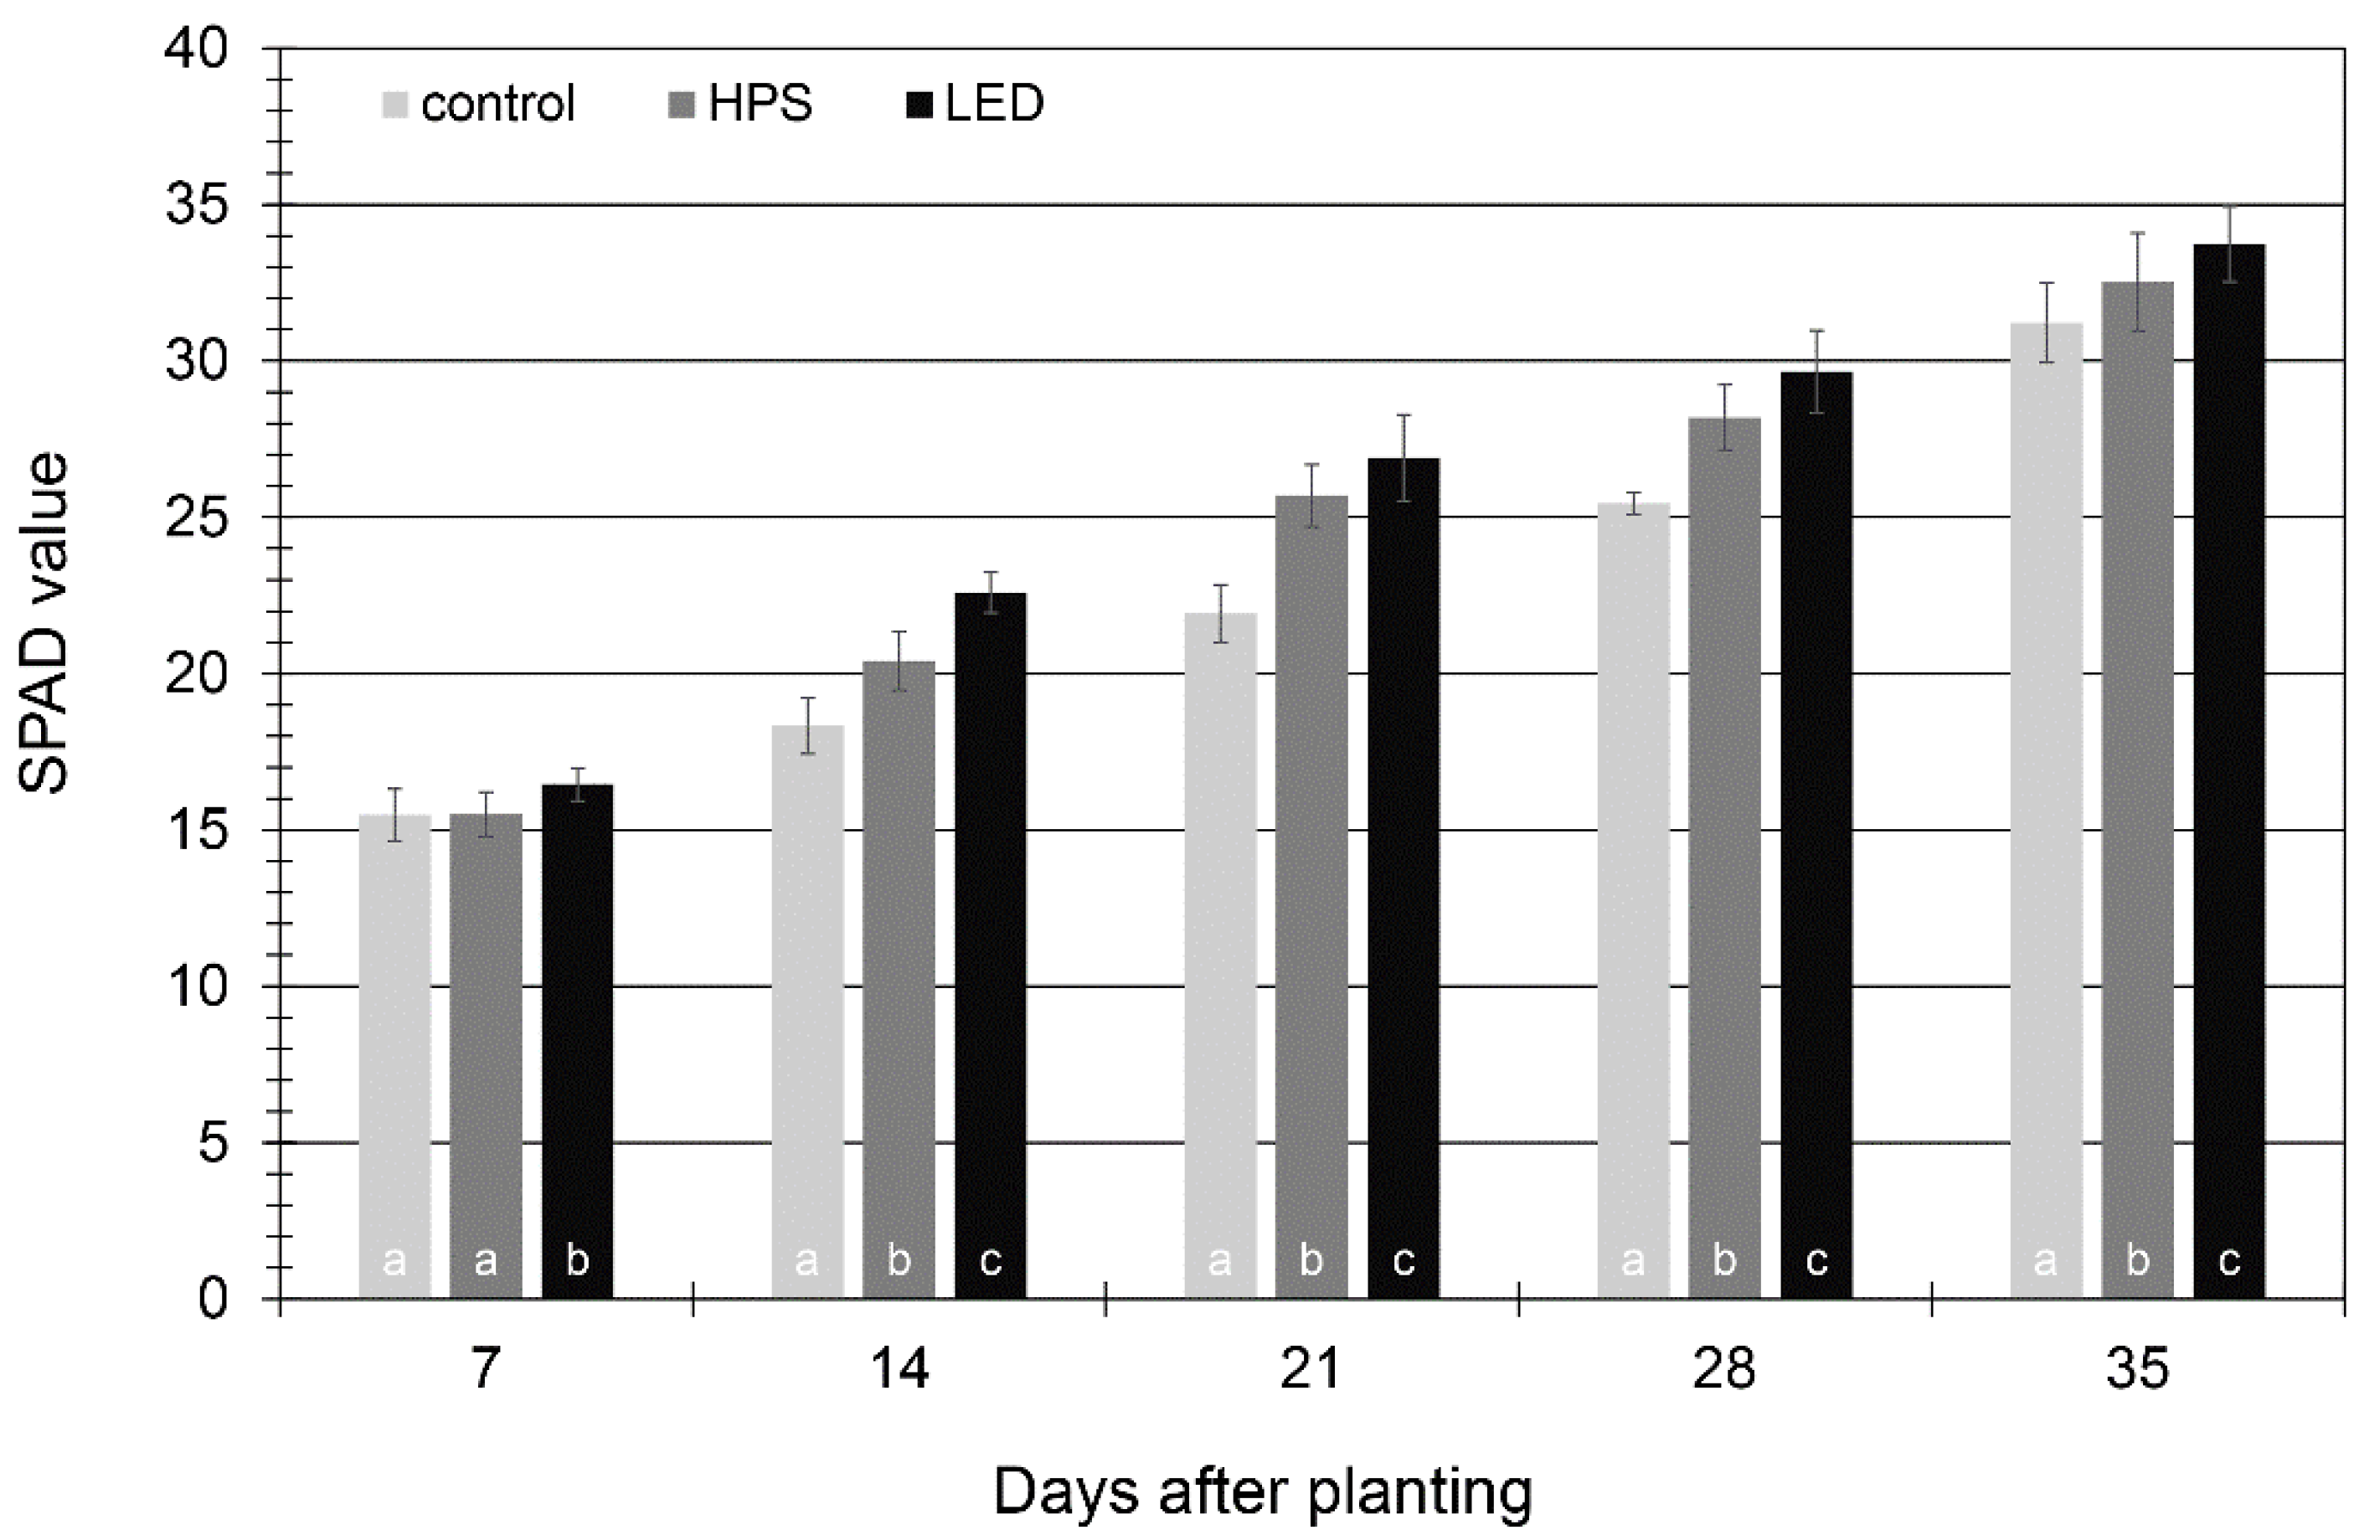
2.5. Optical Readings of Chlorophyll

The chlorophyll content in lettuce leaves was non-destructively measured using a SPAD-502 plus chlorophyll meter (Minolta Camera Co., Ltd., Osaka, Japan). This device represents a value, which is proportional to the concentration of chlorophyll in the leaf. The description of this unit states that this value is calculated from the absorbance of a leaf measured in the red and near-infrared wavelengths. Readings were taken on young leaves (n = 30) from 10 plants per plot. SPAD values were recorded starting from 7 days after planting for 5 weeks.

2.6. Chemical Analysis

49 days after planting, four plants from each plot exposed to the respective light treatment were merged to one sample to obtain three samples per light treatment in total, which were used for further analysis after they were freeze-dried (Christ Alpha 1–4, Christ, Osterrode, Germany) for 5 days. Afterwards, the samples were ground to a fine powder (MM 30, Retsch GmbH, Haan, Germany).
The extraction and determination of secondary metabolites in lettuce were performed according to the method described by Förster, et al. [22]. In this context, phenolic acids and flavonoids in lettuce were analyzed using HPLC (Dionex UltiMate 3000 with DAD detector, Thermo Fisher Scientific, Waltham, MA, USA), which was equipped with a 150 × 2.1 mm column (AcclaimPA, 3 µm, Thermo Scientific). Commercial standards of single compounds were used as references. To correct the absorption differences between the internal standard 4-methoxycinnamic acid (1 mM, Sigma-Aldrich, Taufkirchen, Germany; RF = 1) and the detected phenolic acids and flavonoids, the following determined response factors (RF) were used: RF = 1.42 for caffeoyltartaric acid (Sigma-Aldrich) and dicaffeoyltartaric acid (Sigma-Aldrich), RF = 1.58 for caffeoylquinic acid (Sigma-Aldrich) and dicaffeoylquinic acid (Sigma-Aldrich), RF = 2.16 for caffeoylmalic acid (PhytoLab GmbH & Co. KG, Vestenbergsgreuth, Germany), and RF = 2.15 for quercetin-3-O-(6″-malonylglucoside) (Sigma-Aldrich).

2.7. Data Analysis

The effects of different light treatments on plant growth characteristics, as well as on primary and secondary metabolites in lettuce plants, were evaluated using analyses of variance (ANNOVA) with SPSS, package version 26.0. The normal distribution of the data was proved using the Kolmogorov-Smirnov test, where the results obtained did not oppose the evaluation by factorial ANNOVA. Significant differences were calculated using Tukey tests at a significance level of p < 0.05. Different small letters indicate significant differences. The standard deviation is illustrated by “±” in tables or by bars in figures. Furthermore, the Pearson correlation coefficient (r) was calculated to measure the linear correlation between chlorophyll and phenolic compounds at a significance level of p < 0.05. All measured chlorophyll and phenol concentrations were taken into account as a function of all light treatments.

3. Results

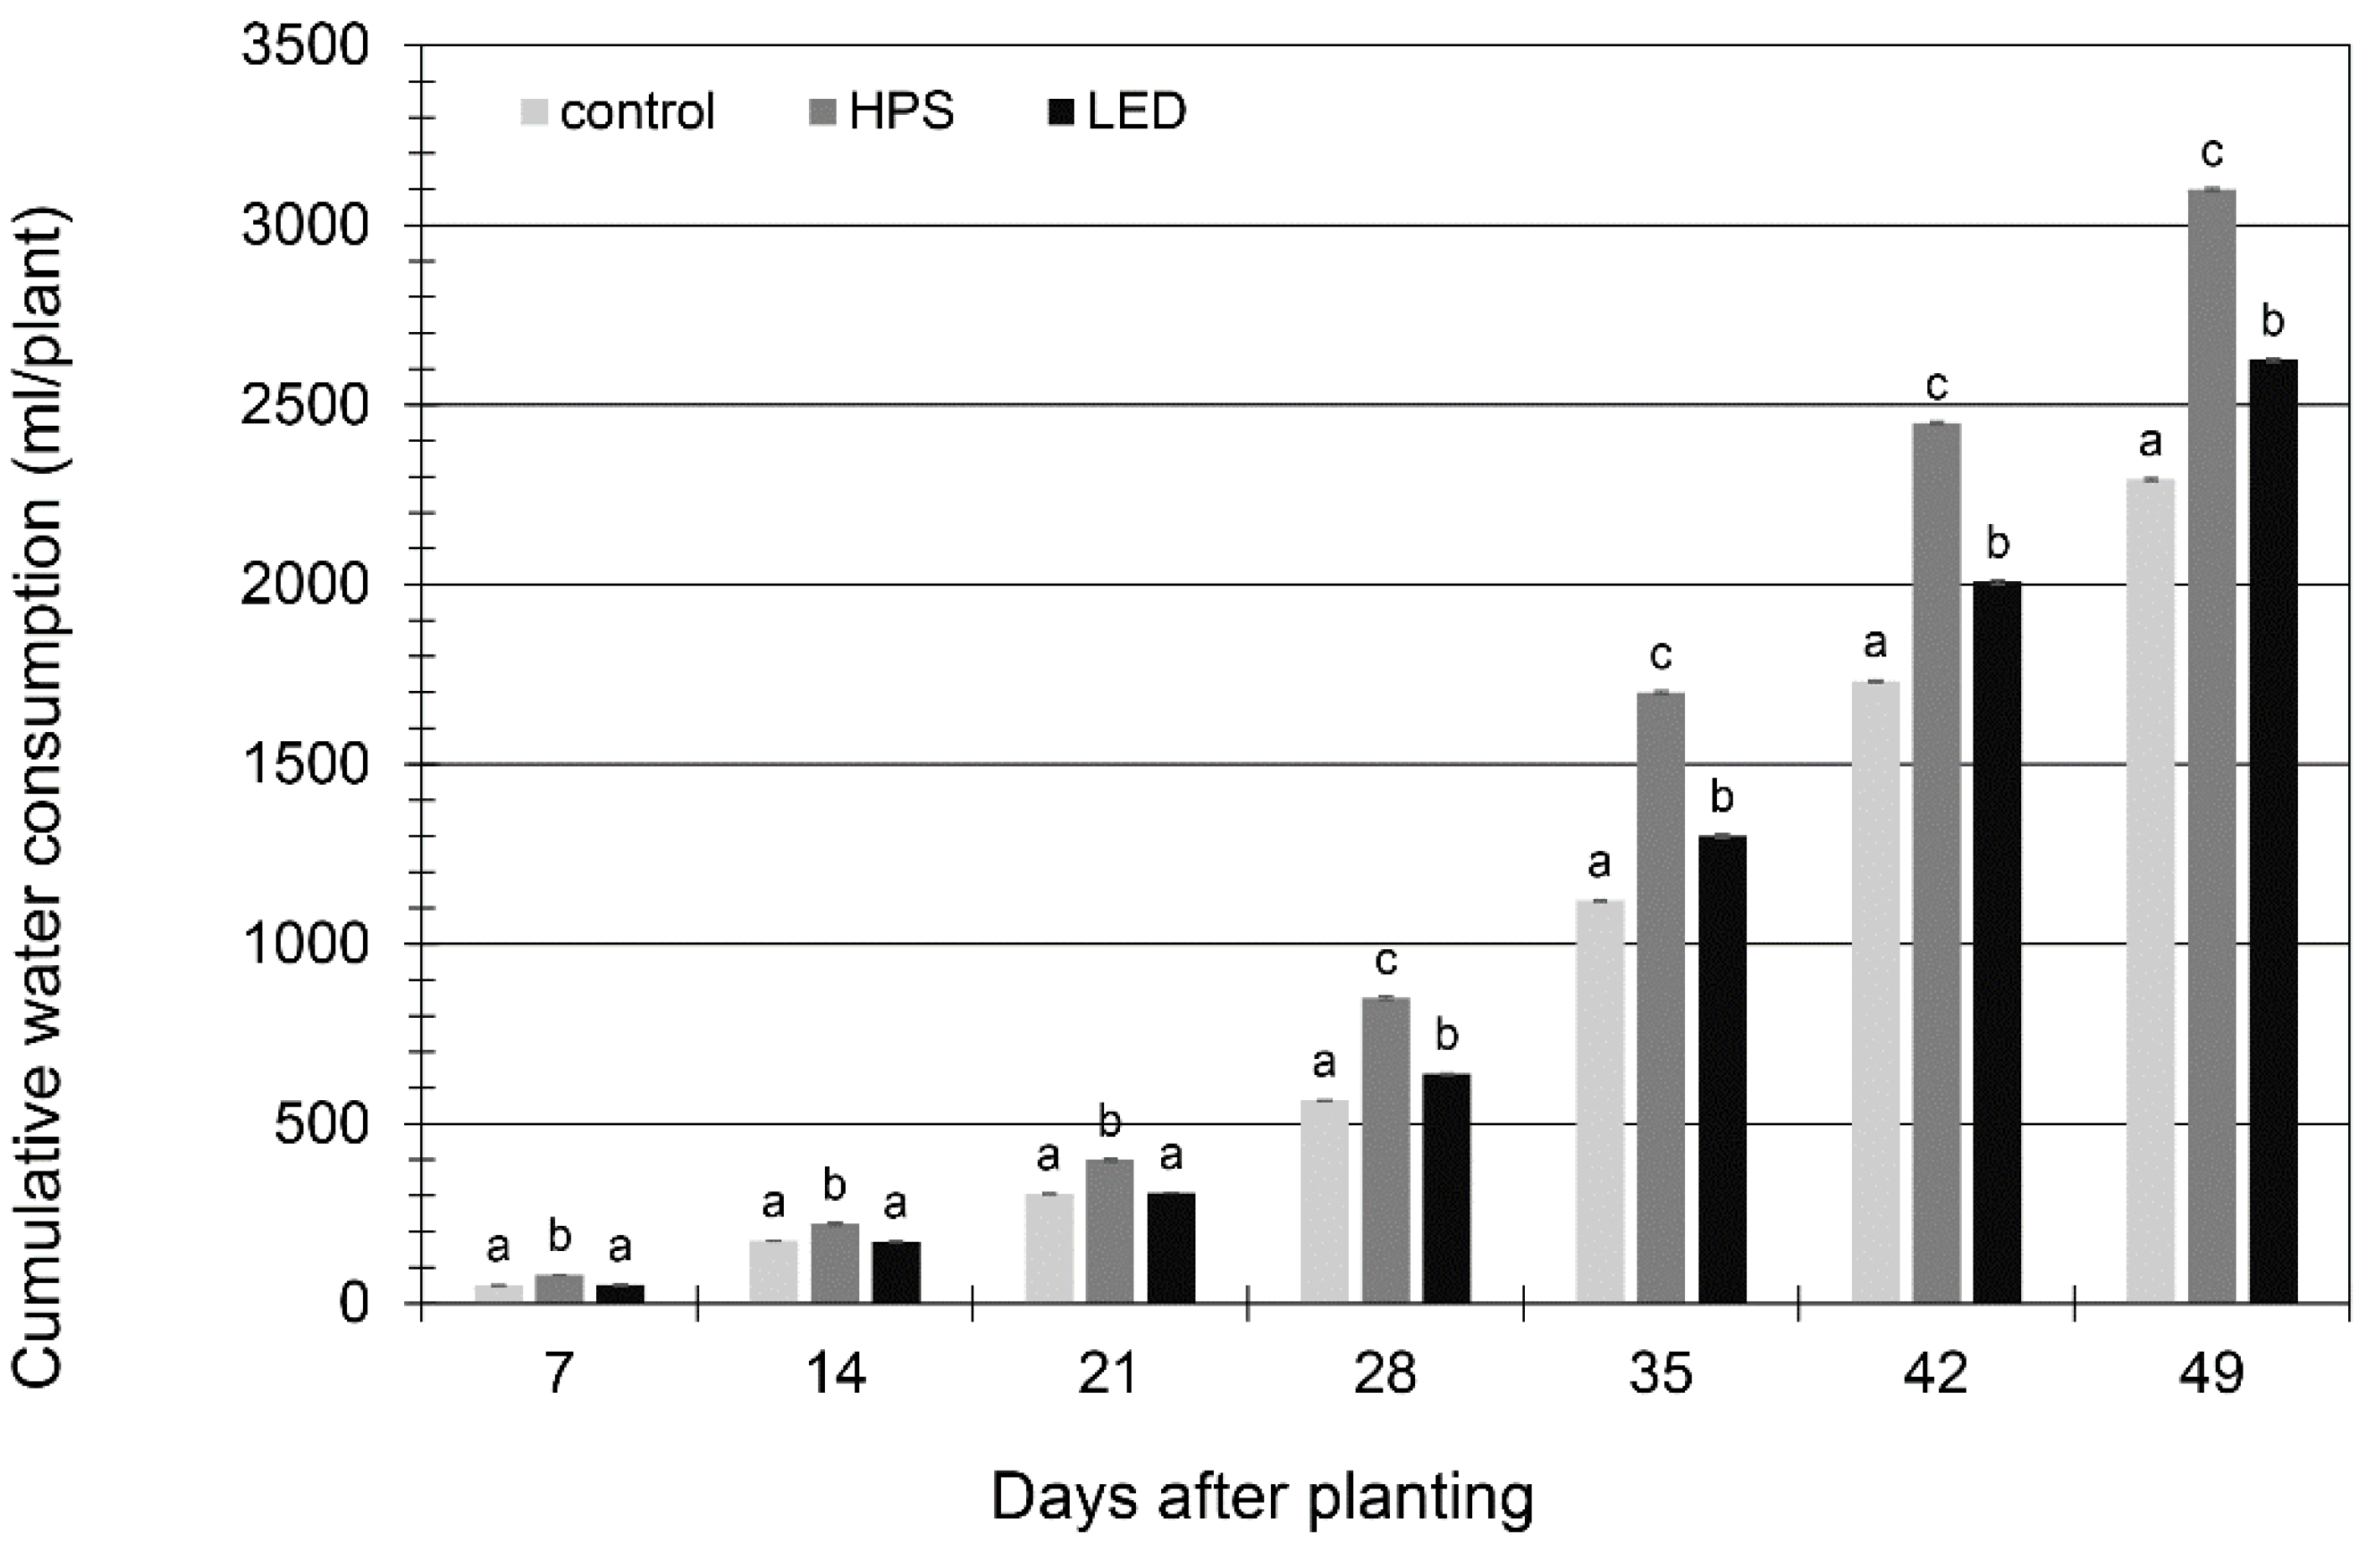
3.1. Energy and Water Savings

Under the growing conditions for the multi-leaf lettuce (Lactuca sativa L., cv. Descates RZ), the energy consumption per hour of one HPS lighting was 1558.08 kJ, whereas one LED fixture consumed 378.36 kJ during the same time (Table 1). Although the LED fixture consumed less energy, the PBFD measured in a distance of 1.8 m was the same (55 µmoL m−2 s−1). This is mainly based on the fact that LEDs are better at converting electrical power to photosynthetic light [23]. Taking into account an experimental period of 49 days and a light application duration of 15 h per day, the total energy consumption of the HPS lighting was 1145.19 MJ, and that of the LED fixture was 278.10 MJ (Table 1). From this it can be calculated that the energy saving with the new LED fixture was almost 76% compared to HPS lighting. Similar results were found when the HPS lighting was compared with the LED intracanopy lighting towers to grow tomatoes [24] or by Katzin, et al. [25], who calculated energy savings of up to 60% for tomato production in greenhouses located in The Netherlands by transitioning from HPS lighting to LED lighting. In all cases, including the present study, it must be mentioned that LEDs emit less heat than HPS lamps, which must be compensated by the greenhouse heating system. Taking this into account, the energy savings of LEDs can be as low as 10 to 25% [25].
After just 7 days after planting (DAP), lettuce plants exposed to HPS lighting consumed significantly more water (70%) than plants grown under the LED fixture or under the control (Figure 2). At the same assessment date, no differences existed between plants grown under control conditions and LED lighting. These findings were maintained until 21 DAP. From day 21 to day 49 after planting, water consumption of plants grown under supplementary lighting increased significantly compared to the control plants. At the end of the experiment, the significantly highest cumulative water consumption was under HPS lighting (3099 mL/plant), which was significantly higher than that of plants produced under the LED fixture (2626 mL/plant) (Figure 2). The lowest cumulative water consumption was caused by natural lighting under greenhouse conditions (2293 mL/plant).
It has been calculated that the water consumption per lettuce plant can be reduced by 15.27% when switching from HPS lighting to LED lighting (Table 1). The WUE caused by the LEDs was at the same level as the control without additional lighting (Table 2). This worsened significantly only with the HPS lighting. Improved WUE with LEDs was also found in some other studies, but these did not compare LED with HPS lighting [11,12]. Our plant responses are most probably based on this fact that HPS lamps emit more heat than the new LED fixture, which can increase the soil and leaf temperature up to 1.5 °C, and as a consequence, the evapotranspiration rate [13,26]. To the best of our knowledge, there are no further comparable studies comparing the water consumption of plants depending on LEDs and HPS lamps.

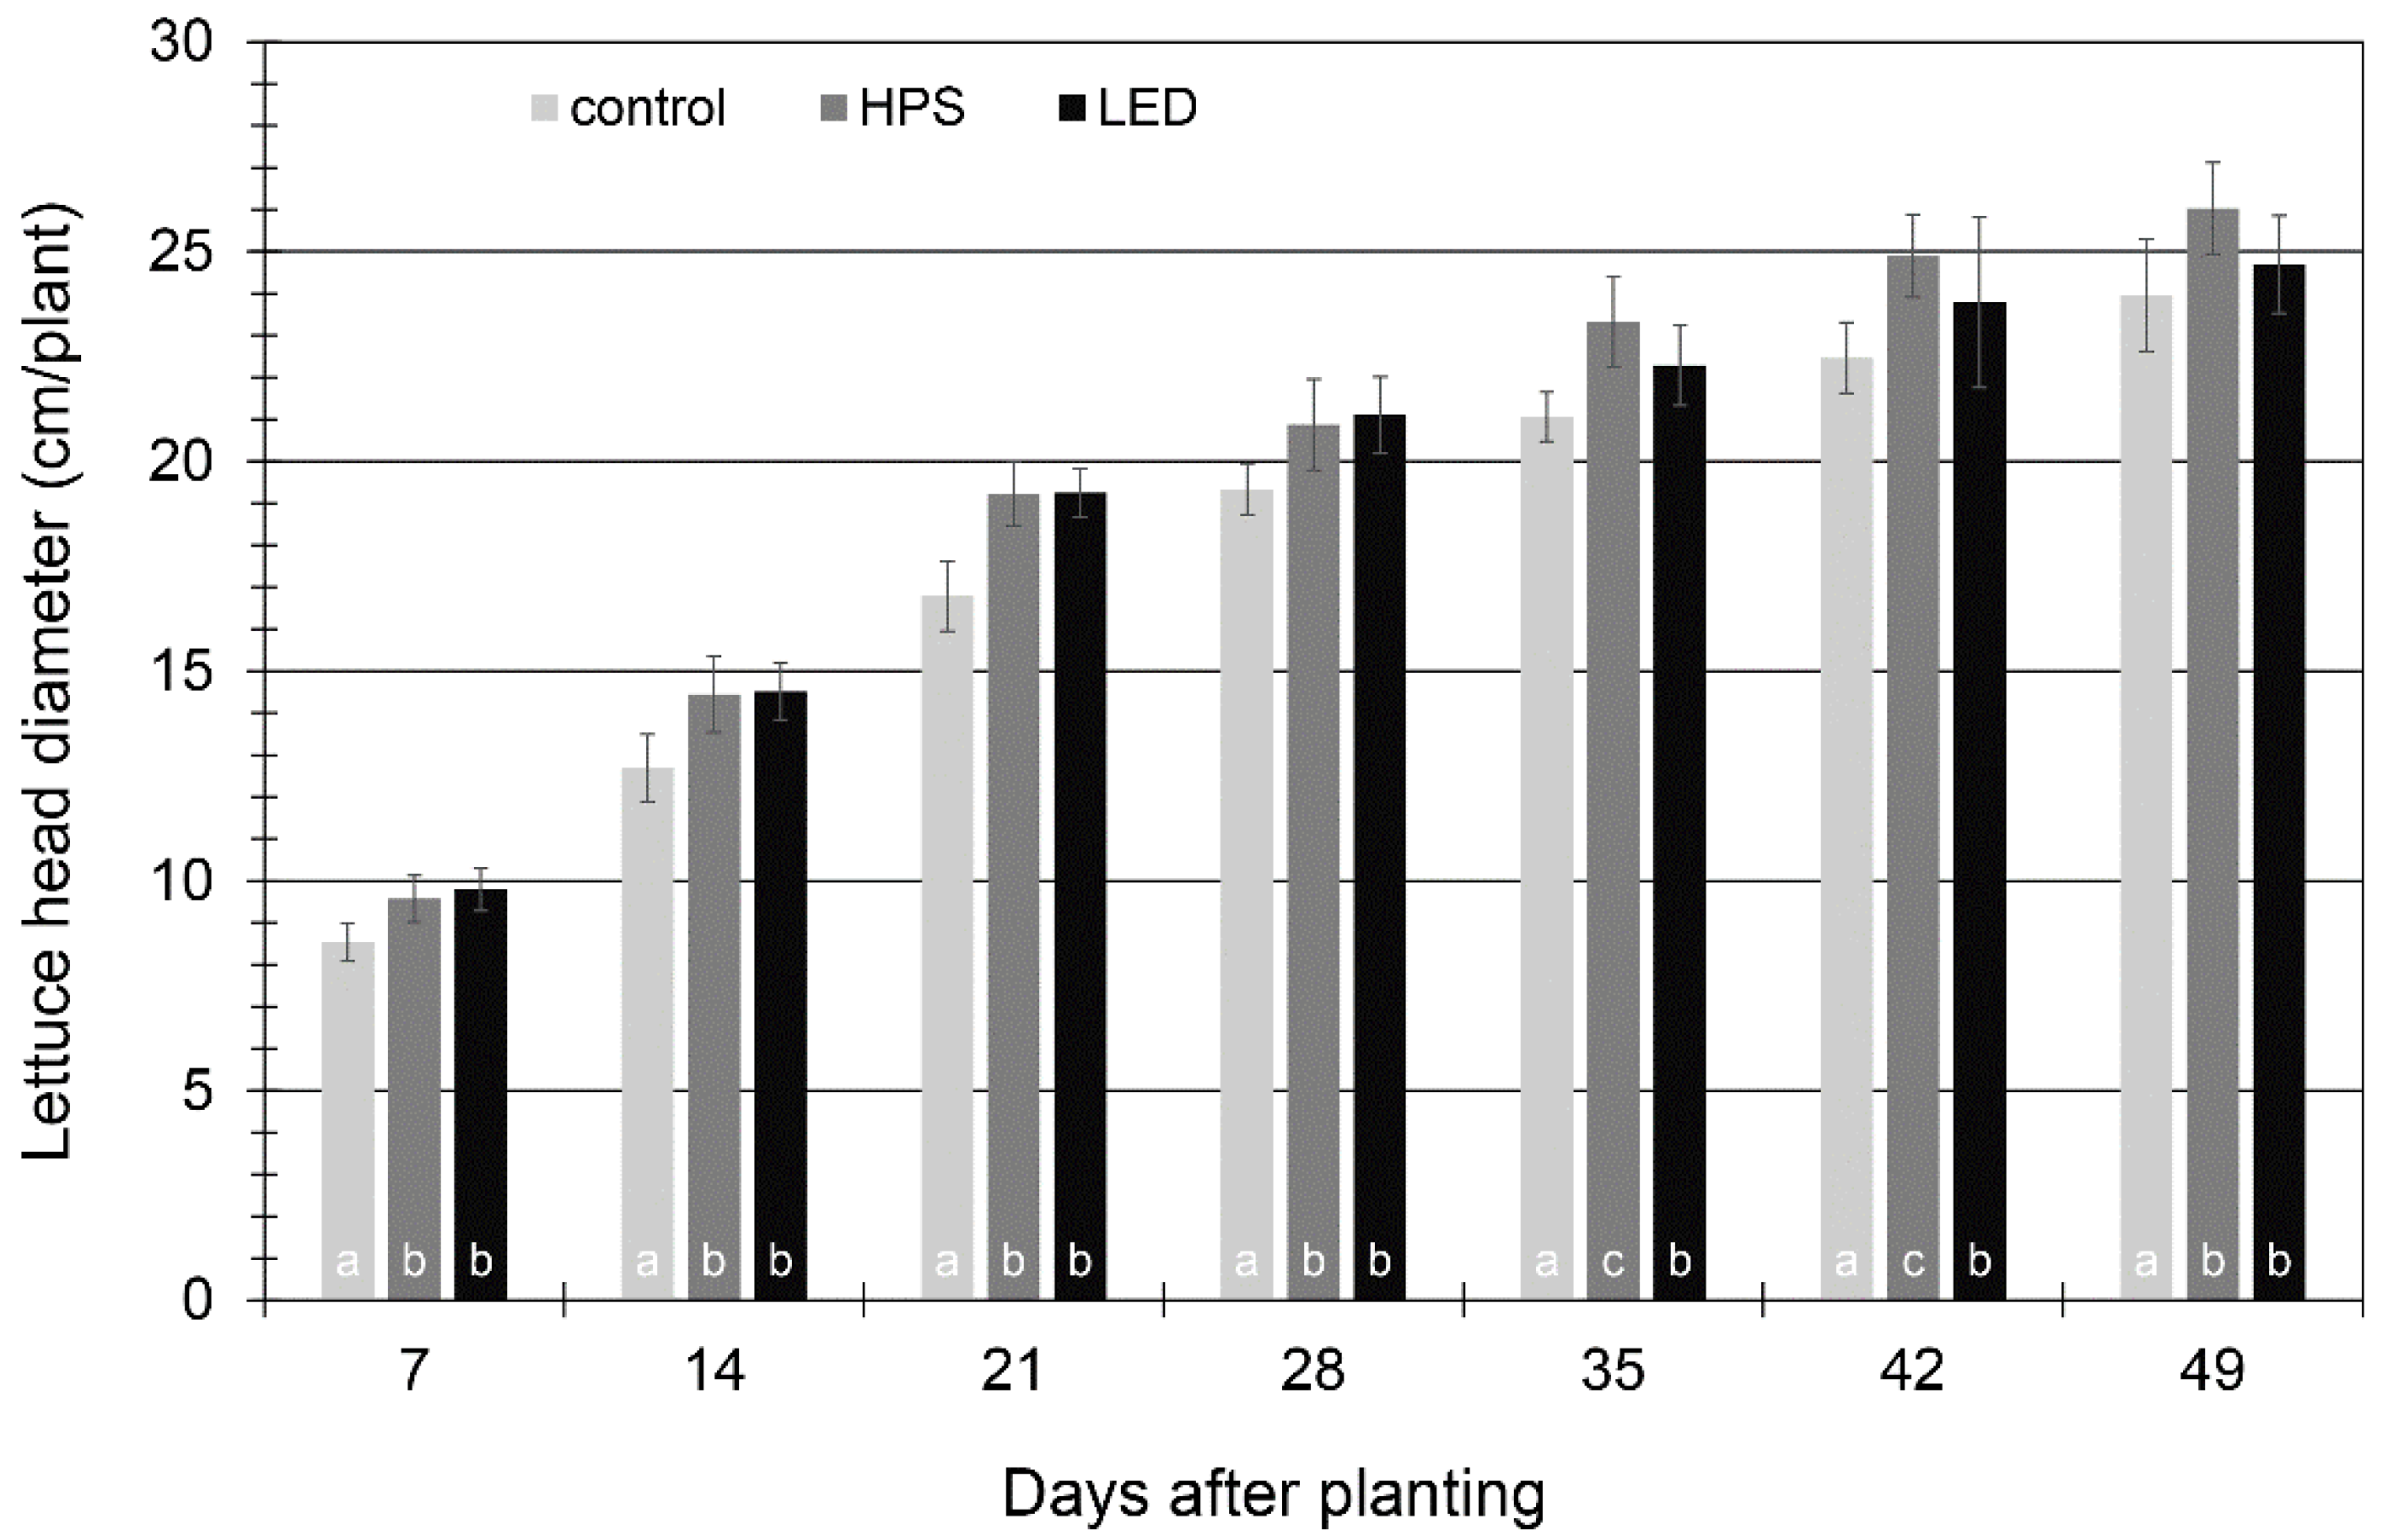
3.2. Plant Growth and Yield

The lettuce head diameter of plants exposed to both additional light treatments were significantly larger compared to the control plants at the end of the experiment (Figure 3). A maximum difference between control and light-exposed plants of 2.1 cm was measured. Apart from these significant differences, no other differences were found. Regardless of whether HPS lighting or our new LED fixture combined with natural light were used, there was no difference in the number of leaves, fresh weight and dry matter (Table 2). Ouzounis, Razi Parjikolaei, Fretté, Rosenqvist and Ottosen [26] had similar results and found that the total fresh weight and dry mater of green lettuce cannot be positively affected by natural light supplemented with blue light instead of HPS lighting. These results are in contrast to those of other studies. Wojciechowska, et al. [27], for instance, found that a combination of red (90%) and blue (10%) light as a supplement to solar radiation caused higher yields in terms of lamb’s lettuce as plants grown under HPS lighting when the same light intensity was applied. It might be possible that these plant responses were achieved because of different lettuce cultivars or a higher light intensity (200 µmol m−2 s−1) of red and blue wavelengths applied in comparison to our experiments (55 µmol m−2 s−1). It could also be possible that the application period was too short, as longer tomato experiments with the same experimental setup as described in our study resulted in a higher light use efficiency and higher yields in favor of the LED treatment [13]. Other research groups added far-red with an intensity of 52 µmol m−2 s−1 [28] or 26 µmol m−2 s−1 [29] to red-blue LEDs, which increased the plant biomass production of lettuce. The far-red radiation caused by the new LED fixture in the present study (4 µmol m−2 s−1) was not sufficient to achieve the same effects.

3.3. Phenolic Compounds and Chlorophyll Pigments

In almost all cases, supplementary lighting by 55 µmol m−2 s−1 increased the concentration of phenolic compounds in lettuce (Table 3). Compared to the natural light treatment, LED and HPS lighting generally increased the concentration of caffeoylquinic acid, dicaffeoyltartaric acid, dicaffeoylquinic acid and that of the total phenolic compounds in lettuce leaves up to 61%, 39%, 163% and 38%, respectively. This could be the effect of higher photosynthesis and mild light stress because both have a similar influence on the accumulation of phenolic compounds [30]. Becker and Kläring [19], too, found that increasing photosynthesis, however, through CO2 supplement results in an increase in phenolic compounds in lettuce. In our experiment we see an increase in phenols that resembles the effect observed by Pérez-López, Sgherri, Miranda-Apodaca, Micaelli, Lacuesta, Mena-Petite, Quartacci and Muñoz-Rueda [30]. In this context, our data also indicates that there is mostly a high correlation between the increase in chlorophyll and phenolic compounds (Table 4). Upregulation of chlorophyll under LED lighting seems to be driven by the additional blue light [31]. Chen, et al. [32] also reported that a light supplement with a higher proportion of blue and red light led to an accumulation of chlorophyll in lettuce plants. These results can be confirmed by our results. On measurement days 14 to 35, the sequence of chlorophyll concentration was always the same: LEDs > HPS > control (Figure 4). Ouzounis, Razi Parjikolaei, Fretté, Rosenqvist and Ottosen [26], however, found that a higher proportion of blue light had no effect on the chlorophyll content in lettuce. An upregulation of chlorophyll is associated with higher photosynthesis. We, therefore, believe that the increase in phenolic compounds is a consequence of higher photosynthesis. However, we cannot rule out that it is a result of light stress, albeit a mild one.
A direct comparison of specific phenolic compounds under HPS and LED lighting shows that the levels are, except for caffeoyltartaric acid, the same (Table 3). This data implies that plants under HPS and LED lighting experience the same—if any—level of stress. Some species respond to high levels of blue light with an activation of phenylalanine ammonia lyase, the enzyme that catalyzes the rate-limiting step in the biosynthesis of caffeic acid. The same might be possible for lettuce exposed to our LED fixture, because a significant increase in the concentration of caffeoyltartaric acid of 24% and 14% could be achieved compared to the control plants and plants grown under HPS lighting, respectively (Table 3). This was the only polyphenol that responded in this way. Ouzounis, Razi Parjikolaei, Fretté, Rosenqvist and Ottosen [26], however, applied blue light directly to lettuce and found no increase in caffeic acid derivatives. We, too, see no effects of the additional blue light of the LED fixture on the most phenolic compounds. Interestingly, the concentrations of caffeoylmalic acid and quercetin-3-O-(6″-malonylglucoside) were not affected by supplementary lighting for which we have no explanation. To the best of our knowledge, there are unfortunately no further studies to compare our results. Therefore, the real reasons and significance of higher caffeoyltartaric acid levels under LED lighting and of unaffected phenolic compounds in lettuce plants exposed to supplementary lighting remain to be established.

4. Conclusions

It can be concluded that by choosing the right light composition, water consumption can be reduced without loss of yield. Water savings of 15% were achieved by LED lighting compared to HPS lighting. The energy savings caused by our LED fixture were as high as expected (76%). Although the biomass could not be further increased by our LED treatment compared to HPS lighting, our results clearly show that from a horticultural point of view, the use of continuous PAR spectrum LEDs can be considered useful, as chlorophyll and some phenolic compounds increase. The most common phenolic compounds showed a very strong positive correlation with the chlorophyll concentration in lettuce. In this context, it is well known that there is also a strong correlation between the formation of chlorophyll and photosynthesis. Therefore, we assume that optimizing the light composition not only increases the chlorophyll concentration and photosynthesis, but that more phenolic compounds are synthesized as a result, since in primary metabolism a metabolic surplus of carbon resources is made available for carbon-based phenolic compounds.
In further experiments, the new type of the LED fixture should also be used as supplementary light for other crops, especially during shorter days in the winter months. Furthermore, the question must be clarified as to why some phenolic compounds accumulate differently than others. Therefore, the biosynthetic pathways should be examined more closely. An economic consideration with regard to LEDs and HPS procurement and their application over a longer period of time should also be taken into account.

Author Contributions

D.D. brought up the idea, contributed to study conception and design, acquisition, statistical analysis and interpretation of data, writing of the manuscript and discussed with reviewers and editors to modify the manuscript. T.S. made suggestions to modify the manuscript. D.V. manufactured the LED fixture. U.S. made recommendations. All authors have read and agreed to the published version of the manuscript.

Funding

This publication was funded by the Federal Ministry of Education and Research under grant number 031B0733A. The responsibility for the content of this publication lies with the authors.

Institutional Review Board Statement

Not applicable.

Informed Consent Statement

Not applicable.

Data Availability Statement

The original contributions presented in the study are included in the article. Further inquiries can be directed to the corresponding author.

Acknowledgments

We would like to thank the gardeners of the Humboldt-Universität zu Berlin for their plant care and Nadja Förster from the Division Urban Plant Ecophysiology for her support in the lab.

Conflicts of Interest

The authors declare that the research was conducted in the absence of any commercial or financial relationships that could be construed as a potential conflict of interest.

References

  1. Wheeler, R.M. A historical background of plant lighting: An Introduction to the workshop. Hortscience 2008, 43, 1942–1943. [Google Scholar] [CrossRef] [Green Version]
  2. Ouzounis, T.; Giday, H.; Kjær, K.H.; Ottosen, C.O. LED or HPS in ornamentals? A case study in roses and campanulas. Eur. J. Hortic. Sci. 2018, 83, 166–172. [Google Scholar] [CrossRef]
  3. Singh, D.; Basu, C.; Meinhardt-Wollweber, M.; Roth, B. LEDs for energy efficient greenhouse lighting. Renew. Sustain. Energy Rev. 2015, 49, 139–147. [Google Scholar] [CrossRef] [Green Version]
  4. Terfa, M.T.; Solhaug, K.A.; Gislerød, H.R.; Olsen, J.E.; Torre, S. A high proportion of blue light increases the photosynthesis capacity and leaf formation rate of Rosa×hybrida but does not affect time to flower opening. Physiol. Plantarum 2013, 148, 146–159. [Google Scholar] [CrossRef] [PubMed]
  5. Jou, J.-H.; Lin, C.-C.; Li, T.-H.; Li, C.-J.; Peng, S.-H.; Yang, F.-C.; Thomas, K.; Kumar, D.; Chi, Y.; Hsu, B.-D. Plant growth absorption spectrum mimicking light sources. Materials 2015, 8, 5265–5275. [Google Scholar] [CrossRef] [PubMed] [Green Version]
  6. McCree, K.J. The action spectrum, absorptance and quantum yield of photosynthesis in crop plants. Agric. Meteorol. 1971, 9, 191–216. [Google Scholar] [CrossRef]
  7. Bantis, F.; Smirnakou, S.; Ouzounis, T.; Koukounaras, A.; Ntagkas, N.; Radoglou, K. Current status and recent achievements in the field of horticulture with the use of light-emitting diodes (LEDs). Sci. Hortic. 2018, 235, 437–451. [Google Scholar] [CrossRef]
  8. Nelson, J.A.; Bugbee, B. Analysis of environmental effects on leaf temperature under sunlight, high pressure sodium and light emitting diodes. PLoS ONE 2015, 10, e138930. [Google Scholar] [CrossRef]
  9. Schewe, J.; Heinke, J.; Gerten, D.; Haddeland, I.; Arnell, N.W.; Clark, D.B.; Dankers, R.; Eisner, S.; Fekete, B.M.; Colón-González, F.J. Multimodel assessment of water scarcity under climate change. Proc. Natl. Acad. Sci. USA 2014, 111, 3245–3250. [Google Scholar] [CrossRef] [Green Version]
  10. Stanghellini, C.; Kemkes, F.l.K.; Knies, P. Enhancing environmental quality in agricultural systems. Acta Hort. 2003, 609, 277–283. [Google Scholar] [CrossRef] [Green Version]
  11. Pennisi, G.; Orsini, F.; Blasioli, S.; Cellini, A.; Crepaldi, A.; Braschi, I.; Spinelli, F.; Nicola, S.; Fernandez, J.A.; Stanghellini, C. Resource use efficiency of indoor lettuce (Lactuca sativa L.) cultivation as affected by red: Blue ratio provided by LED lighting. Sci. Rep. 2019, 9, 14127. [Google Scholar] [CrossRef]
  12. Pennisi, G.; Blasioli, S.; Cellini, A.; Maia, L.; Crepaldi, A.; Braschi, I.; Spinelli, F.; Nicola, S.; Fernandez, J.A.; Stanghellini, C. Unraveling the role of red: Blue LED lights on resource use efficiency and nutritional properties of indoor grown sweet basil. Front. Plant Sci. 2019, 10, 305. [Google Scholar] [CrossRef] [PubMed] [Green Version]
  13. Dannehl, D.; Schwend, T.; Veit, D.; Schmidt, U. Increase of yield, lycopene, and lutein content in tomatoes grown under continuous PAR spectrum LED lighting. Front. Plant Sci. 2021, 12, 611236. [Google Scholar] [CrossRef] [PubMed]
  14. Sharma, A.; Shahzad, B.; Rehman, A.; Bhardwaj, R.; Landi, M.; Zheng, B. Response of phenylpropanoid pathway and the role of polyphenols in plants under abiotic stress. Molecules 2019, 24, 2452. [Google Scholar] [CrossRef] [PubMed] [Green Version]
  15. Oh, M.-M.; Carey, E.E.; Rajashekar, C. Environmental stresses induce health-promoting phytochemicals in lettuce. Plant Physiol. Biochem. 2009, 47, 578–583. [Google Scholar] [CrossRef]
  16. Galieni, A.; Di Mattia, C.; De Gregorio, M.; Speca, S.; Mastrocola, D.; Pisante, M.; Stagnari, F. Effects of nutrient deficiency and abiotic environmental stresses on yield, phenolic compounds and antiradical activity in lettuce (Lactuca sativa L.). Sci. Hortic. 2015, 187, 93–101. [Google Scholar] [CrossRef]
  17. Llorach, R.; Martínez-Sánchez, A.; Tomás-Barberán, F.A.; Gil, M.I.; Ferreres, F. Characterisation of polyphenols and antioxidant properties of five lettuce varieties and escarole. Food Chem. 2008, 108, 1028–1038. [Google Scholar] [CrossRef]
  18. Becker, C.; Urlić, B.; Jukić Špika, M.; Kläring, H.-P.; Krumbein, A.; Baldermann, S.; Goreta Ban, S.; Perica, S.; Schwarz, D. Nitrogen limited red and green leaf lettuce accumulate flavonoid glycosides, caffeic acid derivatives, and sucrose while losing chlorophylls, β-carotene and xanthophylls. PLoS ONE 2015, 10, e0142867. [Google Scholar] [CrossRef]
  19. Becker, C.; Kläring, H.-P. CO2 enrichment can produce high red leaf lettuce yield while increasing most flavonoid glycoside and some caffeic acid derivative concentrations. Food Chem. 2016, 199, 736–745. [Google Scholar] [CrossRef] [Green Version]
  20. Lichtenthaler, H.K.; Wellburn, A.R. Determinations of total carotenoids and chlorophylls a and b of leaf extracts in different solvents. Biochem. Soc. Trans. 1983, 11, 591–592. [Google Scholar] [CrossRef] [Green Version]
  21. Göhler, F.; Molitor, H.-D. Erdelose Kulturverfahren im Gartenbau; Eugen Ulmer: Stuttgart, Germany, 2002. [Google Scholar]
  22. Förster, N.; Ulrichs, C.; Schreiner, M.; Arndt, N.; Schmidt, R.; Mewis, I. Ecotype variability in growth and secondary metabolite profile in Moringa oleifera: Impact of sulfur and water availability. J. Agric. Food Chem. 2015, 63, 2852–2861. [Google Scholar] [CrossRef] [PubMed]
  23. Hemming, S.; Bakker, J.C.; Campen, J.B.; Kempkes, F.L.K. Sustainable use of energy in greenhouses. In Achieving Sustainable Greenhouse Cultivation; Burleigh Dodds Science Publishing Limited: Cambridge, UK, 2019; pp. 445–492. [Google Scholar]
  24. Gomez, C.; Morrow, R.C.; Bourget, C.M.; Massa, G.D.; Mitchell, C.A. Comparison of intracanopy light-emitting diode towers and overhead high-pressure sodium lamps for supplemental lighting of greenhouse-grown tomatoes. HortTechnology 2013, 23, 93–98. [Google Scholar] [CrossRef] [Green Version]
  25. Katzin, D.; Marcelis, L.F.; van Mourik, S. Energy savings in greenhouses by transition from high-pressure sodium to LED lighting. Appl. Energy 2021, 281, 116019. [Google Scholar] [CrossRef]
  26. Ouzounis, T.; Razi Parjikolaei, B.; Fretté, X.; Rosenqvist, E.; Ottosen, C.-O. Predawn and high intensity application of supplemental blue light decreases the quantum yield of PSII and enhances the amount of phenolic acids, flavonoids, and pigments in Lactuca sativa. Front. Plant Sci. 2015, 6, 19. [Google Scholar] [CrossRef] [Green Version]
  27. Wojciechowska, R.; Długosz-Grochowska, O.; Kołton, A.; Żupnik, M. Effects of LED supplemental lighting on yield and some quality parameters of lamb’s lettuce grown in two winter cycles. Sci. Hortic. 2015, 187, 80–86. [Google Scholar] [CrossRef]
  28. Jin, W.; Urbina, J.L.; Heuvelink, E.; Marcelis, L.F. Adding far-red to red-blue light-emitting diode light promotes yield of lettuce at different planting densities. Front. Plant Sci. 2021, 11, 609977. [Google Scholar] [CrossRef] [PubMed]
  29. Li, Y.; Shi, R.; Jiang, H.; Wu, L.; Zhang, Y.; Song, S.; Su, W.; Liu, H. End-Of-Day LED lightings influence the leaf color, growth and phytochemicals in two cultivars of lettuce. Agronomy 2020, 10, 1475. [Google Scholar] [CrossRef]
  30. Pérez-López, U.; Sgherri, C.; Miranda-Apodaca, J.; Micaelli, F.; Lacuesta, M.; Mena-Petite, A.; Quartacci, M.F.; Muñoz-Rueda, A. Concentration of phenolic compounds is increased in lettuce grown under high light intensity and elevated CO2. Plant Physiol. Biochem. 2018, 123, 233–241. [Google Scholar] [CrossRef]
  31. Hogewoning, S.W.; Trouwborst, G.; Maljaars, H.; Poorter, H.; van Ieperen, W.; Harbinson, J. Blue light dose–responses of leaf photosynthesis, morphology, and chemical composition of Cucumis sativus grown under different combinations of red and blue light. J. Exp. Bot. 2010, 61, 3107–3117. [Google Scholar] [CrossRef]
  32. Chen, X.-l.; Xue, X.-z.; Guo, W.-z.; Wang, L.-c.; Qiao, X.-j. Growth and nutritional properties of lettuce affected by mixed irradiation of white and supplemental light provided by light-emitting diode. Sci. Hortic. 2016, 200, 111–118. [Google Scholar] [CrossRef]
Figure 1. Comparison of the absorption spectrum of a lettuce leaf extract with the HPS (A) and LED (B) light spectrum measured between 350 nm and 800 nm. The distance between light source and bottom was 1.8 m. Lettuce leaves were extracted with acetone.
Sustainability 13 08651 g001
Figure 2. Effects of supplementary lighting on cumulative water consumption of lettuce plants. The data represents means of 48 plants per light treatment (n = 48). Different small letters indicate significant differences calculated using Tukey tests at a significant level of p < 0.05.
Sustainability 13 08651 g002
Figure 3. Diameter of lettuce plants exposed to different light conditions. The data represents means of 30 plants per light treatment (n = 30). Different small letters show significant differences calculated using Tukey tests at a significant level of p < 0.05.
Sustainability 13 08651 g003
Figure 4. Influence of different light treatments on the chlorophyll concentration in lettuce. The data represents mean values of 30 plants per light treatment (n = 30). Different small letters show significant differences calculated using Tukey tests at a significant level of p < 0.05.
Sustainability 13 08651 g004
Table 1. Energy and water savings considering a trial period of 49 days.
ParametersHPS LightingLED Fixture
Number of lamps11
Number of plants1616
Application time per day (h)1515
Total hours of application (h)735735
Energy consumption per hour (kJ)1558.08378.36
Total energy consumption (MJ)1145.19278.10
* Energy saving in comparison to HPS lighting (%) 75.72
** Water saving in comparison to HPS lighting (%) 15.27
* The energy savings are calculated in a direct comparison of one LED fixture to one HPS lighting. ** Water savings are based on the mean water consumption of 48 lettuce plants grown under LED and HPS lighting.
Table 2. Effects of different light treatments on plant characteristics of lettuce plants.
Plant Characteristics
TreatmentNumber of Leaves
(Leaves/Plant)
Fresh Weight
(g/Plant)
Dry Matter
(%)
WUE
(g FW/L H2O)
Control161.25 ± 7.76 a131.20 ± 7.08 a4.78 ± 0.12 a57.36 ± 1.31 a
HPS250.42 ± 28.68 b154.23 ± 12.37 b5.30 ± 0.48 b49.63 ± 3.32 b
LEDs253.50 ± 17.24 b160.02 ± 5.52 b5.36 ± 0.17 b60.83 ± 1.23 a
The data represents mean values of 24 plants per light treatment (n = 24). Different small letters suggest significant differences calculated using Tukey tests proceeded at a significant level of p < 0.05. “±” represent the standard deviation.
Table 3. Influence of different light treatments on phenolic compounds in lettuce plants.
Treatment
Phenolic CompoundsControl
(µmol/g DW)
HPS
(µmol/g DW)
LEDs
(µmol/g DW)
Caffeoyltartaric acid1.92 ± 0.04 a2.09 ± 0.11 a2.38 ± 0.13 b
Caffeoylquinic acid1.14 ± 0.06 a1.57 ± 0.16 b1.84 ± 0.29 b
Caffeoylmalic acid1.07 ± 0.19 a1.06 ± 0.17 a1.12 ± 0.05 a
Dicaffeoyltartaric acid6.12 ± 0.32 a8.26 ± 0.62 b8.49 ± 0.63 b
Dicaffeoylquinic acid0.08 ± 0.01 a0.13 ± 0.03 ab0.21 ± 0.11 b
Quercetin-3-O-(6″-malonylglucoside)0.07 ± 0.01 a0.06 ± 0.02 a0.08 ± 0.02 a
Total phenolic compounds10.42 ± 0.58 a13.33 ± 0.77 b14.41 ± 0.81 b
The data represents mean values of three samples per light treatment, each sample containing four plants (n = 3). Different small letters indicate significant differences calculated using Tukey test at p < 0.05. “±” represent the standard deviation.
Table 4. Correlations between chlorophyll and phenolic compounds in lettuce.
Phenolic CompoundsChlorophyll
(r)
Caffeoyltartaric acid0.986 *
Caffeoylquinic acid0.994 *
Caffeoylmalic acid0.587
Dicaffeoyltartaric acid0.914 *
Dicaffeoylquinic acid0.989 *
Quercetin-3-O-(6″-malonylglucoside)0.484
Total phenolic compounds0.971 *
The Pearson correlation coefficient (r) was calculated from the mean values of chlorophyll and phenol data measured on the last day of the experiment. Asterisks (*) indicate a significant correlation at a significance level of p < 0.05.
Publisher’s Note: MDPI stays neutral with regard to jurisdictional claims in published maps and institutional affiliations.

