
Poverty Mapping in the Dian-Gui-Qian Contiguous Extremely Poor Area of Southwest China Based on Multi-Source Geospatial Data


Abstract
:1. Introduction
2. Study area and data
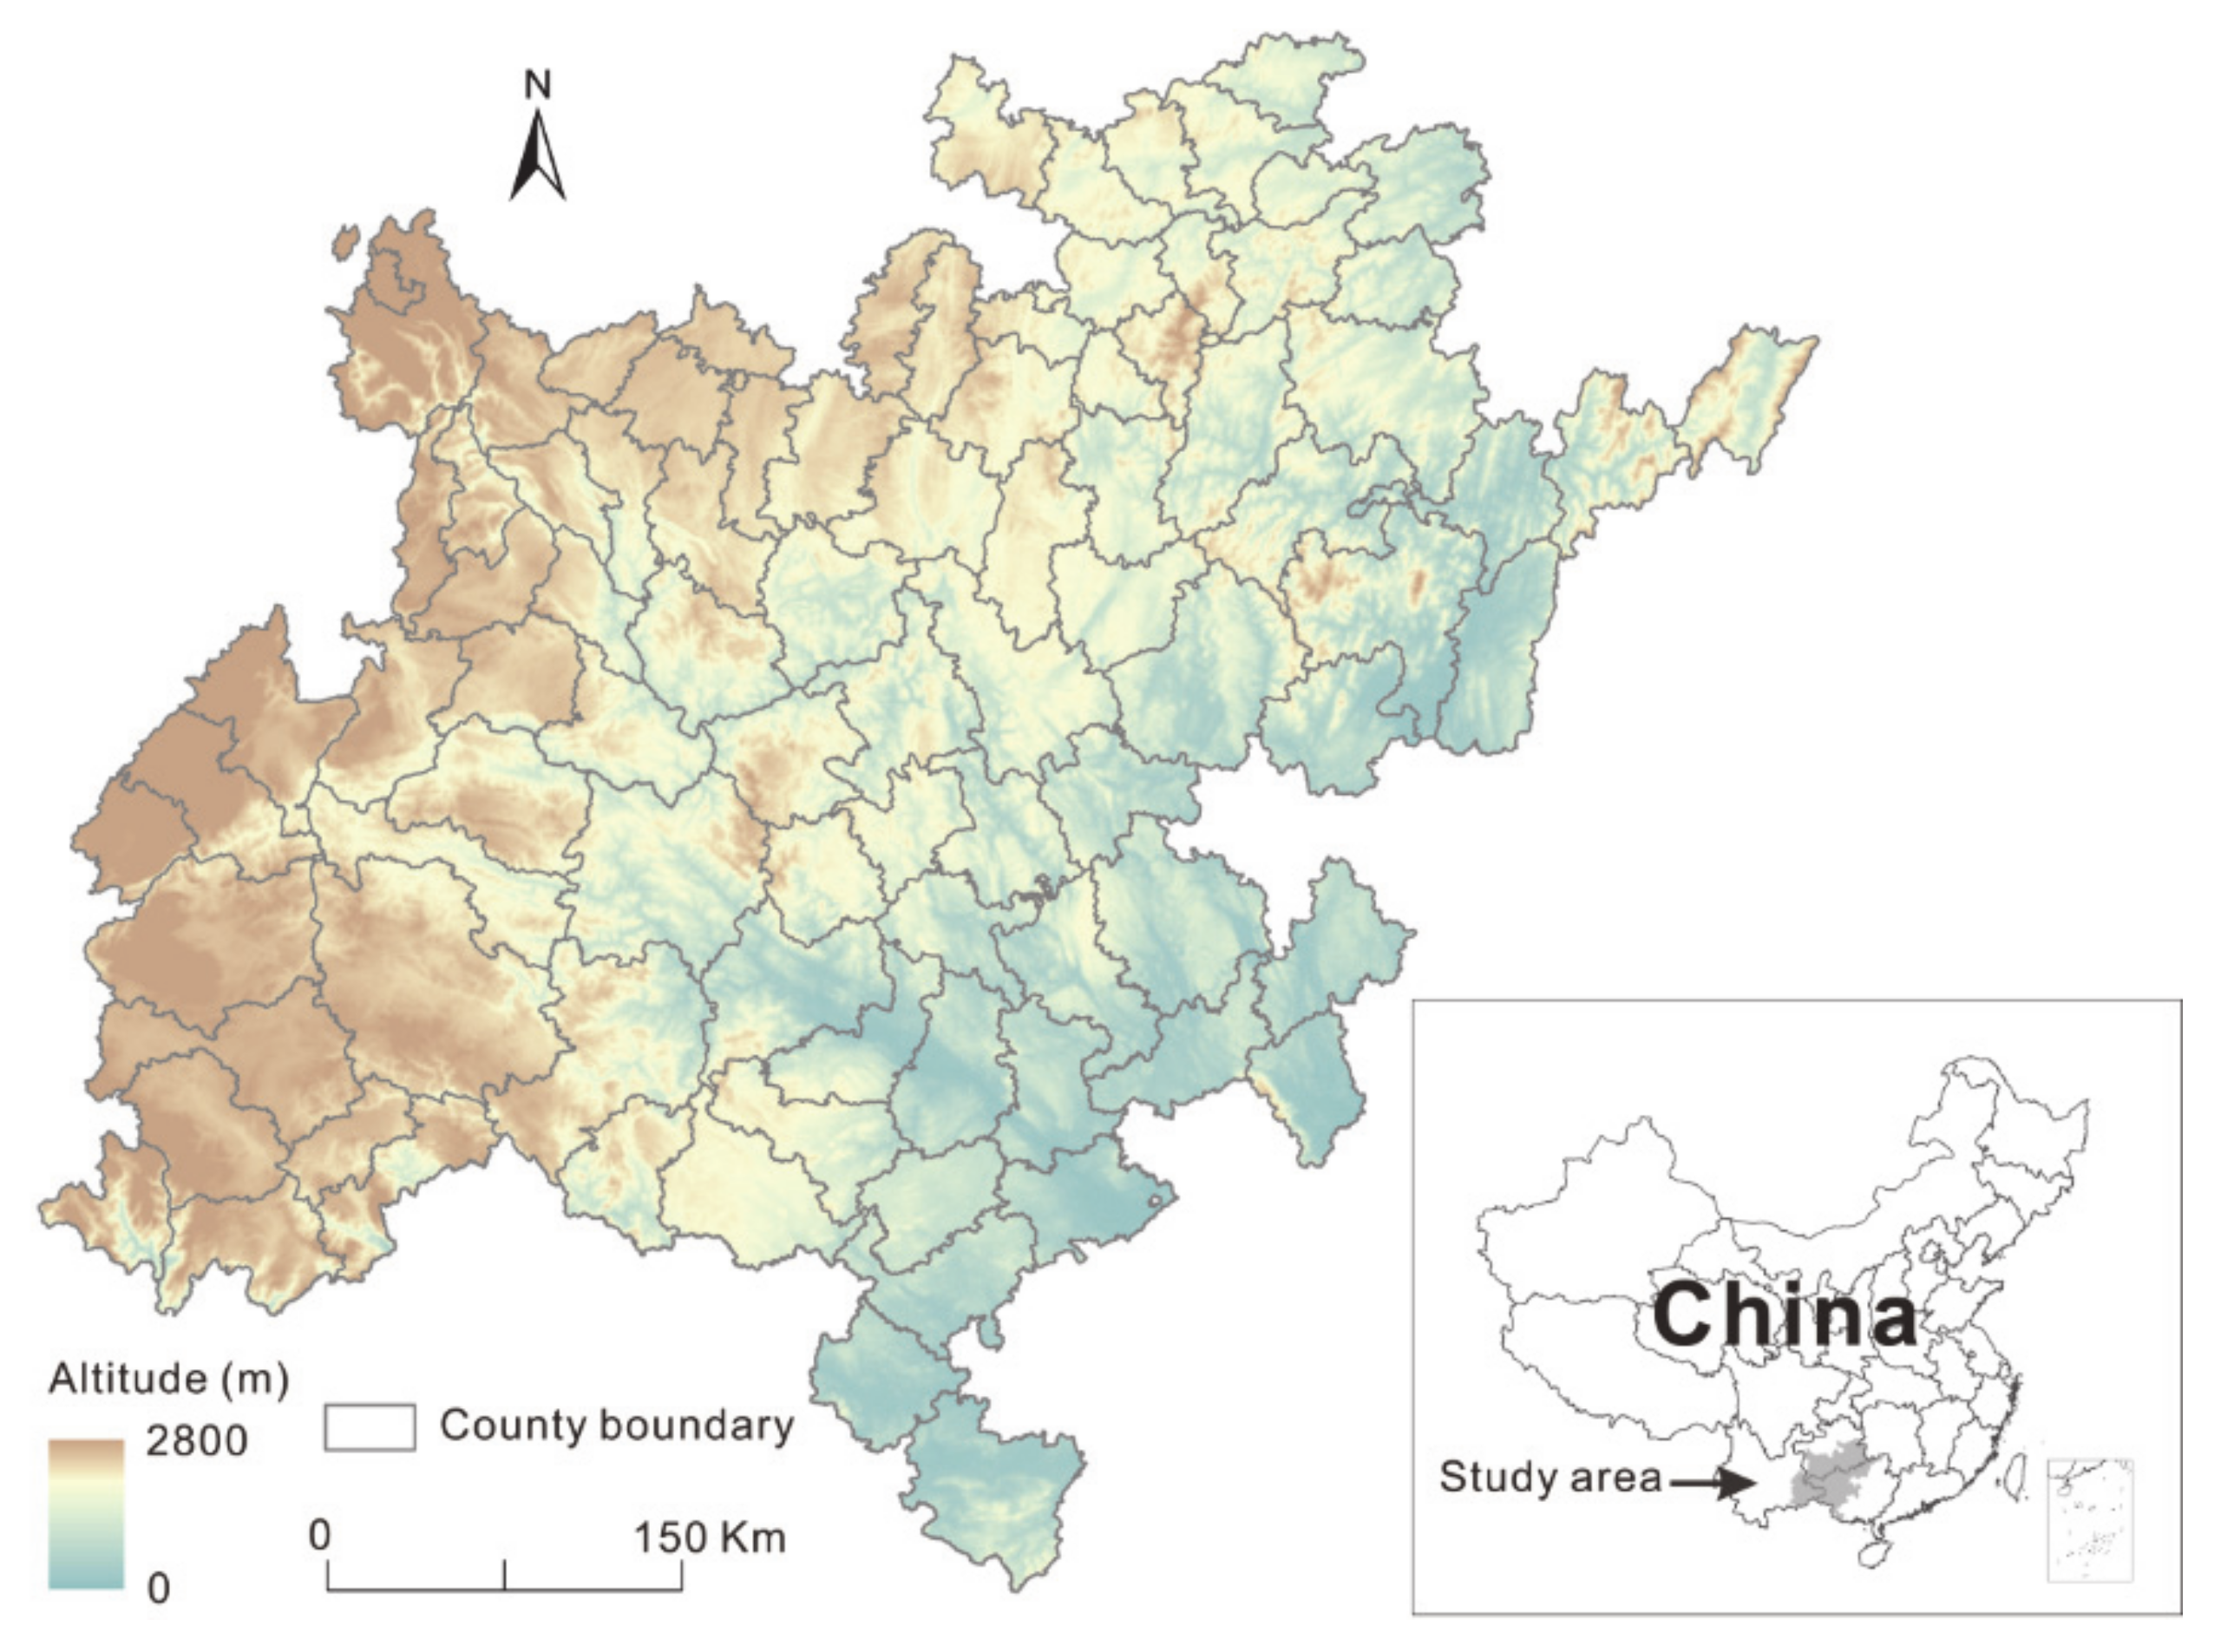
2.1. Study Area
2.2. Data
3. Methods
3.1. IPI Calculation from Census Data
3.2. IPI Identification from Spatial Data
4. Results
4.1. Relationship between IPI and NTL
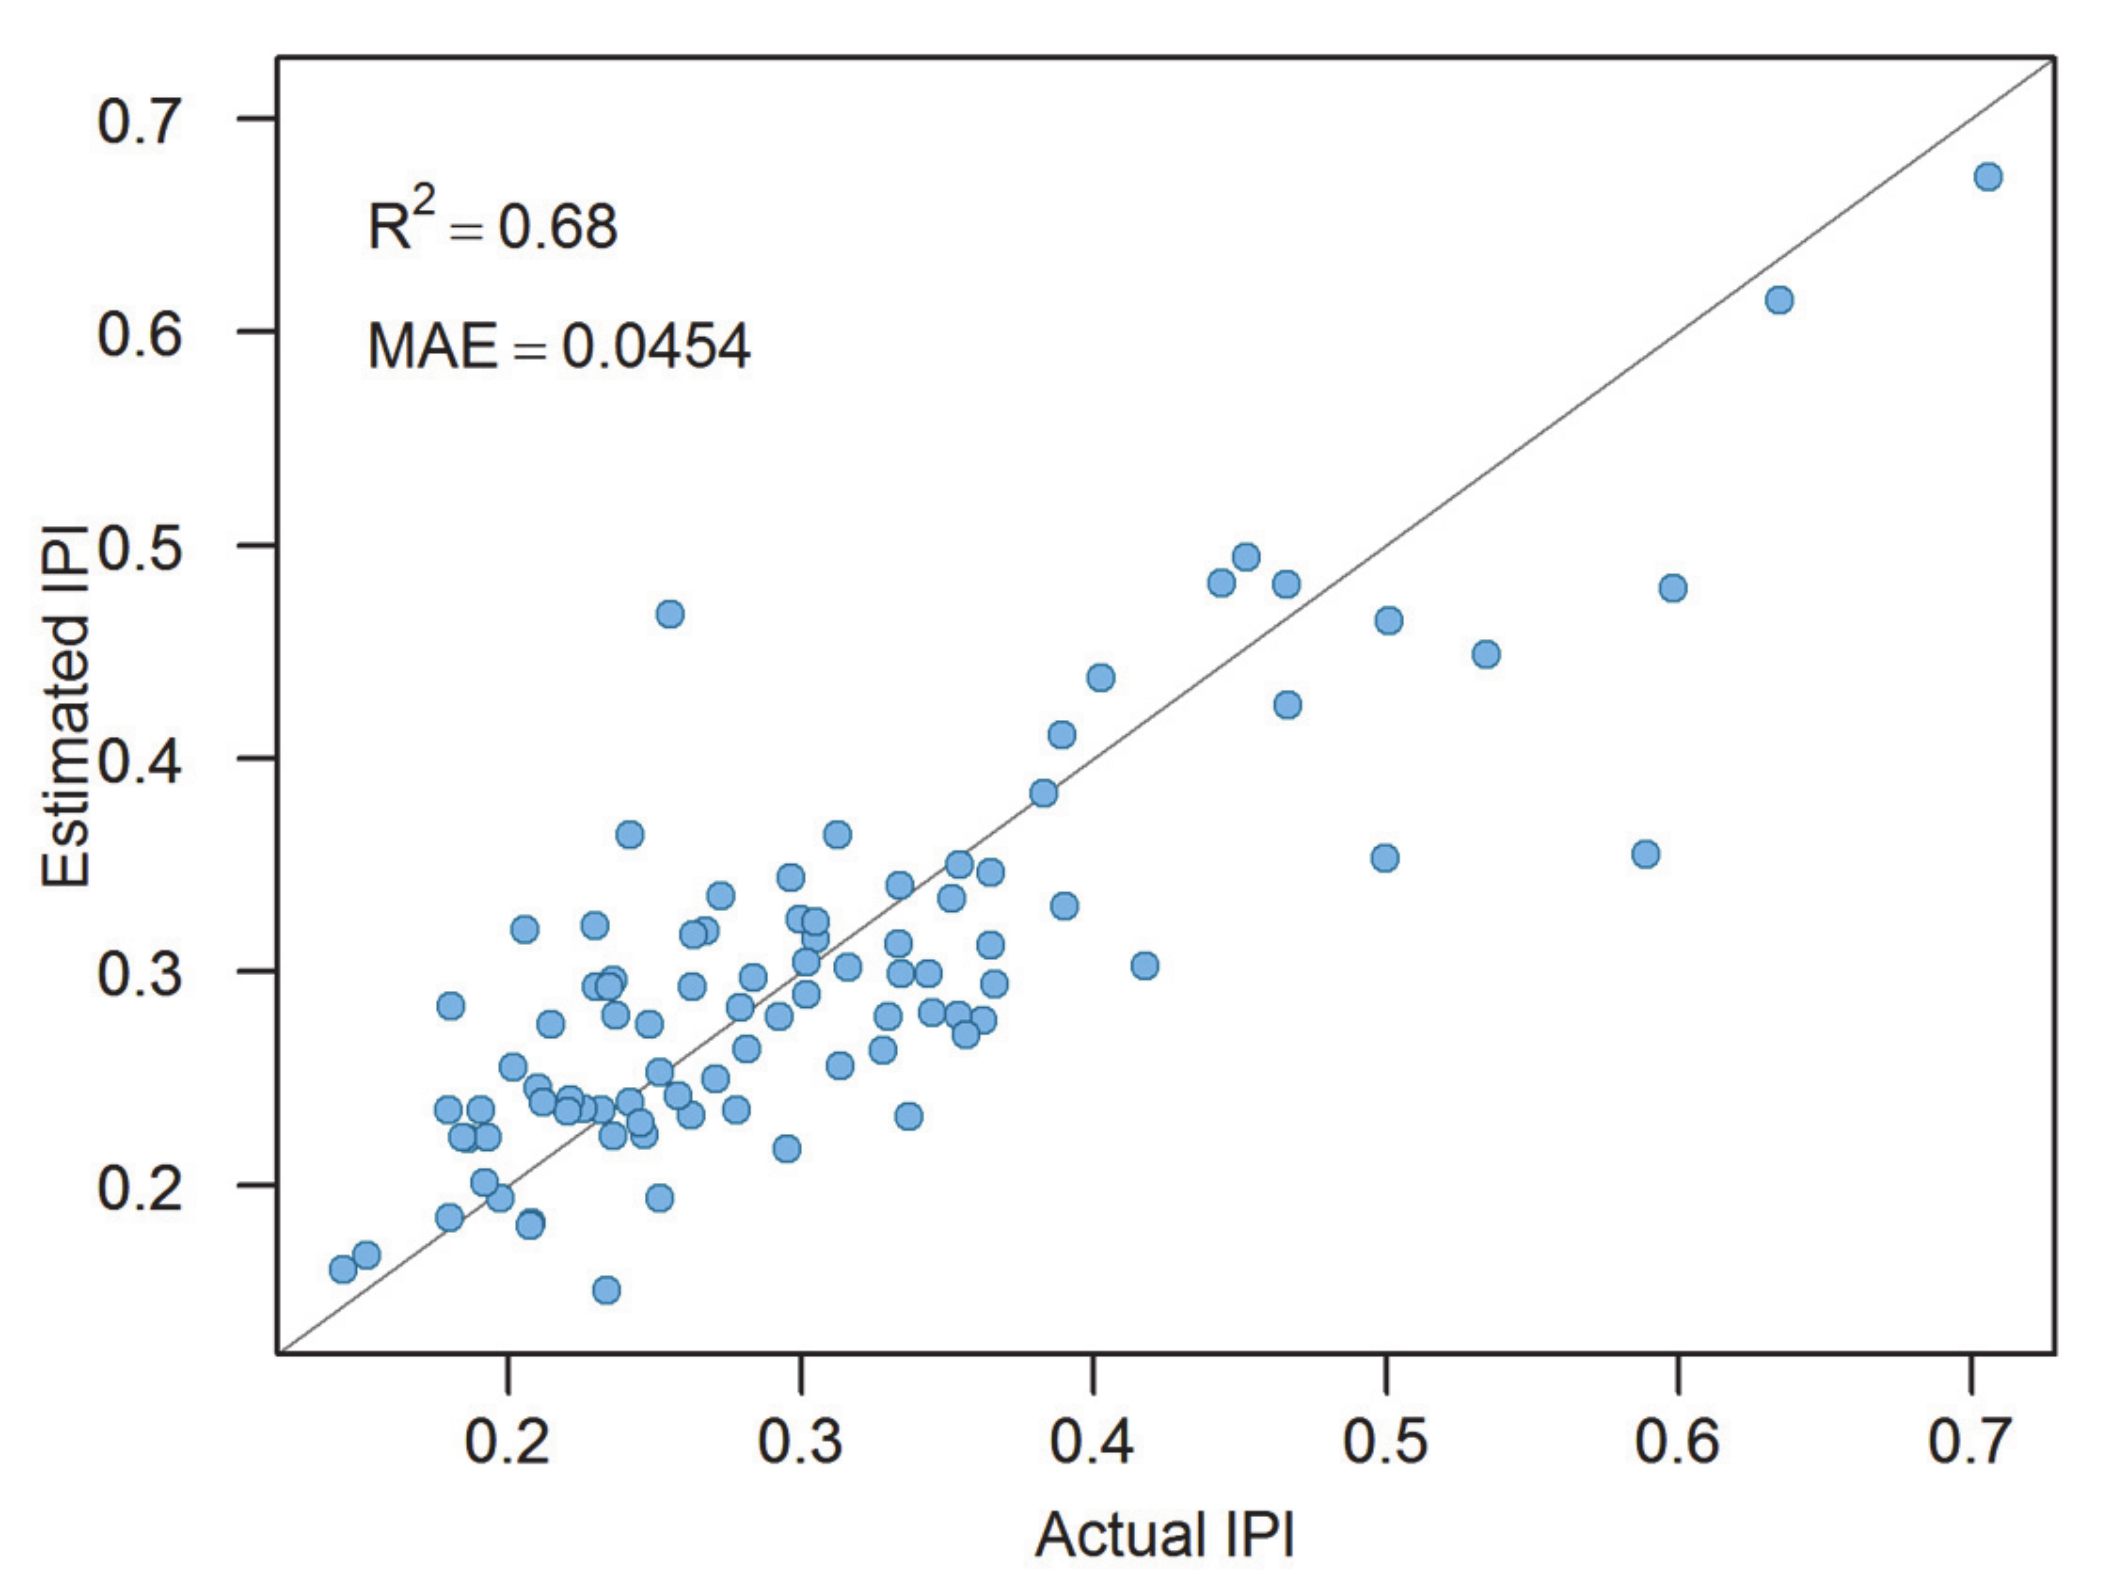
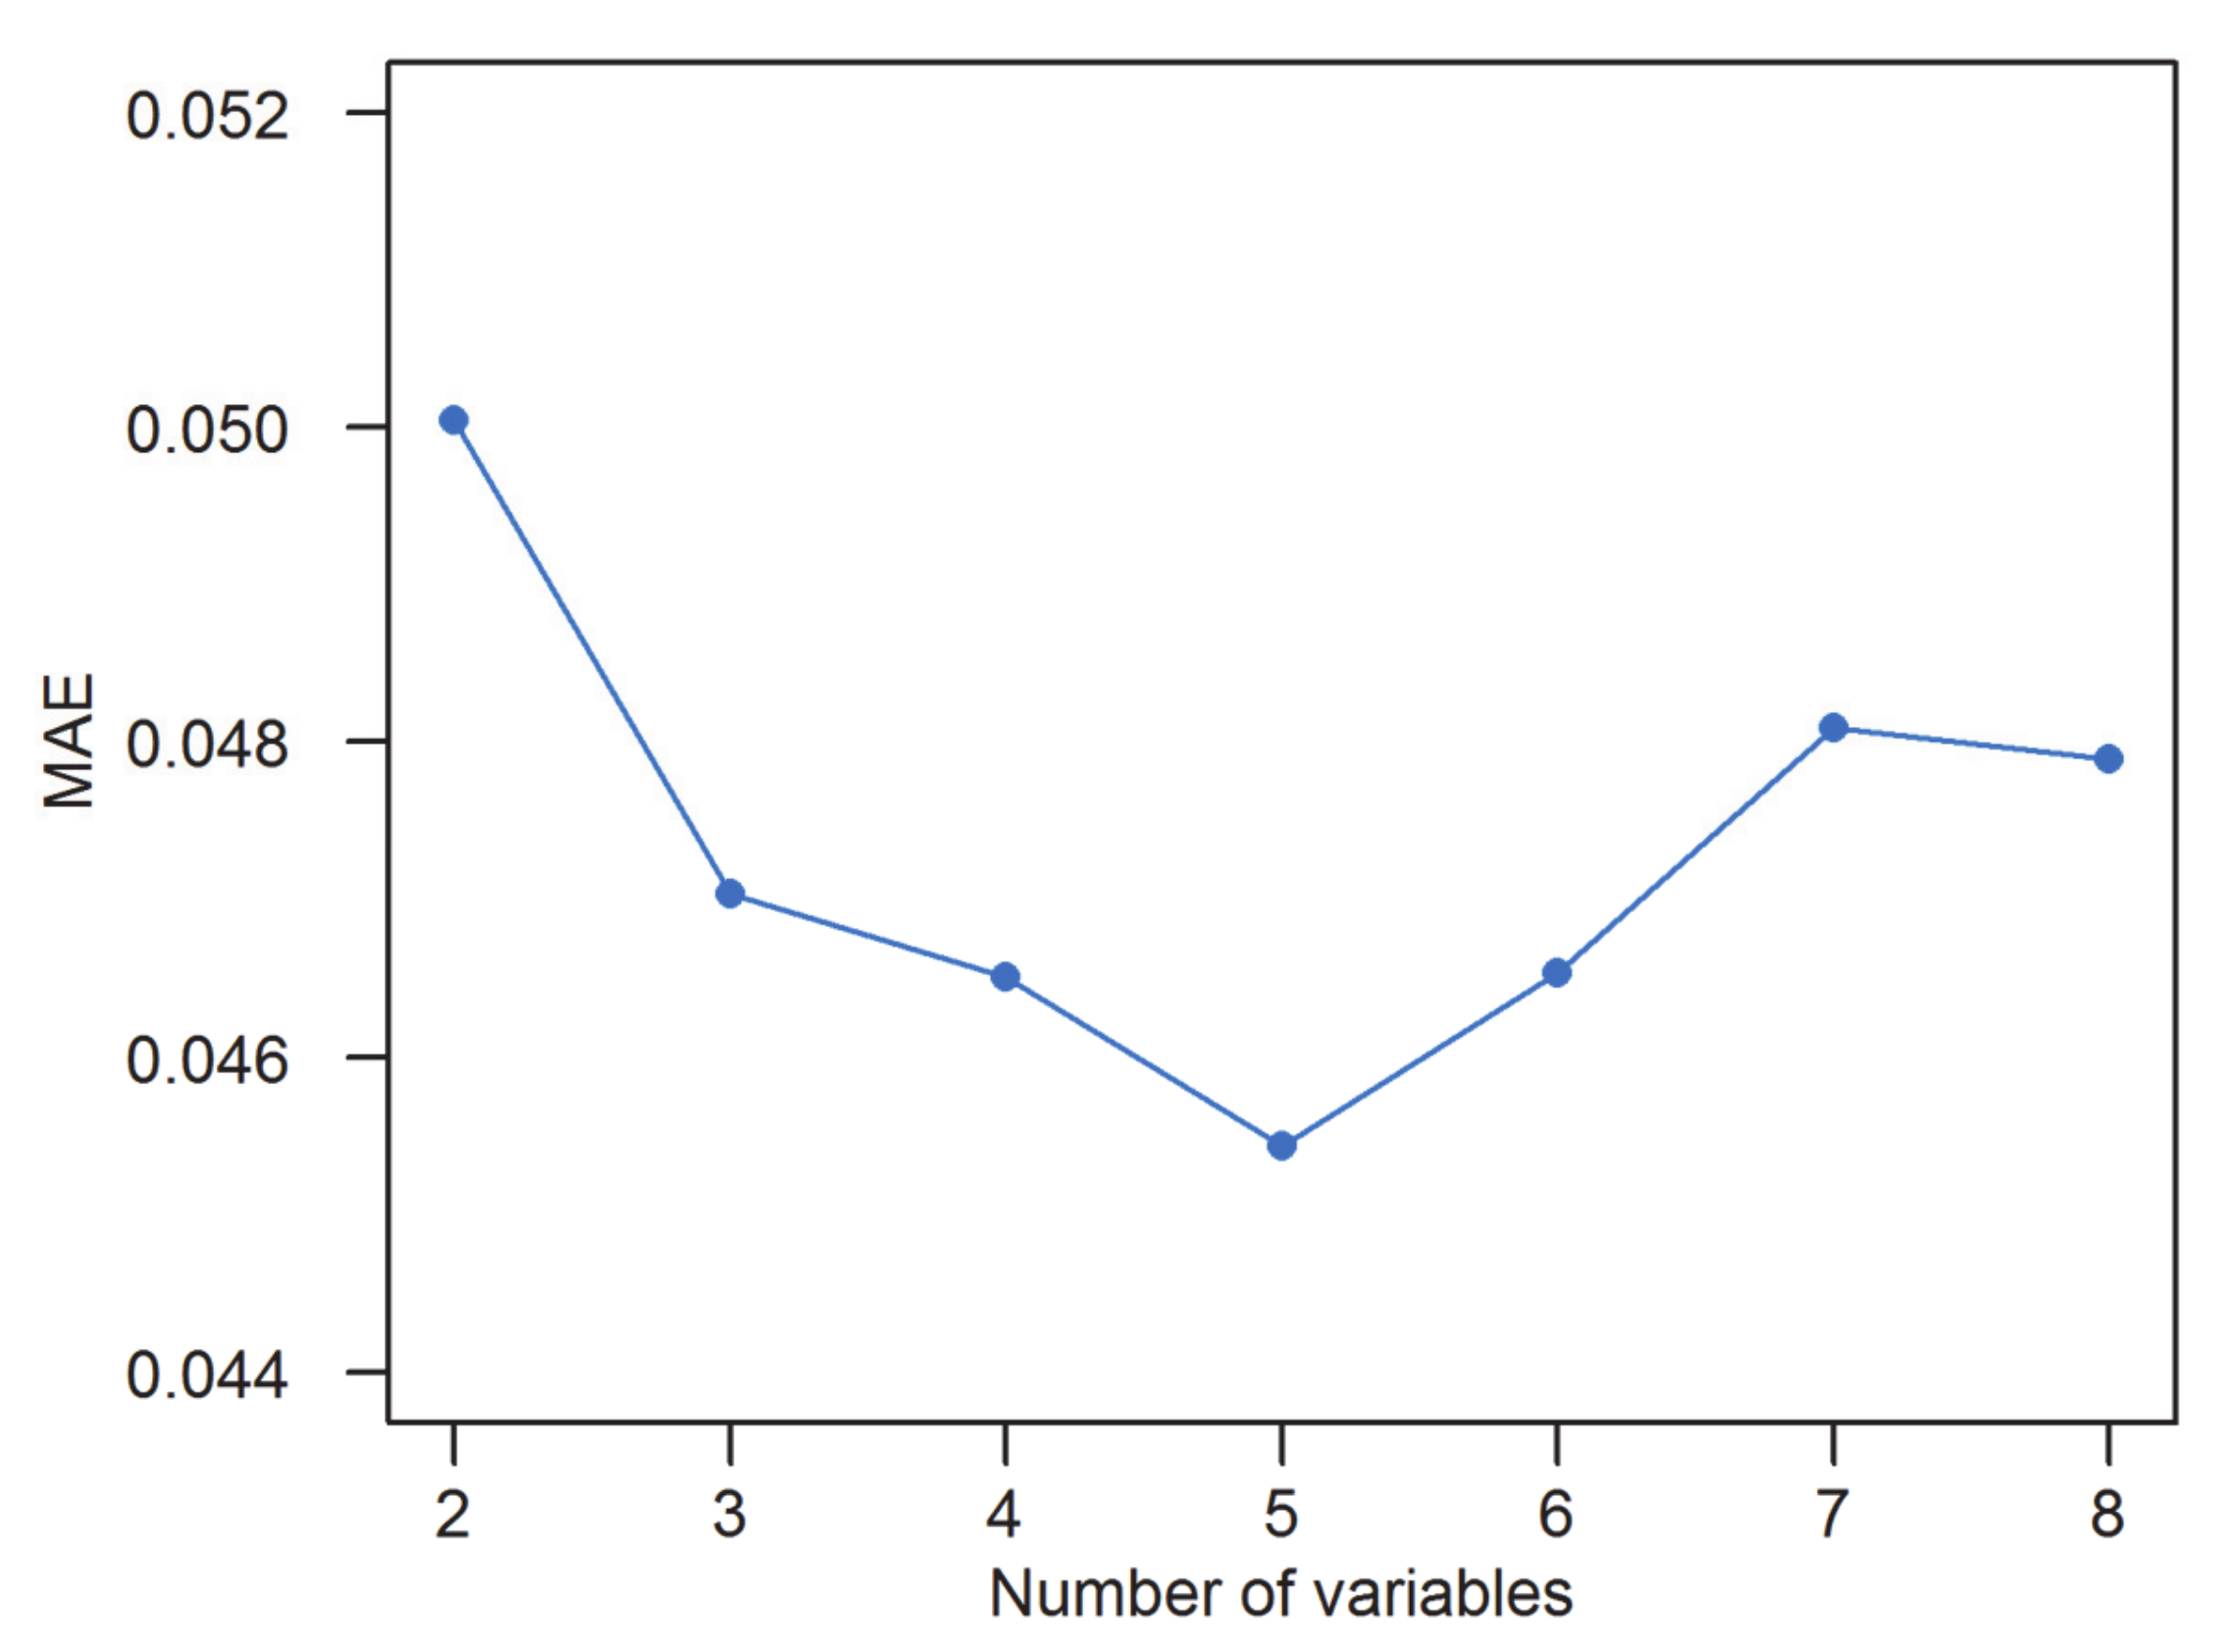
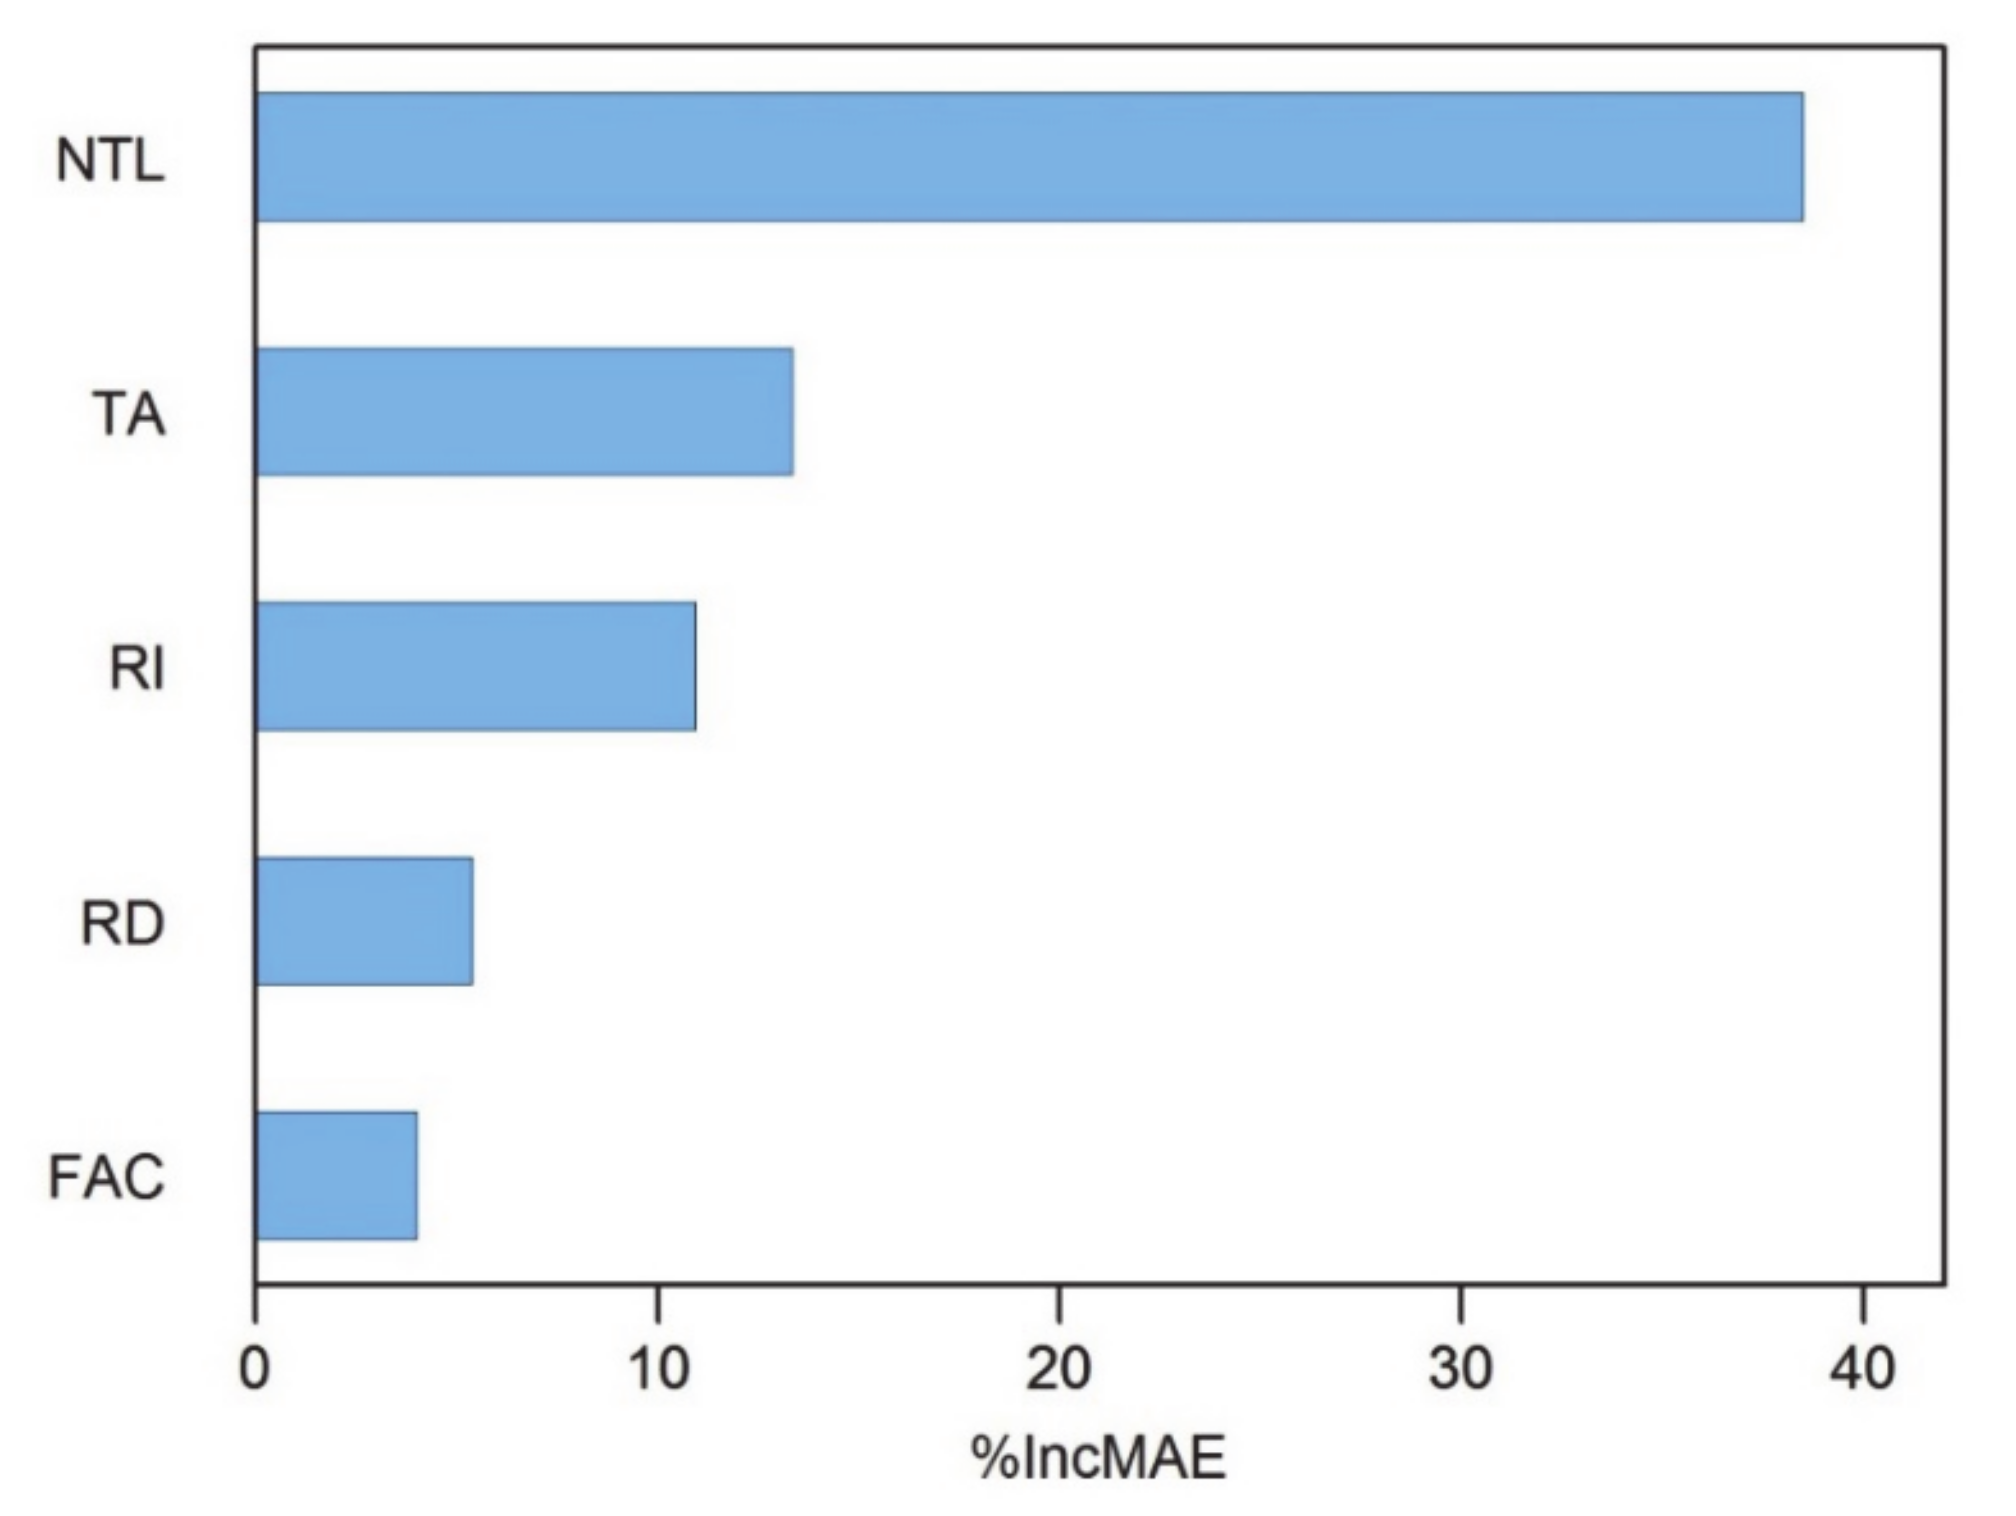
4.2. Model Performance
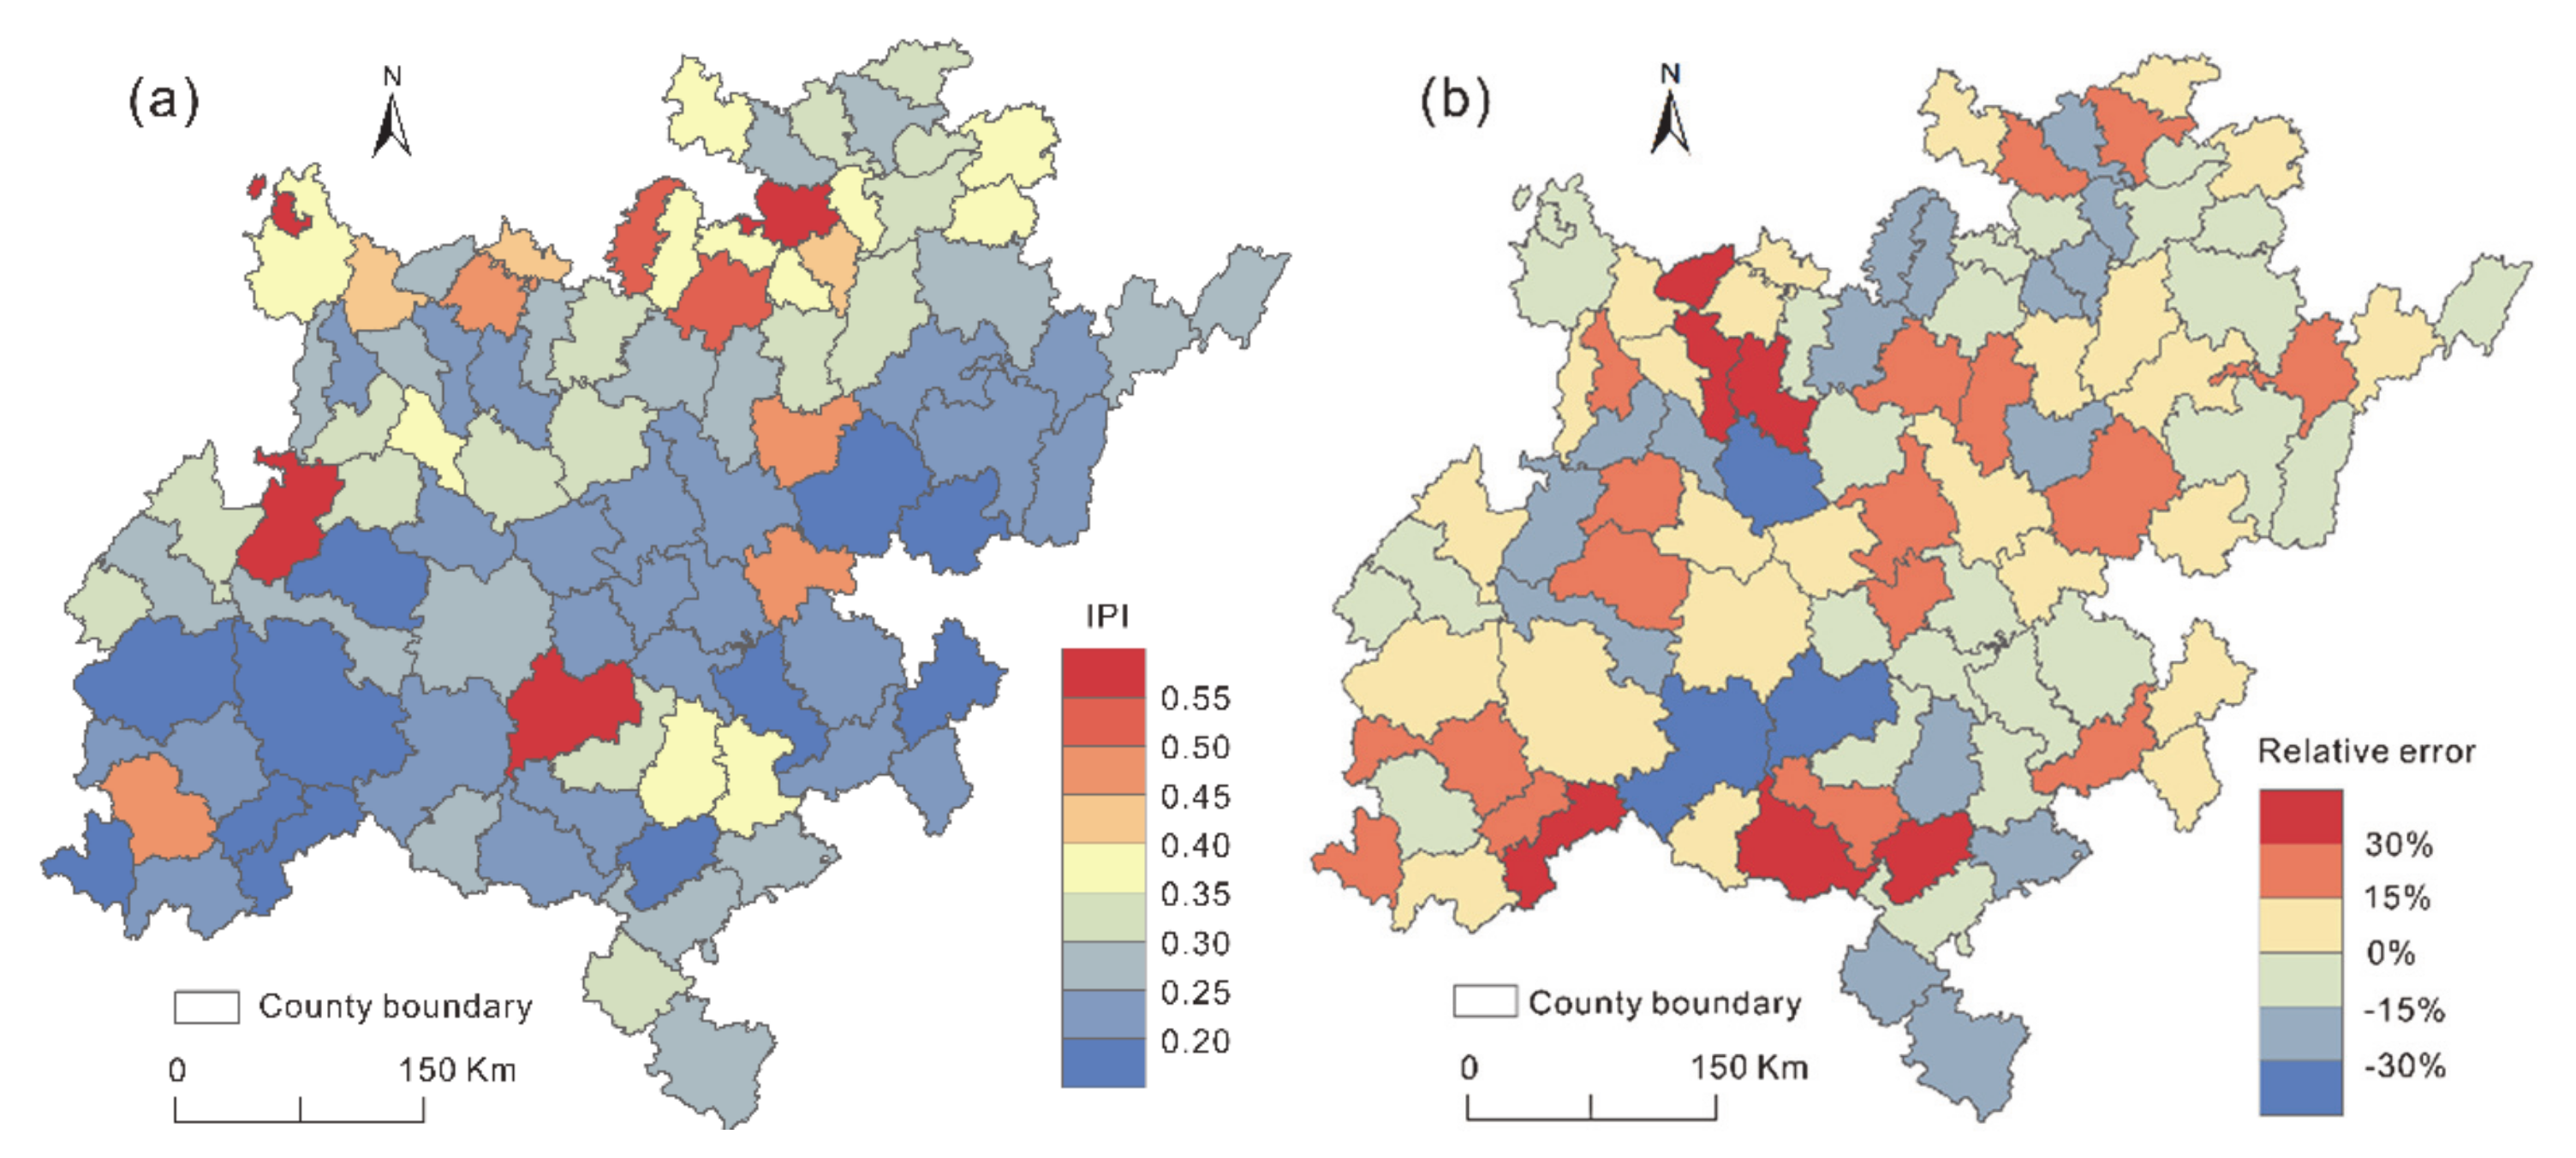
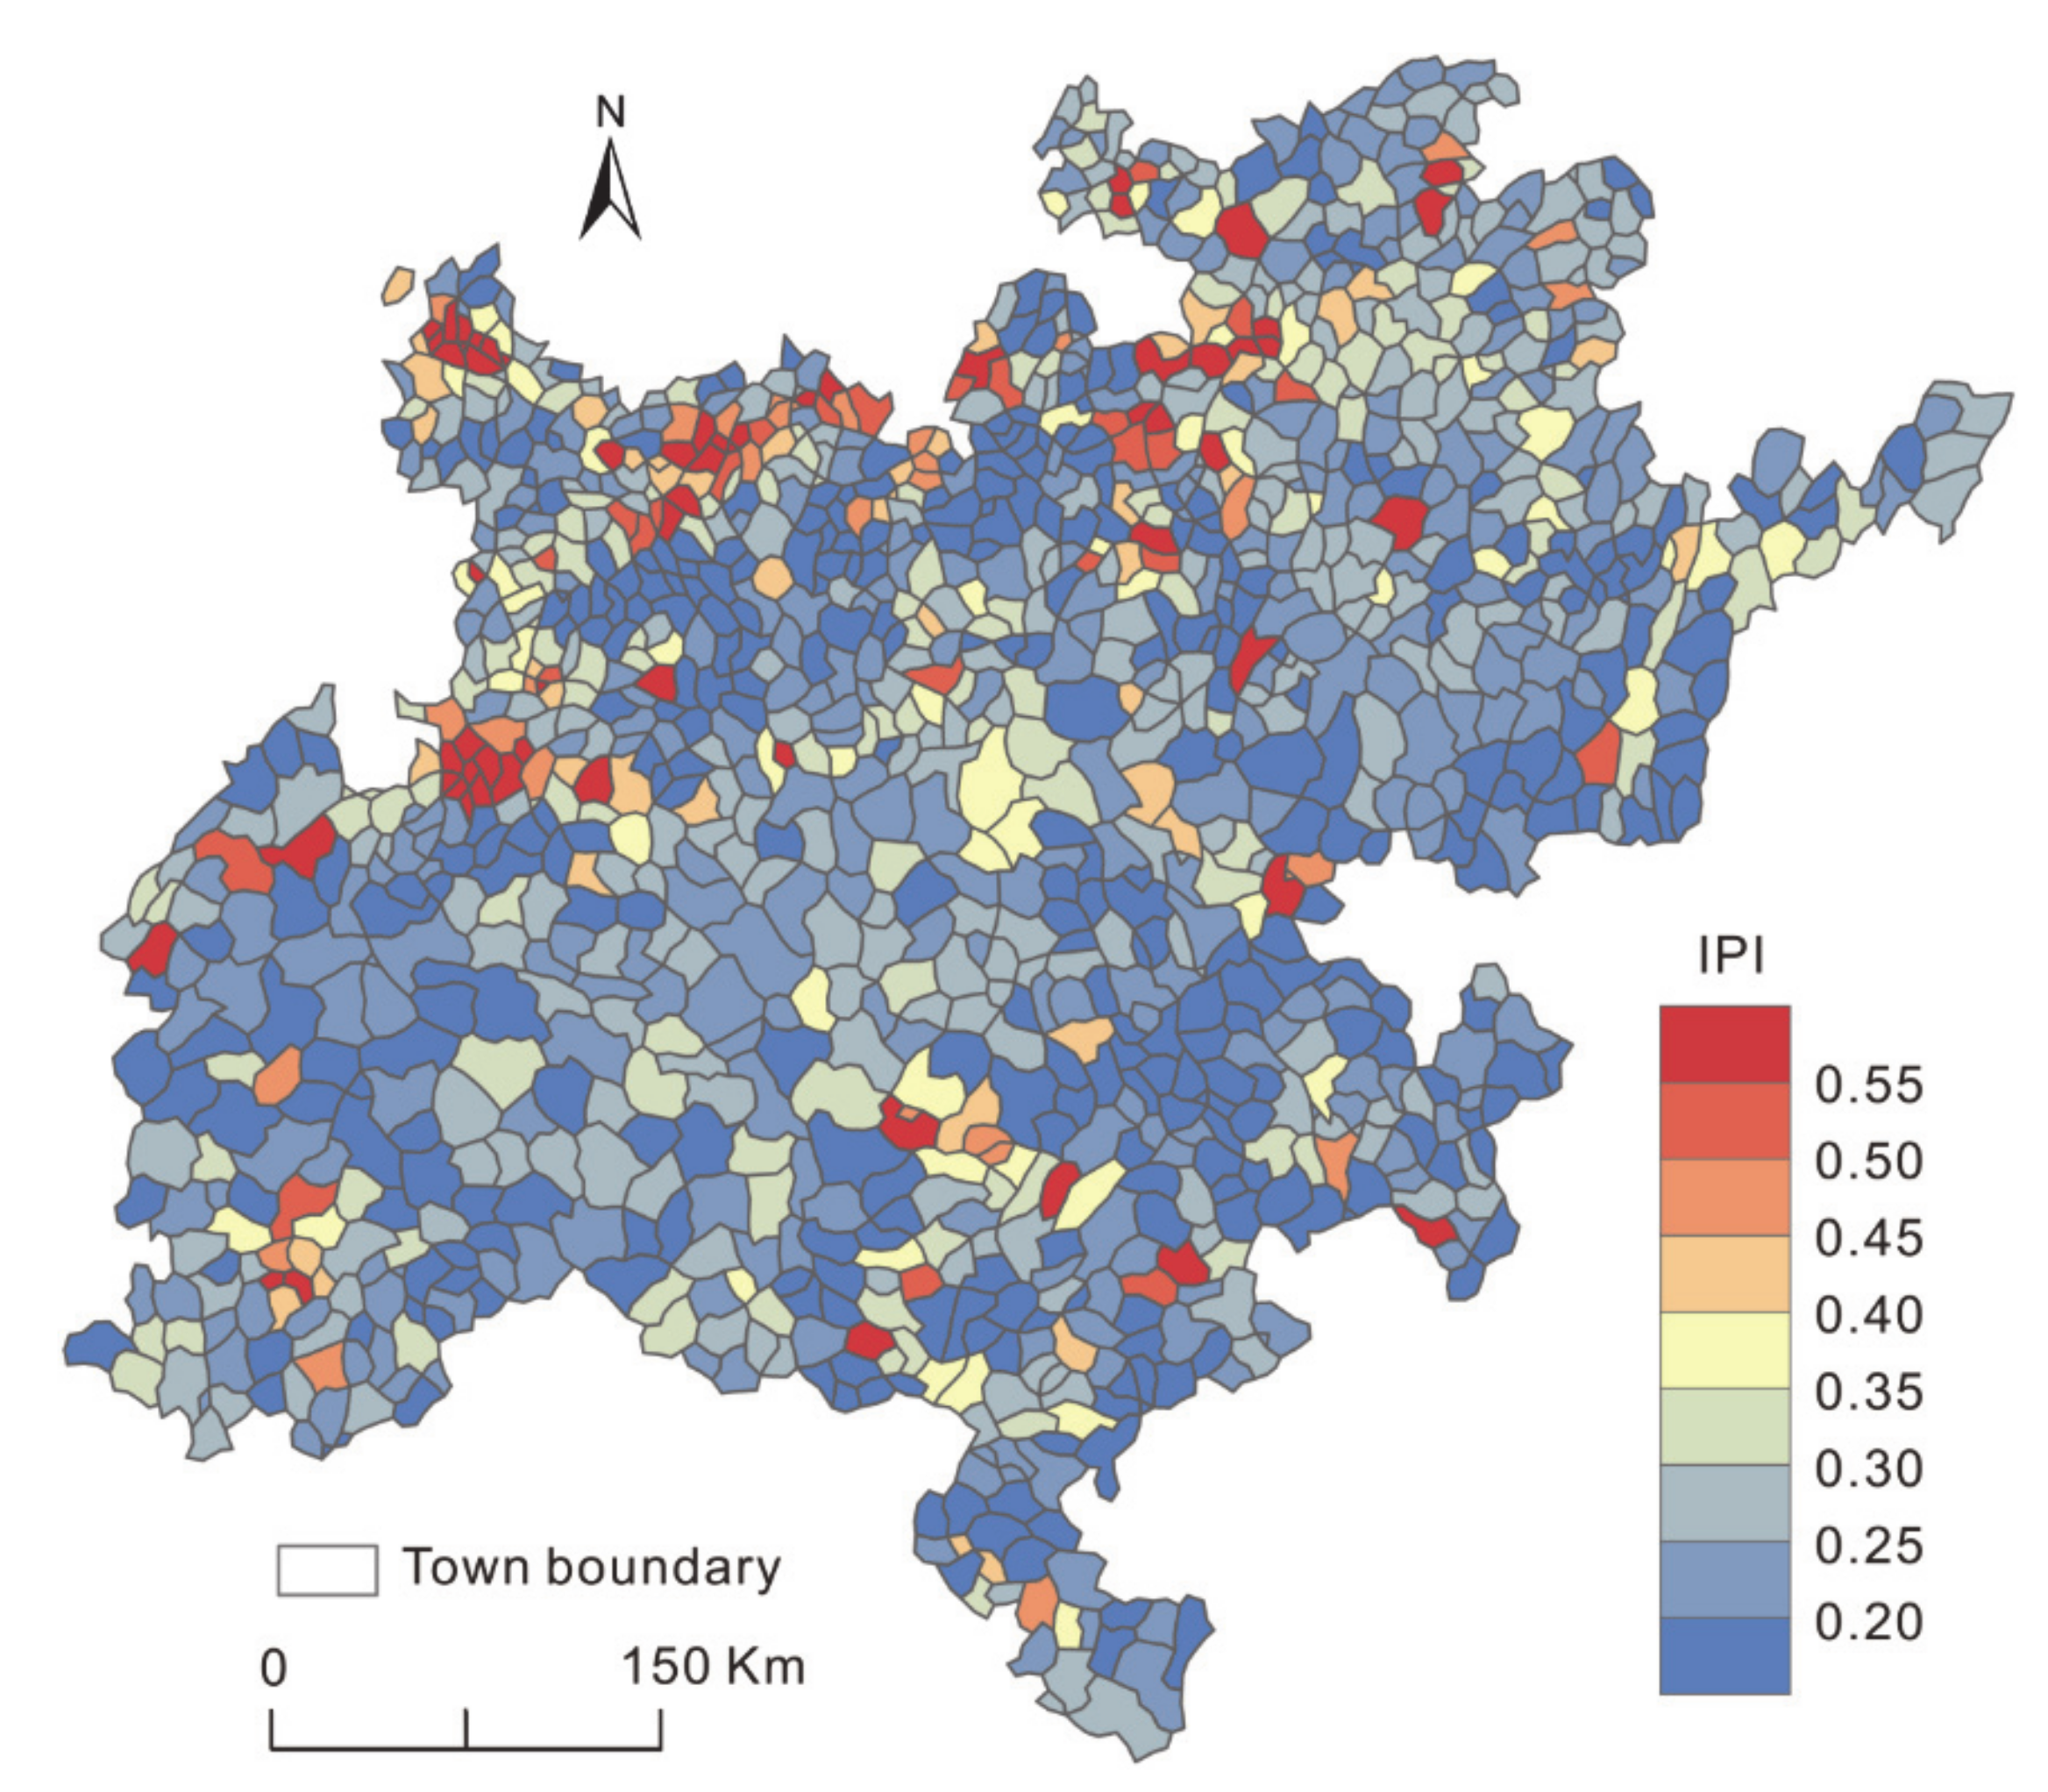
4.3. Spatial Distribution of IPI
5. Discussion
6. Conclusions
Author Contributions
Funding
Institutional Review Board Statement
Informed Consent Statement
Acknowledgments
Conflicts of Interest
References
- Braithwaite, A.; Dasandi, N.; Hudson, D. Does Poverty Cause Conflict? Isolating the Causal Origins of the Conflict Trap. Confl. Manag. Peace Sci. 2016, 33, 45–66. [Google Scholar] [CrossRef] [Green Version]
- Cf, O. Transforming Our World: The 2030 Agenda for Sustainable Development; United Nations: New York, NY, USA, 2015. [Google Scholar]
- Office of Household Survey, National Bureau of Statistics of China. Report on Rural Poverty in China 2018; China Statistics Press: Beijing, China, 2018. (In Chinese)
- Liu, H. Study on Implementation of Targeted Poverty Alleviation and Regional Coordinated Development. Bull. Chin. Acad. Sci. 2016, 31, 320–327. (In Chinese) [Google Scholar]
- Ding, J. Comparative Analysis on Poverty Degree of China’s 11 Contiguous Destitute Areas: With View of Comprehensive Development Index. Sci. Geogr. Sin. 2014, 34, 1418–1427. (In Chinese) [Google Scholar]
- Sachs, J.D.; Mellinger, A.D.; Gallup, J.L. The Geography of Poverty and Wealth. Sci. Am. 2001, 284, 70–75. [Google Scholar] [CrossRef]
- Elbers, C.; Lanjouw, J.O.; Lanjouw, P. Micro-Level Estimation of Poverty and Inequality. Econometrica 2003, 71, 355–364. [Google Scholar] [CrossRef]
- Hentschel, J.; Lanjouw, J.O.; Lanjouw, P.; Poggi, J. Combining Census and Survey Data to Trace the Spatial Dimensions of Poverty: A Case Study of Ecuador. World Bank Econ. Rev. 2000, 14, 147–165. [Google Scholar] [CrossRef]
- Lanjouw, P.; Marra, M.; Nguyen, C. Vietnam’s Evolving Poverty Index Map: Patterns and Implications for Policy. Soc. Indic. Res. 2017, 133, 93–118. [Google Scholar] [CrossRef]
- Jean, N.; Burke, M.; Xie, M.; Davis, W.M.; Lobell, D.B.; Ermon, S. Combining Satellite Imagery and Machine Learning to Predict Poverty. Science 2016, 353, 790–794. [Google Scholar] [CrossRef] [PubMed] [Green Version]
- Ghosh, T.; Anderson, S.J.; Elvidge, C.D.; Sutton, P.C. Using Nighttime Satellite Imagery as a Proxy Measure of Human Well-Being. Sustainability 2013, 5, 4988–5019. [Google Scholar] [CrossRef] [Green Version]
- Elvidge, C.D.; Cinzano, P.; Pettit, D.R.; Arvesen, J.; Sutton, P.; Small, C.; Nemani, R.; Longcore, T.; Rich, C.; Safran, J. The Nightsat Mission Concept. Int. J. Remote Sens. 2007, 28, 2645–2670. [Google Scholar] [CrossRef]
- Elvidge, C.D.; Baugh, K.E.; Zhizhin, M.; Hsu, F.-C. Why VIIRS Data Are Superior to DMSP for Mapping Nighttime Lights. Proc. Asia-Pac. Adv. Netw. 2013, 35, 62. [Google Scholar] [CrossRef] [Green Version]
- Elvidge, C.D.; Baugh, K.E.; Kihn, E.A.; Kroehl, H.W.; Davis, E.R.; Davis, C.W. Relation between Satellite Observed Visible-near Infrared Emissions, Population, Economic Activity and Electric Power Consumption. Int. J. Remote Sens. 1997, 18, 1373–1379. [Google Scholar] [CrossRef]
- Li, D.; Zhao, X.; Li, X. Remote Sensing of Human Beings—A Perspective from Nighttime Light. Geo-Spat. Inf. Sci. 2016, 19, 69–79. [Google Scholar] [CrossRef] [Green Version]
- Ma, T.; Zhou, Y.; Zhou, C.; Haynie, S.; Pei, T.; Xu, T. Night-Time Light Derived Estimation of Spatio-Temporal Characteristics of Urbanization Dynamics Using DMSP/OLS Satellite Data. Remote Sens. Environ. 2015, 158, 453–464. [Google Scholar] [CrossRef]
- Zhou, Y.; Li, X.; Asrar, G.R.; Smith, S.J.; Imhoff, M. A Global Record of Annual Urban Dynamics (1992–2013) from Nighttime Lights. Remote Sens. Environ. 2018, 219, 206–220. [Google Scholar] [CrossRef]
- Alahmadi, M.; Atkinson, P.M. Three-Fold Urban Expansion in Saudi Arabia from 1992 to 2013 Observed Using Calibrated DMSP-OLS Night-Time Lights Imagery. Remote Sens. 2019, 11, 2266. [Google Scholar] [CrossRef] [Green Version]
- Sutton, P.; Roberts, D.; Elvidge, C.; Baugh, K. Census from Heaven: An Estimate of the Global Human Population Using Night-Time Satellite Imagery. Int. J. Remote Sens. 2001, 22, 3061–3076. [Google Scholar] [CrossRef]
- Doll, C.N.; Muller, J.-P.; Morley, J.G. Mapping Regional Economic Activity from Night-Time Light Satellite Imagery. Ecol. Econ. 2006, 57, 75–92. [Google Scholar] [CrossRef]
- Briggs, D.J.; Gulliver, J.; Fecht, D.; Vienneau, D.M. Dasymetric Modelling of Small-Area Population Distribution Using Land Cover and Light Emissions Data. Remote Sens. Environ. 2007, 108, 451–466. [Google Scholar] [CrossRef]
- Sun, W.; Zhang, X.; Wang, N.; Cen, Y. Estimating Population Density Using DMSP-OLS Night-Time Imagery and Land Cover Data. IEEE J. Sel. Top. Appl. Earth Obs. Remote Sens. 2017, 10, 2674–2684. [Google Scholar] [CrossRef]
- Tan, M.; Li, X.; Li, S.; Xin, L.; Wang, X.; Li, Q.; Li, W.; Li, Y.; Xiang, W. Modeling Population Density Based on Nighttime Light Images and Land Use Data in China. Appl. Geogr. 2018, 90, 239–247. [Google Scholar] [CrossRef]
- Chand, T.K.; Badarinath, K.V.S.; Elvidge, C.D.; Tuttle, B.T. Spatial Characterization of Electrical Power Consumption Patterns over India Using Temporal DMSP-OLS Night-Time Satellite Data. Int. J. Remote Sens. 2009, 30, 647–661. [Google Scholar] [CrossRef]
- Shi, K.; Yu, B.; Huang, C.; Wu, J.; Sun, X. Exploring Spatiotemporal Patterns of Electric Power Consumption in Countries along the Belt and Road. Energy 2018, 150, 847–859. [Google Scholar] [CrossRef]
- Ebener, S.; Murray, C.; Tandon, A.; Elvidge, C.C. From Wealth to Health: Modelling the Distribution of Income per Capita at the Sub-National Level Using Night-Time Light Imagery. Int. J. Health Geogr. 2005, 4, 5. [Google Scholar] [CrossRef] [PubMed] [Green Version]
- Noor, A.M.; Alegana, V.A.; Gething, P.W.; Tatem, A.J.; Snow, R.W. Using Remotely Sensed Night-Time Light as a Proxy for Poverty in Africa. Popul. Health Metr. 2008, 6, 5. [Google Scholar] [CrossRef] [Green Version]
- Elvidge, C.D.; Sutton, P.C.; Ghosh, T.; Tuttle, B.T.; Baugh, K.E.; Bhaduri, B.; Bright, E. A Global Poverty Map Derived from Satellite Data. Comput. Geosci. 2009, 35, 1652–1660. [Google Scholar] [CrossRef]
- Wang, W.; Cheng, H.; Zhang, L. Poverty Assessment Using DMSP/OLS Night-Time Light Satellite Imagery at a Provincial Scale in China. Adv. Space Res. 2012, 49, 1253–1264. [Google Scholar] [CrossRef]
- Yu, B.; Shi, K.; Hu, Y.; Huang, C.; Chen, Z.; Wu, J. Poverty Evaluation Using NPP-VIIRS Nighttime Light Composite Data at the County Level in China. IEEE J. Sel. Top. Appl. Earth Obs. Remote Sens. 2015, 8, 1217–1229. [Google Scholar] [CrossRef]
- Njuguna, C.; McSharry, P. Constructing Spatiotemporal Poverty Indices from Big Data. J. Bus. Res. 2017, 70, 318–327. [Google Scholar] [CrossRef]
- Pan, J.; Hu, Y. Spatial Identification of Multi-Dimensional Poverty in Rural China: A Perspective of Nighttime-Light Remote Sensing Data. J. Indian Soc. Remote Sens. 2018, 46, 1093–1111. [Google Scholar] [CrossRef]
- Li, G.; Cai, Z.; Liu, X.; Liu, J.; Su, S. A Comparison of Machine Learning Approaches for Identifying High-Poverty Counties: Robust Features of DMSP/OLS Night-Time Light Imagery. Int. J. Remote Sens. 2019, 40, 5716–5736. [Google Scholar] [CrossRef]
- Zhao, X.; Yu, B.; Liu, Y.; Chen, Z.; Li, Q.; Wang, C.; Wu, J. Estimation of Poverty Using Random Forest Regression with Multi-Source Data: A Case Study in Bangladesh. Remote Sens. 2019, 11, 375. [Google Scholar] [CrossRef] [Green Version]
- Shi, K.; Chang, Z.; Chen, Z.; Wu, J.; Yu, B. Identifying and evaluating poverty using multisource remote sensing and point of interest (POI) data: A case study of Chongqing, China. J. Clean. Prod. 2020, 255, 120245. [Google Scholar] [CrossRef]
- Li, C.; Yang, W.; Tang, Q.; Tang, X.; Lei, J.; Wu, M.; Qiu, S. Detection of Multidimensional Poverty Using Luojia 1-01 Nighttime Light Imagery. J. Indian Soc. Remote Sens. 2020, 48, 963–977. [Google Scholar] [CrossRef]
- Yin, J.; Qiu, Y.; Zhang, B. Identification of Poverty Areas by Remote Sensing and Machine Learning: A Case Study in Guizhou, Southwest China. Int. J. Geo-Inf. 2021, 10, 11. [Google Scholar] [CrossRef]
- Niu, T.; Chen, Y.; Yuan, Y. Measuring urban poverty using multi-source data and a random forest algorithm: A case study in Guangzhou. Sustain. Cities Soc. 2020, 54, 102014. [Google Scholar] [CrossRef]
- Weiss, D.J.; Nelson, A.; Gibson, H.S.; Temperley, W.; Peedell, S.; Lieber, A.; Hancher, M.; Poyart, E.; Belchior, S.; Fullman, N. A Global Map of Travel Time to Cities to Assess Inequalities in Accessibility in 2015. Nature 2018, 553, 333–336. [Google Scholar] [CrossRef] [PubMed]
- Pokhriyal, N.; Jacques, D.C. Combining Disparate Data Sources for Improved Poverty Prediction and Mapping. Proc. Natl. Acad. Sci. USA 2017, 114, E9783–E9792. [Google Scholar] [CrossRef] [Green Version]
- Ngufor, C.; Murphree, D.; Upadhyaya, S.; Madde, N.; Kor, D.; Pathak, J. Effects of Plasma Transfusion on Perioperative Bleeding Complications: A Machine Learning Approach. Stud. Health Technol. Inform. 2015, 216, 721. [Google Scholar] [PubMed]


| Dimension | Indicator | Attribute | Weight |
|---|---|---|---|
| Economic development | Per capita GDP | Positive | 0.0645 |
| Per capita fiscal expenditure | Positive | 0.0457 | |
| Per capita savings | Positive | 0.0881 | |
| Living conditions | Per capita income | Positive | 0.0627 |
| Per capita fixed assets | Positive | 0.1727 | |
| Endowment insurance coverage | Positive | 0.0361 | |
| Per capita telephone ratio | Positive | 0.1006 | |
| Health | Per capita beds in health | Positive | 0.1151 |
| Per capita doctors | Positive | 0.0481 | |
| Medical insurance coverage | Positive | 0.0135 | |
| Education | Per capita students present in primary and high schools | Positive | 0.1220 |
| Per capita teachers at primary and high schools | Positive | 0.0589 | |
| Per capita education expenditure | Positive | 0.0722 |
| Model | MAE | R2 |
|---|---|---|
| MLR | 0.0767 | 0.23 |
| BRNN | 0.0593 | 0.47 |
| GAM | 0.0498 | 0.59 |
| SVM | 0.0583 | 0.49 |
| MARS | 0.0581 | 0.46 |
| RF | 0.0527 | 0.57 |
| XGBoost | 0.0479 | 0.61 |
| Cubist | 0.054 | 0.53 |
Publisher’s Note: MDPI stays neutral with regard to jurisdictional claims in published maps and institutional affiliations. |
© 2021 by the authors. Licensee MDPI, Basel, Switzerland. This article is an open access article distributed under the terms and conditions of the Creative Commons Attribution (CC BY) license (https://creativecommons.org/licenses/by/4.0/).
Share and Cite
Xu, Y.; Mo, Y.; Zhu, S. Poverty Mapping in the Dian-Gui-Qian Contiguous Extremely Poor Area of Southwest China Based on Multi-Source Geospatial Data. Sustainability 2021, 13, 8717. https://doi.org/10.3390/su13168717
Xu Y, Mo Y, Zhu S. Poverty Mapping in the Dian-Gui-Qian Contiguous Extremely Poor Area of Southwest China Based on Multi-Source Geospatial Data. Sustainability. 2021; 13(16):8717. https://doi.org/10.3390/su13168717
Chicago/Turabian StyleXu, Yongming, Yaping Mo, and Shanyou Zhu. 2021. "Poverty Mapping in the Dian-Gui-Qian Contiguous Extremely Poor Area of Southwest China Based on Multi-Source Geospatial Data" Sustainability 13, no. 16: 8717. https://doi.org/10.3390/su13168717
APA StyleXu, Y., Mo, Y., & Zhu, S. (2021). Poverty Mapping in the Dian-Gui-Qian Contiguous Extremely Poor Area of Southwest China Based on Multi-Source Geospatial Data. Sustainability, 13(16), 8717. https://doi.org/10.3390/su13168717