Article

Evaluation of Classification Algorithms to Predict Largemouth Bass (Micropterus salmoides) Occurrence

1
Division of Environmental Science & Ecological Engineering, Korea University, Seoul 02841, Korea
2
Department of Environmental Engineering, Gyeongsang National University, Jinju 52725, Korea
3
Department of Environmental Engineering, Chungnam National University, Daejeon 34134, Korea
4
Department of Bioscience and Biotechnology, Chungnam National University, Daejeon 34134, Korea
*
Author to whom correspondence should be addressed.
Sustainability 2021, 13(17), 9507; https://doi.org/10.3390/su13179507
Submission received: 12 July 2021 / Revised: 19 August 2021 / Accepted: 19 August 2021 / Published: 24 August 2021

Abstract

:
This study aimed to evaluate classification algorithms to predict largemouth bass (Micropterus salmoides) occurrence in South Korea. Fish monitoring and environmental data (temperature, precipitation, flow rate, water quality, elevation, and slope) were collected from 581 locations throughout four major river basins for 5 years (2011–2015). Initially, 13 classification models built in the caret package were evaluated for predicting largemouth bass occurrence. Based on the accuracy (>0.8) and kappa (>0.5) criteria, the top three classification algorithms (i.e., random forest (rf), C5.0, and conditional inference random forest) were selected to develop ensemble models. However, combining the best individual models did not work better than the best individual model (rf) at predicting the frequency of largemouth bass occurrence. Additionally, annual mean temperature (12.1 °C) and fall mean temperature (13.6 °C) were the most important environmental variables to discriminate the presence and absence of largemouth bass. The evaluation process proposed in this study will be useful to select a prediction model for the prediction of freshwater fish occurrence but will require further study to ensure ecological reliability.

1. Introduction

Various classification algorithms have been used to predict the presence of freshwater fish under certain environmental conditions [1,2,3]. For instance, boosted regression tree [4], classification tree [5], genetic algorithm for rule-set prediction [2,6], logistic regression [3], generalized additive model [7], and artificial neural networks [1,8] have been used for freshwater fish prediction. In particular, the habitat preference, distribution shifts, and invasion risk of freshwater fish have been evaluated using classification models [9,10]. For instance, Fukuda et al. analyzed the occurrence of the invasive fish Pseudorasbora parva using a random forest algorithm [9]. Kwon et al. also used a random forest model among six candidate models and predicted the occurrence of 22 endemic fishes in South Korea [11].
One of the most promising tools to build classification algorithms is the caret package [12] in R [13]. The caret package can be an alternative to the widely used biomod2 package, which requires environmental data in raster file format [14]. Given that freshwater environmental data are often available as point data [15], the application of the biomod2 package is limited. Additionally, the caret package offers more variety of hyper-parameter settings compared to the biomod2 package. The caret package offers 238 methods in total consisting of 102 classification, 48 regression, and 88 classification/regression algorithms. Because of the large number of algorithms and parameter settings, it is necessary to screen algorithms in the caret package.
Recently, ensemble modeling approaches have been widely used to improve the performance of individual models [16,17]. Ensemble models have advantages in improving prediction accuracy, reducing variance, and interpolating sampling bias errors [18,19]. Several studies have predicted the occurrence of freshwater fish by taking advantage of ensemble modeling [1,20]. For example, Poulos et al. demonstrated that an ensemble model that integrated four algorithms outperformed the individual algorithms in terms of predicting the distributions of three invasive fishes [20]. Grenouillet et al. also suggested an ensemble model of eight algorithms to estimate the distributions of freshwater fishes in France instead of individual models [1]. However, Hao et al. reported that some tuned individual models performed better than ensemble models to predict species distribution of eucalypt trees [21]. These findings suggest that the outperformance of ensemble models over individual models is still controversial.
This study aimed to evaluate the performance of classification algorithms to predict largemouth bass (Micropterus salmoides) occurrence in South Korea. The largemouth bass was selected as the model species for this study because it is an invasive species that causes numerous ecological impacts worldwide [22,23]. For instance, the largemouth bass disturbs freshwater ecosystems by competing with endemic fish for food [24] or by predating on endemic species [25]. Therefore, this study may contribute to the establishment of a suitable classification model that can be used in the management of invasive freshwater fish.

2. Methods

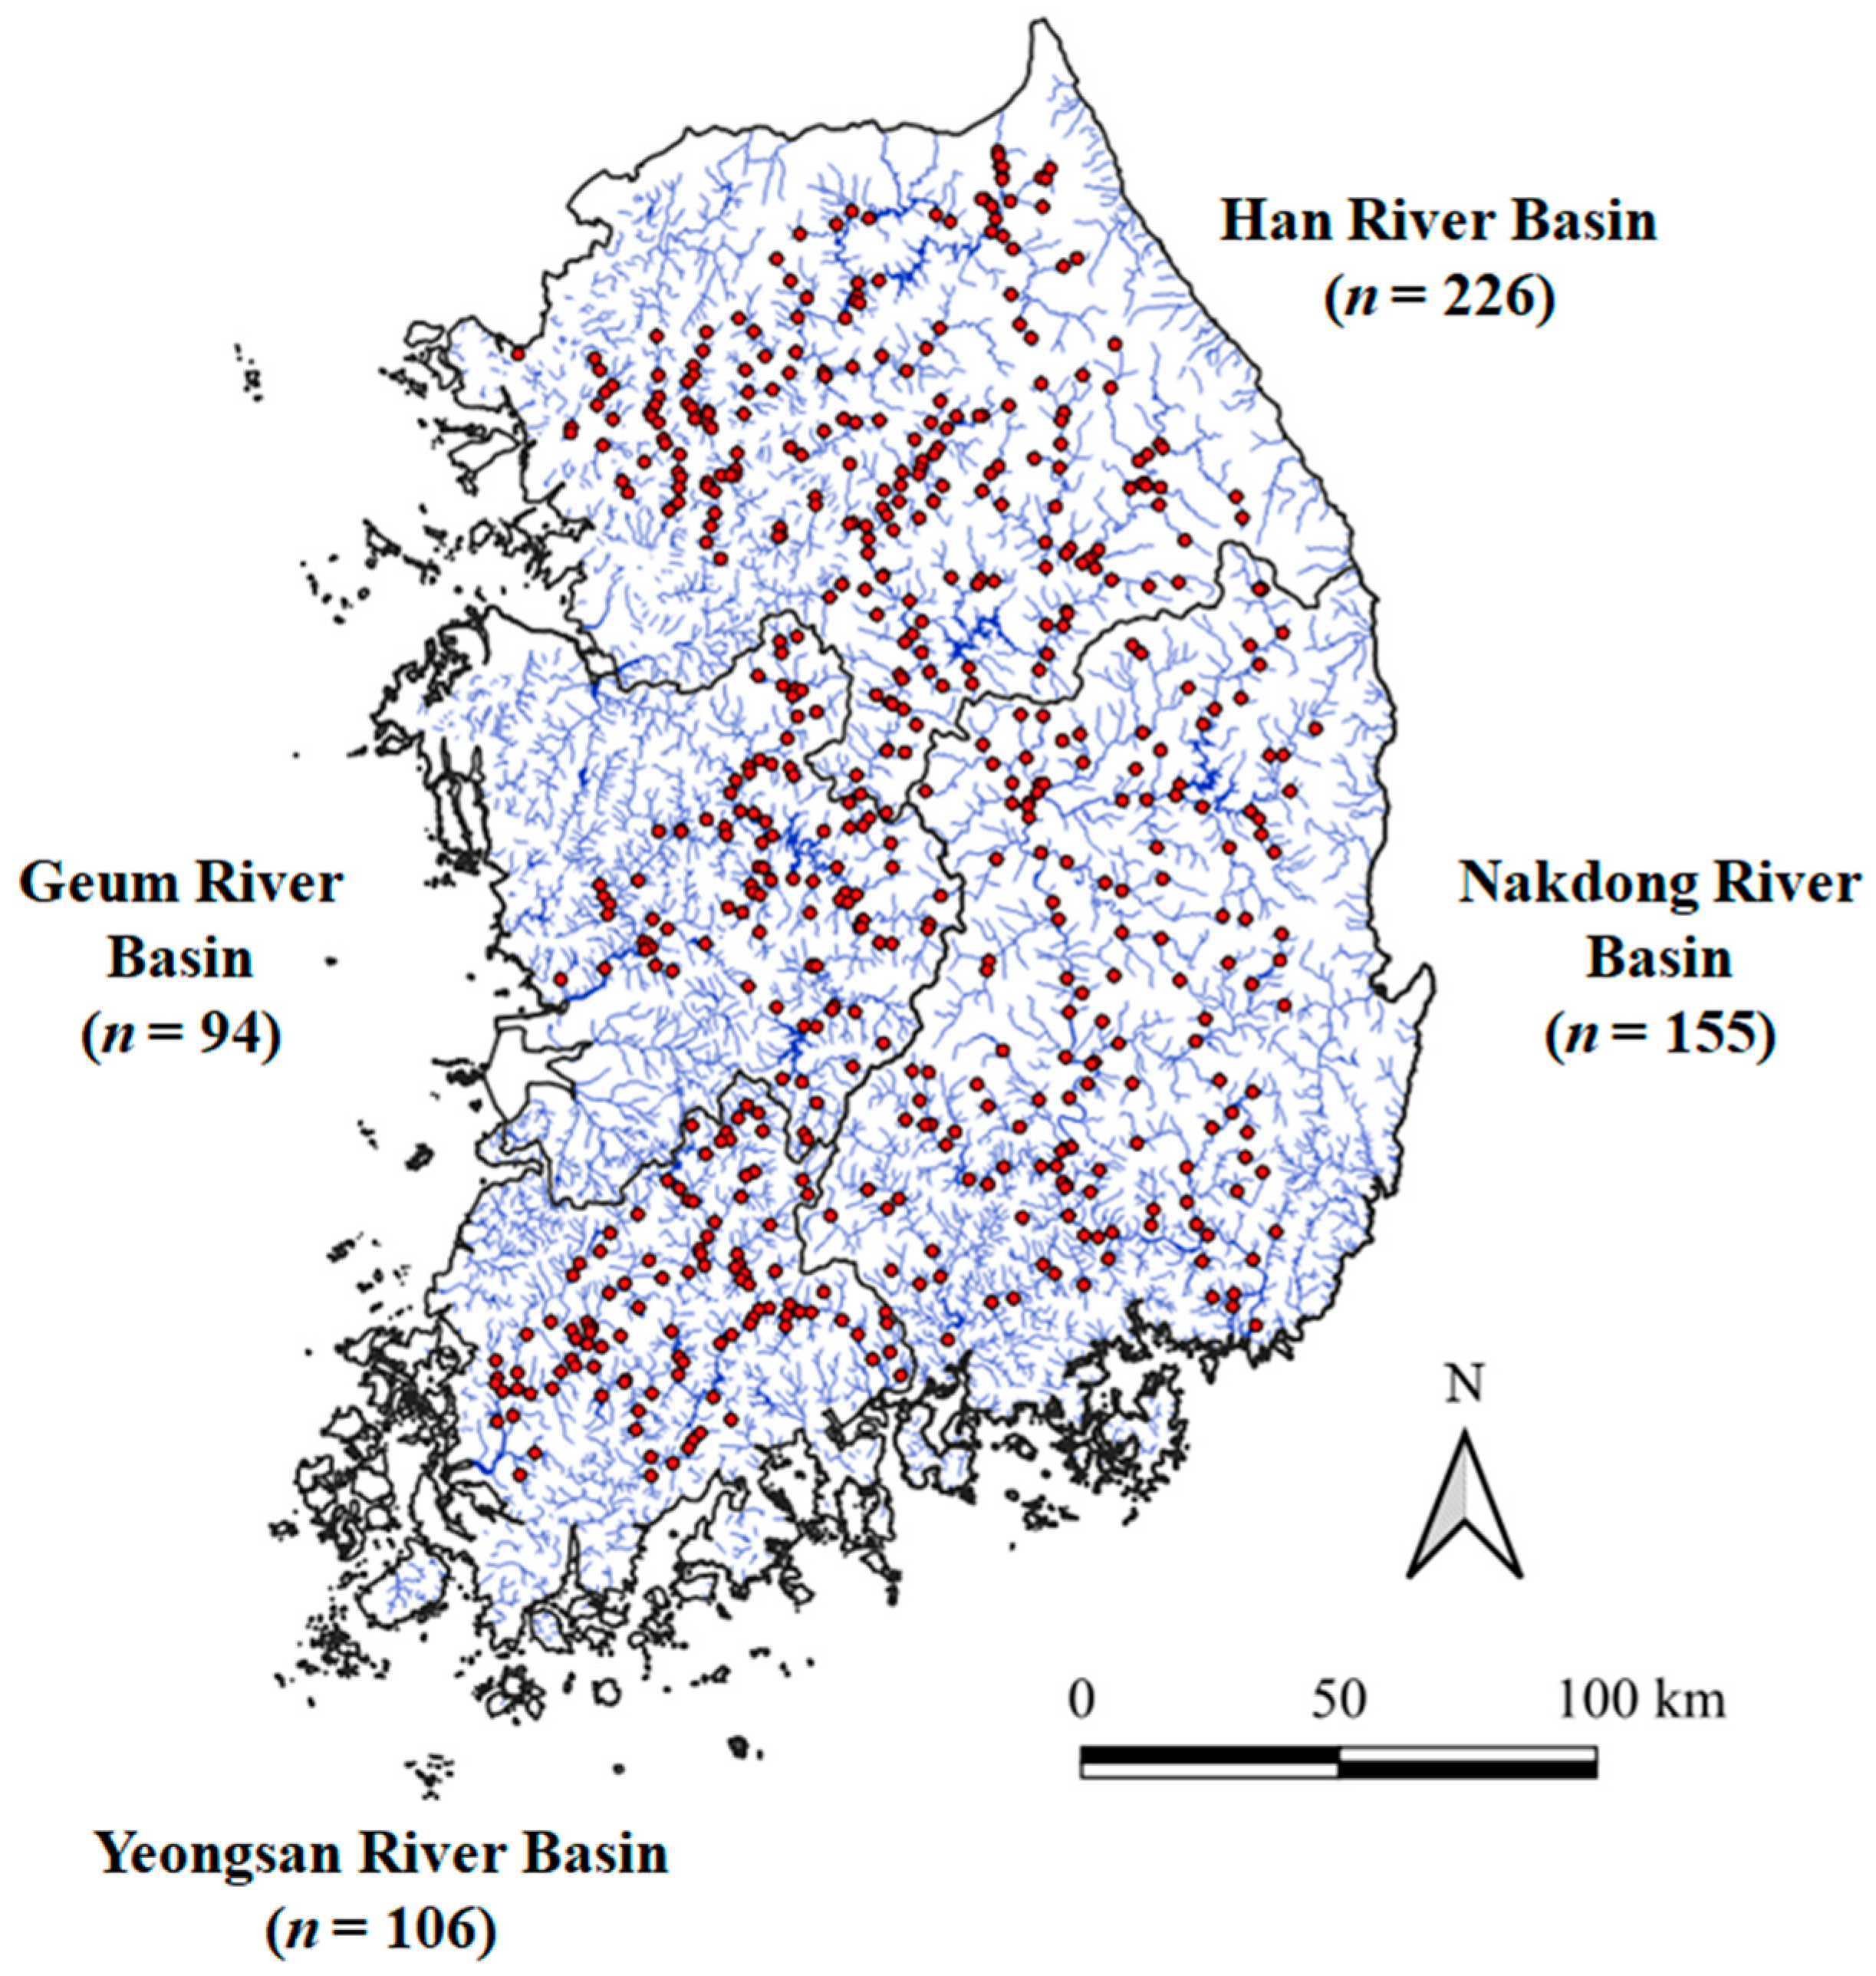
2.1. Study Area and Fish Data

The study area included four major river basins (Han, Nakdong, Geum, and Yeongsan) in South Korea (Figure 1). Largemouth bass monitoring data (2011–2015) were obtained from the Water Environment Information System (http://water.nier.go.kr/, assessed on 3 August 2020). Among the 960 fish monitoring stations in South Korea, 581 sites throughout the 4 major river basins were selected by considering the availability of largemouth bass monitoring data and environmental data. Specifically, 226, 155, 94, and 106 sites belonged to the Han, Nakdong, Geum, and Yeongsan River basins, respectively.
Fish monitoring is conducted annually by the National Aquatic Ecological Monitoring Program of Korea [26]. Fish were captured using casting net and skimming net methods. Fish monitoring stations are representative sites reflecting the characteristics of rivers and streams. Each station includes a riffle, a pool, and a run over the course of a 200 m section in length between upstream and downstream.

2.2. Environmental Data

The environmental data used in this study were temperature (Temp), precipitation (Prcp), flow rate (Flow), total nitrogen (TotalN), total phosphorus (TotalP), and total suspended solids (TotalSS). Temperature is an important determinant because freshwater fish belong to ectotherms. Precipitation and flow rate are well-known variables influencing the physical habitat suitability of fish [27]. In addition, water quality variables such as TotalN, TotalP, and TotalSS are known to play key roles in fish distribution [28]. These variables were further divided into six categories such as annual average, monthly difference, as well as the means of spring (March to May), summer (June to August), fall (September to November), and winter (December to February) to reflect the annual trends and seasonal variability. Additionally, two topographic variables that limit the geographic distribution of fish [1,29,30], elevation and slope, were used as background environmental data. Elevation is generally negatively correlated with water temperature, which affects fish distribution [31]. Slope can influence water velocity [32], which is one of the important hydraulic variables determining the distribution of fish [33].
Temperature and precipitation data were downloaded from the Korea Meteorological Administration (http://www.climate.go.kr/, assessed on 5 August 2020). Flow rate and water quality data were obtained from the climate change database (http://motive.kei.re.kr/, assessed on 10 August 2020) of model of integrated impact and vulnerability evaluation (MOTIVE). Elevation and slope data were acquired from the National Geographic Information Institute (http://www.ngii.go.kr/, assessed on 3 August 2020) and from the National Institute of Agricultural Sciences (http://www.naas.go.kr/, assessed on 3 August 2020), respectively.

2.3. Classification Modeling

Fernández-Delgado et al. proposed a list of the top 20 binary classification models by comprehensively comparing the accuracy of 179 algorithms using 121 data sets [34]. Among the 20 models, 13 algorithms that were included in the caret package [12] were used in this study: random forest (rf), C5.0, conditional inference random forest (cforest), k-nearest neighbor (knn), support vector machine with radial basis function kernel (svmRadial and svmRadialCost), flexible discriminant analysis (fda), neural network with feature extraction (pcaNNet), Bayesian generalized linear model (bayesglm), support vector machine with polynomial kernel (svmPoly), model averaged neural network (avNNet), neural network (nnet), and penalized discriminant analysis (pda). Classification algorithms were developed in R [13] and all default parameters in the caret package [12] were used in this study.
In total, 2869 records (778 presence and 2091 absence records) were collected from 2011 to 2015 (581 records per year, except for 545 records in 2011). Of these, 70% were used for model training, whereas the remaining 30% were labeled as the test set (Figure 2). The training and test samples were selected using the createDataPartition function in R, and this sample selection was replicated 10 times. The createDataPartition function offers a balanced sampling of records, which can prevent bias. For each replication, 13 classification algorithms were calibrated using the training set, and algorithm performance was evaluated using the corresponding test set. The training set was divided into two subsets to search for the best hyperparameter setting. Subsets were randomly selected using the bootstrap method. We used 75% of the training set for hyperparameter searching and the remaining was used for hyperparameter validation. This hyperparameter searching was replicated 25 times, and the best hyperparameter was selected based on the algorithm accuracy. To assess the performance of each algorithm, accuracy and kappa values were calculated for both the training and test sets. Additionally, the average rank of each algorithm was evaluated by comparing the accuracy or kappa value of the algorithm in each replication.
Individual classification algorithms that had an average accuracy of over 0.8 and an average kappa value above 0.5 were selected to develop the ensemble models. The ensemble models were constructed from a combination of the top-three-ranked algorithms (i.e., rf, C5.0, and cforest). Each algorithm was optimized by two hyperparameter optimization methods, grid search and random search. Considering that the occurrence frequency can be used to assess the impacts of invasive species [35], the optimal model was selected based on the average difference between the observed and predicted frequency of largemouth bass occurrence within the study period (2011–2015). Additionally, the contribution of environmental variables to the prediction of largemouth bass occurrence was assessed using the optimized model. Moreover, true skill statistics (TSS) was applied to derive threshold values for the top-three-ranked environmental variables: elevation, annual mean temperature, and fall mean temperature.

3. Results and Discussion

3.1. Performance of Classification Algorithms

Table 1 compares the ability of the 13 classification algorithms to predict largemouth bass occurrence. According to the average rank of the individual models, the algorithm rf showed the best performance, followed by C5.0, and cforest, all of which had an average accuracy over 0.8 and an average kappa value above 0.5 in both the training and test simulations. This result is consistent with previous studies that revealed the strong performance of random forest algorithm [11,36]. The average rank of model performance fell sharply from the fourth model (knn) onward because of large decreases in the accuracy and kappa values. Previous studies have built ensemble models by simply integrating all the candidate algorithms into the model [1] or by weighting candidate algorithms based on their accuracy [20,36]. However, this study suggests that individual classification algorithms have a large spectrum of modeling performance and, therefore, should be incorporated into the ensemble model carefully.
Figure 3 illustrates the performance of ensemble models compared with the best individual model (rf). Model performance was evaluated using the average difference between the observed and predicted frequency of largemouth bass occurrence (Table S1). The rf model showed the least difference between the observed and predicted frequency, whereas the addition of the second and third classification algorithms (C5.0 and cforest) into the rf model notably increased prediction errors. These findings suggest that ensemble models did not work better than the best individual model (rf) at predicting largemouth bass occurrence. Ensemble models generally outperform individual models when combining individual models predicting different trends [37]. However, this might not have occurred in this study because all of the top three individual models underestimated the frequency of largemouth bass occurrence.
Ensemble models may have higher ecological validity than individual models. Muñoz-Mas et al. showed the ecological reliability of the ensemble model, which is obtained from the attenuation of response curves [37]. This attenuation occurred due to the diversity of the prediction result. The diversity derived from the model error can be measured by ambiguity decomposition [38] and bias-variance-covariance decomposition [39]. However, this “diversity” is only applicable in regression models [40], and there is still no consensus on defining diversity in classification tasks [41,42]. Future studies can be conducted by applying diversity measurements to ensemble classification algorithm evaluations.
Classification models only depict the species’ characteristics that appear in the past or present [43], which may lead to high uncertainty under certain situations in invasive species modeling. For example, insufficient invasive species records due to short invasion history may increase uncertainty [44]. Moreover, training samples recorded under a non-equilibrium state may also increase model uncertainty [44]. In this study, we assumed that largemouth bass live in an equilibrium state because the largemouth bass was first introduced several decades ago and now occurs in all four major river basins in South Korea. In addition, our occurrence data for largemouth bass are sufficient to reflect diverse distribution characteristics because they were collected from representative monitoring sites in South Korea.

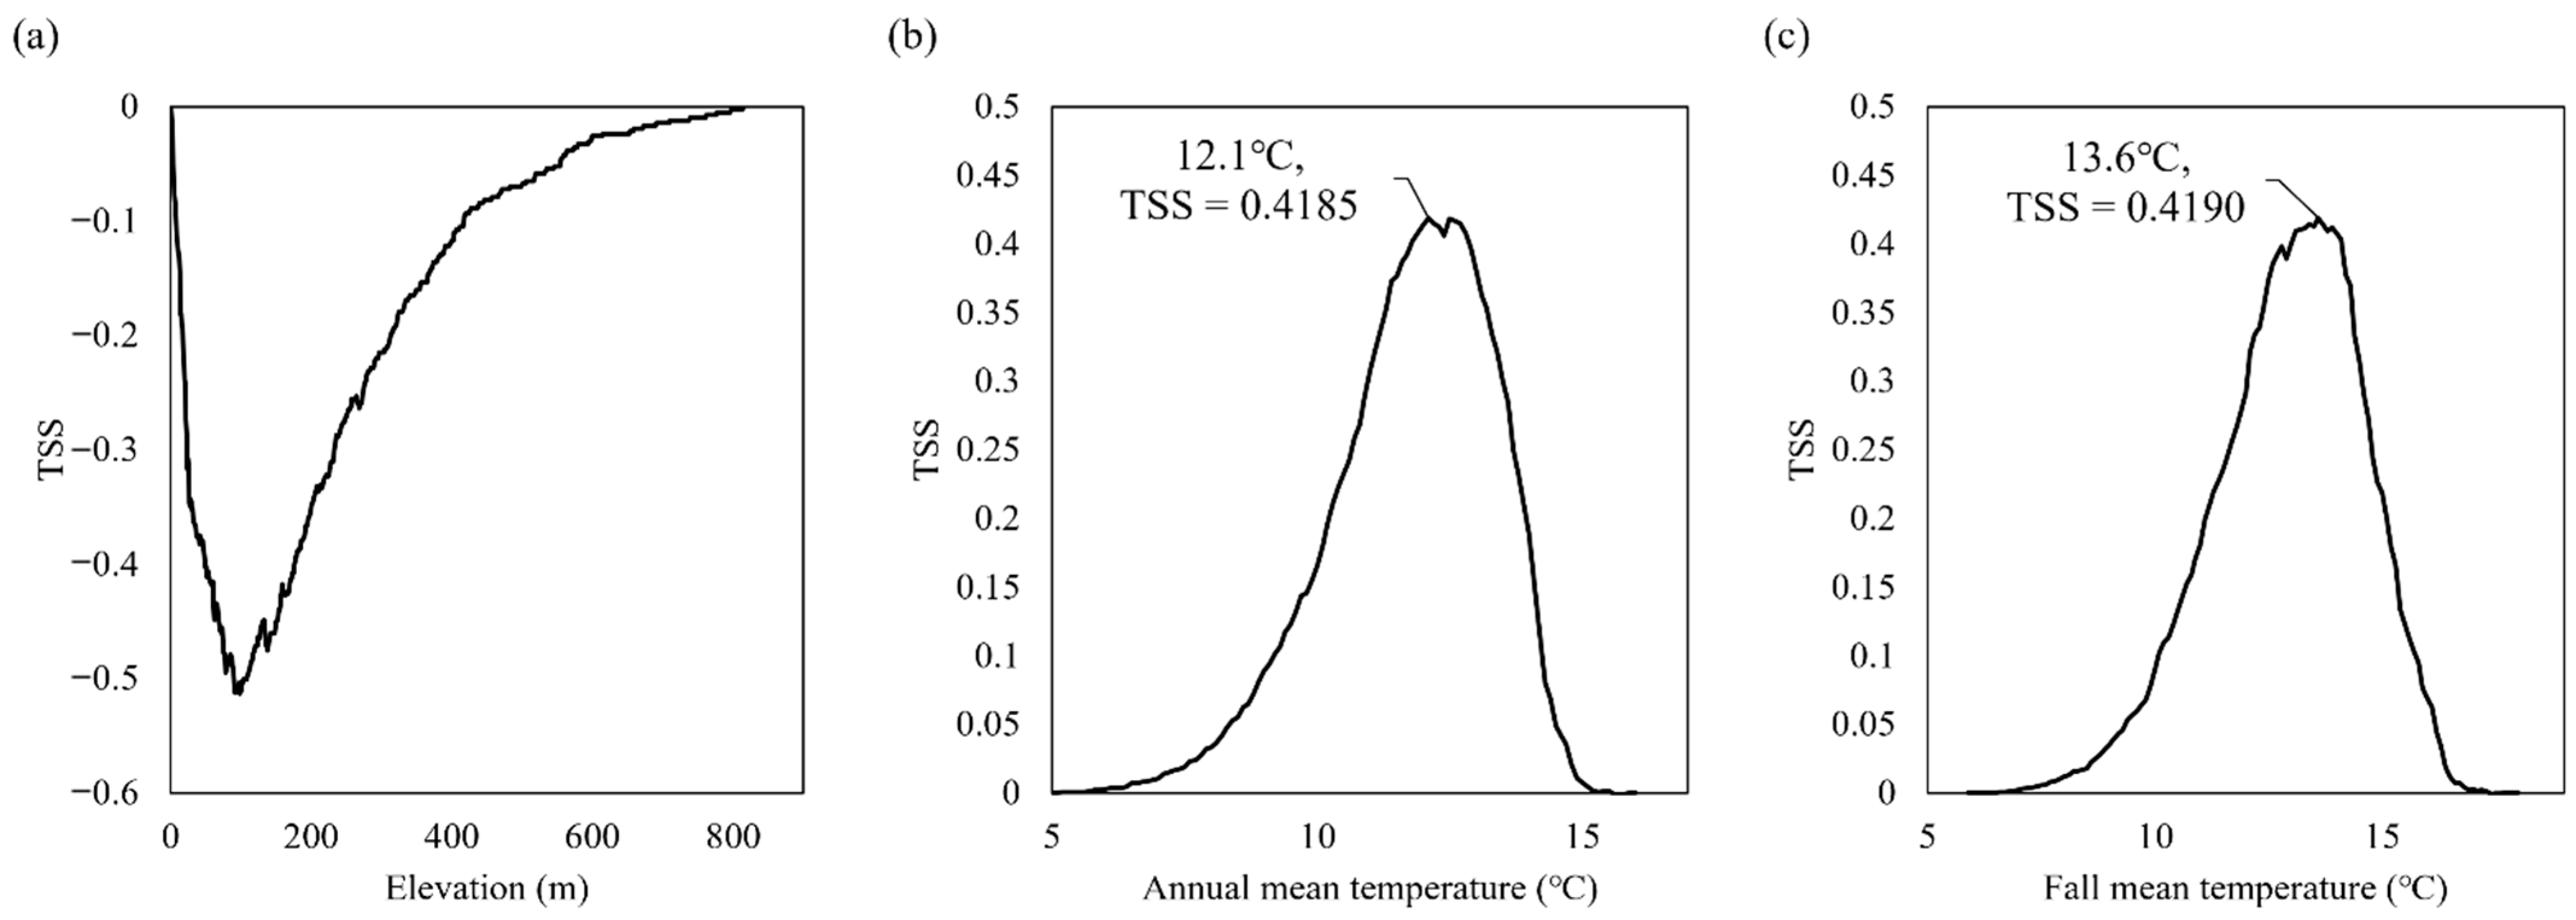
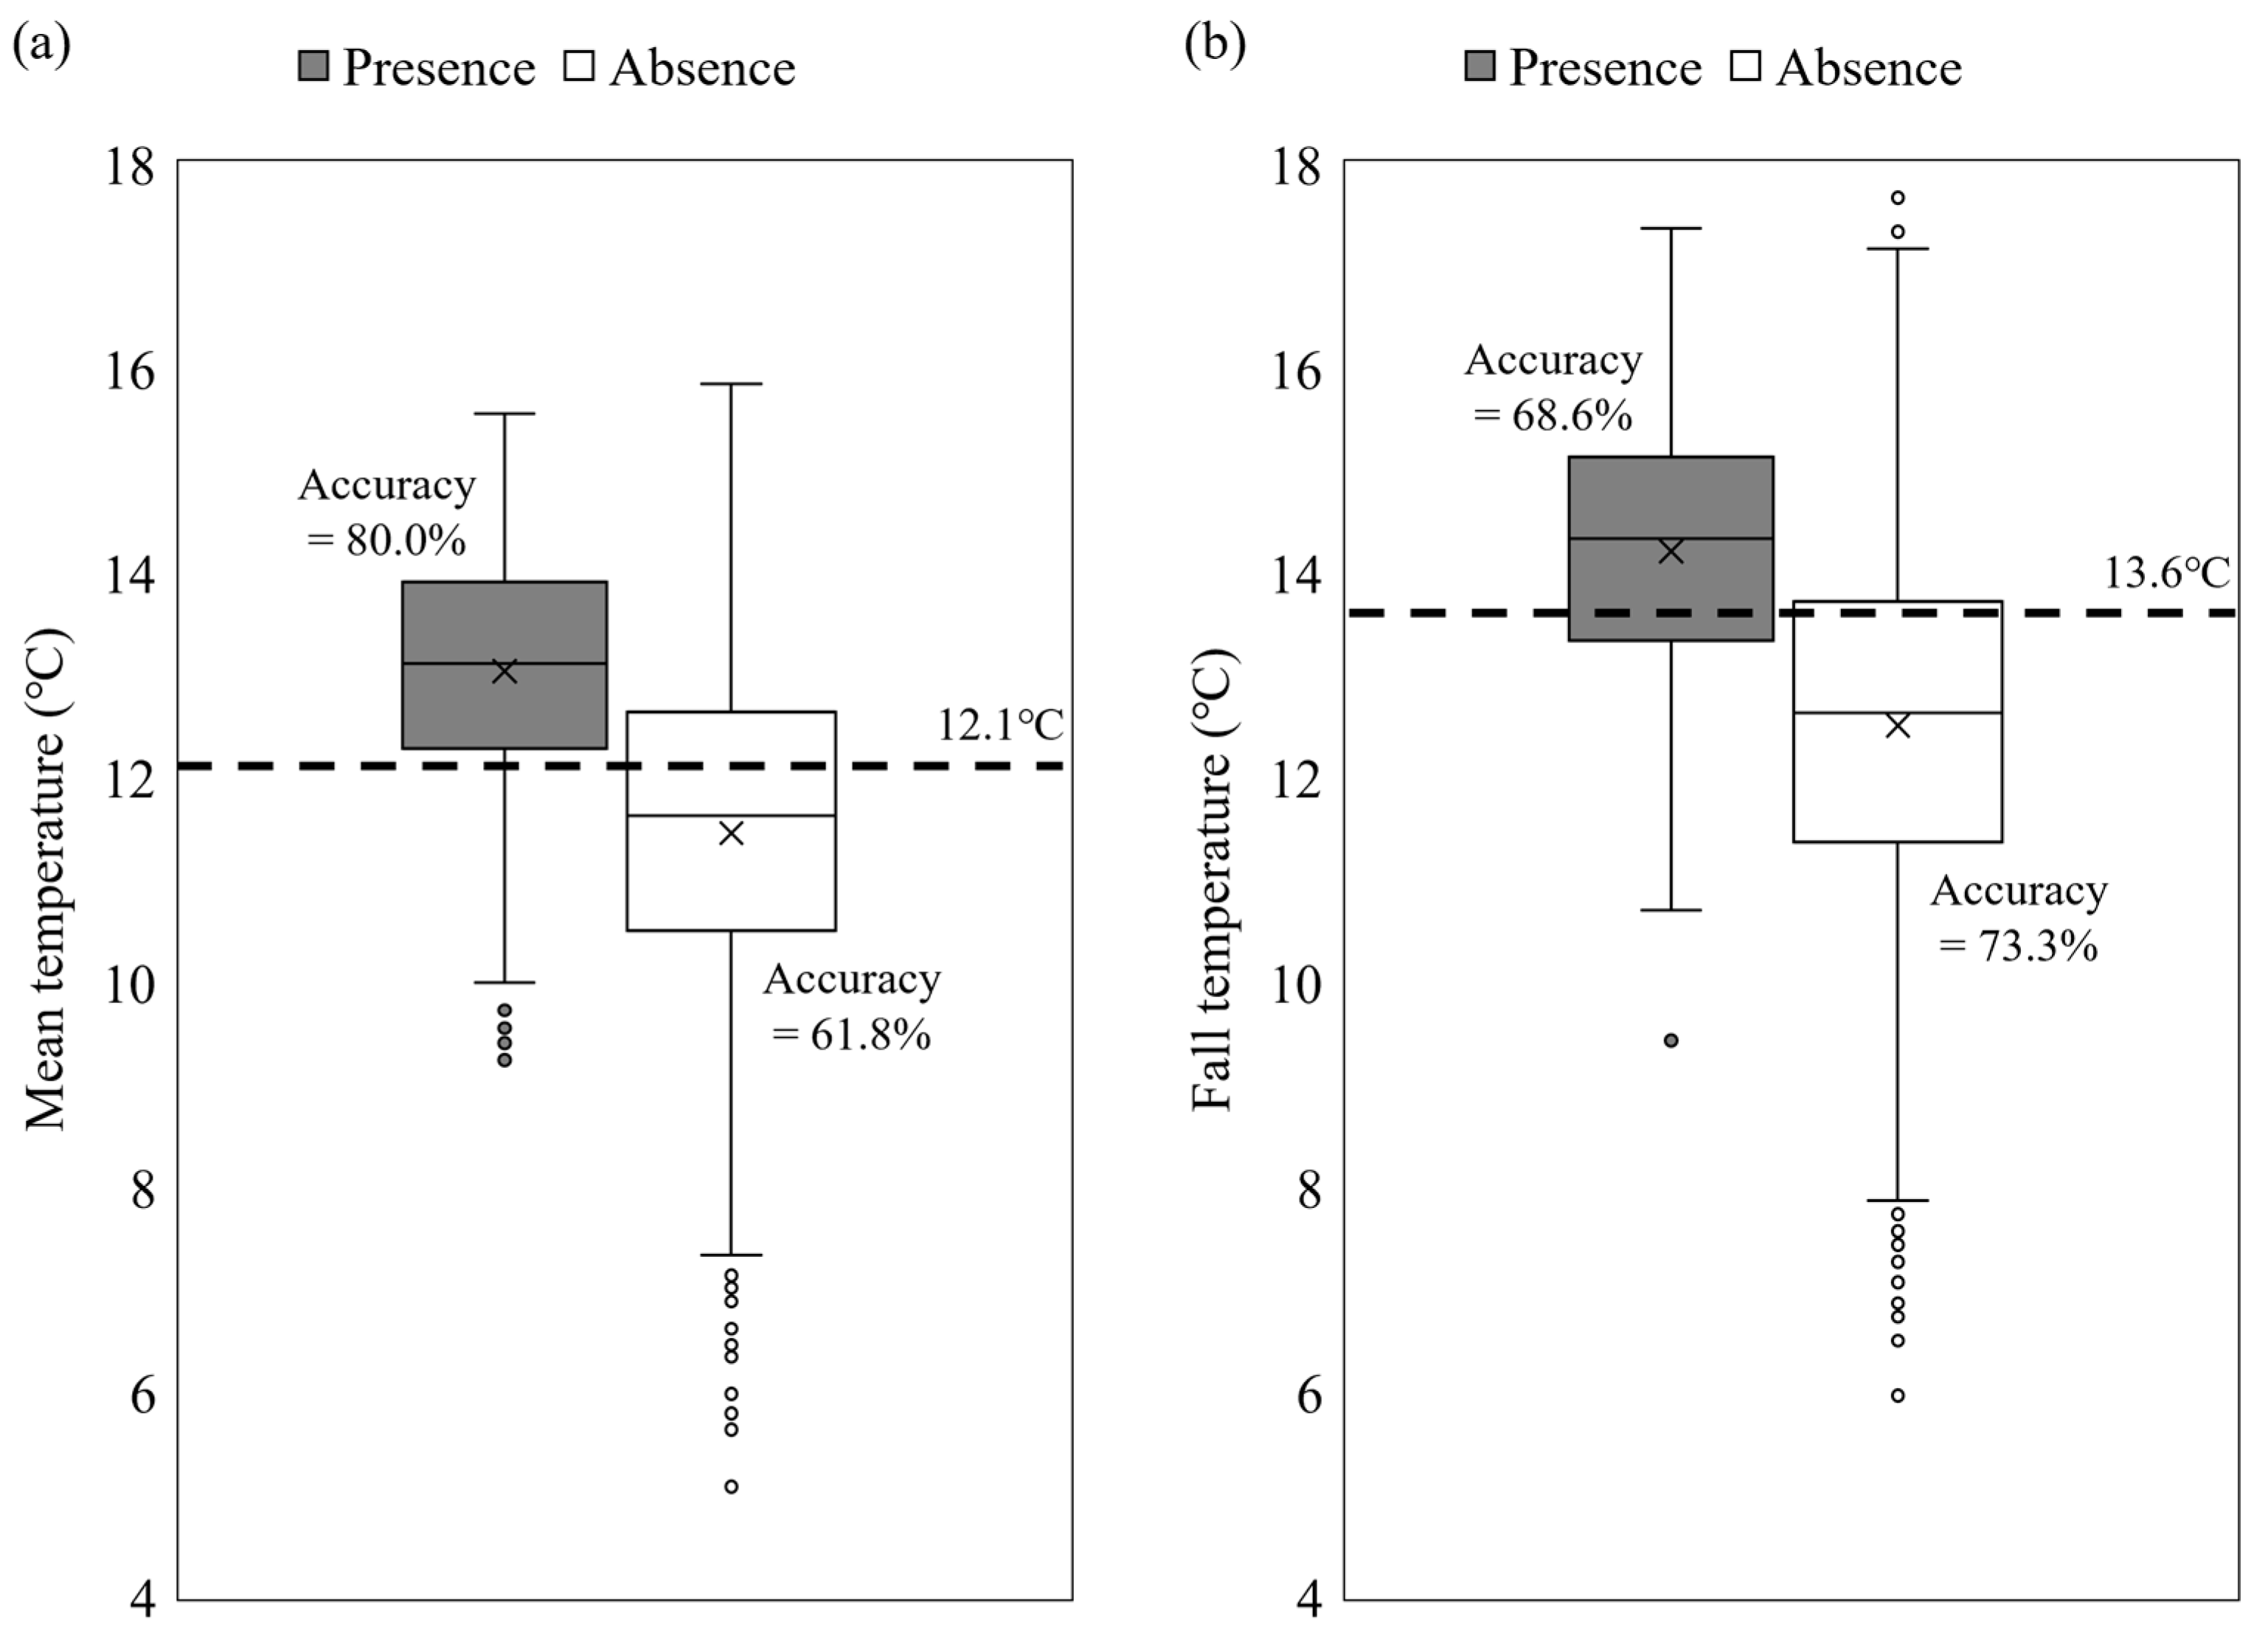
3.2. Role of Environmental Variables

The mean value (2011–2015) of environmental variables and their cumulative contribution to the prediction of largemouth bass occurrence are shown in Table 2 and Figure 4, respectively. The contribution was normalized by the most important variable, elevation (100%). Yoon et al. reported that elevation was the most influential variable in the distribution of freshwater fish in South Korea, which was negatively correlated with water temperature [31]. The next most important variables were climatic variables such as temperature (Temp) and precipitation (Prcp). The high contribution of temperature has been well-demonstrated in the distribution of ectothermic freshwater fish [45,46].
In addition to annual average temperature, seasonal temperature, particularly in fall and winter, played an important role in largemouth bass occurrence (Figure 4). Kwon et al. also demonstrated that seasonal variation in temperature significantly influenced the distribution of freshwater fish in South Korea [11]. Following the climatic variables, water quality (TotalN, TotalP, and TotalSS) also affected largemouth bass occurrence. Meador et al. reported that TotalN, TotalP, and water temperature frequently correlated with the increased species richness of invasive freshwater fish, including the largemouth bass [47]. These findings suggest that water quality parameters and seasonal variations in environmental variables should be considered when predicting invasive freshwater fish distributions.
Threshold values of the top-three-ranked environmental variables for the prediction of largemouth bass occurrence were determined by the TSS (Figure 5). For elevation, threshold was not determined because the TSS was less than zero, indicating that it has poor discriminating power. However, the highest TSS was found to be 0.4185 and 0.4190 at 12.1 °C annual mean temperature and at 13.6 °C fall mean temperature, respectively. Figure 6 shows the accuracy of these threshold values to predict the presence and absence of largemouth bass. For annual mean temperature, the accuracy of presence and absence was 80.0% and 61.8%, respectively. In addition, the threshold of fall mean temperature distinguished the presence and absence at 68.6% and 73.3% accuracy, respectively. In general, the growth potential of largemouth bass decreases as temperature decreases, thus limiting distribution [48]. Moreover, fall mean temperature might restrict the distribution of largemouth bass because of higher swimming performance in fall than in spring or in winter [49]. These findings suggest that the frequency of largemouth bass occurrence in South Korea may increase under global warming.

4. Conclusions

In this study, 13 classification algorithms were systematically evaluated to predict largemouth bass occurrence in South Korea. The best individual model (rf) works better than any ensemble models of the top three algorithms (rf, C5.0, and cforest) at predicting the frequency of largemouth bass occurrence over a period of 5 years (2011–2015). In addition, water quality variables (TotalN, TotalP, and TotalSS) substantially contributed to the prediction of largemouth bass occurrence, following conventional climatic (temperature and precipitation) variables. Given that annual mean temperature and fall mean temperature are the most important discriminating variables, the ecological risk posed by invasive largemouth bass is expected to increase under climate change. The evaluation process proposed in this study can be useful for developing prediction models for invasive freshwater fish, but requires further study to elaborate the ecological reliability of the model. In addition, ecological factors such as interspecific competition and predation should be considered in further studies because ecological interactions can influence the distributions of invasive species.

Supplementary Materials

The following are available online at https://www.mdpi.com/article/10.3390/su13179507/s1, Table S1: Observed and predicted frequency of largemouth bass occurrence from 2011 to 2015 in South Korea; ensemble models composed of the random forest (rf), C5.0, and Conditional Inference Random Forest (cforest) classification algorithms.

Author Contributions

Conceptualization, Z.K., S.J.K. and J.J.; methodology, Z.K.; data curation, T.S. and D.S.; writing—original draft preparation, Z.K.; writing—review and editing, J.J.; visualization, Z.K. and S.J.K.; funding acquisition, K.-G.A. and J.J. All authors have read and agreed to the published version of the manuscript.

Funding

This study was supported by the Korea Environment Industry & Technology Institute (KEITI) through the Exotic Invasive Species Management Program funded by the Korea Ministry of Environment (MOE) [RE201807019].

Institutional Review Board Statement

Not applicable.

Informed Consent Statement

Not applicable.

Data Availability Statement

Not applicable.

Acknowledgments

We would like to thank the MOTIVE (model of integrated impact and vulnerability evaluation of climate change) water management team for providing environmental data.

Conflicts of Interest

The authors declare no conflict of interest.

References

  1. Grenouillet, G.; Buisson, L.; Casajus, N.; Lek, S. Ensemble modelling of species distribution: The effects of geographical and environmental ranges. Ecography 2011, 34, 9–17. [Google Scholar] [CrossRef]
  2. McNyset, K.M. Use of ecological niche modelling to predict distributions of freshwater fish species in Kansas. Ecol. Freshw. Fish 2005, 14, 243–255. [Google Scholar] [CrossRef]
  3. Vezza, P.; Parasiewicz, P.; Calles, O.; Spairani, M.; Comoglio, C. Modelling habitat requirements of bullhead (Cottus gobio) in Alpine streams. Aquat. Sci. 2014, 76, 1–15. [Google Scholar] [CrossRef]
  4. Fraker, M.E.; Keitzer, S.C.; Sinclair, J.S.; Aloysius, N.R.; Dippold, D.A.; Yen, H.; Arnold, J.G.; Daggupati, P.; Johnson, M.-V.V.; Martin, J.F. Projecting the effects of agricultural conservation practices on stream fish communities in a changing climate. Sci. Total Environ. 2020, 747, 141112. [Google Scholar] [CrossRef]
  5. Mercado-Silva, N.; Olden, J.D.; Maxted, J.T.; Hrabik, T.R.; Vander Zanden, M.J. Forecasting the spread of invasive rainbow smelt in the Laurentian Great Lakes region of North America. Conserv. Biol. 2006, 20, 1740–1749. [Google Scholar] [CrossRef]
  6. Iguchi, K.I.; Matsuura, K.; McNyset, K.M.; Peterson, A.T.; Scachetti-Pereira, R.; Powers, K.A.; Vieglais, D.A.; Wiley, E.O.; Yodo, T. Predicting invasions of North American basses in Japan using native range data and a genetic algorithm. Trans. Am. Fish. Soc. 2004, 133, 845–854. [Google Scholar] [CrossRef] [Green Version]
  7. Kärcher, O.; Frank, K.; Walz, A.; Markovic, D. Scale effects on the performance of niche-based models of freshwater fish distributions. Ecol. Model. 2019, 405, 33–42. [Google Scholar] [CrossRef]
  8. Conti, L.; Comte, L.; Hugueny, B.; Grenouillet, G. Drivers of freshwater fish colonisations and extirpations under climate change. Ecography 2015, 38, 510–519. [Google Scholar] [CrossRef]
  9. Fukuda, S.; De Baets, B.; Onikura, N.; Nakajima, J.; Mukai, T.; Mouton, A. Modelling the distribution of the pan-continental invasive fish Pseudorasbora parva based on landscape features in the northern Kyushu Island, Japan. Aquat. Conserv. Mar. Freshw. Ecosyst. 2013, 23, 901–910. [Google Scholar] [CrossRef]
  10. Howeth, J.; Gantz, C.; Angermeier, P.; Frimpong, E.; Hoff, M.; Keller, R.; Mandrak, N.; Marchetti, M.; Olden, J.; Romagosa, C.; et al. Predicting invasiveness of species in trade: Climate match, trophic guild and fecundity influence establishment and impact of non-native freshwater fishes. Divers. Distrib. 2016, 22, 148–160. [Google Scholar] [CrossRef]
  11. Kwon, Y.S.; Bae, M.J.; Hwang, S.J.; Kim, S.H.; Park, Y.S. Predicting potential impacts of climate change on freshwater fish in Korea. Ecol. Inform. 2015, 29, 156–165. [Google Scholar] [CrossRef]
  12. Kuhn, M. Building Predictive Models in R Using the caret Package. J. Stat. Softw. 2008, 28, 1–26. [Google Scholar] [CrossRef] [Green Version]
  13. R Core Team. R: A Language and Environment for Statistical Computing; R Foundation for Statistical Computing: Vienna, Austria, 2019; Available online: https://www.R-project.org/ (accessed on 21 May 2020).
  14. Thuiller, W.; Lafourcade, B.; Engler, R.; Araújo, M.B. BIOMOD—A platform for ensemble forecasting of species distributions. Ecography 2009, 32, 369–373. [Google Scholar] [CrossRef]
  15. Gallardo, B.; Aldridge, D.C. Inter-basin water transfers and the expansion of aquatic invasive species. Water Res. 2018, 143, 282–291. [Google Scholar] [CrossRef]
  16. Buisson, L.; Thuiller, W.; Casajus, N.; Lek, S.; Grenouillet, G. Uncertainty in ensemble forecasting of species distribution. Glob. Chang. Biol. 2010, 16, 1145–1157. [Google Scholar] [CrossRef]
  17. Guo, C.B.; Lek, S.; Ye, S.W.; Li, W.; Liu, J.S.; Li, Z.J. Uncertainty in ensemble modelling of large-scale species distribution: Effects from species characteristics and model techniques. Ecol. Model. 2015, 306, 67–75. [Google Scholar] [CrossRef]
  18. Jones-Farrand, D.T.; Fearer, T.M.; Thogmartin, W.E.; Thompson, F.R.; Nelson, M.D.; Tirpak, J.M. Comparison of statistical and theoretical habitat models for conservation planning: The benefit of ensemble prediction. Ecol. Appl. 2011, 21, 2269–2282. [Google Scholar] [CrossRef] [Green Version]
  19. Rokach, L. Ensemble-based classifiers. Artif. Intell. Rev. 2010, 33, 1–39. [Google Scholar] [CrossRef]
  20. Poulos, H.M.; Chernoff, B.; Fuller, P.L.; Butman, D. Ensemble forecasting of potential habitat for three invasive fishes. Aquat. Invasions 2012, 7, 59–72. [Google Scholar] [CrossRef]
  21. Hao, T.X.; Elith, J.; Lahoz-Monfort, J.J.; Guillera-Arroita, G. Testing whether ensemble modelling is advantageous for maximising predictive performance of species distribution models. Ecography 2020, 43, 549–558. [Google Scholar] [CrossRef] [Green Version]
  22. García-Berthou, E.; Alcaraz, C.; Pou-Rovira, Q.; Zamora, L.; Coenders, G.; Feo, C. Introduction pathways and establishment rates of invasive aquatic species in Europe. Can. J. Fish. Aquat. Sci. 2005, 62, 453–463. [Google Scholar] [CrossRef]
  23. Maezono, Y.; Miyashita, T. Community-level impacts induced by introduced largemouth bass and bluegill in farm ponds in Japan. Biol. Conserv. 2003, 109, 111–121. [Google Scholar] [CrossRef]
  24. Kamerath, M.; Chandra, S.; Allen, B.C. Distribution and impacts of warm water invasive fish in Lake Tahoe, USA. Aquat. Invasions 2008, 3, 35–41. [Google Scholar] [CrossRef]
  25. Hodgson, J.R.; Hansen, E.M. Terrestrial prey items in the diet of largemouth bass, Micropterus salmoides, in a small north temperate lake. J. Freshw. Ecol. 2005, 20, 793–794. [Google Scholar] [CrossRef]
  26. NIER. Survey and Assessment of Stream/River Ecosystem Health (VII); Publication Number: 11-1480523-002181-01; NIER: Incheon, Korea, 2014. [Google Scholar]
  27. Shim, T.; Kim, Z.; Seo, D.; Kim, Y.O.; Hwang, S.J.; Jung, J. Integrating hydraulic and physiologic factors to develop an ecological habitat suitability model. Environ. Model. Softw. 2020, 131, 104760. [Google Scholar] [CrossRef]
  28. Kim, Z.; Shim, T.; Koo, Y.M.; Seo, D.; Kim, Y.O.; Hwang, S.J.; Jung, J. Predicting the impact of climate change on freshwater fish distribution by incorporating water flow rate and quality variables. Sustainability 2020, 12, 10001. [Google Scholar] [CrossRef]
  29. Pletterbauer, F.; Melcher, A.H.; Ferreira, T.; Schmutz, S. Impact of climate change on the structure of fish assemblages in European rivers. Hydrobiologia 2015, 744, 235–254. [Google Scholar] [CrossRef]
  30. Pont, D.; Hugueny, B.; Oberdorff, T. Modelling habitat requirement of European fishes: Do species have similar responses to local and regional environmental constraints? Can. J. Fish. Aquat. Sci. 2005, 62, 163–173. [Google Scholar] [CrossRef] [Green Version]
  31. Yoon, J.D.; Kim, J.H.; Byeon, M.S.; Yang, H.J.; Park, J.Y.; Shim, J.H.; Song, H.B.; Yang, H.; Jang, M.H. Distribution patterns of fish communities with respect to environmental gradients in Korean streams. Ann. Limnol. Int. J. Limnol. 2011, 47, S63–S71. [Google Scholar] [CrossRef]
  32. Oberdorff, T.; Pont, D.; Hugueny, B.; Chessel, D. A probabilistic model characterizing fish assemblages of French rivers: A framework for environmental assessment. Freshw. Biol. 2001, 46, 399–415. [Google Scholar] [CrossRef]
  33. Huet, M. Profiles and biology of western European streams as related to fish management. Trans. Am. Fish. Soc. 1959, 88, 155–163. [Google Scholar] [CrossRef]
  34. Fernández-Delgado, M.; Cernadas, E.; Barro, S.; Amorim, D. Do we need hundreds of classifiers to solve real world classification problems? J. Mach. Learn. Res. 2014, 15, 3133–3181. [Google Scholar]
  35. Hermoso, V.; Clavero, M.; Blanco-Garrido, F.; Prenda, J. Invasive species and habitat degradation in Iberian streams: An analysis of their role in freshwater fish diversity loss. Ecol. Appl. 2011, 21, 175–188. [Google Scholar] [CrossRef]
  36. Hao, T.; Elith, J.; Guillera-Arroita, G.; Lahoz-Monfort, J.J. A review of evidence about use and performance of species distribution modelling ensembles like BIOMOD. Divers. Distrib. 2019, 25, 839–852. [Google Scholar] [CrossRef]
  37. Munoz-Mas, R.; Lopez-Nicolas, A.; Martinez-Capel, F.; Pulido-Velazquez, M. Shifts in the suitable habitat available for brown trout (Salmo trutta L.) under short-term climate change scenarios. Sci. Total Environ. 2016, 544, 686–700. [Google Scholar] [CrossRef]
  38. Krogh, A.; Vedelsby, J. Neural network ensembles, cross validation, and active learning. Adv. Neural Inf. Process. Syst. 1995, 7, 231. [Google Scholar]
  39. Geman, S.; Bienenstock, E.; Doursat, R. Neural networks and the bias/variance dilemma. Neural Comput. 1992, 4, 1–58. [Google Scholar] [CrossRef]
  40. Brown, G.; Wyatt, J.; Harris, R.; Yao, X. Diversity creation methods: A survey and categorisation. Inf. Fusion 2005, 6, 5–20. [Google Scholar] [CrossRef]
  41. Bian, Y.; Chen, H. When does diversity help generalization in classification ensembles? IEEE Trans. Cybern. 2021. [Google Scholar] [CrossRef]
  42. Didaci, L.; Fumera, G.; Roli, F. Diversity in classifier ensembles: Fertile concept or dead end? In Proceedings of the International Workshop on Multiple Classifier Systems; Springer: Berlin/Heidelberg, Germany, 2013; pp. 37–48. [Google Scholar] [CrossRef]
  43. Van Echelpoel, W.; Boets, P.; Landuyt, D.; Gobeyn, S.; Everaert, G.; Bennetsen, E.; Mouton, A.; Goethals, P.L. Species distribution models for sustainable ecosystem management. In Developments in Environmental Modelling; Elsevier: Amsterdam, The Netherlands, 2015; Volume 27, pp. 115–134. [Google Scholar]
  44. Boets, P.; Landuyt, D.; Everaert, G.; Broekx, S.; Goethals, P.L. Evaluation and comparison of data-driven and knowledge-supported Bayesian Belief Networks to assess the habitat suitability for alien macroinvertebrates. Environ. Model. Softw. 2015, 74, 92–103. [Google Scholar] [CrossRef]
  45. Alofs, K.; Jackson, D. The abiotic and biotic factors limiting establishment of predatory fishes at their expanding northern range boundaries in Ontario, Canada. Glob. Chang. Biol. 2015, 21, 2227–2237. [Google Scholar] [CrossRef] [PubMed]
  46. Alofs, K.M.; Jackson, D.A.; Lester, N.P. Ontario freshwater fishes demonstrate differing range-boundary shifts in a warming climate. Divers. Distrib. 2014, 20, 123–136. [Google Scholar] [CrossRef]
  47. Meador, M.R.; Brown, L.R.; Short, T. Relations between introduced fish and environmental conditions at large geographic scales. Ecol. Indic. 2003, 3, 81–92. [Google Scholar] [CrossRef]
  48. Glover, D.C.; DeVries, D.R.; Wright, R.A. Growth of largemouth bass in a dynamic estuarine environment: An evaluation of the relative effects of salinity, diet, and temperature. Can. J. Fish. Aquat. Sci. 2013, 70, 485–501. [Google Scholar] [CrossRef]
  49. Hasler, C.T.; Suski, C.D.; Hanson, K.C.; Cooke, S.J.; Philipp, D.P.; Tufts, B.L. Effect of water temperature on laboratory swimming performance and natural activity levels of adult largemouth bass. Can. J. Zool. 2009, 87, 589–596. [Google Scholar] [CrossRef] [Green Version]
Figure 1. Fish monitoring sites (total 581) located in four river basins in South Korea.
Sustainability 13 09507 g001
Figure 2. A schematic diagram of the algorithm evaluation process.
Sustainability 13 09507 g002
Figure 3. Performance evaluation of ensemble models composed of the random forest (rf), C5.0, and conditional inference random forest (cforest) classification algorithms at predicting the frequency of largemouth bass occurrence from 2011 to 2015 in South Korea.
Sustainability 13 09507 g003
Figure 4. Cumulative contribution of environmental variables: temperature (Temp), precipitation (Prcp), flow rate (Flow), total nitrogen (TotalN), total phosphorus (TotalP), and total suspended solids (TotalSS), to the prediction of largemouth bass occurrence from 2011 to 2015 in South Korea. Random forest (rf) was used to compare the relative contributions of the other environmental variables to elevation (100%).
Sustainability 13 09507 g004
Figure 5. True skill statistics (TSS) for the top-three-ranked environmental variables: (a) elevation; (b) annual mean temperature; (c) fall mean temperature. Threshold values are indicated at the highest TSS.
Sustainability 13 09507 g005
Figure 6. Accuracy of the threshold for: (a) annual mean temperature; (b) fall mean temperature to predict the presence and absence of largemouth bass in South Korea from 2011 to 2015. The threshold is indicated by the dotted line.
Sustainability 13 09507 g006
Table 1. Ranking the ability of 13 classification algorithms to predict largemouth bass occurrence. Standard deviations are indicated in parentheses.
ModelsAverage RankTraining SetTest Set
AccuracyKappaAccuracyKappa
rf1.29 (0.78)0.999 (0)0.998 (0.001)0.830 (0.014)0.544 (0.041)
C5.02.39 (1.19)0.956 (0.031)0.884 (0.083)0.825 (0.012)0.528 (0.036)
cforest2.90 (0.71)0.931 (0.004)0.815 (0.011)0.822 (0.010)0.508 (0.029)
knn6.25 (2.42)0.838 (0.004)0.567 (0.010)0.804 (0.009)0.470 (0.024)
svmRadial6.30 (2.14)0.838 (0.006)0.531 (0.023)0.813 (0.008)0.452 (0.030)
svmRadialCost6.64 (2.25)0.837 (0.008)0.525 (0.026)0.813 (0.008)0.449 (0.029)
fda7.19 (2.51)0.817 (0.006)0.515 (0.018)0.808 (0.009)0.490 (0.025)
pcaNNet8.19 (2.61)0.821 (0.014)0.524 (0.033)0.801 (0.012)0.467 (0.029)
bayesglm8.21 (2.54)0.815 (0.004)0.500 (0.012)0.808 (0.010)0.480 (0.029)
svmPoly8.49 (2.12)0.827 (0.013)0.508 (0.036)0.808 (0.008)0.449 (0.026)
avNNet9.73 (2.36)0.817 (0.008)0.495 (0.037)0.798 (0.007)0.436 (0.033)
nnet11.64 (2.17)0.793 (0.029)0.430 (0.154)0.776 (0.021)0.380 (0.140)
pda11.90 (1.39)0.801 (0.005)0.437 (0.017)0.795 (0.011)0.419 (0.033)
Table 2. Mean values (2011–2015) of environmental variables: temperature (Temp), precipitation (Prcp), flow rate (Flow), total nitrogen (TotalN), total phosphorus (TotalP), and total suspended solids (TotalSS) collected from 581 locations in South Korea. Standard deviations are indicated in parentheses.
SpringSummerFallWinterAnnual AverageMonthly Difference
Temp (°C)11.53 (1.6)23.35 (1.53)12.97 (1.82)−0.32 (2.4)11.88 (1.67)27.95 (3.75)
Prcp (mm/month)70.23 (36.66)239.14 (85.4)79.38 (26.22)28.66 (13.94)104.29 (25.4)332.8 (129.01)
Flow (m3/s)12.28 (37.17)43.15 (107.43)26.84 (61.65)9.49 (23.89)23.06 (51.3)88.62 (219.7)
TotalN (mg/L)1.84 (2.22)1.77 (1.71)1.94 (1.86)2.19 (2.29)1.93 (1.94)2.12 (1.88)
TotalP (mg/L)0.15 (0.21)0.11 (0.11)0.06 (0.09)0.14 (0.21)0.12 (0.11)0.43 (0.57)
TotalSS (mg/L)24.32 (177.64)40.06 (328.12)15.05 (83.66)20.44 (195.64)24.93 (135.39)126.92 (840.42)
Publisher’s Note: MDPI stays neutral with regard to jurisdictional claims in published maps and institutional affiliations.

