Article

Development of a Design Catalog for Bonded Concrete Overlay Pavements Considering the Regional Characteristics of Korea

1
Department of Civil Engineering, Inha University, Incheon 22212, Korea
2
Jungbu Construction District Department, Korea Electric Power Corporation, Daejeon 35327, Korea
*
Author to whom correspondence should be addressed.
Sustainability 2021, 13(17), 9876; https://doi.org/10.3390/su13179876
Submission received: 5 August 2021 / Revised: 31 August 2021 / Accepted: 31 August 2021 / Published: 2 September 2021

Abstract

:
The design of overlay pavement in Korea, using the American empirical method, does not consider the unique Korean climate, pavement material, and traffic conditions. Therefore, in this study, a mechanistic–empirical design catalog for bonded concrete overlays (BCO) that are appropriate for Korean pavement conditions was developed. First, the thickness of the new pavement slab was determined through the Korean pavement design method, which uses a mechanistic–empirical design program according to the traffic volume of the region with the worst climatic conditions in Korea. Then, finite element analysis models of new jointed concrete and BCO pavements were developed to determine the BCO thickness by adjusting it until the stress–strength ratio of an existing slab of BCO pavement was equal to that of a new concrete pavement slab. By repeating this procedure, a design catalog was developed for the sustainable management of concrete pavement according to the traffic volume, elastic modulus, and thickness of the existing slab after milling. The appropriateness of the BCO thickness predicted by the design catalog was verified by comparing it with that predicted by other design methods.

1. Introduction

Concrete pavements constitute approximately 12.7% of the total road extension in Korea and approximately 62% of the expressways [1]. The age of most concrete pavement exceeds the design lifespan of 20 years. The amount of old concrete pavement exceeding the design lifespan has increased substantially—from 1150 km/lane in 2015 to 2605 km/lane in 2020 [2]. Accordingly, maintenance and repair costs have increased significantly [3].
Asphalt overlays have been primarily used in Korea for the large-scale repair of aged and deteriorated concrete pavement. However, defects such as reflection cracking and potholes occur frequently in asphalt overlays because their material characteristics differ significantly from those of the underlying concrete slabs that are bonded to the overlay [4]. Accordingly, additional expenses are required to repair the asphalt overlays. Consequently, concrete overlays with material characteristics similar to those of the existing concrete slabs have recently garnered attention in Korea for the reduction of repair and maintenance costs.
Concrete overlay can be categorized into bonded concrete overlay (BCO) and unbonded concrete overlay (UBCO) according to the method used to bond the overlay and the condition of the existing concrete pavement slab. BCO, which is directly bonded to the existing slab with a relatively good surface condition, is more widely used than UBCO because of its lower thickness [5]. Recently, BCO has been considered as a rehabilitation method for deteriorated concrete pavement in Korea [4].
Using the American Association of State Highway and Transportation Officials (AASHTO) method, the full thickness of a new pavement slab (Dfull) and effective thickness of the existing concrete slab (Deffective) with the same elastic modulus as that of the new pavement slab are determined by investigating the defects of the slab surface and assuming the remaining lifespan. The thickness of the BCO is subsequently determined by subtracting the effective thickness of the existing slab from the full thickness of the new pavement slab, as illustrated in Figure 1a [6]. Meanwhile, the minimum thickness of the BCO is obtained using the Portland Cement Association (PCA) method, in which the ratio of the maximum tensile stress ( σ t o ) to flexural strength ( f r o ) at the bottom of the existing slab of the BCO pavement does not exceed the ratio of the maximum tensile stress ( σ t n ) to flexural strength ( f r n ) at the bottom of the new pavement slab, as illustrated in Figure 1b.
However, the AASHTO and PCA methods established in other countries cannot effectively be used to design BCO thickness in Korea, where the traffic, climate, and material conditions are different. Therefore, a Korean design catalog for BCO thickness in old and deteriorated jointed concrete pavements was developed in this study, considering the Korean climate, pavement material, and highway traffic conditions. These unique conditions were considered in the design of the target slab thickness of newly constructed concrete pavement using the mechanistic–empirical Korean pavement design program [7].
The specific procedure is as follows. First, the thickness of a new pavement slab was determined using the Korean pavement design method [7], according to the traffic volume of the region with the worst climatic conditions in Korea. Finite element analysis (FEA) models of a new jointed concrete pavement and a BCO pavement were developed to obtain the minimum thickness of the BCO, for which the stress–strength ratio at the bottom of the existing BCO pavement slab did not exceed that at the bottom of the new pavement slab. The design catalog was then developed by repetitively implementing the procedure according to the traffic volume, elastic modulus, and thickness of the existing slab after milling. The developed BCO design catalog was compared with the PCA design chart to verify the results.

2. Determination of New Pavement Slab Thickness Data Collection

The BCO pavement needs to deliver the same performance as that of new jointed concrete pavement. The required slab thickness for new pavement was determined using the Korean pavement design method—a mechanistic–empirical design method—according to the traffic volume of 67 regions with the worst climatic conditions in Korea. This was the first step toward the development of a design catalog for BCO pavements. The Korean pavement design program was developed as an output of the Korean Pavement Research Program [7], which was conducted between 2000 and 2011. The new jointed concrete pavement was designed according to the procedure shown in Figure 2. The unique Korean climate, material, and traffic conditions were used as the key input variables of the design program.
First, the traffic volume range, as input to the design program, was determined. The Korean pavement design program used the annual average daily traffic (AADT) as the traffic volume variable, whereas the PCA method used the average daily truck traffic. The design was classified into levels 1, 2, and 3 according to the AADT passing through the design section. The directional and lane distribution factors were multiplied by the AADT to separately calculate the AADT of each type of vehicle driving on a lane in a given direction [8].
Table 1 details the criteria for the design level according to the road type and traffic volume employed in the road pavement structure design method [9]. A level 1 design can be applied to expressways with an AADT exceeding 150,000 vehicles/day. However, the level 1 design was not applied to any expressways. A level 2 design is applied to expressways with AADT below 150,000 vehicles/day. The Korean pavement design method designs only expressways with an AADT below 150,000 vehicles/day, regardless of the design level. The same slab thickness was obtained in all cases with an AADT below 30,000 vehicles/day for the test design using the Korean pavement design method. Therefore, the initial range of the AADT to be used the Korean pavement design method program was determined to be 30,000 to 150,000 vehicles/day.
In a level 2 design, the ranges and default values of the input parameters, such as the material properties and discontinuities, were provided in the design program of the Korean pavement design method. The default values of the design program were used to determine the slab thickness of the new jointed concrete pavement in this study. Instead of the default value for the elastic modulus of the BCO, the value suggested by the PCA design method was input to the design program. In terms of climatic conditions, the weather data of 67 regions provided in the Korean pavement design method were used as the input values of the design program. Figure 3 shows the locations of the weather stations in the 67 regions.
Figure 4 illustrates the slab thickness distribution of the new pavement designed according to the climatic conditions and traffic volumes of the 67 regions for a lifespan of 20 years. The slab thickness was designed to be 200 mm for an AADT of 30,000 vehicles/day, regardless of regional climatic conditions. However, a variation of 10 mm in slab thickness occurred for an AADT of 60,000 vehicles/day due to differences in the regional climatic conditions. In addition, a variation of 30 mm occurred for an AADT from 90,000 to 150,000 vehicles/day. For a conservative design, the largest thickness according to the climatic conditions was used as the design slab thickness for a particular traffic volume.
The AADT of an entire expressway section, primarily composed of jointed concrete pavement, was investigated using the 2018 Yearbook of Road Traffic Volume [10] to verify the actual traffic volume range. The average AADT of the sections was estimated to be 54,581 vehicles/day, with the AADT of the southern section of the Seoul ring expressway (Route 100) being the largest, with 183,664 vehicles/day. Therefore, as shown in Figure 5, the relationship between the AADT and slab thickness of the new pavement, which was initially determined for the AADT from 30,000 to 150,000 vehicles/day, was extended to an AADT of 200,000 vehicles/day. Consequently, slab thicknesses of 320 and 330 mm were predicted for AADTs of 180,000 and 200,000 vehicles/day, respectively.

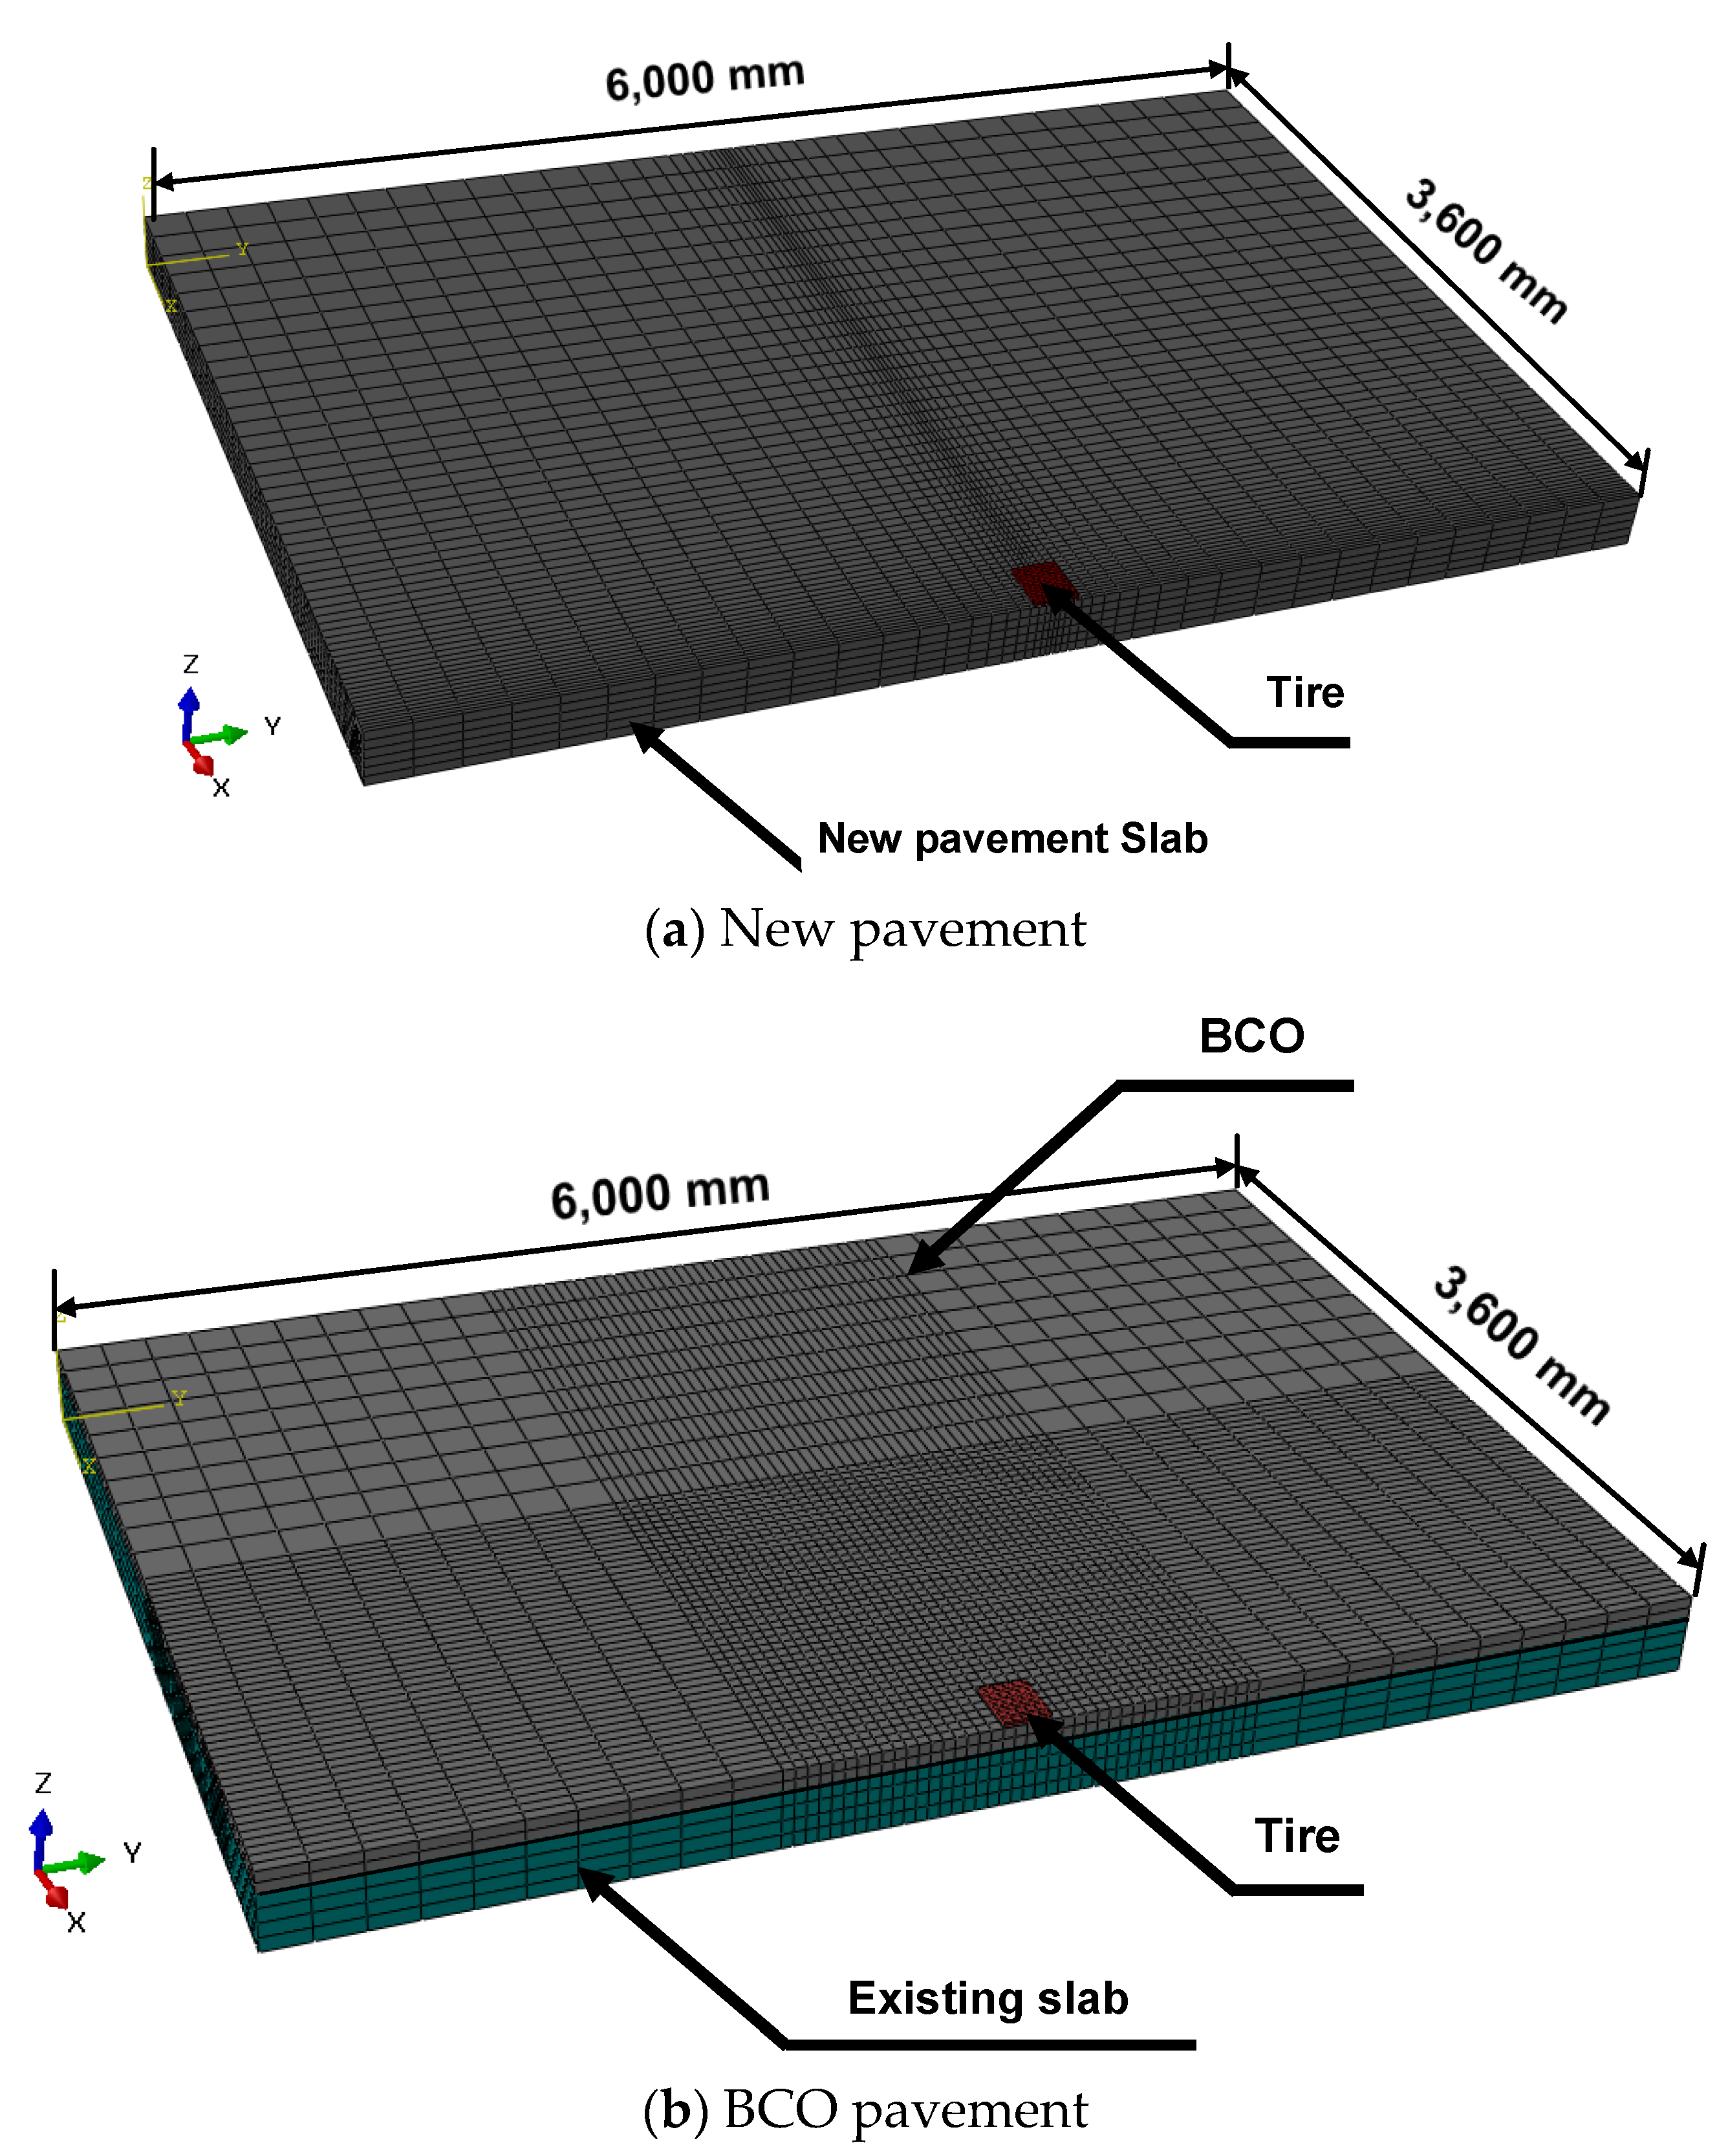
3. Development of a Finite Element Analysis Model

Finite element (FE) models were developed to simulate the newly jointed concrete and BCO pavements using an FEA program, ABAQUS, as illustrated in Figure 6. The structural shape of the pavements conformed to the drawings of the jointed concrete pavement included in standard drawings for expressway construction [11]. A joint spacing of 6 m, which is the most frequently used in Korea, was used in the modeling [12]. A tire loading of 80 kN was applied on the middle edge of the longitudinal joint to obtain the maximum tensile stress developed at the bottom of the slab immediately below the tire loading [13].
Generally, C3D8, C3D8R, C3D8I, and C3D20R are used as hexahedral element types in a three-dimensional FEA using ABAQUS. Among them, C3D8 and C3D8R, which contain eight nodes, require relatively short analysis times; however, their analysis results are highly sensitive to mesh density [14,15]. Meanwhile, C3D20R, which contains 20 nodes, requires a relatively long analysis time, but its analysis results are less affected by the mesh density.
Kim et al. [16] and Park et al. [17] developed FE models using an incompatible element (C3D8I) with eight nodes to calculate the stress and strain of an airport concrete pavement. The FEA took a relatively short time, and the results were less affected by the mesh density. In this study, the mesh density was quadrupled near the position of the maximum tensile stress to increase the accuracy of the FEA results. The BCO was completely bonded to the existing pavement slab. Therefore, the interaction between the BCO and the existing slab was defined as the contact condition. In addition, separation was not allowed at the interface, considering the complete bonding between the layers. Springs were connected to each node at the bottom of the slab to express the bearing capacity of the pavement layers below the slab.

3.1. Determination of Input Values of the Finite Element Analysis

An elastic modulus of 35 GPa, which was used in the PCA method as a material property of the BCO, was also used for both the new concrete slab and BCO in the FEA. The PCA overlay design method classified the pavement conditions into three levels according to the degree of deterioration of the existing slab and suggested the flexural strength for each level. The flexural strength range of the existing slab from 2.9 to 4.0 MPa, suggested by the PCA according to the design level, can be converted into the corresponding elastic modulus using Equation (1) [18]. Consequently, the elastic modulus of the existing slab—from 20 to 28 GPa, calculated using Equation (1)—was used in the FEA.
E c = D × S c ,
where D is a constant (=7000) and Sc is the flexural strength of the existing concrete pavement slab.
The composite modulus of the subgrade reaction, which is the bearing capacity of the pavement layers below the slab of 0.03 MPa/mm, predicted by the thickness and elastic modulus of the pavement layers below the slab, was used as another input value for the FEA (MOLTMA, 2010). A tire loading was applied on the middle edge of the longitudinal joint, considering the edge loading theory suggested by Westergaard [13], to induce the maximum tensile stress at the slab bottom of the loading position. An equivalent single-wheel load of 80 kN was applied as the tire loading value.
The slab thickness range of the new pavement, between 200 and 330 mm (Figure 5), determined by the Korean pavement design method, was used as the range for the new pavement slab thickness in the FEA model. Typically, in Korea, a BCO with a thickness of 50 mm is constructed on an existing 50 mm thick slab after milling. The BCO pavement standard specification stipulates that the existing slab must be milled 30–70 mm deep according to the type of milling machine [19]. Therefore, in this study, the thickness of the existing slab after milling was determined to be 130–300 mm, considering the new pavement slab thickness of 200–330 mm and a milling depth of 30–70 mm.
Design cases of 80–140 mm thick BCO constructed on deteriorated jointed concrete pavement slabs exist in the US [20]. Park et al. [21] suggested that the BCO must be at least 80 mm thick to ensure satisfactory performance. In addition, Huang [22] suggested a maximum BCO thickness of 127 mm. Therefore, in this study, the range of BCO thickness used was determined to be 50–150 mm after comprehensively considering previous studies and Korean construction cases.

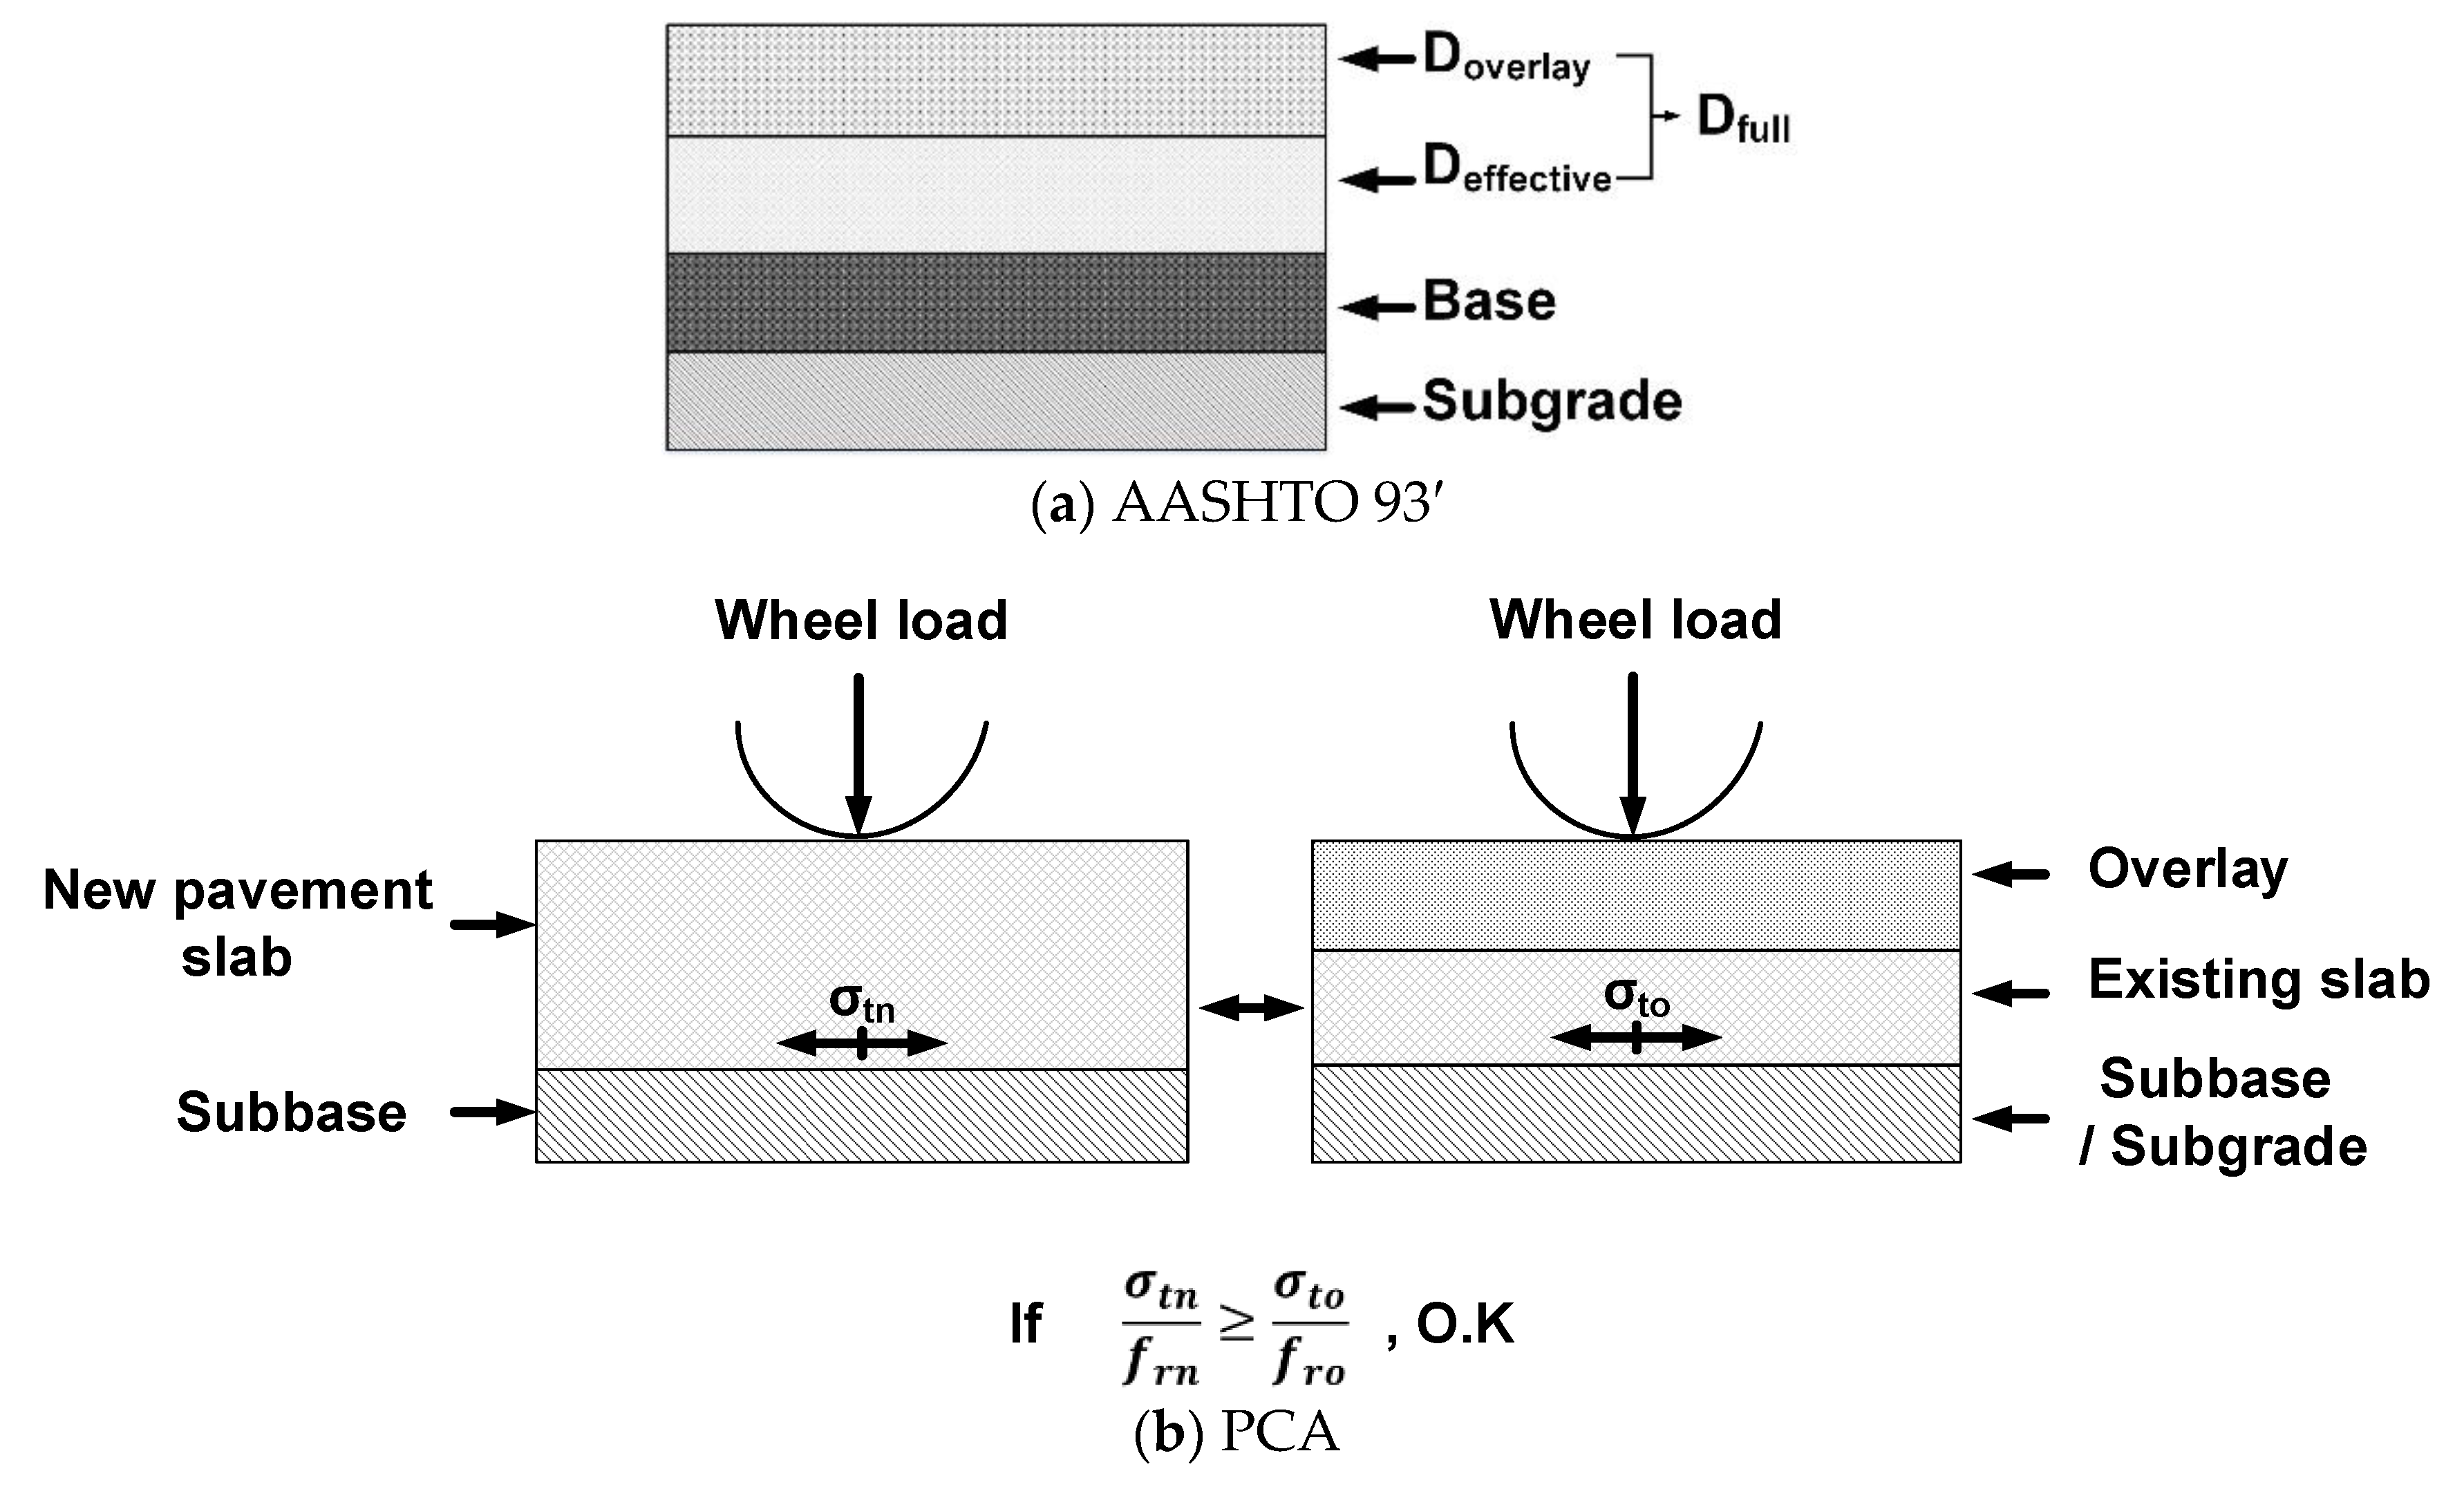
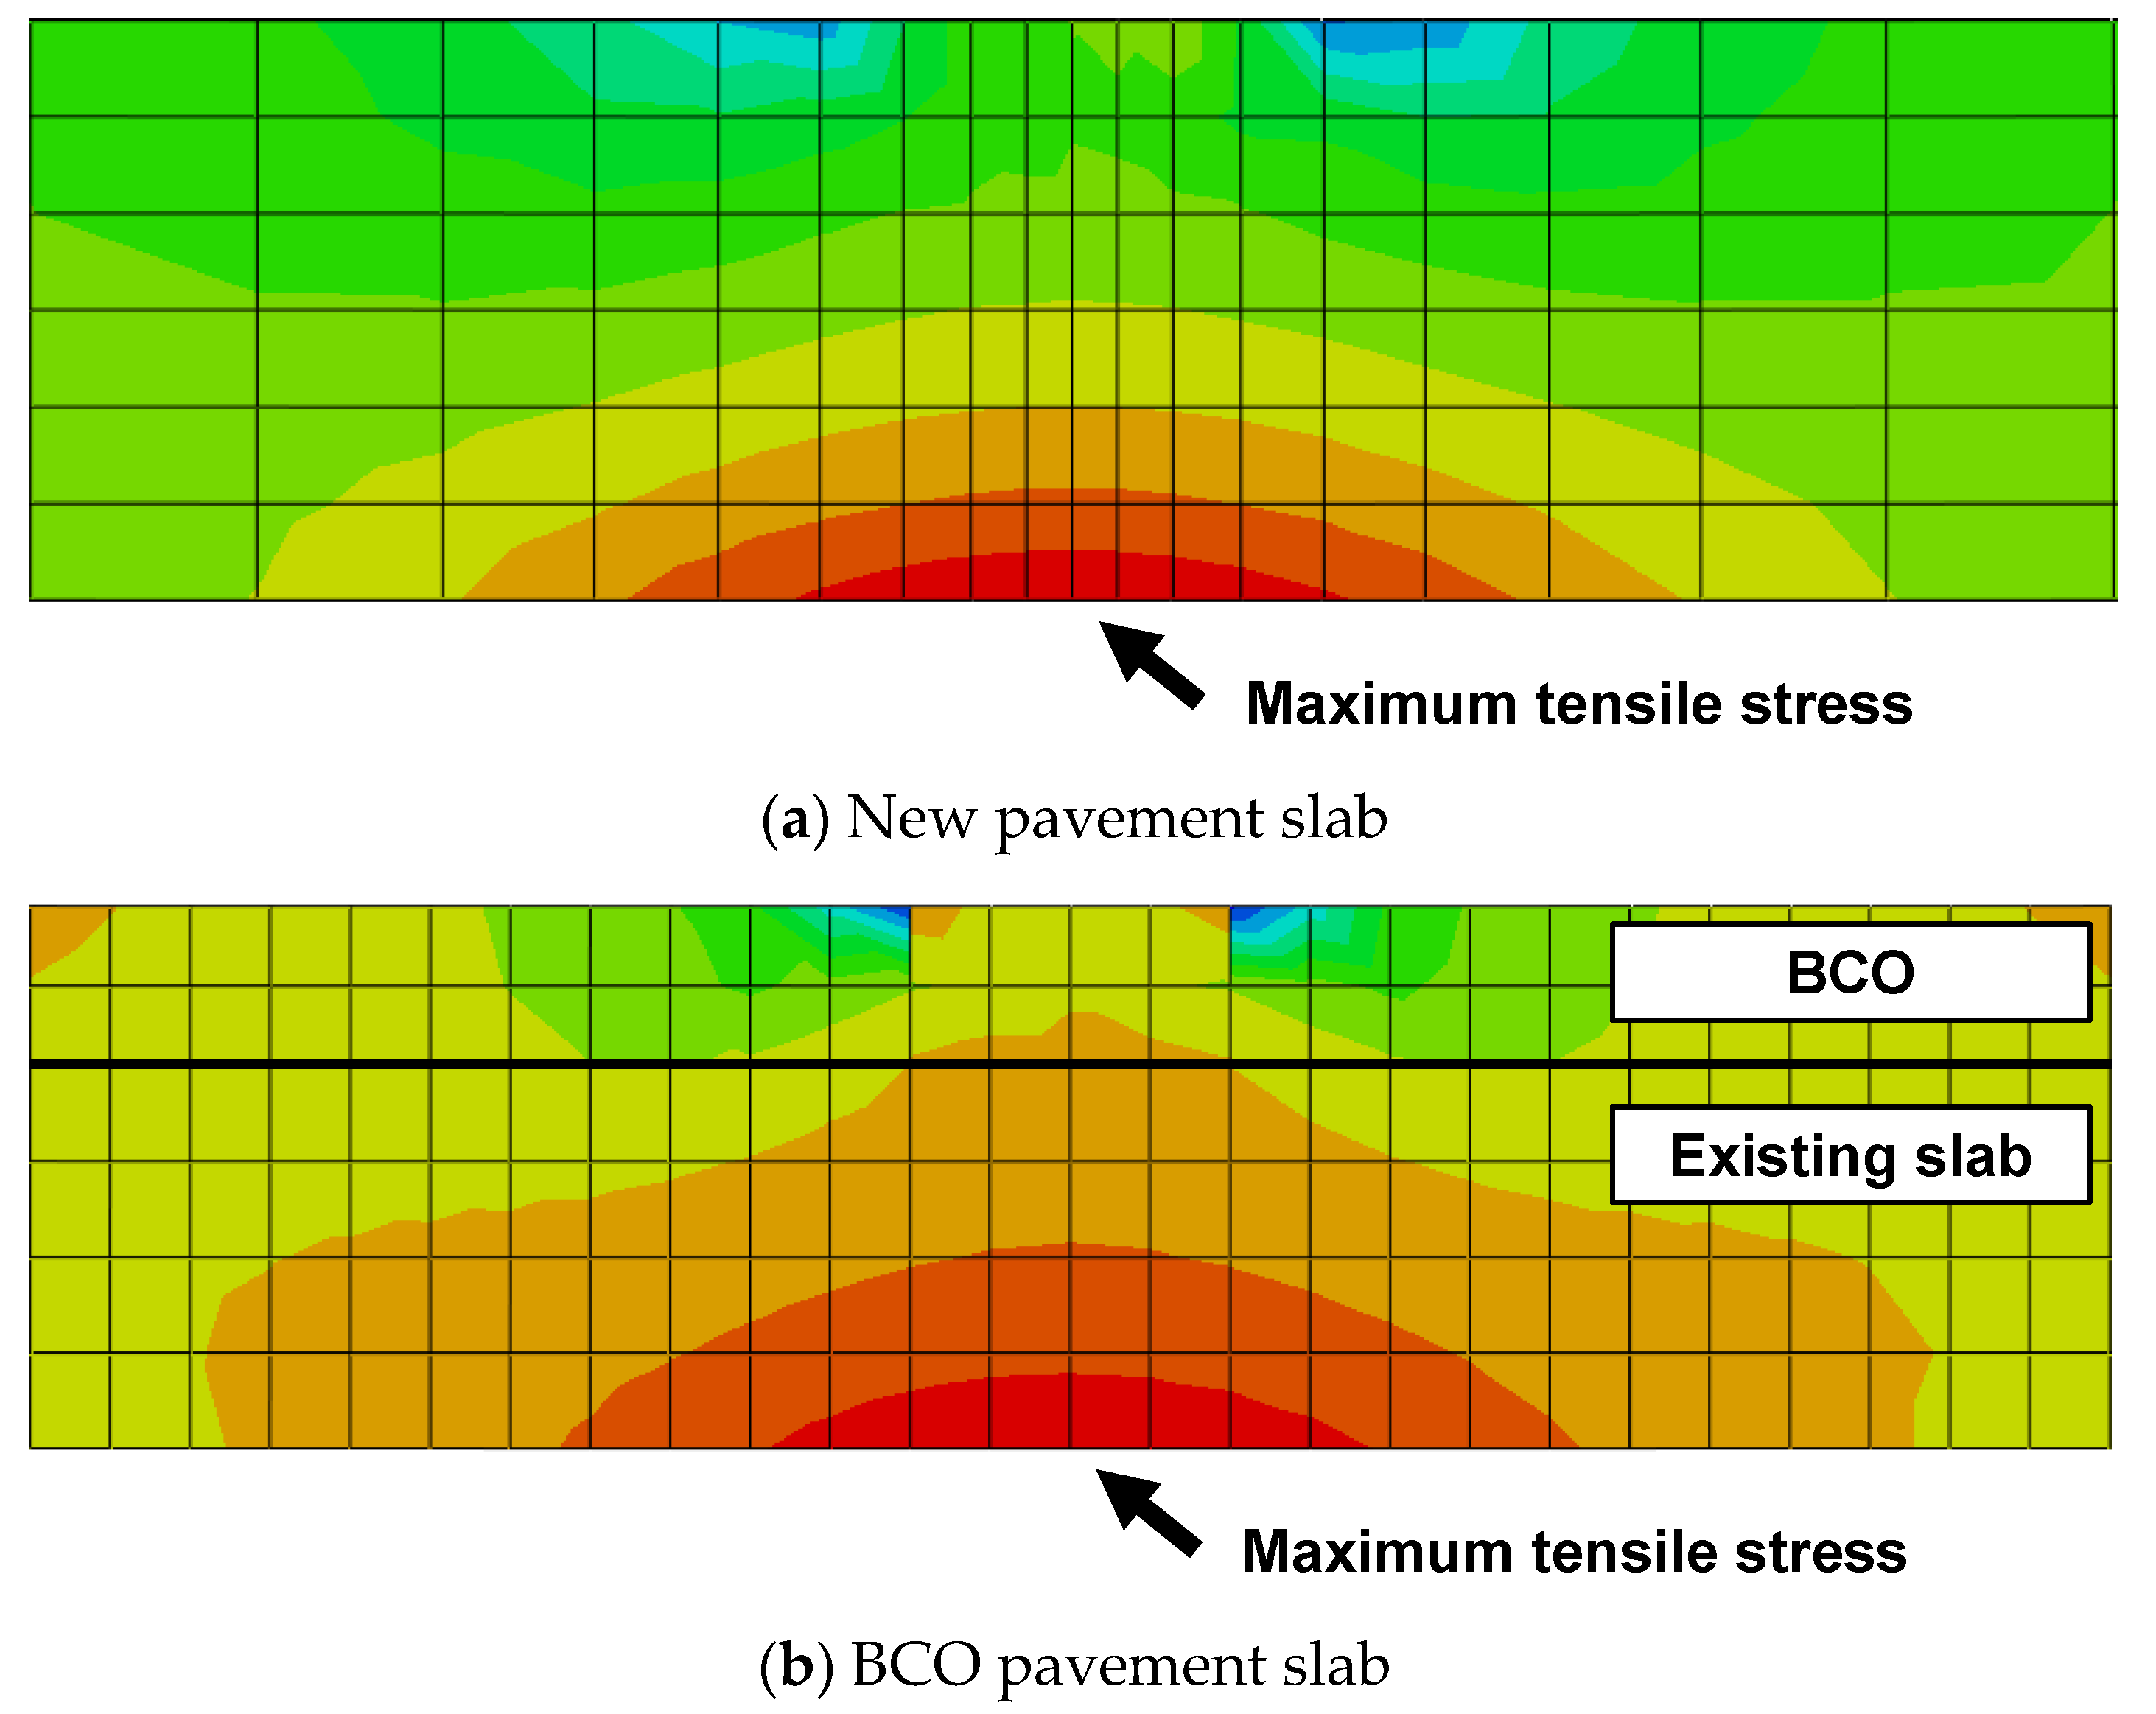
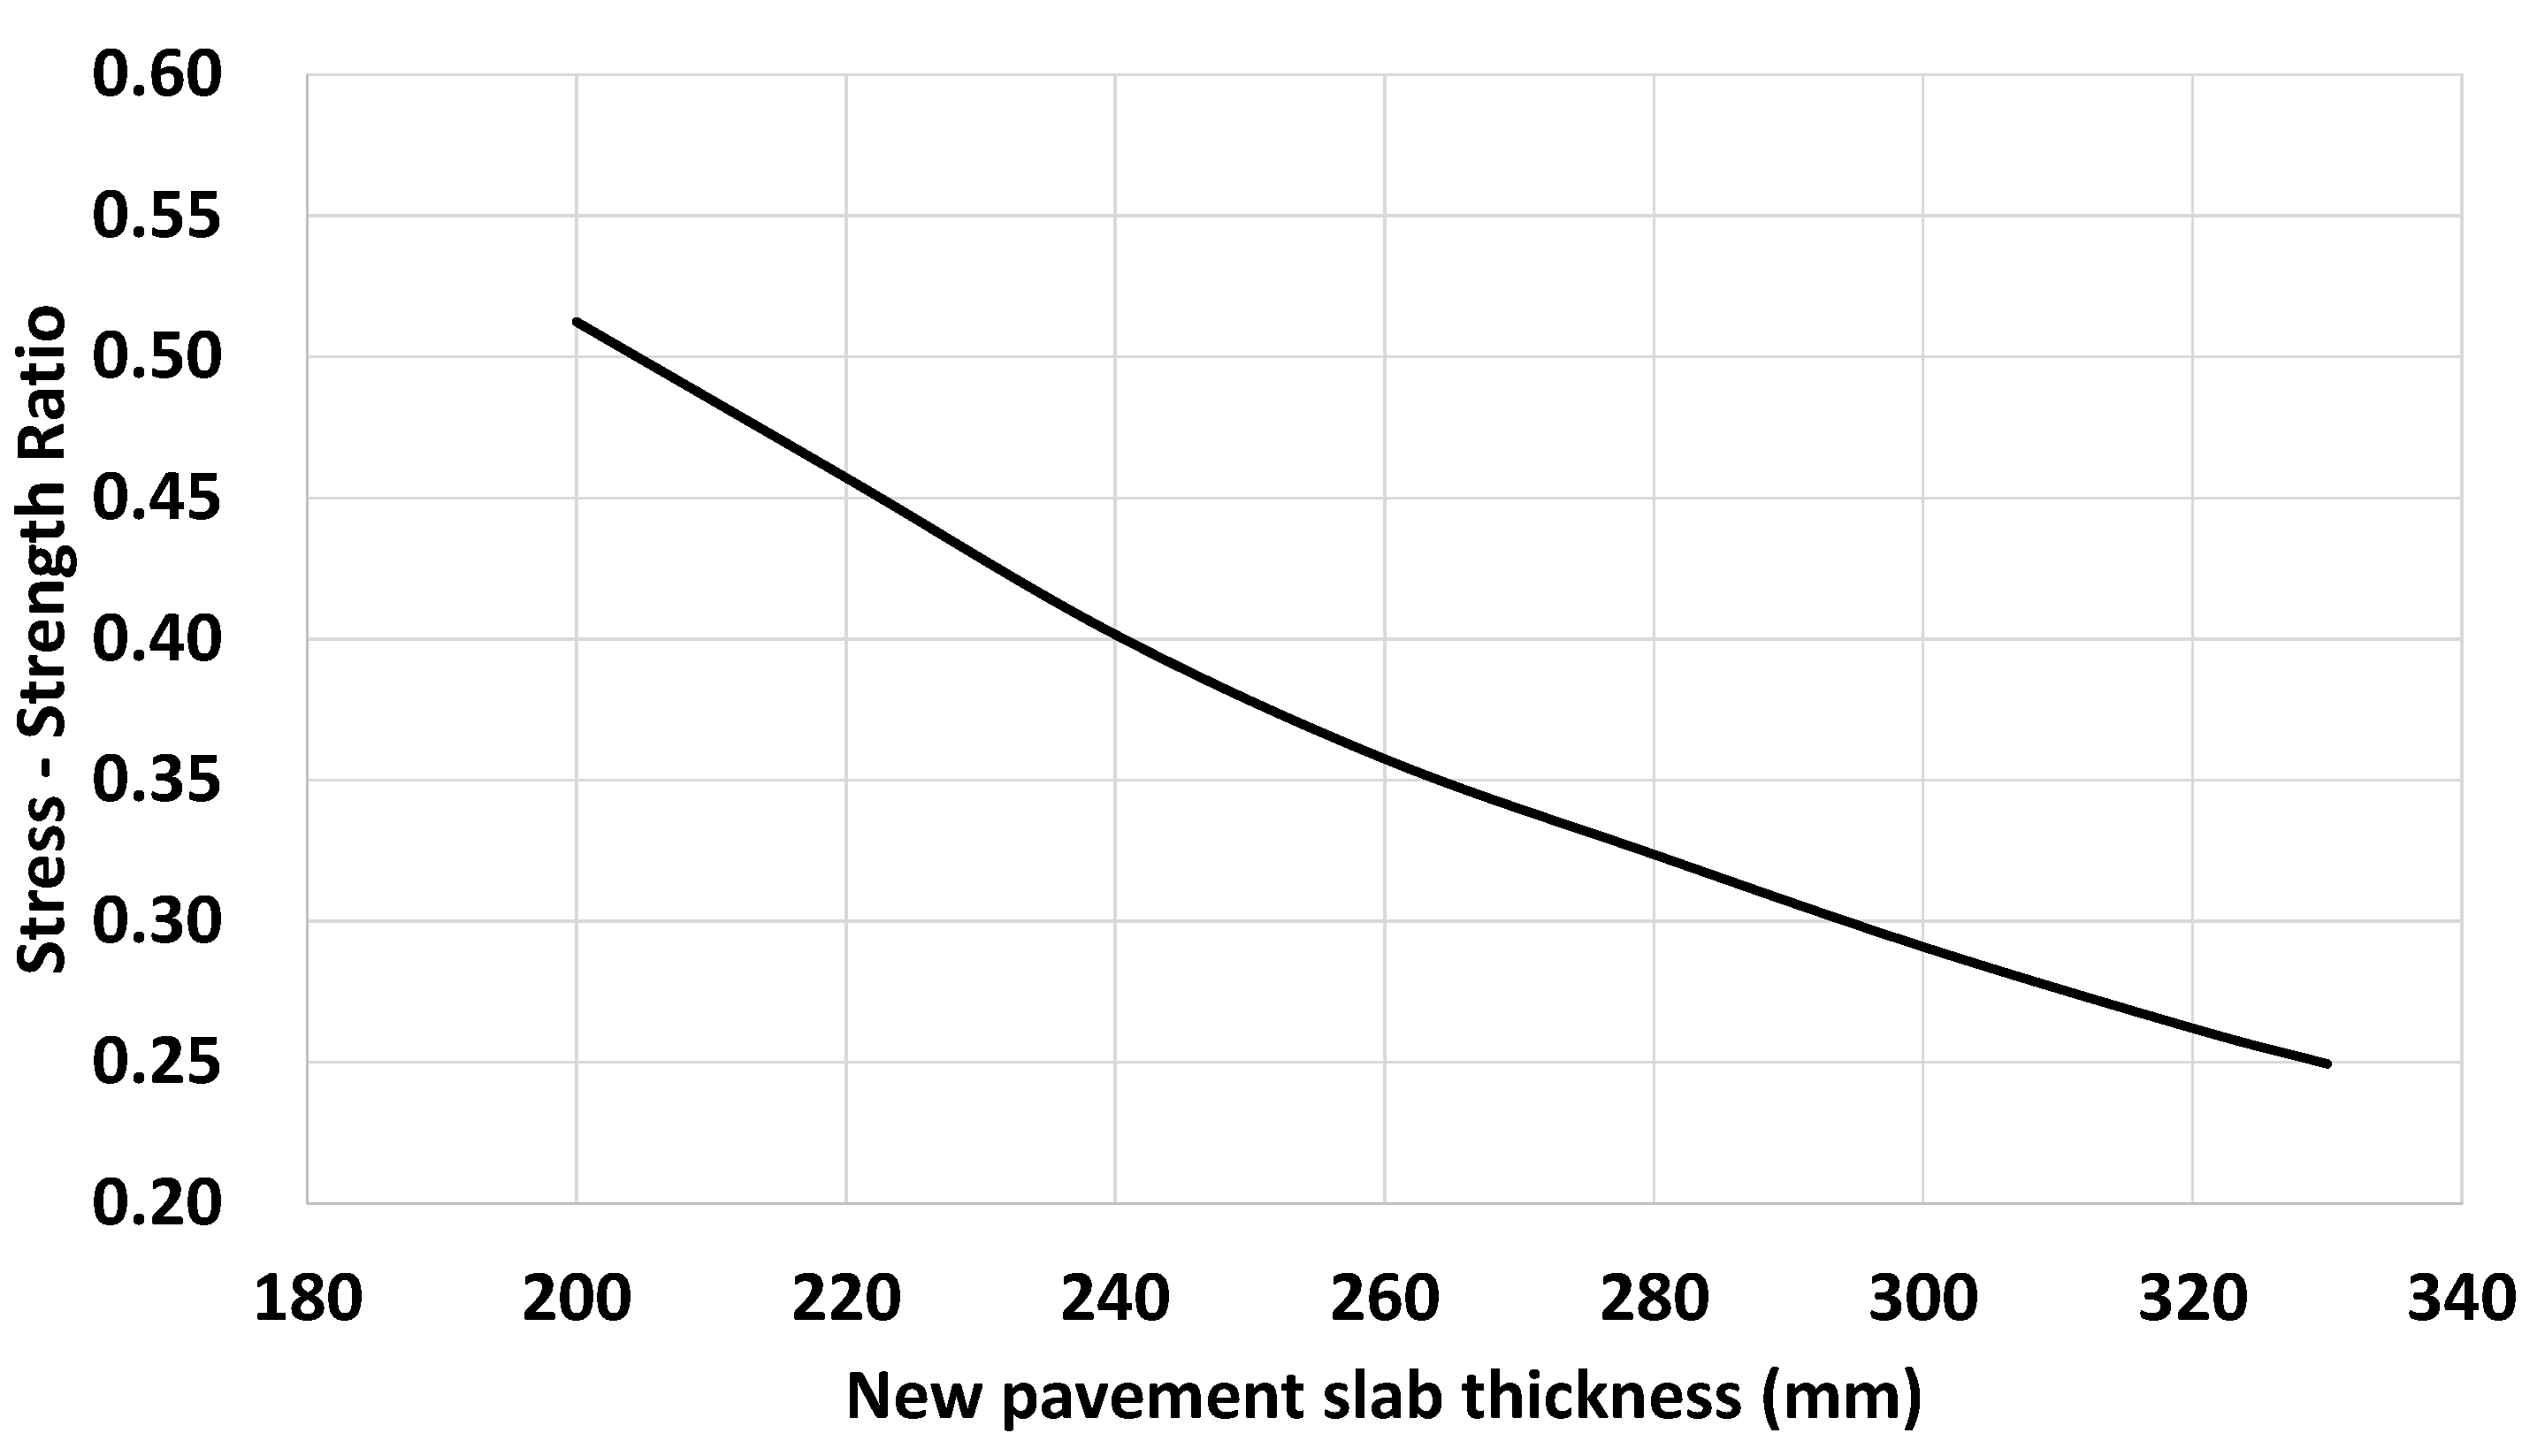
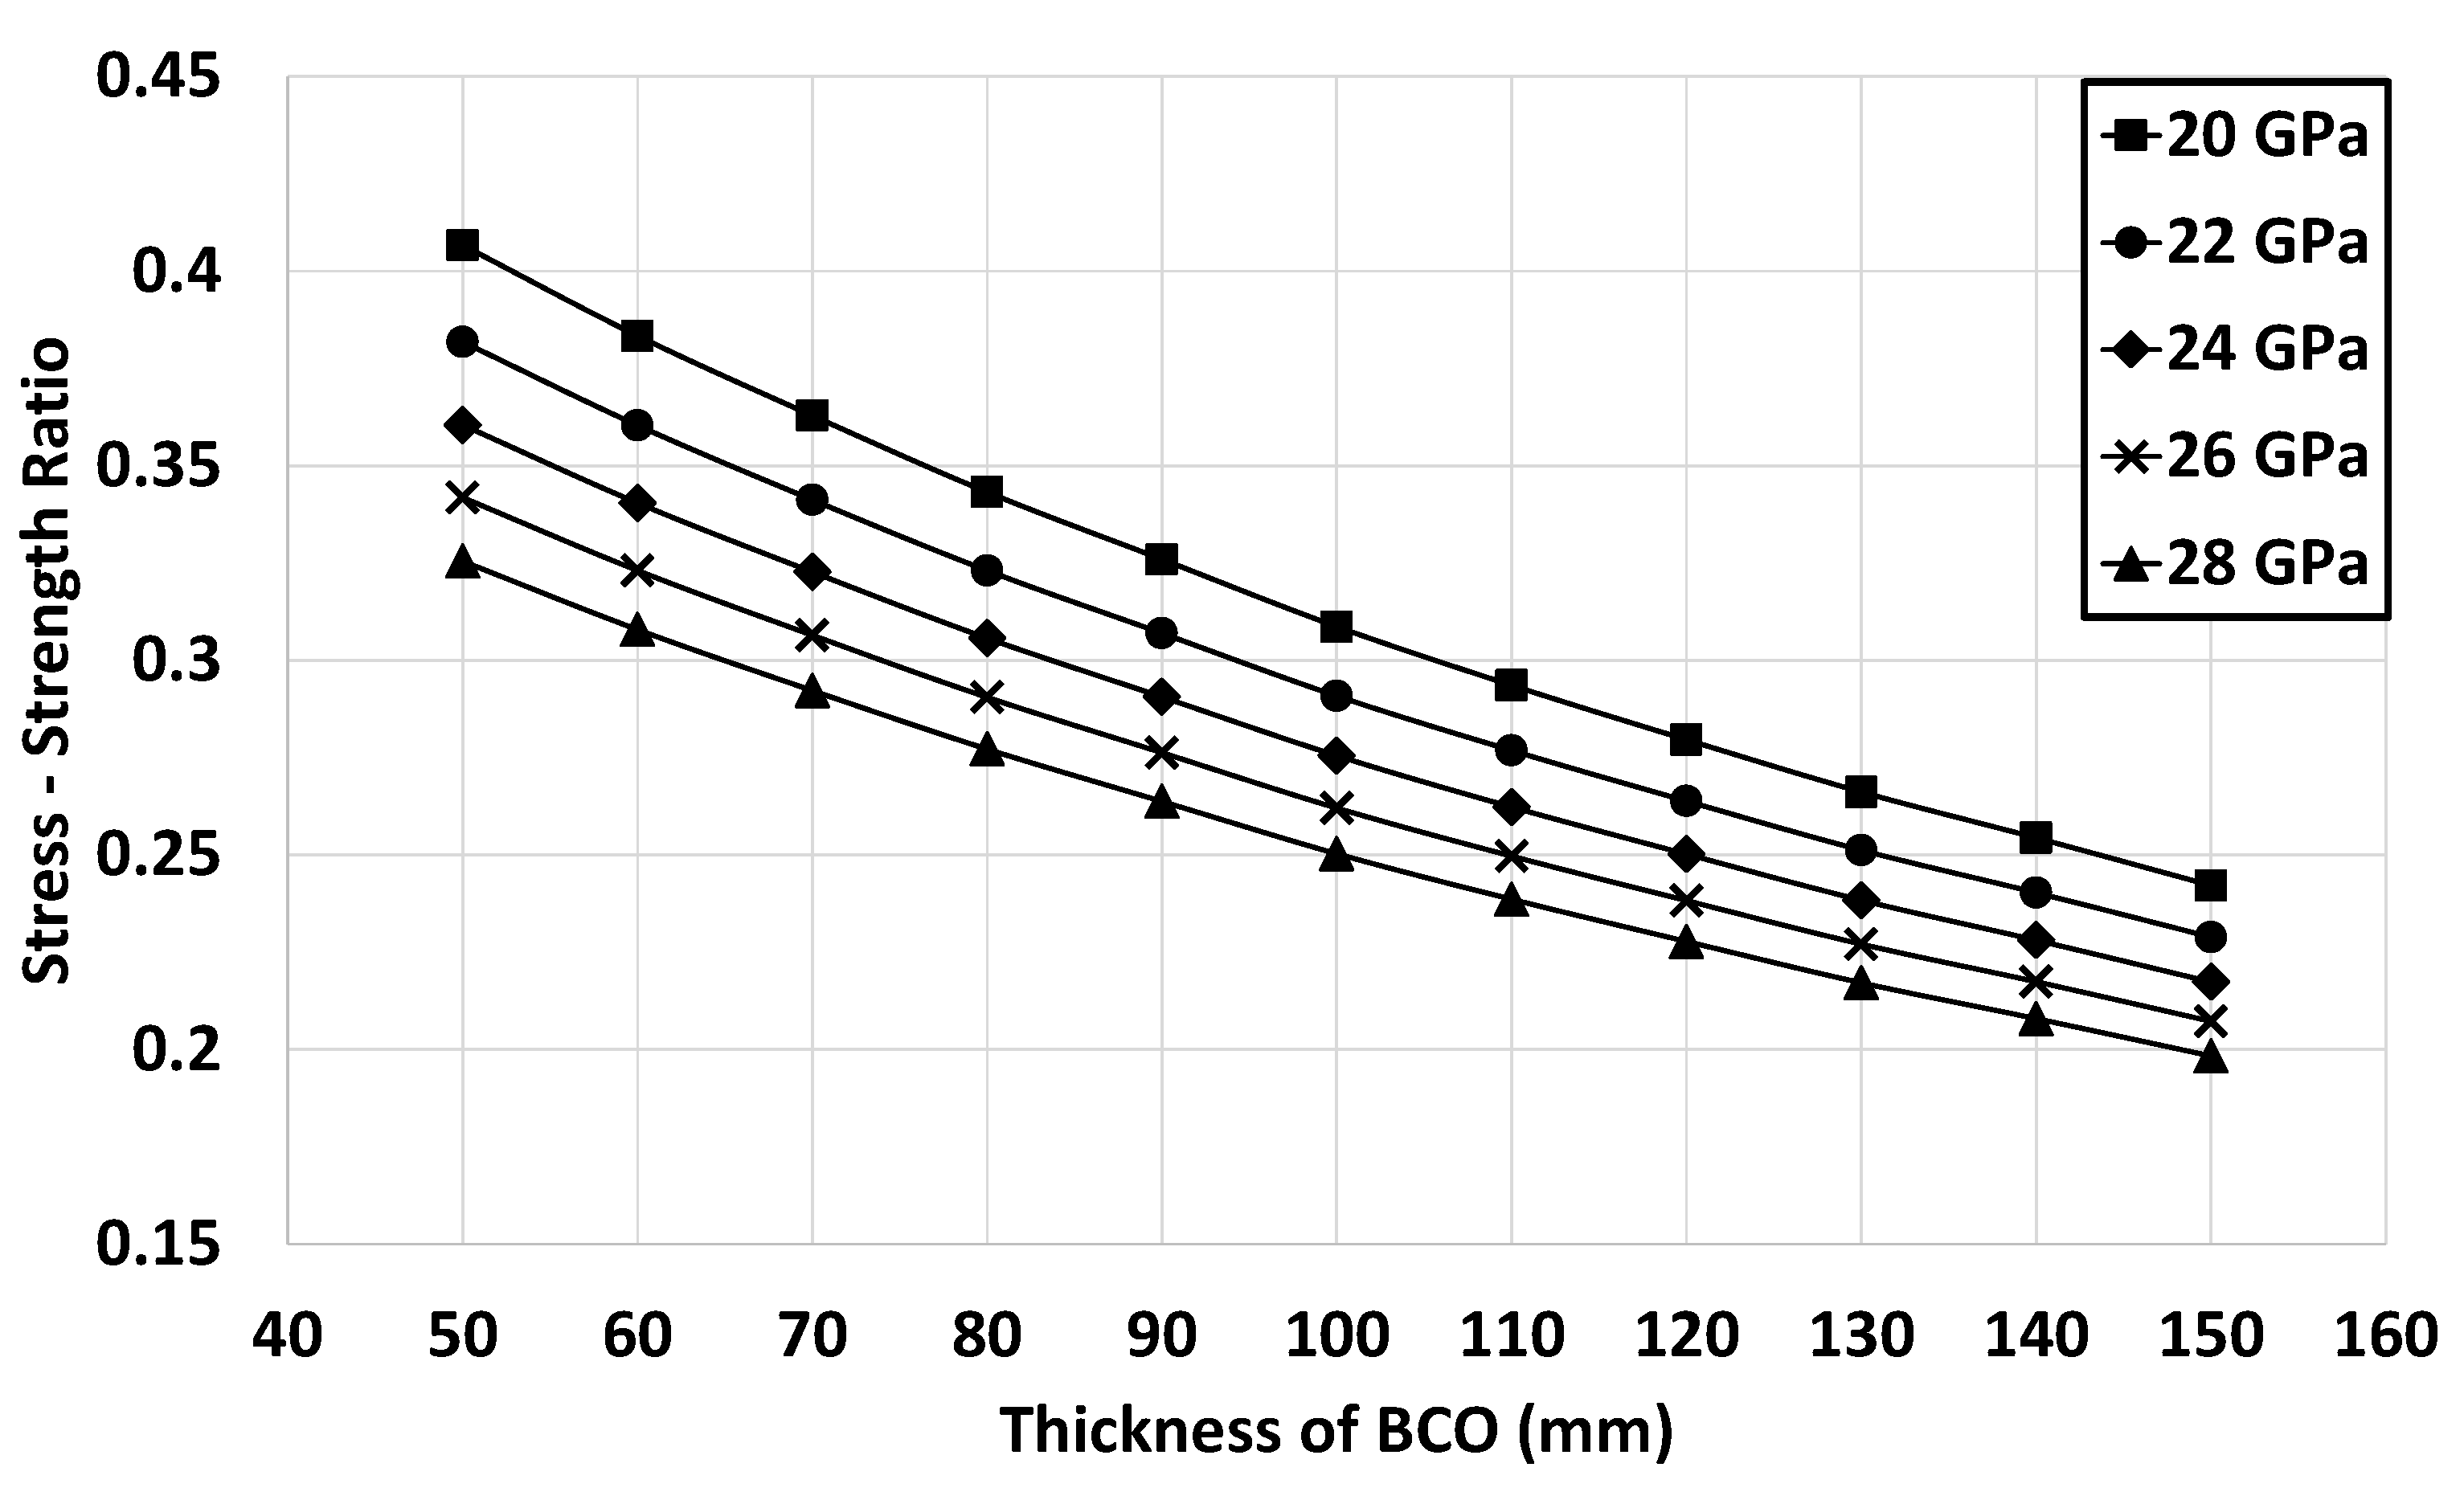
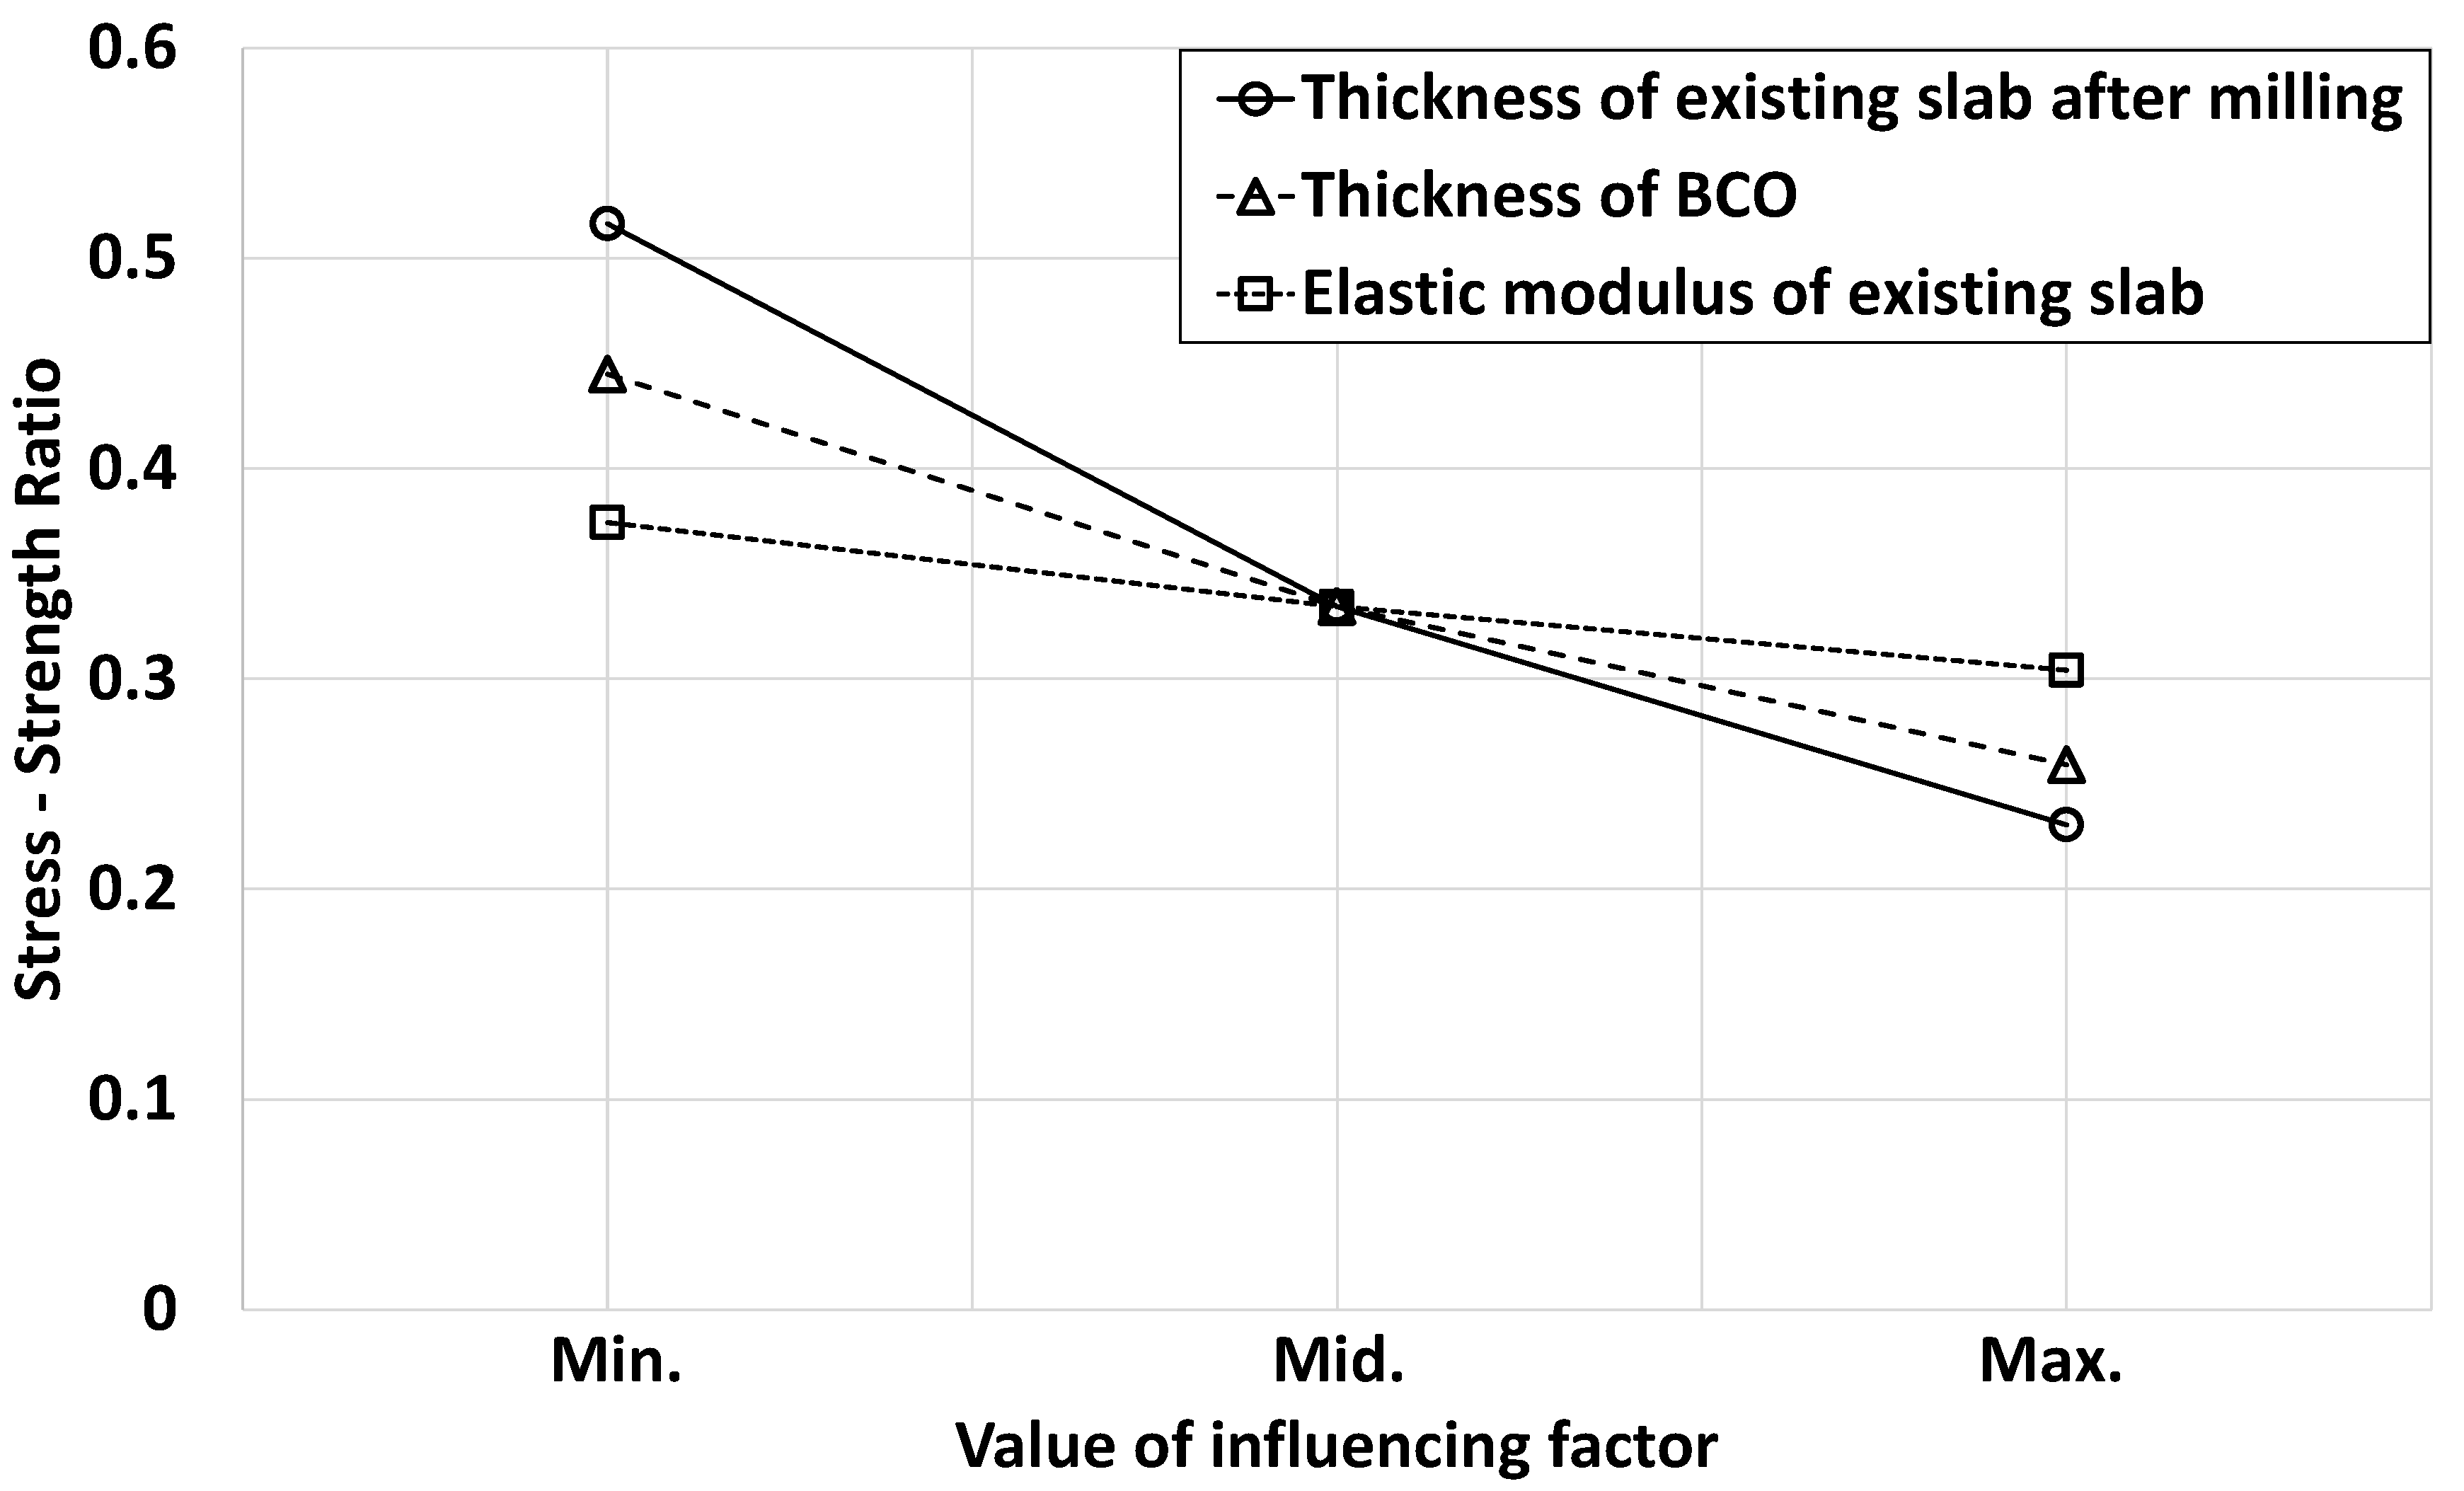
3.2. Calculation of the Stress–Strength Ratio

The maximum tensile stress at the bottom of the slab, immediately below the tire loading applied on the middle edge of the longitudinal joint, can be obtained using the edge loading equation (Equation (2)) [13]:
σ e = 3 ( 1 + μ ) ( 3 + μ ) π h 2 [ ln ( E c   h 3 100 k a 4 ) + 1.84 4 μ 3 + ( 1 μ ) 2 + 1.18 ( 1 + 2 μ ) a l ] ,
where σe is the Westergaard edge loading stress (MPa), μ is the Poisson ratio of the concrete slab, Ec is the elastic modulus of the concrete slab (MPa), a is the radius of the contact area (mm), and l is the radius of the relative stiffness (mm).
Similar to Westergaard’s theory, the maximum tensile stress developed at the slab bottom was obtained by applying a tire loading on the middle edge of the longitudinal joint in both FEA models. The stress distributed in the new pavement slab was compared to that distributed in the BCO pavement slab, as illustrated in Figure 7. The tensile stress developed near the bottom of the existing slab of the BCO pavement with a smaller elastic modulus, and it was distributed more widely than that which developed near the bottom of the new pavement slab.
Typically, the maximum tensile stress developed at the bottom of the slab decreased as the slab thickness increased. For the BCO pavement, however, the maximum tensile stress that developed at the bottom of the existing slab could increase when the elastic modulus of the existing slab was significantly small, even though the full thickness of the BCO pavement slab increased. Therefore, the BCO thickness cannot be designed by merely comparing the maximum tensile stress of the existing slab of the BCO pavement with that of the new pavement slab.
In this study, the stress–strength ratios of the new pavement slab and the existing slab of the BCO pavement were compared, as illustrated in Figure 1b, to determine the BCO thickness instead of comparing their maximum tensile stresses [22]. The stress–strength ratio was calculated using the maximum tensile stress obtained by an FEA; the flexural strength for the existing slab of BCO pavement was between 2.9 and 4.0 MPa, whereas it was 5.0 MPa for both the new pavement slab and the BCO. Using Equation (1), the flexural strength was converted from the elastic modulus of 35 GPa, as suggested by the PCA for both the new pavement slab and the BCO. The stress–strength ratio of the new pavement slab with a thickness of 200–300 mm ranged from 0.512 to 0.250, as illustrated in Figure 8.
Figure 9 presents the stress–strength ratios at the bottom of the existing slab of the BCO pavement according to the elastic modulus and thickness of the existing slab after milling (e.g., for a BCO thickness of 100 mm). The stress–strength ratios of the existing slab decreased with an increase in the elastic modulus and thickness after milling. Furthermore, the stress–strength ratios decreased as the elastic modulus increased because the increased elastic modulus caused a greater increase in strength than in stress. When the slab thickness of the new pavement was designed to be 200 mm, the stress–strength ratio of the slab was 0.512, as shown in Figure 8. In this case, the stress–strength ratio of the existing slab of the BCO pavement exceeded that of the new pavement slab, as illustrated in Figure 9. This result did not satisfy the condition in Figure 1b, if the BCO thickness was designed to be 100 mm using an elastic modulus less than 24 GPa and a thickness of the existing slab less than 160 mm after milling. In this case, the stress–strength ratio of the existing slab of the BCO pavement must be decreased below that of the new pavement by increasing the BCO thickness.
Figure 10 presents the stress–strength ratios at the bottom of the existing slab of the BCO pavement according to the elastic modulus of the existing slab and the BCO thickness (e.g., for an existing slab with a thickness of 260 mm after milling). The stress–strength ratio at the bottom of the existing slab decreased as the elastic modulus of the existing slab and the BCO thickness increased. When the slab thickness of the new pavement was 330 mm, the stress–strength ratio of the slab was 0.25, as shown in Figure 8. In this case, the stress–strength ratio of the existing slab of the BCO pavement occasionally exceeded that of the new pavement slab according to the elastic modulus of the existing slab, as shown in Figure 10, which did not satisfy the condition presented in Figure 1b, if the BCO was designed with a thickness of less than 100 mm. In this case, the stress–strength ratio of the existing slab of the BCO pavement must be decreased below that of the new pavement by increasing the thickness of the BCO or the existing slab after milling.
The sensitivity of the stress-strength ratio to the thickness of the existing slab after milling, the thickness of the BCO, and the elastic modulus of the existing slab were analyzed. The minimum, medium, and maximum values of the influencing factors that were already used in the FEA are listed in Table 2. The stress–strength ratio was the most affected by the thickness of the existing slab after milling, showing a decrease of 0.286 when changing the influencing factor from its minimum to maximum value, as shown in Figure 11. Varying the thickness of the BCO and elastic modulus of the existing slab decreased the stress–strength ratio by 0.186 and 0.070, respectively.

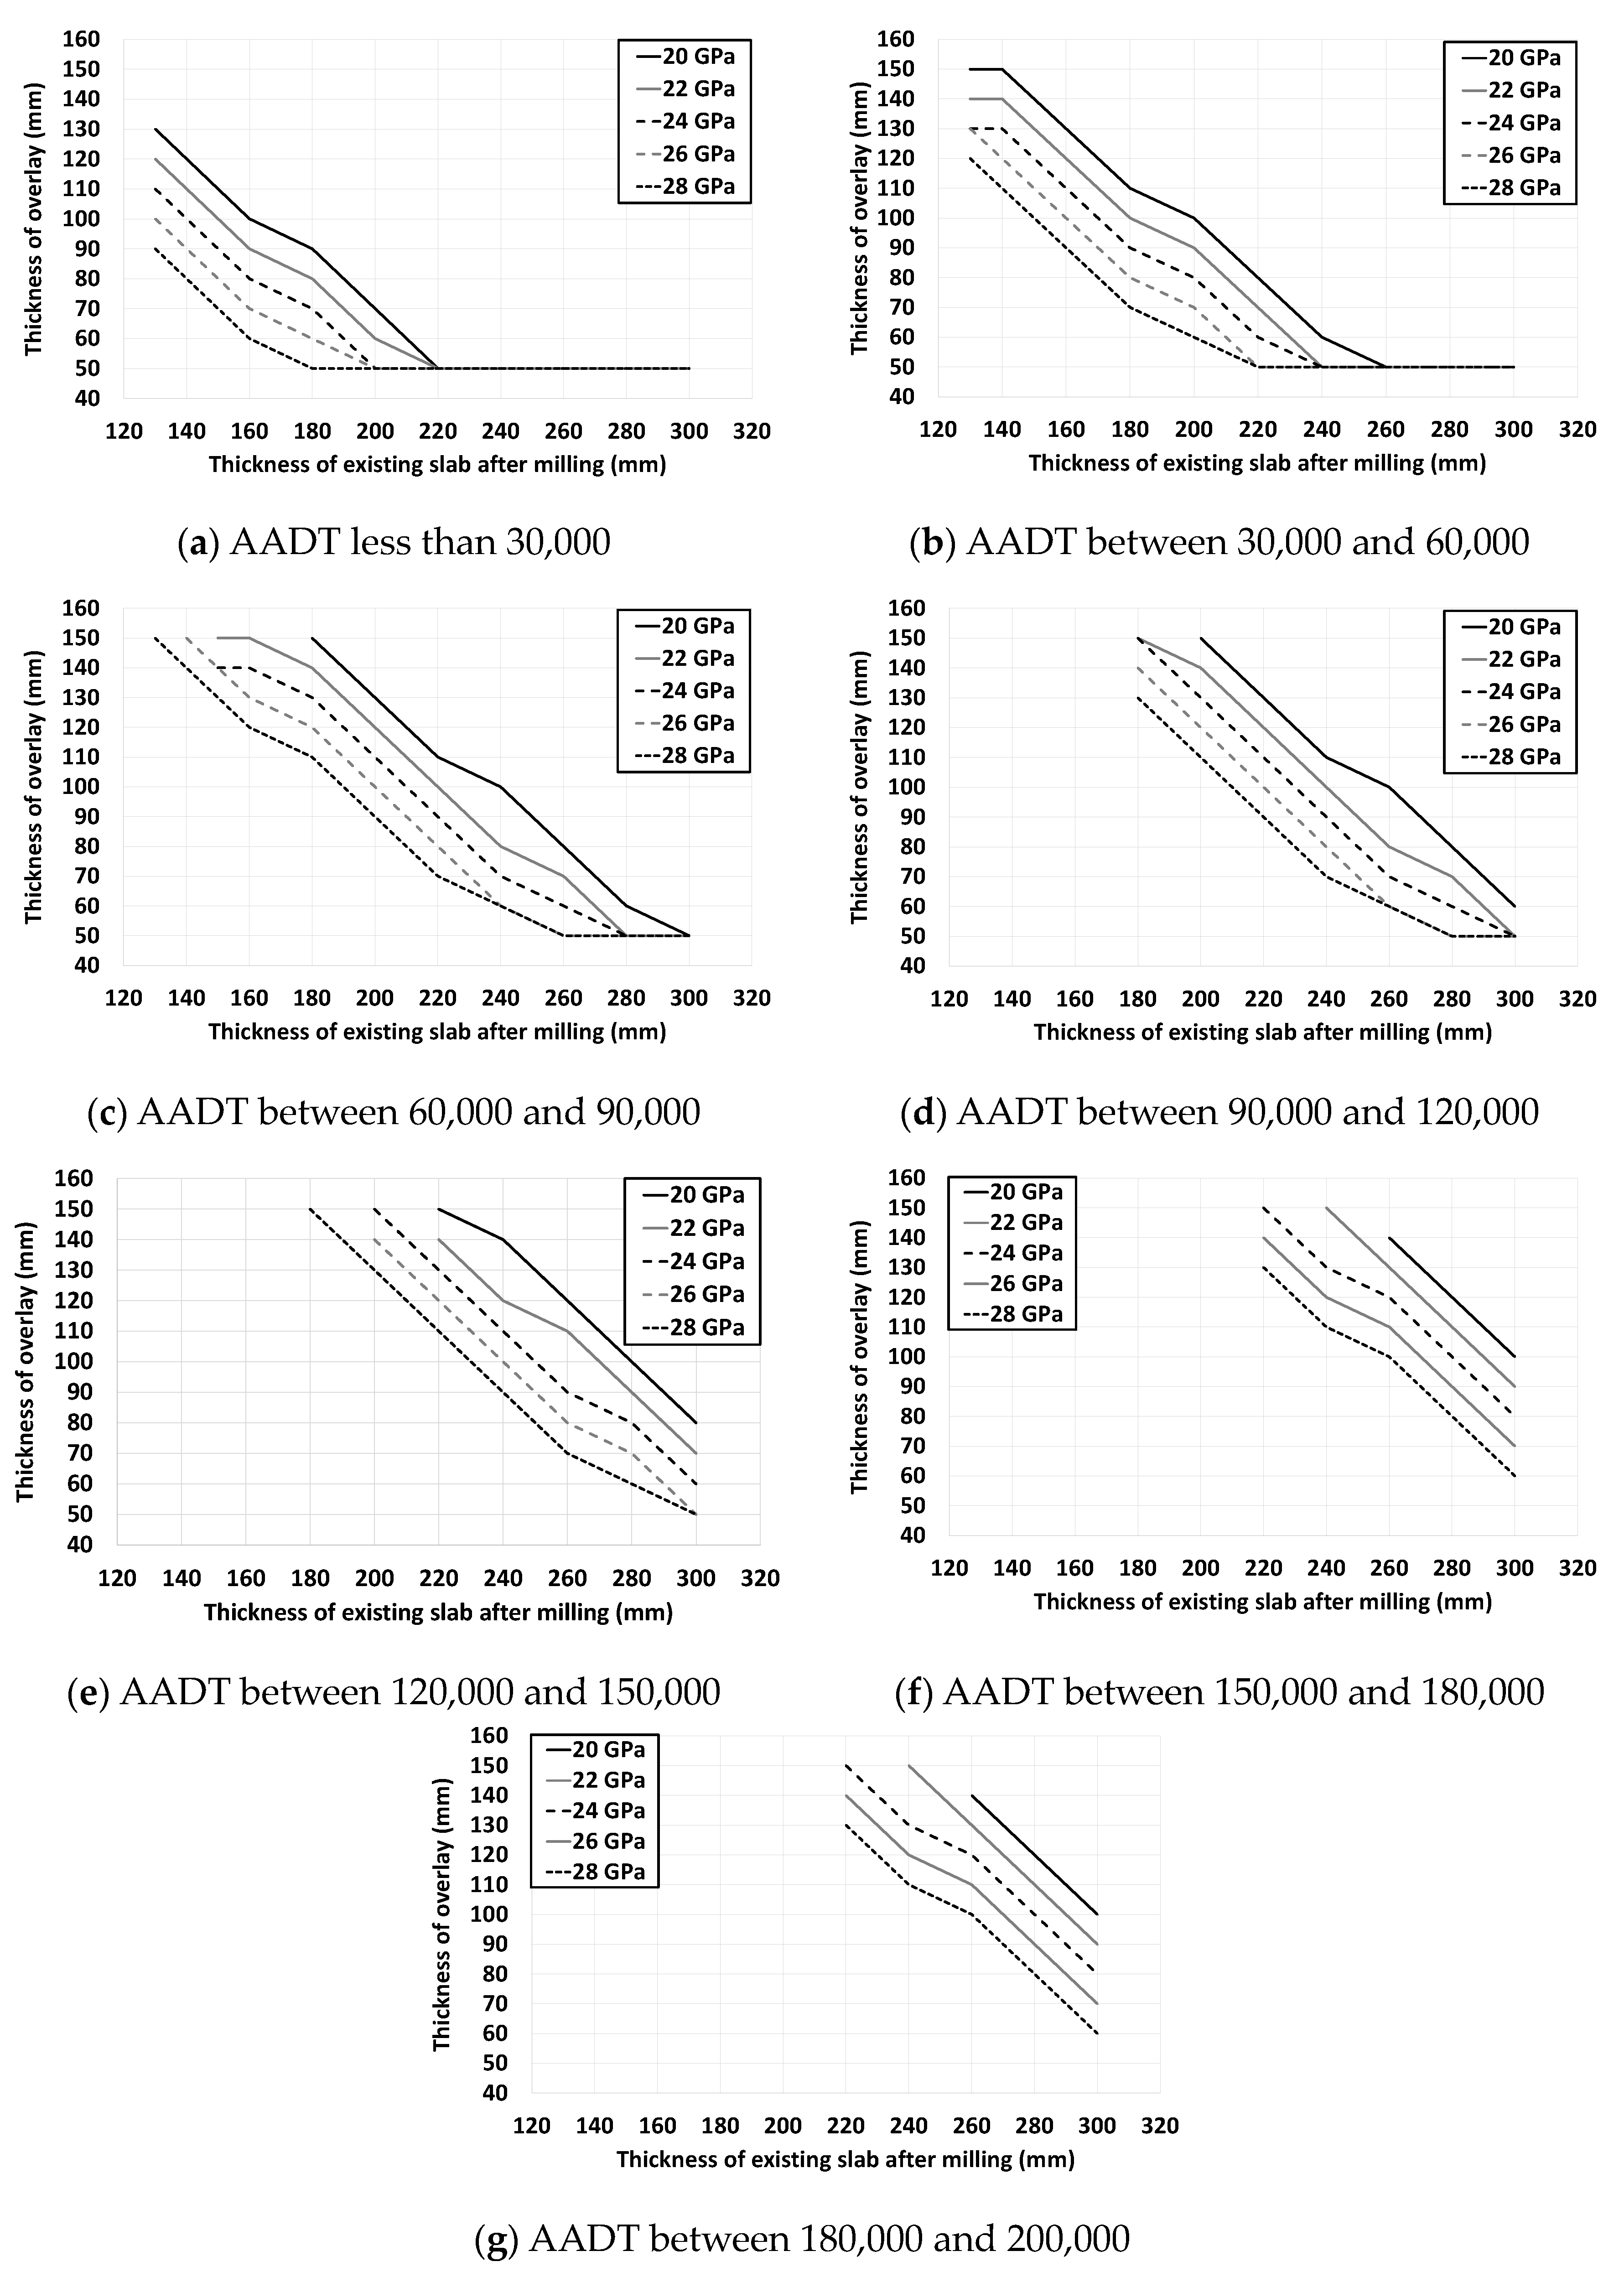
4. Development of a Design Catalog for BCO Pavement

The thickness of the new pavement slab was determined for an AADT of between 30,000 and 200,000 vehicles/day using the Korean pavement design method, as illustrated in Figure 5. In addition, the thickness of the new pavement slab was determined according to the traffic volume of the region with the worst climatic conditions in Korea, as illustrated in Figure 4. The thickness of the BCO with the same stress–strength ratio for the existing slab as that of the new pavement slab was obtained according to the traffic volume range by changing the elastic modulus of the existing slab from 20 to 28 GPa and the thickness of the existing slab after milling from 130 to 300 mm, as illustrated in Table 3. The thickness of the BCO was determined to be 50–150 mm.
Figure 12 shows the catalog for the BCO thickness designed according to the traffic volume, elastic modulus, and thickness of the existing slab after milling. The design thickness of the BCO was required to be thicker as the existing slab became thinner, the elastic modulus of the existing slab decreased, and the traffic volume increased. In particular, the design thickness of the BCO was 50–150 mm for all thicknesses and all elastic modulus values of the existing slab for an AADT of less than 60,000 vehicles/day. For an AADT exceeding 60,000 vehicles/day, however, the required BCO thickness occasionally exceeded 150 mm, which was the maximum allowable limit if the thickness of the existing slab after milling was significantly thin or the elastic modulus of the existing slab was very small. Accordingly, the elastic modulus or the thickness of the existing slab after milling must be sufficient to allow for a BCO thickness below the maximum allowable limit of 150 mm for an AADT exceeding 60,000 vehicles/day.

5. Comparison of Results

The design catalog developed in this study can be used by simply considering the traffic volume without designing a new pavement. However, to use the PCA chart, the new pavement should be designed prior to the design of the BCO pavement. In the PCA, a chart (Figure 13) is provided to design the thickness of the BCO pavement slab according to the flexural strength of the existing pavement slab [18]. To design the BCO thickness, a line is first drawn upward from the full-depth slab thickness, which is the design thickness of the new pavement slab to the base line. The line is extended in the direction parallel to the base line to meet a curve representing the flexural strength of the existing slab. The line is then extended in the upward direction again from the curve to determine the total thickness of the existing pavement resurfacing, which represents the total thickness of the existing slab after milling and overlay. The BCO thickness is determined by subtracting the thickness of the existing slab from the total thickness.
As illustrated in Figure 12, 200 mm is the minimum thickness of the existing slab used in the PCA design chart. However, in this study, the minimum required thickness was determined to be 130 mm. Therefore, the BCO thicknesses designed by the catalog of this study and the PCA method were compared within the range of an existing slab thickness between 200 and 300 mm. In addition, the range of the elastic modulus was 20–28 GPa. To validate the design catalog developed in this study, the BCO thickness designed by the catalog in Figure 11 was compared with that designed by the PCA chart in Figure 12 (e.g., the designed 280 mm thickness of the new pavement slab).
Overall, the BCO thickness designed by the catalog in this study was 15–40 mm thicker than that designed by the PCA chart, as illustrated in Figure 14. The catalog BCO thickness was conservatively designed because it corresponded to the design thickness of the new pavement slab, which was conservatively designed by the Korean pavement design method for a region with the worst climatic conditions. In addition, the Korean pavement material and traffic conditions considered in the Korean pavement design method may contribute to the conservative design of this study. The BCO thickness designed by the catalog decreased by approximately 40 mm with an increase in the elastic modulus of the existing slab from 20 to 28 GPa, whereas that designed by the PCA method decreased by approximately 25 mm.
The design thickness obtained for the BCO when the existing slab was considerably thick and the elastic modulus of the existing slab was significantly large was less than 50 mm when the PCA method was used, as illustrated in Figure 14d–f. However, the BCO must be designed to be at least 50 mm thick in Korea, considering the performance and constructability of BCO pavements, even though the PCA design method does not define a minimum BCO thickness.
In addition, the thickness of the BCO constructed for long-term pavement performance data in the US was compared with that designed by the catalog developed in this study. Twenty-four long-term pavement performance (LTPP) sections distributed in four states in the US were selected for comparison, as shown in Table 4 [23]. A BCO with a thickness of 80–160 mm was constructed on existing continuously reinforced concrete pavement (CRCP) or jointed plain concrete pavement (JPCP) with a slab thickness of 180–210 mm after milling. The effective thickness of the existing slab after milling ranged from 150 to 180 mm.
The thickness of the new pavement slab can be determined according to the AADT, as shown in Figure 5. Therefore, the AADT of the 24 comparison sections can be estimated using the total target thickness of the slab presented in Table 4. In addition, the BCO thicknesses of the sections can be determined according to the AADT, elastic modulus, and thickness of the existing slab after milling, as shown in Figure 12. The thickness of the existing slab after milling of the comparison sections is also presented in Table 4; however, its elastic modulus is not known. Therefore, the range of the BCO thickness can be found in Figure 12 using the 20–28 GPa elastic modulus range suggested in Table 2. As a result, as shown in Table 4, the BCO thickness designed by the catalog occasionally exceeded 150 mm, which was determined as the maximum BCO thickness in this study.
The correlation between the BCO thickness designed using the catalog and that used for LTPP sections was examined, as shown in Figure 15. Thicknesses greater than 150 mm were excluded because the maximum thickness of the BCO suggested by this study was 150 mm. All the differences between the minimum BCO thickness designed using the catalog and the BCO thickness used for LTPP sections were a maximum of 10 mm, showing a high coefficient of determination of 0.9979. The differences between the maximum BCO thickness designed using the catalog and the BCO thickness used for LTPP sections were a maximum of 50 mm, showing a coefficient of determination of 0.7647.
Most of the BCO thicknesses of the comparison sections were similar to the minimum BCO thickness designed using the catalog in this study, as shown in Table 4 and Figure 15. Therefore, it was verified that the BCO thicknesses of the LTPP sections in the US were more conservatively redesigned by the catalog because they were designed based on a new pavement slab, which was conservatively designed by the Korean pavement design method for a region with the worst climatic conditions. In addition, the traffic and material conditions considered in the Korean pavement design method may contribute to the conservative design of this study.

6. Conclusions

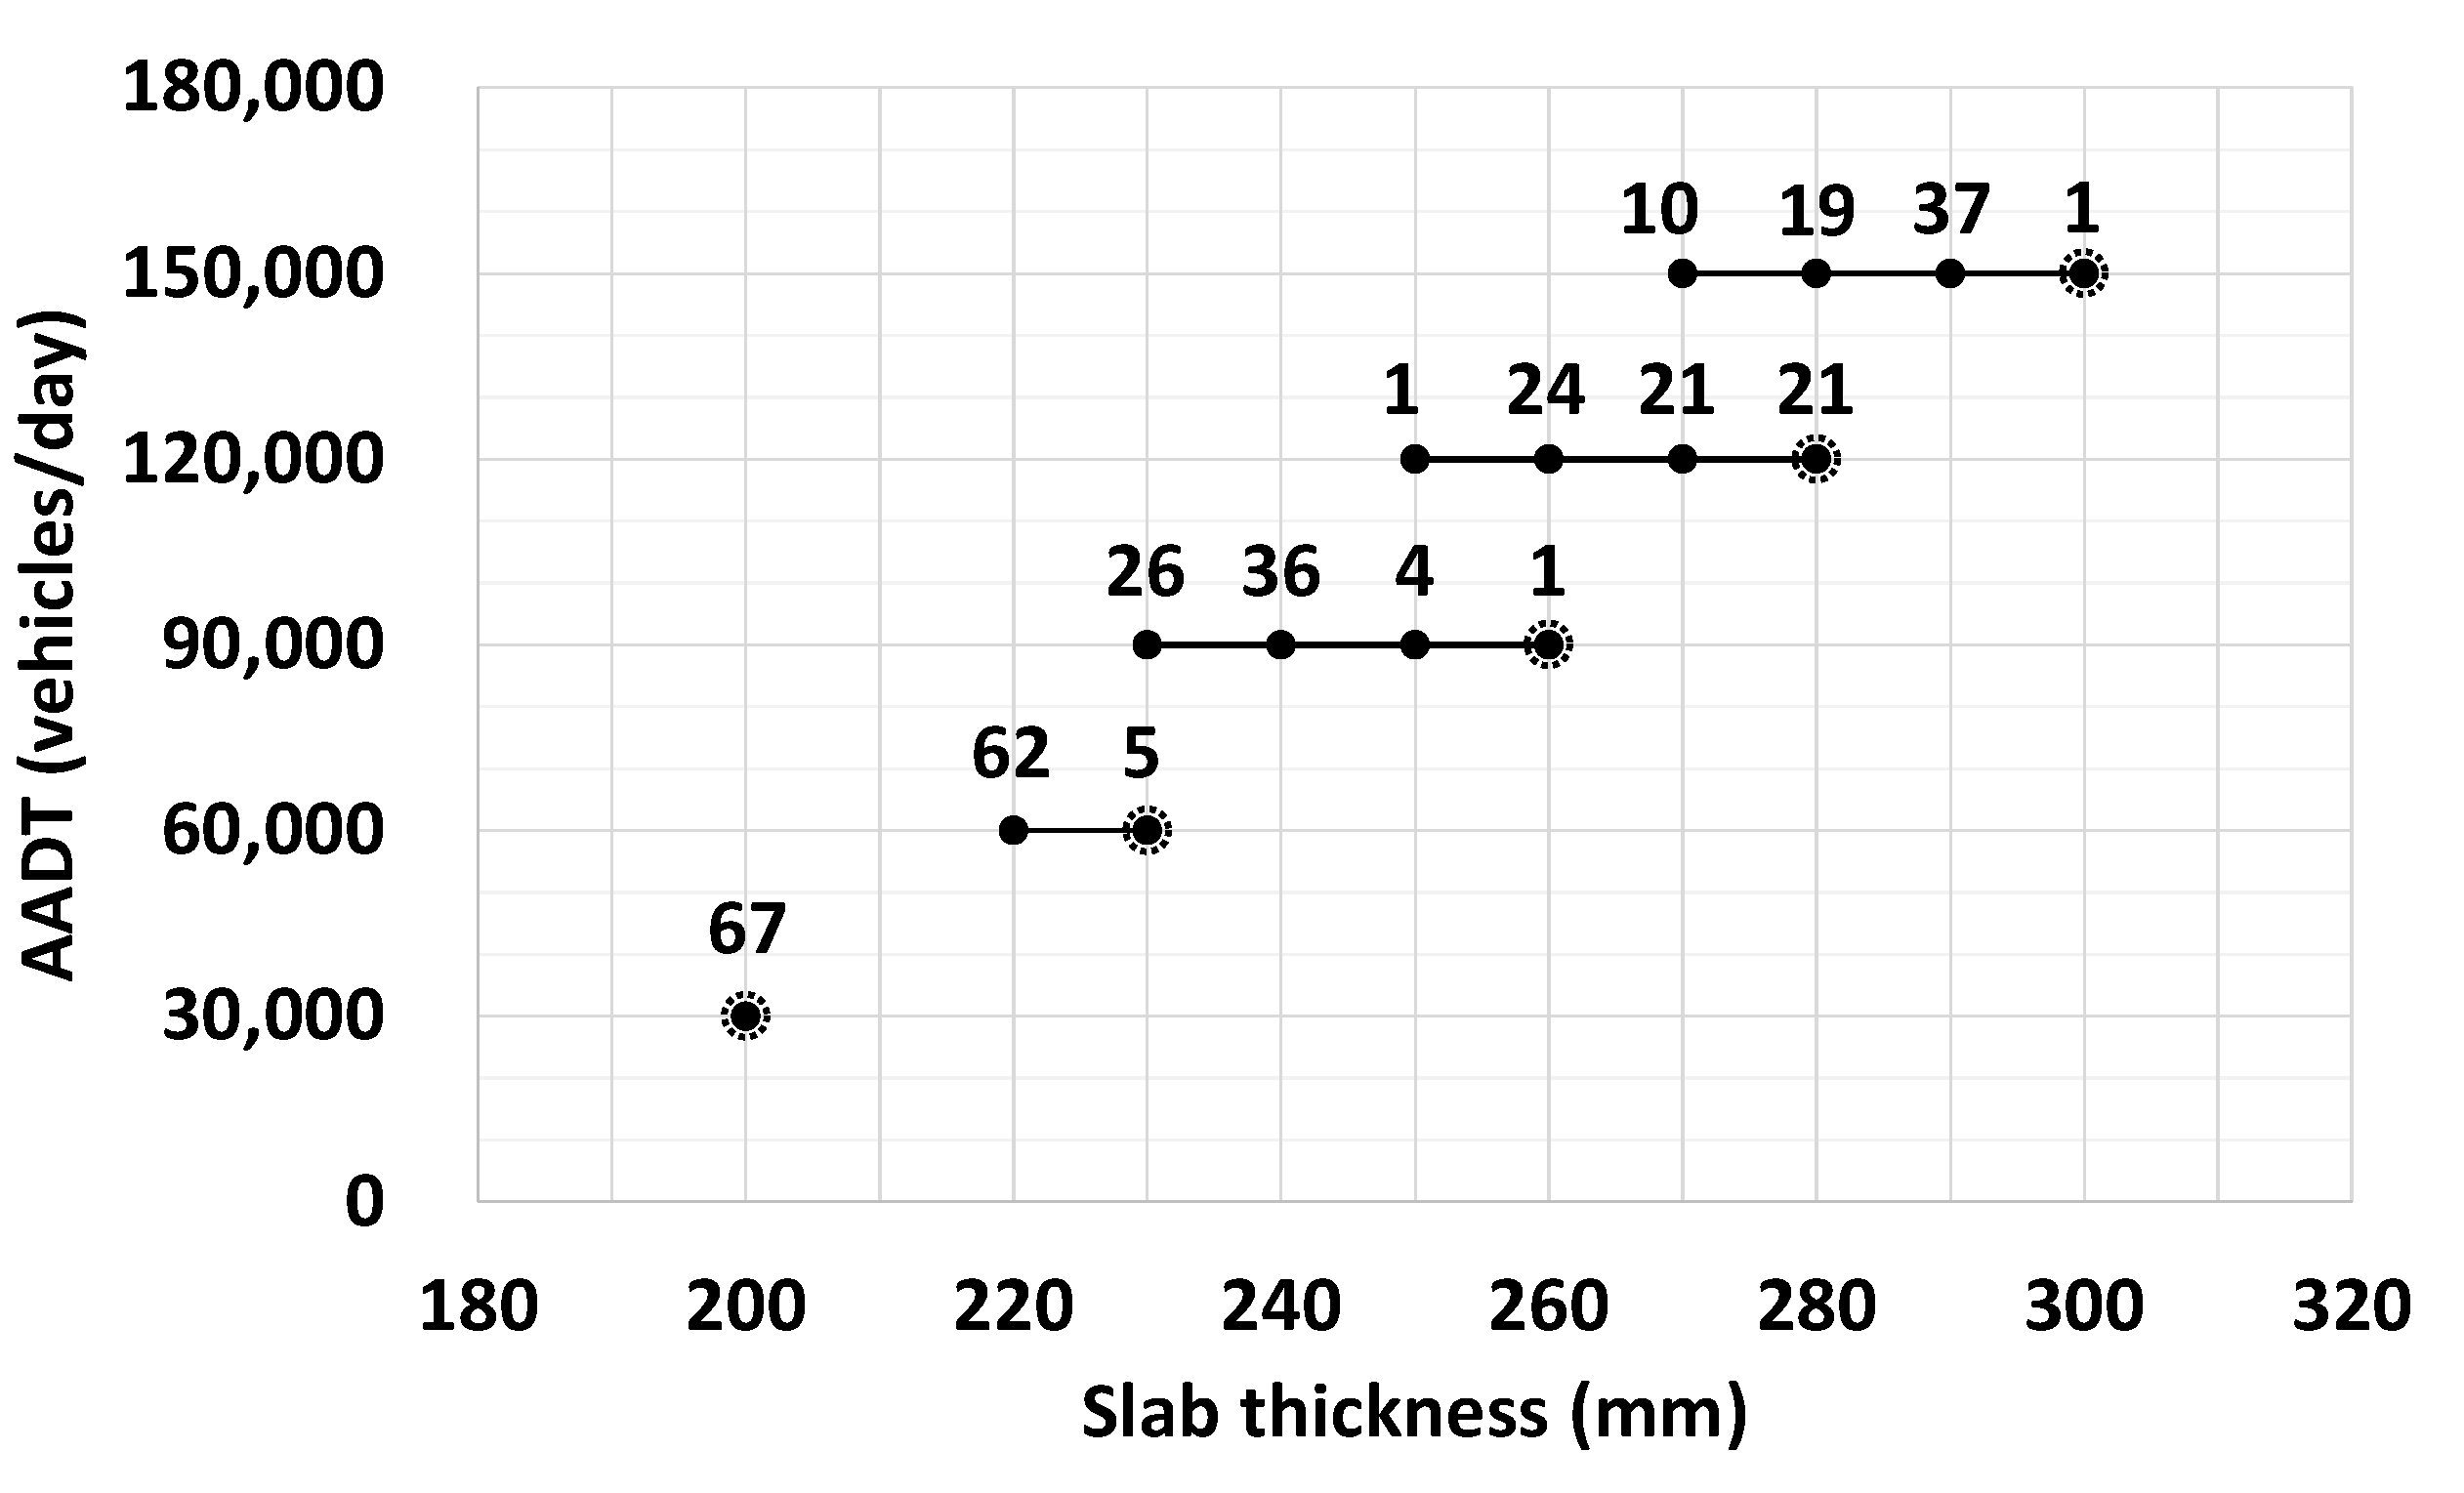
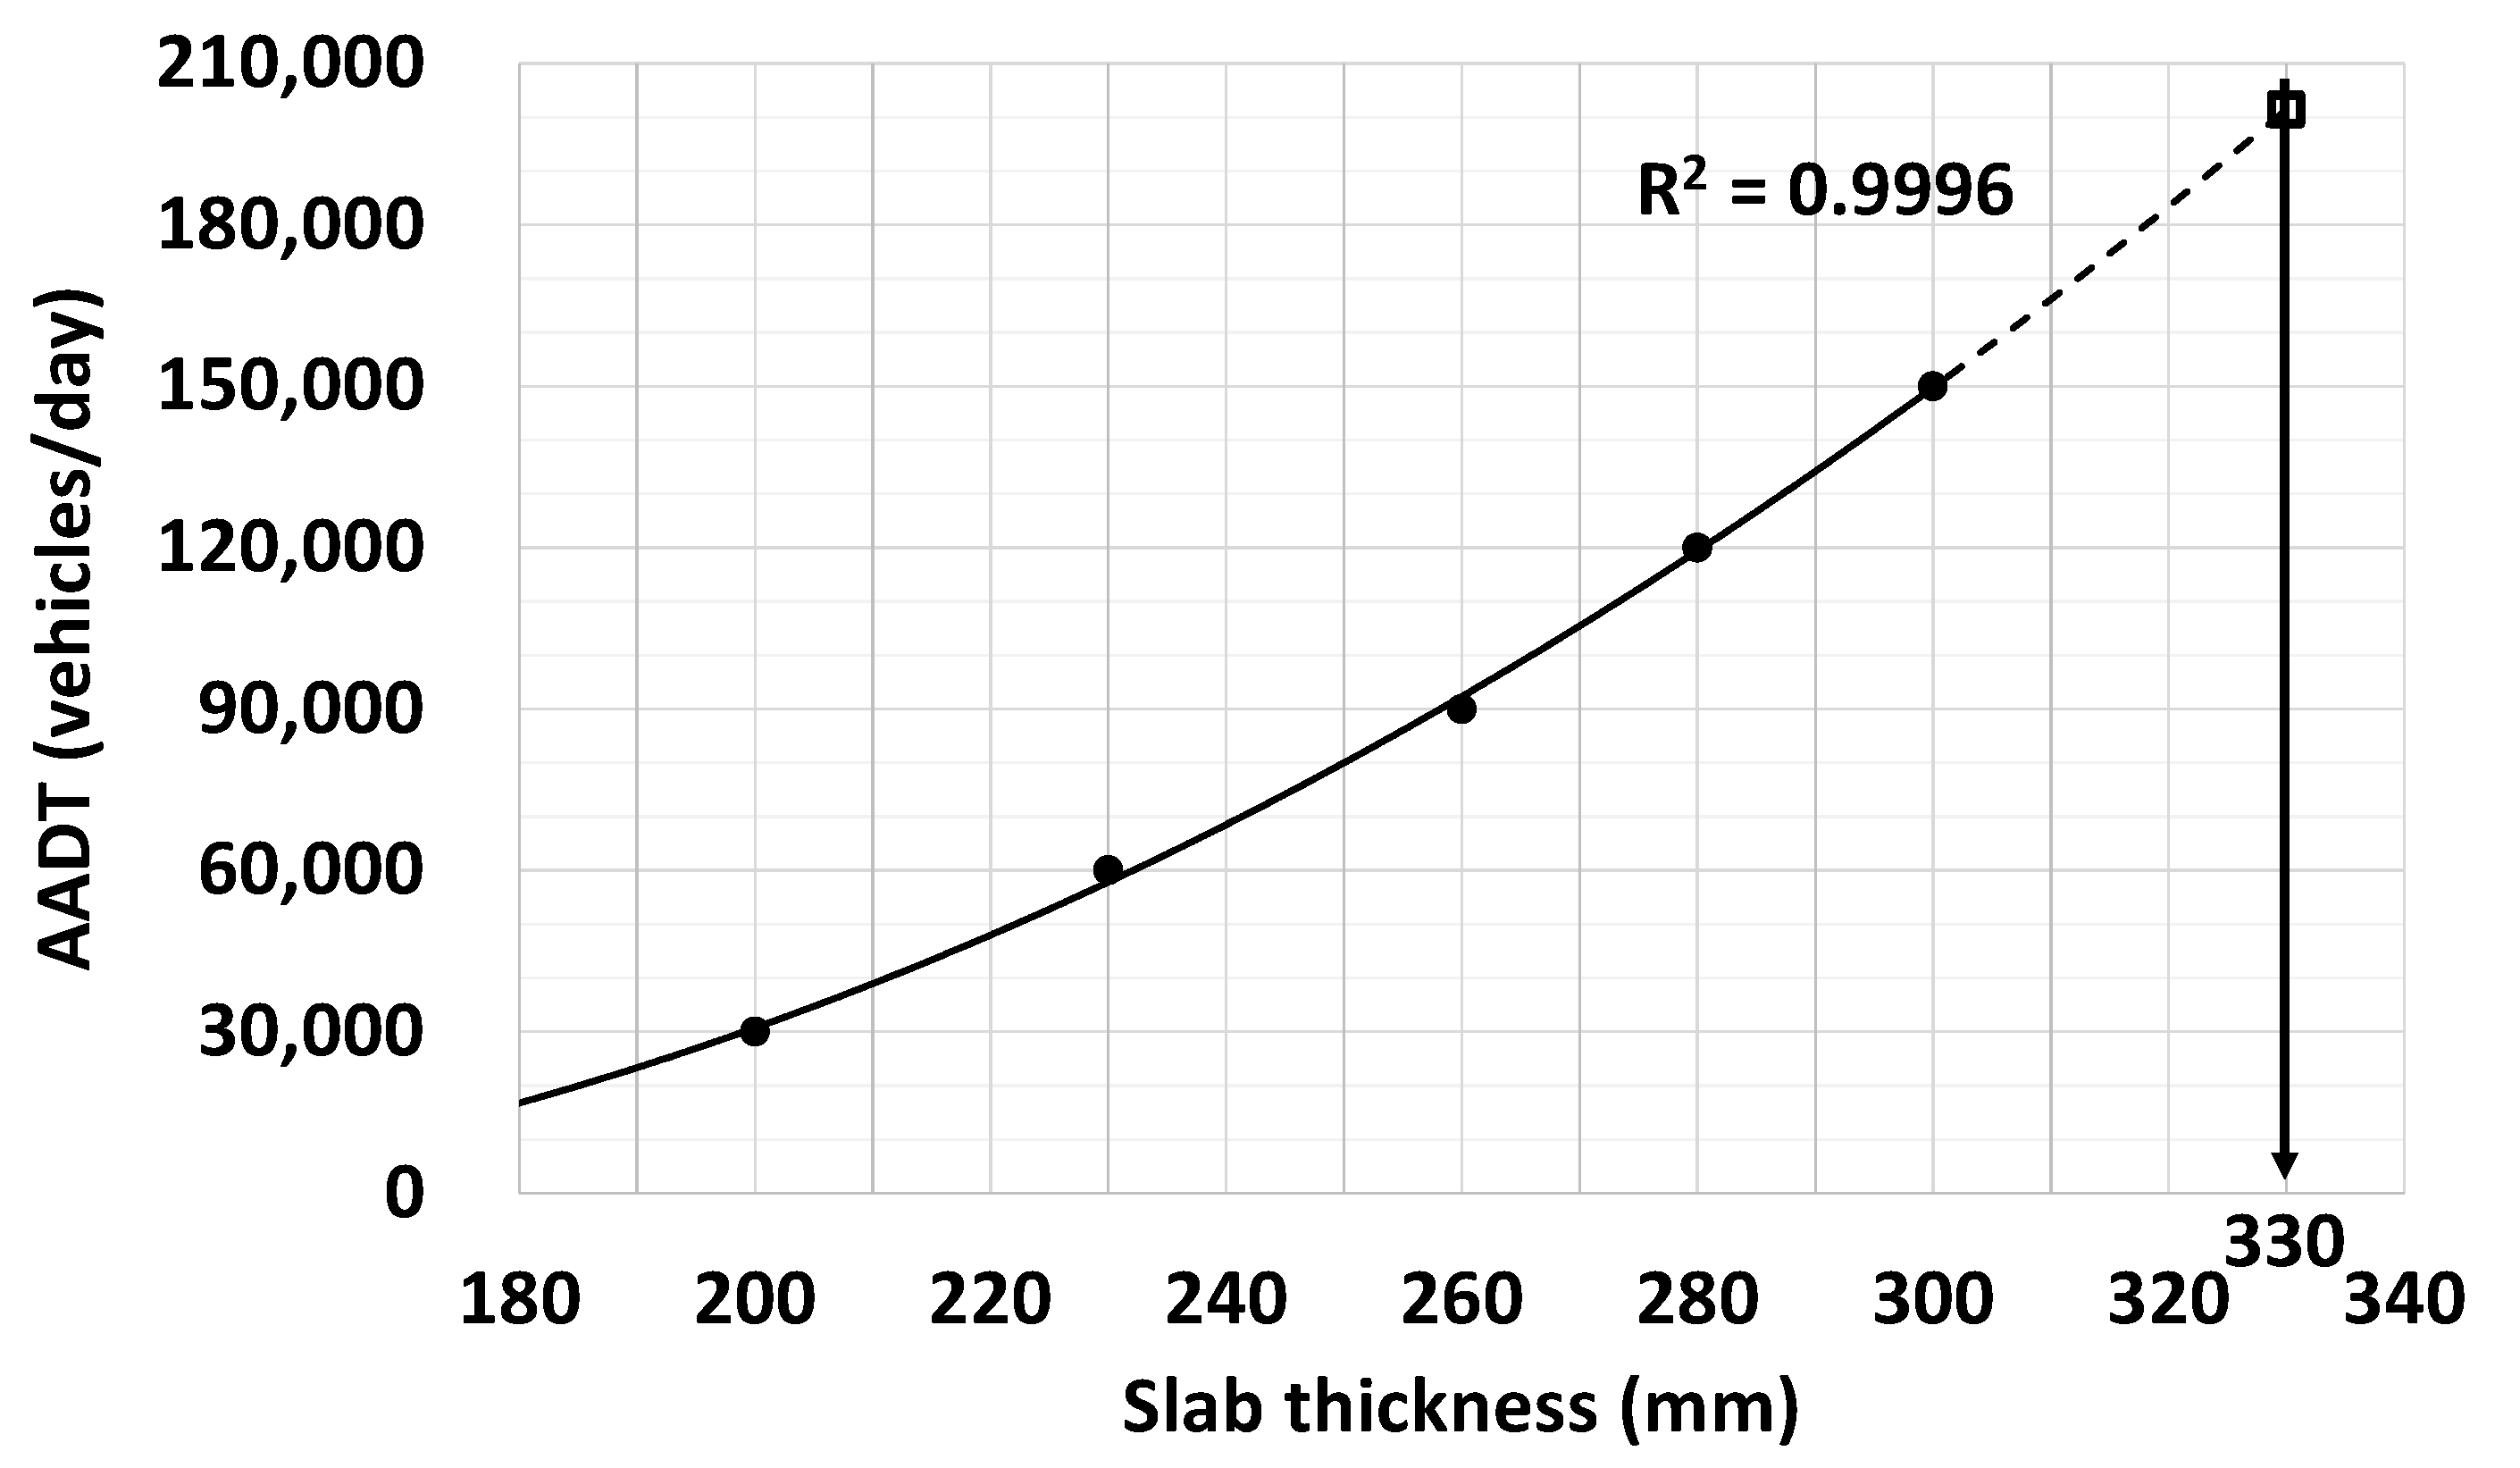
  • In this study, a mechanistic–empirical design catalog for BCO pavements was developed considering the unique Korean climate, pavement material, and traffic conditions. First, the representative thickness of a new pavement slab for the region with the worst climatic conditions in Korea was determined according to the traffic volume using the Korean pavement design method. The range of representative thicknesses for a new pavement slab in Korea was determined to be 200–330 mm.
  • FEA models simulating new jointed concrete and BCO pavements were developed using the structural and material characteristics of Korean pavements as input values. The range used in the FEA model for a new pavement slab thickness was 200–330 mm, according to the results of the Korean pavement design program. The range of existing pavement slab thickness was 130–300 mm when using a milling depth of 30–70 mm, which is commonly used in the field. The range of the BCO thickness was determined to be 50–150 mm after comprehensively considering previous studies and Korean construction cases.
  • The maximum tensile stress at the bottom of a new pavement slab was obtained by an FEA, in addition to that at the bottom of an existing slab according to its elastic modulus, thickness after milling, and BCO thickness. The BCO thickness was determined by adjusting it until the stress–strength ratio at the bottom of an existing slab of BCO pavement was the same as that at the bottom of a new pavement slab. The procedure was repeated according to the elastic modulus and thickness of the existing slab after milling, and the traffic volume was used to develop the BCO design catalog.
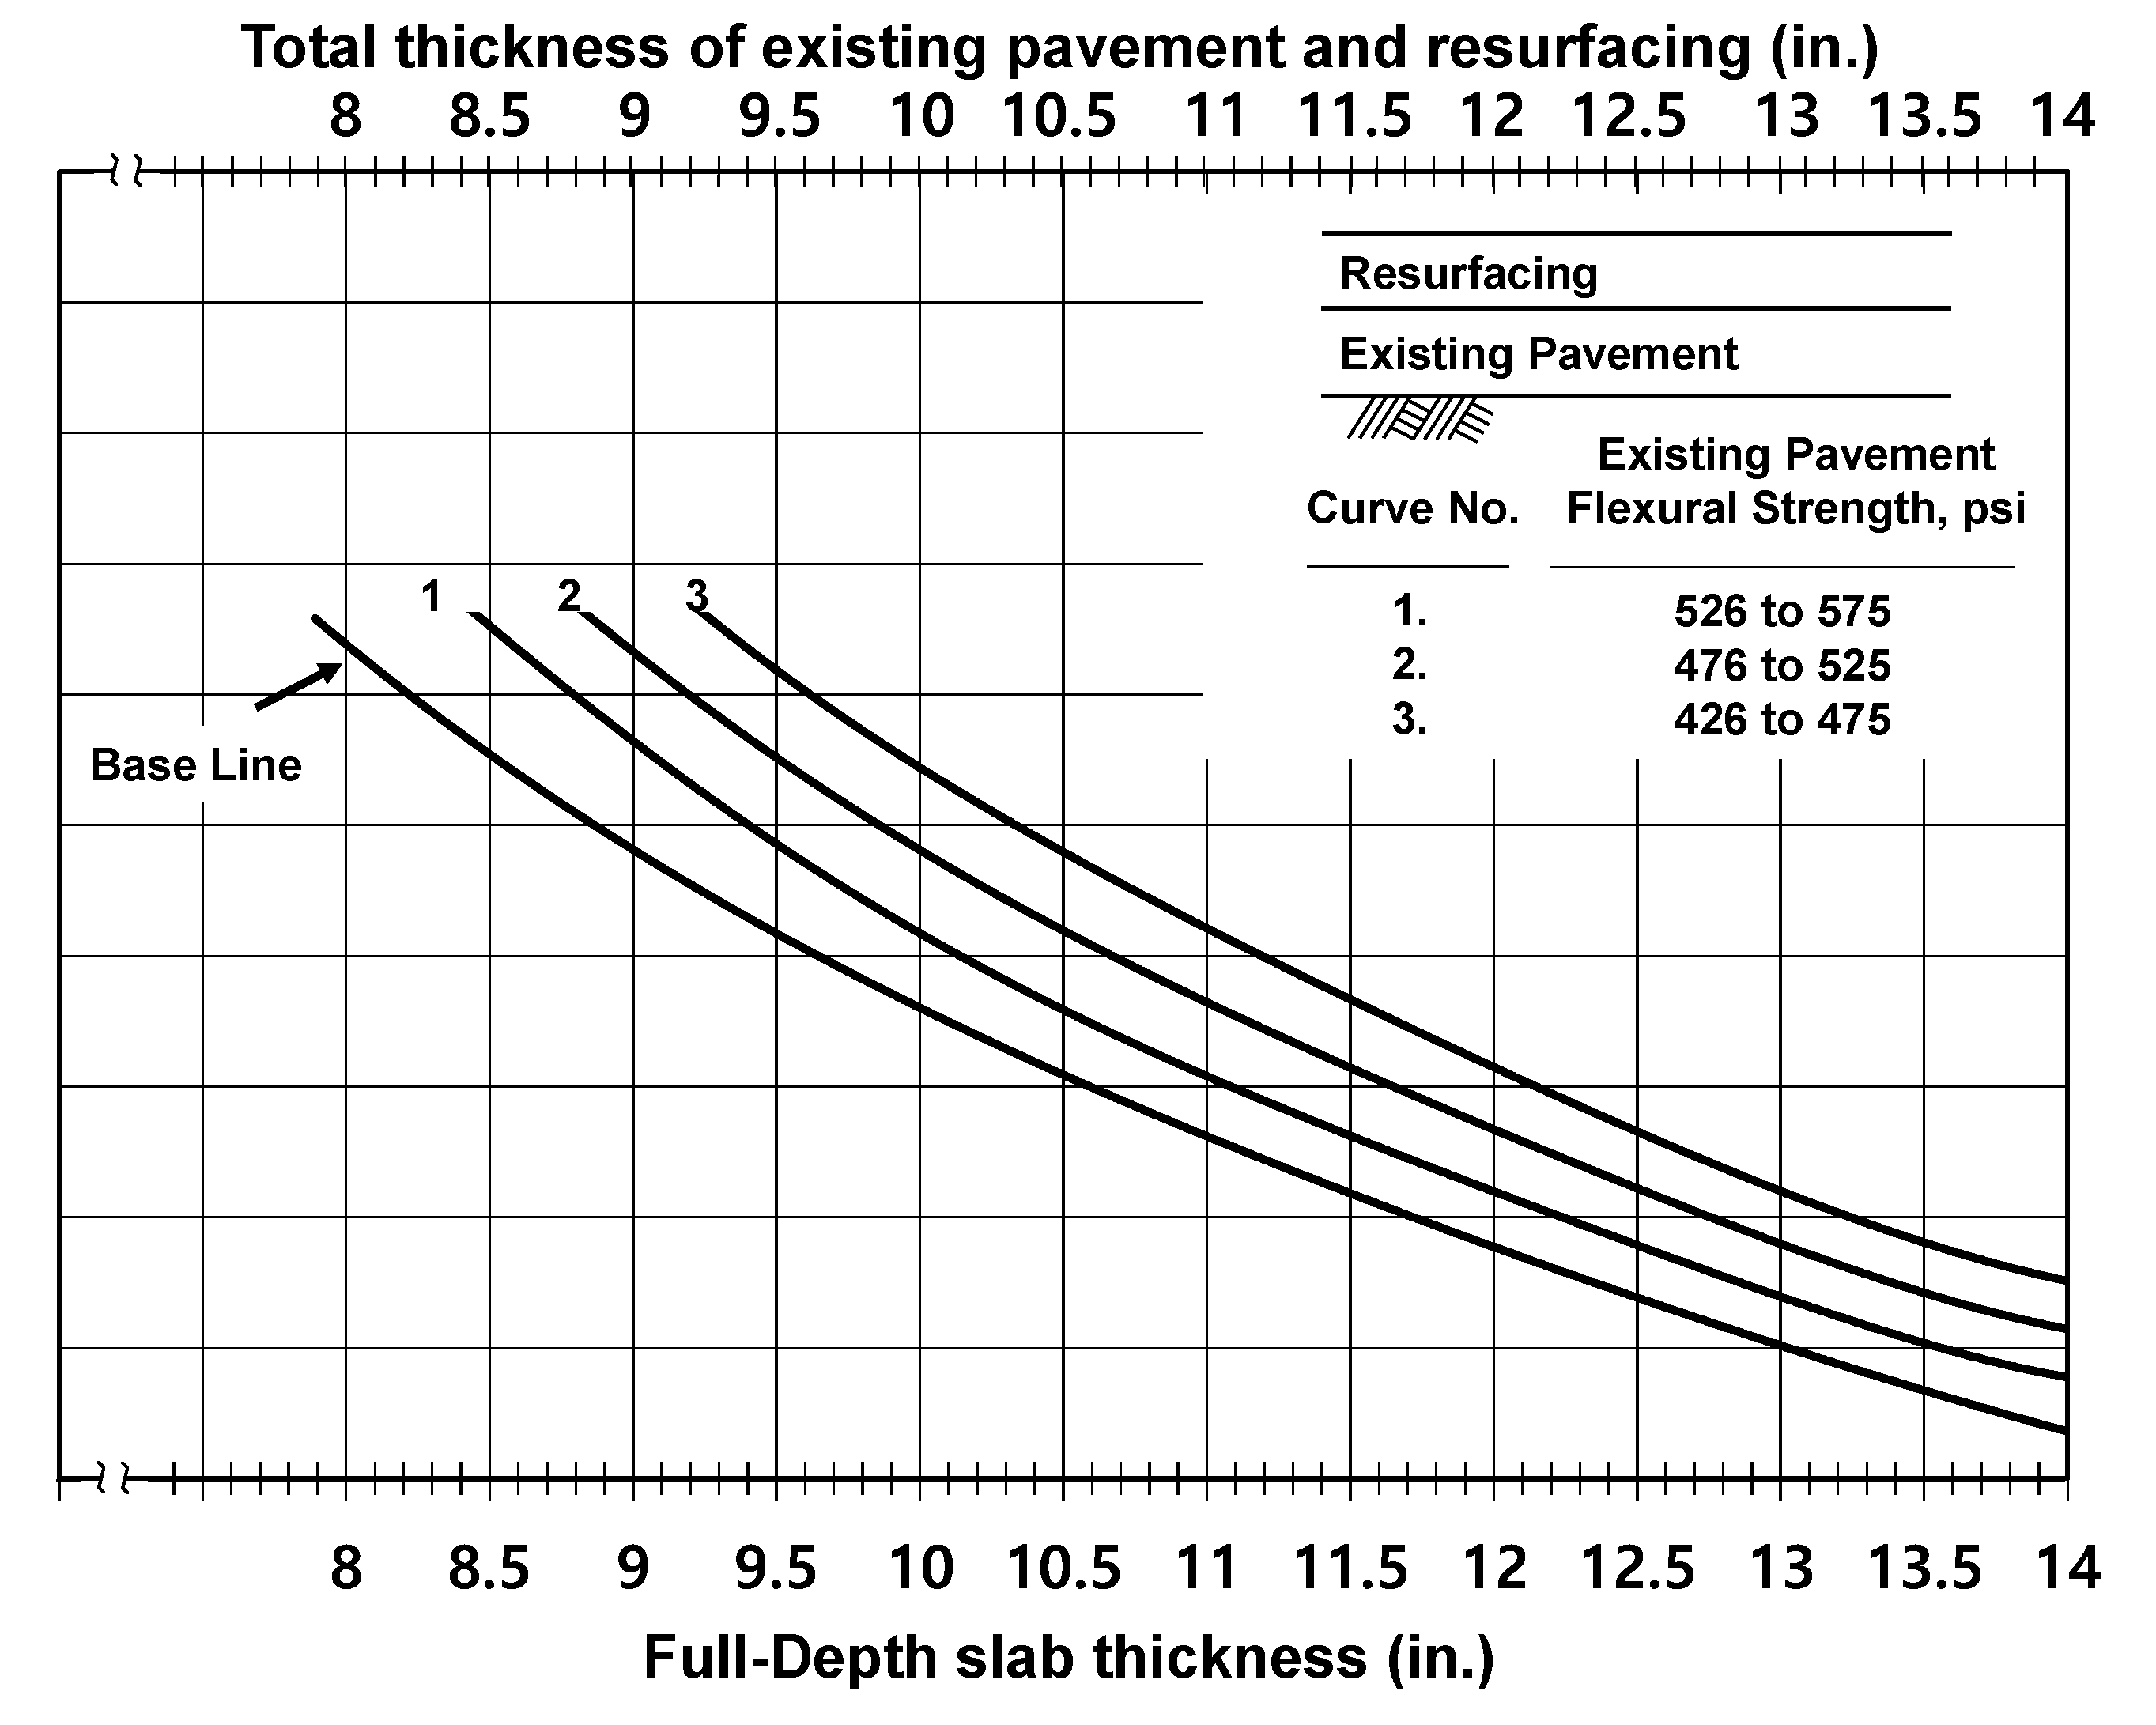
  • The BCO thickness designed by the catalog developed in this study was compared with that designed using the PCA chart. The PCA chart can be used after designing the new concrete pavement, whereas the design catalog can be used by merely considering the traffic volume without designing a new pavement. Consequently, the BCO designed by the catalog in this study was slightly thicker than that designed by the PCA method.
  • Most of the BCO thicknesses of the LTPP sections in the US were similar to the minimum BCO thicknesses designed using the catalog in this study. As a result, it was verified that the BCO thickness of the LTPP sections was more conservatively redesigned by the catalog in this study because it corresponded to a new pavement slab, which was conservatively designed by the Korean pavement design method for a region with the worst climatic conditions. In addition, the traffic and material conditions considered in the Korean pavement design method could contribute to the conservative design of this study.
  • A more reasonable design of BCO pavements considering the Korean climate, pavement material, and traffic conditions can be performed using the design catalog developed in this study. In addition, catalog design of BCO thickness will also be possible for other countries by considering their own regional climate, traffic, and material conditions.

Author Contributions

H.-W.P., J.-S.S. and J.-H.J. conceived and designed the research concepts. H.-W.P. and J.-S.S. wrote the manuscript. J.-H.J. and J.-H.L. contributed to the revision of the manuscript. All authors have read and agreed to the published version of the manuscript.

Funding

This study was funded by the Ministry of Land, Infrastructure, and Transport (MOLIT) and the Korea Agency for Infrastructure Technology Advancement (KAIA) (Project No: 18TLRP-B146707-01).

Institutional Review Board Statement

Not applicable.

Informed Consent Statement

Not applicable.

Data Availability Statement

Not applicable.

Acknowledgments

This study was conducted under the research project “Development of High-Performance Concrete Pavement Maintenance Technology to Extend Roadway Life (Project No: 18TLRP-B146707-01),” funded by the Ministry of Land, Infrastructure, and Transport (MOLIT) and the Korea Agency for Infrastructure Technology Advancement (KAIA).

Conflicts of Interest

The authors declare that they have no competing interest.

References

  1. MOLIT. Status on Road Repair and Maintenance; Ministry of Land, Infrastructure, and Transport: Sejong, Korea, 2016.
  2. Lee, J.-H.; Kim, D.-H.; Moon, K.-H.; Falchetto, A.C.; Kim, J.-C.; Jeong, J.-H. Development of representative section selection method for large-scale concrete pavement remodeling project based on trial and error correction approach. Int. J. Pavement Res. Technol. 2019, 12, 17–25. [Google Scholar] [CrossRef]
  3. Kim, D.-H.; Lee, J.-M.; Moon, K.-H.; Park, J.-S.; Suh, Y.-C.; Jeong, J.-H. Development of Remodeling Index Model to Predict Priority of Large-Scale Repair Works of Deteriorated Expressway Concrete Pavements in Korea. KSCE J. Civ. Eng. 2019, 23, 2096–2107. [Google Scholar] [CrossRef]
  4. Kim, Y.K.; Lee, S.W. Performance evaluation of bonded concrete overlay. Constr. Build. Mater. 2013, 49, 464–470. [Google Scholar] [CrossRef]
  5. Texas DOT. Pavement Manual; Texas Department of Transportation: Austin, TX, USA, 2021.
  6. AASHTO. Guide for Design of Pavement Structures; American Association of State Highway and Transportation Officials: Washington, DC, USA, 1993. [Google Scholar]
  7. MOLTMA. Development of Korea Pavement Research Program and Research: Design of Pavement Performance Improvement System; 2nd Phase 4th Year Final Report; KPRP-H-08; Ministry of Land, Transport and Maritime Affairs: Sejong, Korea, 2010.
  8. MOLIT. Standard Specification of Road Construction; Ministry of Land, Infrastructure and Transport: Sejong, Korea, 2015.
  9. MOLTMA. Road Pavement Structure Design Guideline; Ministry of Land, Transport and Maritime Affairs: Sejong, Korea, 2011.
  10. MOLIT. 2018 Yearbook of Road Traffic Volume; Ministry of Land, Infrastructure, and Transport: Sejong, Korea, 2019.
  11. KEC. Standard Drawings for Expressway Construction; Korea Expressway Corporation: Gimcheon, Korea, 2018. [Google Scholar]
  12. Jung, K.S.; Kim, I.T.; Ryu, S.W.; Cho, Y.H. Development of Stress Equations of Jointed Concrete Pavement Using Finite Element Method. Int. J. Highw. Eng. 2008, 10, 167–181. [Google Scholar]
  13. Westergaard, H.M. New Formulas for Stresses in Concrete Pavements of Airfields. Trans. Am. Soc. Civ. Eng. 1948, 113, 425–439. [Google Scholar] [CrossRef]
  14. Lu, L.-W.; Ricles, J.; Mao, C.; Fisher, J.W. Critical issues in achieving ductile behaviour of welded moment connections. J. Constr. Steel Res. 2000, 55, 325–341. [Google Scholar] [CrossRef]
  15. Ricles, J.; Mao, C.; Lu, L.-W.; Fisher, J.W. Inelastic Cyclic Testing of Welded Unreinforced Moment Connections. J. Struct. Eng. 2002, 128, 429–440. [Google Scholar] [CrossRef]
  16. Kim, D.H.; Ma, G.H.; Park, H.W.; Jeong, J.H. Development of Maximum Tensile Stress Prediction Model for Airport Concrete Pavements Using Environmental and B777 Aircraft Gear Loadings. Int. J. Highw. Eng. 2018, 20, 93–102. [Google Scholar] [CrossRef]
  17. Park, H.-W.; Kim, D.-H.; Lim, J.-S.; Shim, C.-S.; Jeong, J.-H. Prediction of differential drying shrinkage of airport concrete pavement slabs. Int. J. Pavement Eng. 2021, 22, 752–762. [Google Scholar] [CrossRef]
  18. Tayabji, S.D.; Okamoto, P.A. Thickness Design of Concrete Resurfacing. In Proceedings of the Third International Conference on Concrete Pavement Design and Rehabilitation, West Lafayette, IN, USA, 23–25 April 1985; pp. 367–379. [Google Scholar]
  19. KCSC. Bonded Concrete Overlay Pavement Standard Specification; KCS 44 99 10; Korea Construction Standards Center, Ministry of Land, Infrastructure, and Transport: Sejong, Korea, 2016.
  20. Son, H.J. Evaluation of the Performance of Overlay Methods on Aged Concrete Pavement. Master’s Thesis, Gangneung-Wonju National University, Gangneung, Korea, 2011. [Google Scholar]
  21. Park, J.W.; Kim, Y.K.; Han, S.H.; Lee, S.W. Feasibility Study of AASHTO86 Design Method for Bonded Concrete Overlay. Int. J. Highw. Eng. 2013, 15, 47–55. [Google Scholar] [CrossRef]
  22. Huang, Y.H. Pavement Analysis and Design, 2nd ed.; Pearson Prentice Hall: Upper Sad River, NJ, USA, 2004. [Google Scholar]
  23. Kim, Y.K.; Lee, S.W.; Kyu, K.Y.; Woo, L.S. Service life of bonded concrete overlay. Proc. Inst. Civ. Eng. -Transp. 2015, 168, 267–275. [Google Scholar] [CrossRef]
Figure 1. Conceptual diagram of bonded concrete overlay (BCO) thickness design suggested by the (a) the American Association of State Highway and Transportation Officials (AASHTO) and (b) the Portland Cement Association (PCA).
Sustainability 13 09876 g001
Figure 2. Design procedure of jointed concrete pavement with the Korean pavement design method.
Sustainability 13 09876 g002
Figure 3. Regional weather stations in Korea.
Sustainability 13 09876 g003
Figure 4. Distribution of the slab thickness of new pavement according to climatic conditions and traffic volume.
Sustainability 13 09876 g004
Figure 5. Design thickness of a new pavement slab predicted by extending the trend line to an annual average daily traffic (AADT) of 200,000 vehicles/day.
Sustainability 13 09876 g005
Figure 6. Finite element analysis models: (a) new pavement and (b) BCO pavement.
Sustainability 13 09876 g006
Figure 7. Comparison of stress distributions in slabs: (a) new pavement slab and (b) BCO pavement slab.
Sustainability 13 09876 g007
Figure 8. Stress–strength ratio of a new pavement slab according to its thickness.
Sustainability 13 09876 g008
Figure 9. Stress–strength ratio of the existing slab according to its thickness after milling (e.g., BCO thickness of 100 mm).
Sustainability 13 09876 g009
Figure 10. Stress–strength ratio of existing slab according to BCO thickness (e.g., existing slab thickness of 260 mm after milling).
Sustainability 13 09876 g010
Figure 11. Sensitivity of stress–strength ratio to influencing factors.
Sustainability 13 09876 g011
Figure 12. Design thickness of BCOs according to the elastic modulus and thickness of the existing slab after milling: (a) AADT less than 30,000, (b) AADT between 30,000 and 60,000, (c) AADT between 60,000 and 90,000, (d) AADT between 90,000 and 120,000, (e) AADT between 120,000 and 150,000, (f) AADT between 150,000 and 180,000 and (g) AADT between 180,000 and 200,000.
Sustainability 13 09876 g012
Figure 13. BCO design chart of PCA.
Sustainability 13 09876 g013
Figure 14. Comparison of BCO thicknesses between this study and the PCA (e.g., 280 mm thickness of new pavement slab), (a) 200 mm thickness of existing slab after milling, (b) 220 mm thickness of existing slab after milling, (c) 240 mm thickness of existing slab after milling, (d) 260 mm thickness of existing slab after milling, (e) 280 mm thickness of existing slab after milling and (f) 300 mm thickness of existing slab after milling.
Sustainability 13 09876 g014
Figure 15. Correlation between BCO thicknesses designed by the catalog and used in LTPP.
Sustainability 13 09876 g015
Table 1. Design level according to road type and traffic volume.
Design LevelRoad TypeAADT (Vehicles/Day)Remark
1Expressway>150,000>50,000 of heavy vehicles
(Type 5 or Over)
National highway>35,000>12,000 of heavy vehicles
(Type 5 or Over)
2Expressway≥150,000-
National highway35,000 ≥ AADT > 7000-
Local roads and other roads≥7000-
3National highway, local roads, and other roads>7000-
Table 2. Range of variables used in sensitivity analysis of stress–strength ratio.
Influencing FactorMinimumMediumMaximum
Thickness of existing slab after milling (mm)130220300
Thickness of BCO (mm)50100150
Elastic modulus of existing slab (GPa)202428
Table 3. Ranges of input values for the finite element analysis (FEA).
Input ParameterMinimumMaximum
Thickness of new pavement slab (mm)200330
Elastic modulus of existing slab (GPa)2028
Thickness of existing slab after milling (mm)130300
Thickness of BCO (mm)50150
Table 4. Comparison of the BCO thickness of long-term pavement performance (LTPP) sections in the US with that designed by the catalog.
No.Existing Pavement TypeExisting Slab Thickness after Milling (mm)Effective Thickness of Existing Slab (mm)Total Target Thickness of Slab (mm)BCO Thickness (mm)BCO Thickness
(This Study) (mm)
Min.Max.
1CRCP200170270100110150
2CRCP200170330160>150>150
3CRCP200170300130130>150
4CRCP200170310140>150>150
5CRCP19016025090100140
6CRCP210180280100100140
7CRCP200170320150>150>150
8CRCP210180330150>150>150
9CRCP190160300140140>150
10CRCP19016025090100140
11CRCP2101802608080120
12CRCP200170300130130>150
13CRCP200170300130130>150
14CRCP180150290140150>150
15CRCP200170290120130>150
16JPCP190160260100100140
17JPCP2001702508090130
18JPCP21018027090100140
19JPCP2101802608080120
20JPCP210180320140>150>150
21JPCP210180300120120>150
22JPCP200170290120130>150
23JPCP200170300130130>150
24JPCP200170270100110150
Publisher’s Note: MDPI stays neutral with regard to jurisdictional claims in published maps and institutional affiliations.

