Article

A Trajectory Optimization Strategy for Connected and Automated Vehicles at Junction of Freeway and Urban Road

1
School of Transportation, Jilin University, Changchun 130022, China
2
Urban Planning Group, Department of Urban Science and Systems, Eindhoven University of Technology, 5612 Eindhoven, The Netherlands
3
College of Information and Control Engineering, Jilin Institute of Chemical Technology, Jilin City 130022, China
*
Authors to whom correspondence should be addressed.
Sustainability 2021, 13(17), 9933; https://doi.org/10.3390/su13179933
Submission received: 3 August 2021 / Revised: 27 August 2021 / Accepted: 30 August 2021 / Published: 4 September 2021

Abstract

:
The phenomenon of stop-and-go traffic and its environmental impact has become a crucial issue that needs to be tackled, in terms of the junctions between freeway and urban road networks, which consist of freeway off-ramps, downstream intersections, and the junction section. The development of Connected and Automated Vehicles (CAVs) has provided promising solutions to tackle the difficulties that arise along intersections and freeway off-ramps separately. However, several problems still exist that need to be handled in terms of junction structure, including vehicle merging trajectory optimization, vehicle crossing trajectory optimization, and heterogeneous decision-making. In this paper, a two-stage CAV trajectory optimization strategy is presented to improve fuel economy and to reduce delays through a joint framework. The first stage considers an approach to determine travel time considering the different topological structures of each subarea to ensure maximum capacity. In the second stage, Pontryagin’s Minimum Principle (PMP) is employed to construct Hamiltonian equations to smooth vehicle trajectory under the requirements of vehicle dynamics and safety. Targeted methods are devised to avoid driving backwards and to ensure an optimal vehicle gap, which make up for the shortcomings of the PMP theory. Finally, simulation experiments are designed to verify the effectiveness of the proposed strategy. The evaluation results show that our strategy could effectively militate travel delays and fuel consumption.

1. Introduction

According to the Greenhouse Gas (GHG) Emissions Report presented by the United States Environmental Protection Agency (EPA), transportation has become the largest source of greenhouse gas emissions in America in 2018, contributing to approximately 28% of national GHG emissions. GHG emissions from transportation are mainly generated by burning fossil fuels, and more than 90% of the fuel used in transportation is petroleum-based [1]. As more and more research focuses on reducing greenhouse gas emissions and improving fuel efficiency, several approaches have been proposed, including traffic demand management and guidance [2], eco-driving [3], advanced traffic signal control [4], signal vehicle coupled control (SVCC) [5], and vehicle energy management [6].
Trajectory optimization strategy plays an important role in the eco-driving approach [3], which attempts to smooth vehicle trajectory and avoid idling by optimizing the acceleration/deceleration profile using connected and automated vehicle (CAVs) technology [7]. Interweaving areas, such as urban intersections or freeway merging areas, are the main bottleneck points and grievously obstruct traffic capacity. It is commonly believed that interweaving behaviors might hinder the continuity of traffic flow and rise the phenomenon of stop-and-go traffic, resulting in traffic congestion and accidents [8]. Trajectory optimization approaches offer striking findings and shed new light on solving the above issues.
Typically, trajectory optimization strategies are categorized into two aspects: trajectory optimization strategies for urban intersections [9,10,11,12,13,14], and trajectory optimization strategies for freeway [15,16,17,18,19].
In terms of the trajectory optimization strategies for urban intersections, different strategies are proposed for both signalized intersections and non-signalized intersections [9]. For the former, several research experiments optimized individual vehicle speed profiles. Mandava [10] developed an analytical trajectory optimization model for human-drivers under signal control, and the simulation results indicated the energy/emission savings for vehicles using this strategy were efficient. Considering the impacts from queues at intersections, He [7] proposed a multi-stage optimal control formulation to optimize such individual vehicle trajectory, which was more advanced and was conducted according to the actual intersection situation. However, this paper only focused on single vehicle scenarios, which may result in additional delays and fuel consumption for the following vehicles. By predicting vehicle arrival time (obtaining their arrival time through inter-communication) and by dividing them into different platoons, the platoon-based control approach was built to adjust the signal timing schedule to ensure that the platoons pass through the intersections without idling [11]. Instead of categorizing the upcoming vehicles into platoons and omitting the internal states among the same platoons, a planning-based control strategy regards every vehicle as an independent individual. The main idea of this approach is to estimate every vehicle’s actual arrival time and to predict intersection conditions in advance [12]. However, owing to the loss of vehicle start-up and clearance for signalized intersections, trajectory optimization strategies on such areas may sacrifice partial traffic efficiency in order to organize the traffic [13].
For trajectory optimization strategies at non-signalized intersections, as early as 2004, a reservation-based approach was applied by Dresner [14]. After that, numerous strategies based on cooperative resource reservation (CRR) were reported, such as centralized CRR [20], economic incentive centralized CRR [21], and distributed CRR [22]. These approaches, namely request–response approaches, may cause a heavy communication burden and may present suboptimal solution [23]. Inspired by intersection signal control, some of literature has reported the concept of a virtual traffic light [13,24,25]. By choosing an appropriate vehicle as a lead virtual traffic light and transferring the leading power cyclically, non-signalized intersections could operate as signalized intersections. In addition, trajectory planning has become more and more popular [26,27,28,29]. The main idea was essentially to formulate an optimal control problem for the arriving vehicles with a determined optimization objective.
The existence of freeway ramp metering always results in speed changes, traffic congestion, and collision [15,16,17,18,30,31]. In general, the methods proposed for merging behaviors on the freeway ramp have similar characteristics, which aim to regulate the traffic flow from the on-ramp to the freeway network. However, some factors, such as the degree of vehicle “intelligence”, road geometry, etc., may cause significant discrepancies. For example, centralized and decentralized control rules have been identified. For the former method, a traffic control center was created to broadcast the control information for all vehicles in a unified manner. The latter was scattered upon each vehicle, achieving collaboration through inter-vehicle communication [19]. Rios-Torres used the optimal control principle to solve the problem of vehicle trajectory optimization when passing through the merge area. His team analyzed the conflict relationship between vehicles, and an objective function was constructed with vehicle acceleration as the control variable to ensure vehicle safety and fuel economy simultaneously [32]. Cao proposed a method for the collaborative optimization of vehicle paths based on a predictive control model in freeway merging zone. The acceleration of freeway road vehicles was changed through communication and cooperation to facilitate the merging of ramp vehicles. He also introduced state variables to optimize the position of the merge point [33]. Moreover, several other methods focusing on handling vehicle interfaces in the merging areas have been reported, including feedback optimal control [34], and nonlinear optimal control [35].
The above studies aimed at the control of vehicles in urban intersections or freeway ramps. These proposed methods can effectively satisfy the traffic management needs of the corresponding areas, especially in the context of CAV technology. In addition to the above two areas, the junctions between freeways and urban roads are at greater risk of becoming bottleneck zones owing to weaving behaviors, especially occurring on off-ramps and in urban roads network. Zhao [36] reported an integrated design strategy to alleviate these conflicts and to increase the overall road capacity by adopting an advanced signal control concept called “pre-signal”. However, to our knowledge, there has been little literature that has contributed to the CAV control for the junctions between freeways and urban road networks.
This paper is expected to fill in the blanks of vehicle trajectory optimization at the junctions between freeways and urban roads under a CAV environment. The contribution of this study is to propose a two-stage CAV trajectory optimization strategy for such junctions to improve fuel economy and driving comfort on the basis of ensuring maximum capacity (or reducing vehicle delays). Considering the different topological structures of each subarea, various travel time determination methods are applied to ensure maximum capacity. Moreover, we also develop a framework to determine vehicle departure times under the consideration of distinct conflict relationships. In order to reduce computational complexity, Pontryagin’s Minimum Principle (PMP) is employed to construct Hamiltonian equations to smooth vehicle trajectories under the requirements for vehicle dynamics and safety. Given vehicle state conditions, a closed-form solution can be acquired. Moreover, we devise targeted methods to avoid driving backwards and to ensure optimal vehicle gap, which make up for the shortcomings of the PMP theory. Our model contributes to CAV literature in the sense that it can promote the development of CAV technology for trajectory optimization and inspire follow-up studies on freeway and urban traffic junctions.
The remaining paper is organized as follows. Section 2 is the problem formulation section and includes a description of the problem at hand and related notation statements. Section 3 analyzes the determination of vehicle travel time. In Section 4, we optimize vehicle trajectory by employing PMP according to the optimal departure time. Parameter analysis and simulation evaluation are provided in Section 5. Section 6 concludes our study and remarks on the future work.

2. Problem Formulation

2.1. Problem Description

As the important carrier for resident trips, freeway systems magnificently improve the traffic situation compared to the ordinary road networks. On-ramps and off-ramps play a vital role in connecting the freeway network to the urban road network, which keeps traffic flowing and maintains the operation of the transportation system. Nevertheless, due to the unique structure of the junction, it might become one of the most likely places for congestion and accidents to occur, which seriously impedes the resident mobility. Hence, our paper aims to propose solvable ideas for this noticeable problem.
As shown in Figure 1, a typical integrated freeway off-ramp and urban road network structure contains three zones: the Off-Ramp Zone (ORZ), the Junction Section (JS), and the Downstream Intersection (DI). Vehicles coming from both the freeway and the urban road network merge in the Merging Zone (MZ), which is located at the ORZ. The JS contains both the ORZ and DI. The DI is a typical urban intersection, the center of which is defined as the Interweaving Zone (IZ).
To date, due to special road geometrics and the sudden increasing traffic at MZ and IZ, the stop-and-go phenomenon frequently occurs in these areas, which can easily lead to traffic congestion, air pollution, safety risks, and economic losses.
This paper aims to optimize CAV trajectory at the freeway and urban road junction using a complete and effective optimization method from a more environmentally friendly and open-minded perspective. A Control Zone (CZ) is considered within the whole junction in Figure 1, which is highlighted in yellow. Vehicles can communicate with others and can be controlled from the time that they enter the CZ until they exit the CZ. In order to simplify the description, without losing generality, we take the direction from west to east as the positive direction of the axis.

2.2. Notations

Table 1 shows the related notations and their corresponding meanings. These notations are divided into three categories: the abbreviations of technical terms, parameters, and variables. The abbreviations of the technical terms focus on simplifying road topology. The parameters include geometric parameters, time parameters, and vehicle parameters. Among them, time parameters indicate all time points during the entire travel process of a vehicle.

3. Analysis of Optimal Travel Time and Departure Sequence

As shown in Figure 1, the junction includes three subareas including ORZ, JS, and DI. The first stage of the strategy is the determination of the vehicle travel time and departure sequence. This can be regarded as three optimal time subproblems depending on different topological structures. In the following subsections, we analyze the optimal control approaches for each subarea. Then, a model considering the optimal travel time for the junction is constructed to effectively optimize the performance of the CAV system.

3.1. Optimal Control at ORZ

Regarding ORZ, most research adopts the principle of “arterial road first”; that is, vehicles from the off-ramp give priority to those from the main roads. Based on this rule, the corresponding control methods are developed to optimize the vehicle trajectory from the off-ramp to improve the merging efficiency in the MZ. These methods are advantageous to ensure the continuity and efficiency of traffic flow to some extent. However, it would cause serious traffic delays on the off-ramp.
Benefits from recent successes in landmark trials of CAV technology include information transfers between automobiles in time. While a vehicle enters the CZ, through the Road Side Unit (RSU) or through the on-board communication equipment, the optimized travel trajectory can be obtained. Further, a cruising velocity while passing through the MZ is stipulated for each vehicle, and only one of the vehicles with a merging conflict is allowed to enter the MZ at the same time. When the host vehicle leaves the MZ, the vehicle that is in a merging conflict with the host vehicle is allowed to enter the MZ.
The primary objective is to maximize traffic capacity. In other words, we would like to reduce vehicle travel time as much as possible under the given traffic demands. Assuming the current host vehicle i arrives in the CZ at time t i 1 , the objective can be converted to the issue of determining of the shortest time t i 3 when it leaves the MZ. The time that vehicle i travels through the MZ is set to be fixed to ensure that the vehicle drives through the conflict zone quickly and smoothly; that is, D I / 2 v i ( t i 2 ) . The minimal delay can be achieved by ensuring that t i 2 is as short as possible.
It is non-ignorable for the conflict relationships between the vehicles in the ORZ. If only vehicle i travels in the IZ or has no conflicts with other the vehicles, the minimum value of t i 2 can easily be obtained. In fact, other vehicles, especially the direct leading vehicle, will directly affect the travel behavior of vehicle i. There are two positional relationships between vehicles:
Vehicle Following: Vehicle i and vehicle i − 1 are in the same lane. Here, i − 1 refers to the vehicle directly in front of vehicle i. This implies that the following relationship between the two vehicles needs to be considered. Hence, the two vehicles are forced to meet the minimum safety headway requirement, i.e., t i t i 1 Δ i , t i , t i 1 [ t i 1 , t i 2 ] .
Vehicle Merging: Vehicle i and vehicle i − 1 come from different roads (directions) and have a merging conflict in MZ. Here, vehicle i − 1 is the preceding vehicle. Then, the two vehicles need to meet the requirements of the safe driving sequences, i.e., t i 2 t i 1 2 + 0.5 D I / v i 1 ( t i 1 2 ) .
In addition, when there are no other vehicles that can influence the host vehicle i, the maximum speed limit is the only requirement that needs to be satisfied, i.e., t i 2 t i 1 t i min , where t i min = D C / v max .
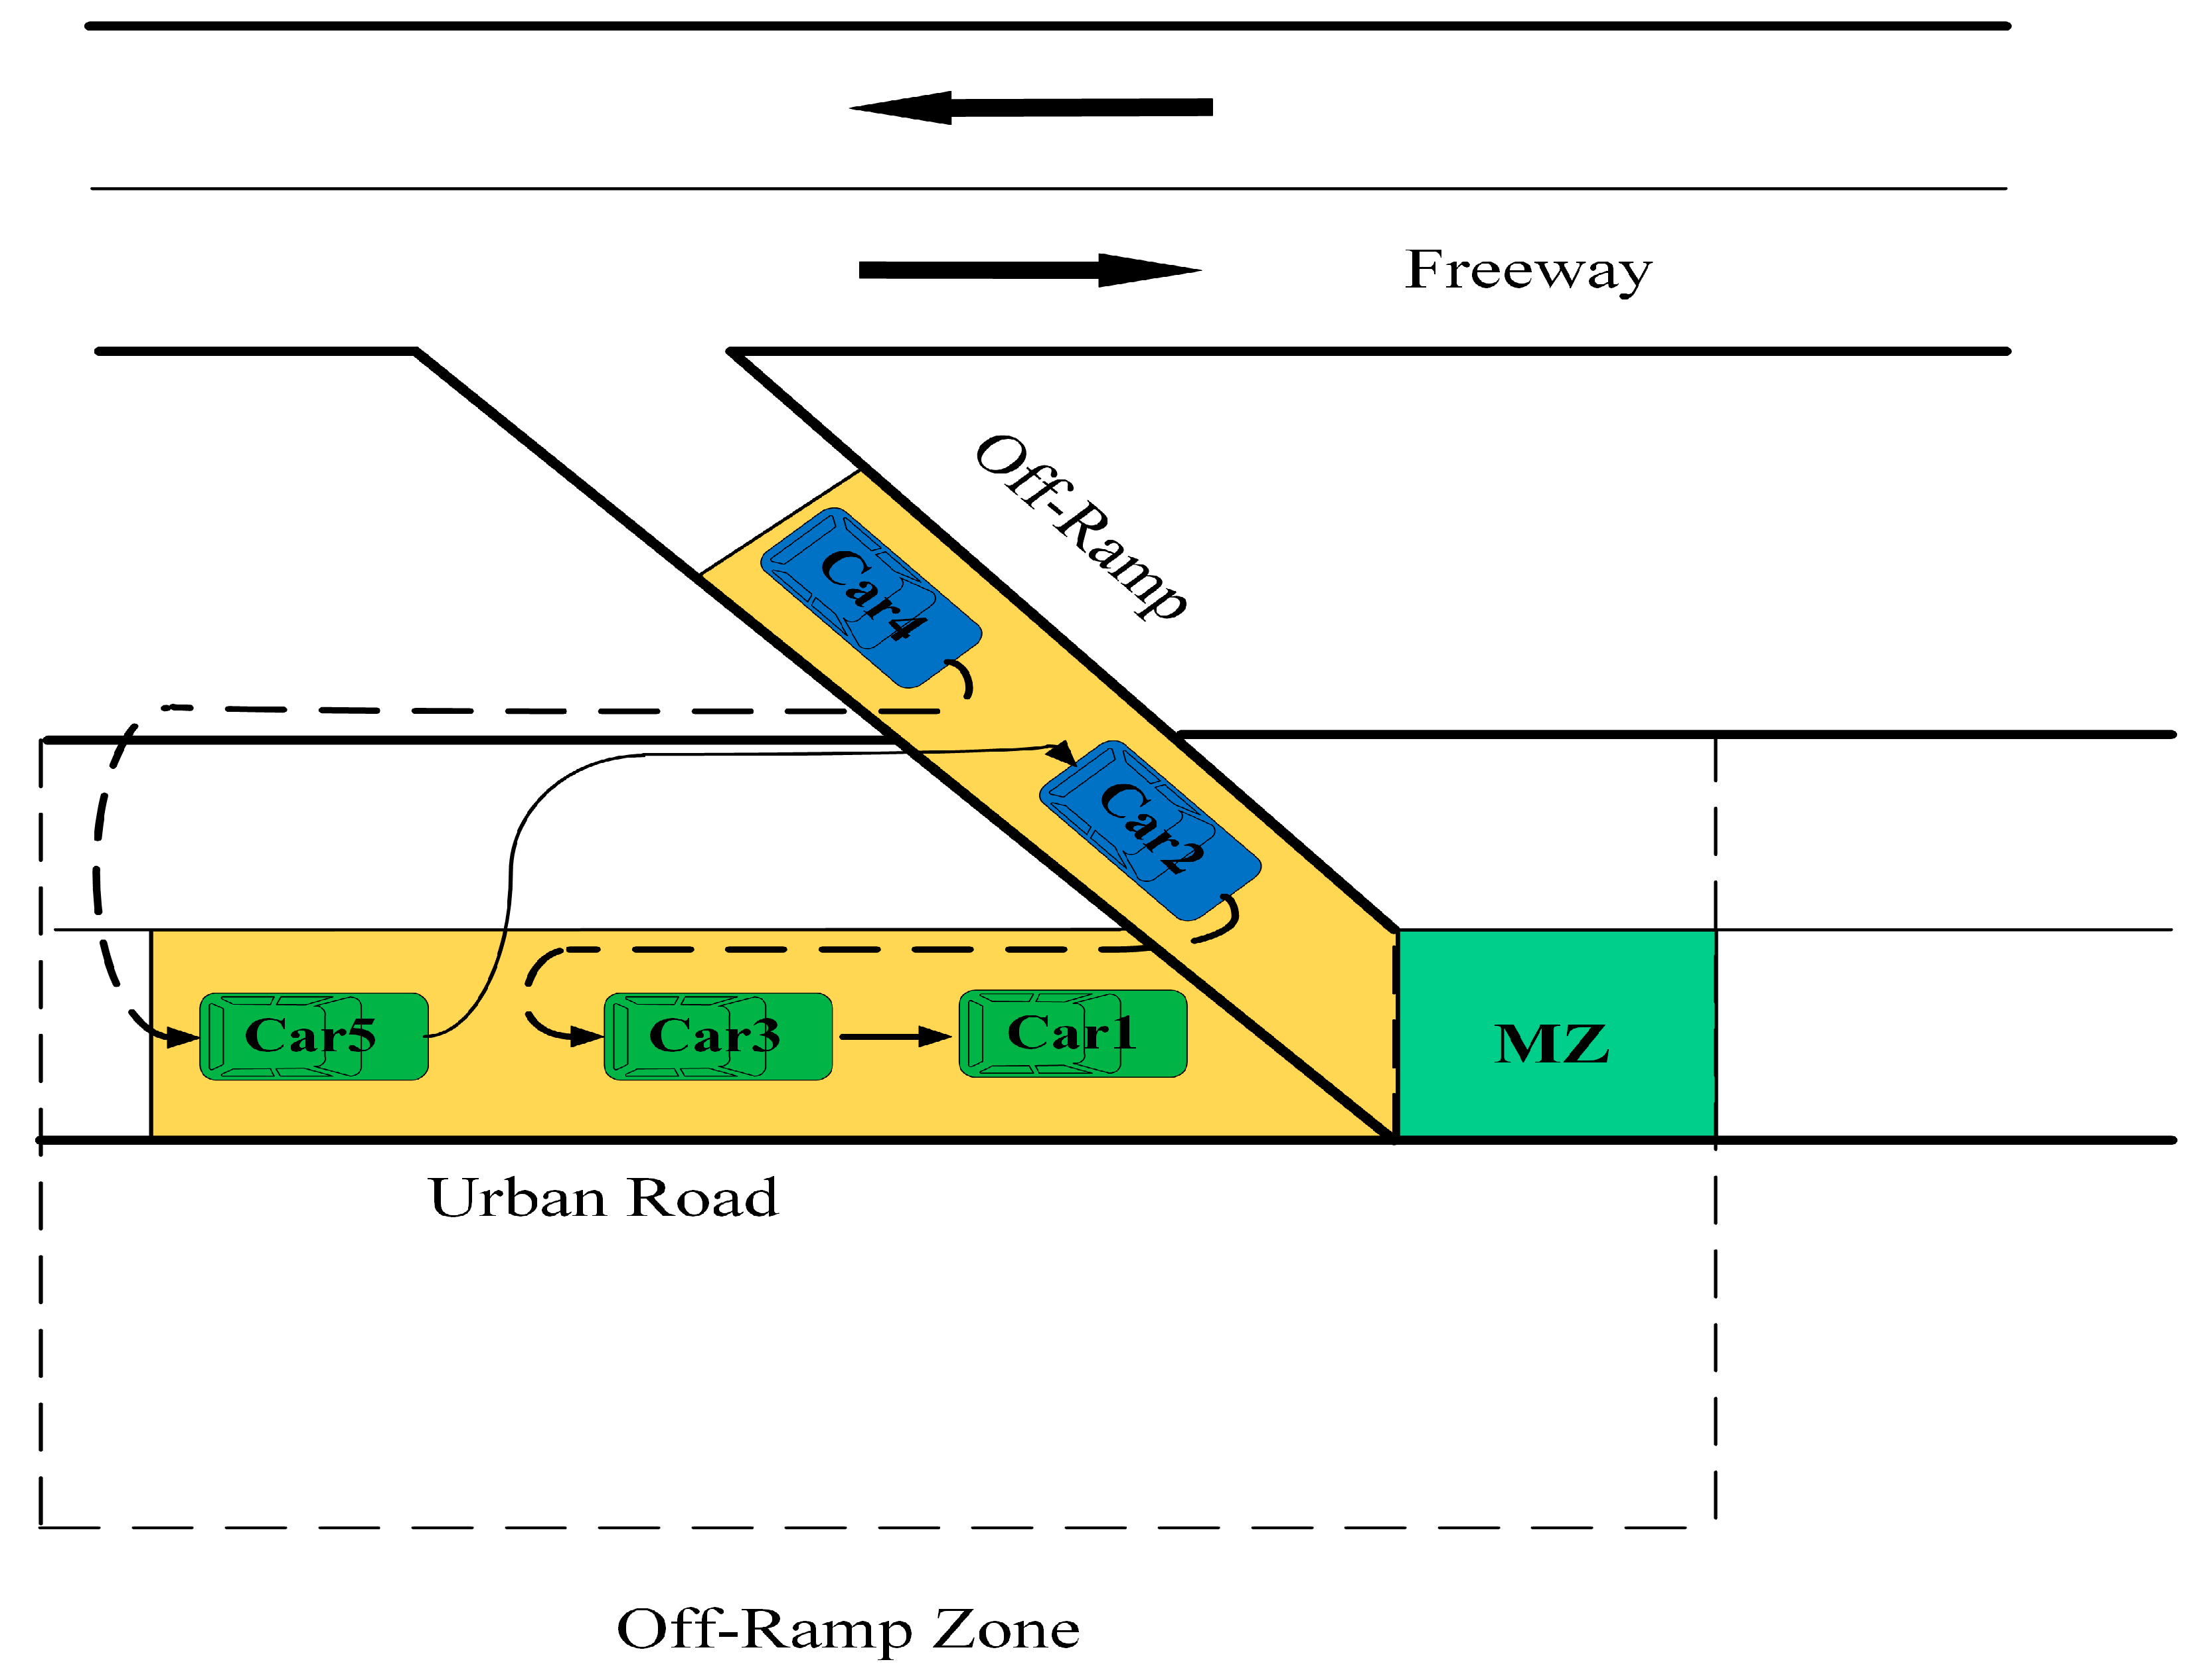
Therefore, when t i 1 is given, the problem is how to determine the vehicle departure sequence and the minimum departure time t i 2 under the constraints of the positional vehicle relationships to achieve the maximum traffic efficiency for all of the vehicles. Here, we do not adopt the usual principle of “urban road vehicle priority”. As mentioned above, this principle ensures less travel time on the urban road network at the expense of secondary road traffic efficiency. As shown in Figure 2, Car1, Car3, and Car5 come from urban roads, and Car2 and Car4 come from freeway off-ramp. The digital indexes represent the distance sequence of vehicles to the MZ at the current moment (or the chronological order of arrival), and the curves represent the following relationships of the 5 vehicles. The solid line and the dotted line denote the following vehicles travelling on the urban roads and off-ramp, respectively. Under the urban road vehicles priority principle, vehicles from the off-ramp should give the priority of entering the MZ only if the gap between two consecutive vehicles on the urban road is large enough. Therefore, the departure sequence is Car1-Car3-Car2-Car5-Car4. It is understandable that the gap between Car3 and Car5 is large enough to allow Car2 to cut in line, even though Car2 arrives earlier than Car3. This will urge Car2 and Car4 to experience a prolonged waiting time before catching sight of the pluggable gaps, which increases traffic delays on the off-ramp. Instead, the First-In-First-Out (FIFO) principle is employed, i.e., if the time t i 1 that vehicle i arrives in the CZ is earlier than the arrival time t j 1 of vehicle j, the departure time for the two vehicles will be t i 2 < t j 2 . As shown in Figure 3, according to the arrival sequence, the departure sequence of vehicles is Car1-Car2-Car3-Car4-Car5. Furthermore, when two vehicles arrive at the same time, we still apply the principle of urban road priority, i.e., if vehicle i coming from urban road and vehicle j coming from off-ramp arrive at the same time ( t i 1 = t j 1 ), let t i 2 < t j 2 .

3.2. Optimal Control at JS

As the carrier of the ORZ and the DI, the JS integrates each subarea into a whole. Vehicles from urban roads or freeway off-ramps merge at the MZ and travel towards the DI through the JS. Considering the various values of v i ( t i 3 ) are bound to affect the operation of the subsequent zones, inspired by [37], the following equation is established:
v i , d e s i r e = D U t i 4 t i 3 = t i 3 t i 4 v i ( t ) d t t i 4 t i 3
where v i , d e s i r e denotes the desired velocity of vehicle i at the JS. Additionally, it can be defined as the constant average velocity of vehicle i. In order to ensure the consecutiveness of automobiles, v i , d e s i r e is forced to equal to v i ( t i 3 ) . In other words, the travel time t i J S can be calculated as long as v i ( t i 3 ) is determined, i.e., t i J S = D U / v i , d e s i r e . The velocity at the JS is not a constant but an average value. The reason for the average velocity is that it is more flexible and beneficial to obtain a better optimal control performance. The velocity of the vehicles can be changed during their trips in accordance with the specific scenario. After all, different combinations of t i 3 and v i ( t i 3 ) can result in diverse velocity trajectories, which will deeply impact the control effect of the whole junction.

3.3. Optimal Control at DI

As shown in Figure 4, the DI is a typical four-way intersection, and each arm is a two-way two-lane road. It should be pointed that the merging zone of the DI is described as the Interweaving Zone (IZ), and the distance of the IZ is D I . Vehicles from different directions interweave here, and vehicles inside of the intersection are reasonably simplified, going straight. Similar to the optimal control principle in the ORZ, given the initial arriving time t i 4 of vehicle i, the task is to explore a way to ensure the minimal time t i 6 that it takes vehicle i to leave the IZ, which might achieve the maximum traffic efficiency of the DI. The travel time for passing through the IZ is fixed since the vehicle travels at a cruise speed ( D I / v i ( t i 5 ) ) in the IZ.
At the DI, there are two kinds of positional vehicle relationships:
Vehicle Following: the minimum safety following time should be met, i.e., t i t i 1 Δ i , t i , t i 1 [ t i 4 , t i 5 ] .
Vehicle Crossing: Vehicle i and vehicle i − 1 come from different directions and have a crossing conflict in the IZ. Here, i − 1 is the proceeding vehicle. These two vehicles must meet the safe passing sequence requirements, i.e., t i 5 t i 1 5 + D I / v i 1 ( t i 1 5 ) .
In addition, vehicle i also needs to meet the maximum speed constraint, i.e., t i 5 t i 4 t i min .
Note that at the ORZ, vehicles with merging conflicts are not allowed to enter the MZ simultaneously, which guarantees driving safety. However, we could not have the same constraint at the DI, as it would waste a lot of time in the system. Due to the fact that the width of the IZ is twice that of the MZ, assuming that the vehicle passes at the same maximum speed, the time needed to pass through the IZ will also be double that of passing through the MZ, which greatly reduces the traffic efficiency. Here, a road meshing method to determine the vehicle passing sequence in the IZ is developed. As shown in Figure 4, the IZ is meshed into four areas of the same size, which are named A, B, C, D in clockwise order. The four entrance arms of the intersection are also ordered in clockwise order, namely from Arm 1 to Arm 4. The travel time of each area is equivalent, e.g., the time that a vehicle coming from Arm 1 to Area A is equal to the time from Arm 2 to Area B. Furthermore, it can be found that even if the vehicle from Arm 1 and another vehicle from Arm 2 arrive at the IZ at the same time, the two vehicles can enter the IZ synchronously without any safety conflicts. According to this characteristic, we can infer that even vehicles coming from the four arms can be allowed to enter the IZ synchronously, which can greatly improve traffic efficiency.

3.4. Determination of Optimal Travel Time

According to the above analysis, the optimal arrival time for vehicle i travelling through the junction is expressed as follows:
t i m * = { t i 1 + t i C Z , 1 , f o r m = 2 t i 2 * + D I 2 v i ( t i 2 ) + t i J S + t i C Z , 2 , f o r m = 5
where t i m * denotes the optimal time when vehicle i arrives at the MZ (m = 2) or the IZ (m = 5). t i J S is the travel time at the JS. t i C Z , 1 and t i C Z , 2 represent the travel time in the CZ belonging to the ORZ and DI, respectively, which can be calculated as follows:
t i C Z , 1 = { t i 1 2 + Δ i t i 1 , f o r f o l l o w i n g s i t u a t i o n t i 1 2 + D I 2 v i 1 ( t i 1 2 ) t i 1 , f o r m e r g i n g s i t u a t i o n t i min , f o r f r e e d r i v i n g s i t u a t i o n
t i C Z , 2 = { t i 1 5 + Δ i t i 4 , f o r f o l l o w i n g s i t u a t i o n t i 1 5 + D I 2 v i 1 ( t i 1 4 ) t i 4 , f o r c r o s s i n g s i t u a t i o n t i min , f o r f r e e d r i v i n g s i t u a t i o n
Therefore, the total travel time in the entire junction and the departure sequence of each vehicle can be calculated recursively.

4. Vehicle Trajectory Optimization

4.1. Objective Function

According to the analysis of Section 3, the vehicle trajectory optimization problem can be converted into an optimal control problem. Further, the optimization objective is to achieve the lowest CAV fuel consumption and to ensure driving comfort. Then, the optimal control model can be established as follows
① System State Equations: Describe the basic operating state of the optimal control system, and differential equations are established to represent the dynamic system.
d i · ( t ) = v i ( t ) , v i · ( t ) = a i ( t ) , a i ( t ) · = j i ( t ) , d i ( t i 1 ) = 0 ,   when   t [ t i 1 , t i 2 ] d i ( t i 4 ) = D C + D U + D I / 2 ,   when   t [ t i 4 , t i 5 ] ,
where d i ( t ) , v i ( t ) , a i ( t ) , and j i ( t ) represent the position, velocity, acceleration, and jerk of vehicle i at time t, respectively. The third-order differential equations describe the logic relationships. Jerk is usually used to indicate driving comfort [38], and acceleration represents the fuel consumption [39]. j i ( t ) is the control variable of the system, and d i ( t ) , v i ( t ) , a i ( t ) are the state variables.
② Performance Index: Evaluates the performance of the system.
O ( j i ( t ) ) = 1 2 t i m t i n ( w 1 a i 2 ( t ) + w 2 j i 2 ( t ) ) d t
where w 1 , w 2 represent the weight coefficients of vehicle acceleration and jerk, respectively, and are normalized as setting w 2 = 1 , then, w 1 = ( j max / a max ) 2 . t i m , t i n denote the time when vehicle i enters and exits the control zone, respectively.
The optimal control problem is to seek min O ( j i ( t ) ) and to ensure v i ( t ) 0 (vehicle is not allowed to reverse in real traffic) and to then obtain the optimal vehicle trajectory.

4.2. Comparison of Solution Methods

There are two methods to solve above problems: one of the solutions is to discretize the continuous-time system and to solve it using Dynamic Programming (DP) [40]. Based on the idea of the optimal value principle, it can be understood as a multi-stage decision-making process. Backward recursion assists in handling the multi-stage issue via discretizing continuous time, state equations, and the performance index. However, the hardest problem might result in a huge calculation and storage burden. In each stage, the state variable value spaces of vehicle i would be discretized as
d i = { d i 1 , d i 2 , , d i s d } v i = { v i 1 , v i 2 , , v i s v } a i = { a i 1 , a i 2 , , a i s a } ,
Similarly, the control variable value space would be discretized as
j i = { j i 1 , j i 2 , , j i c } ,
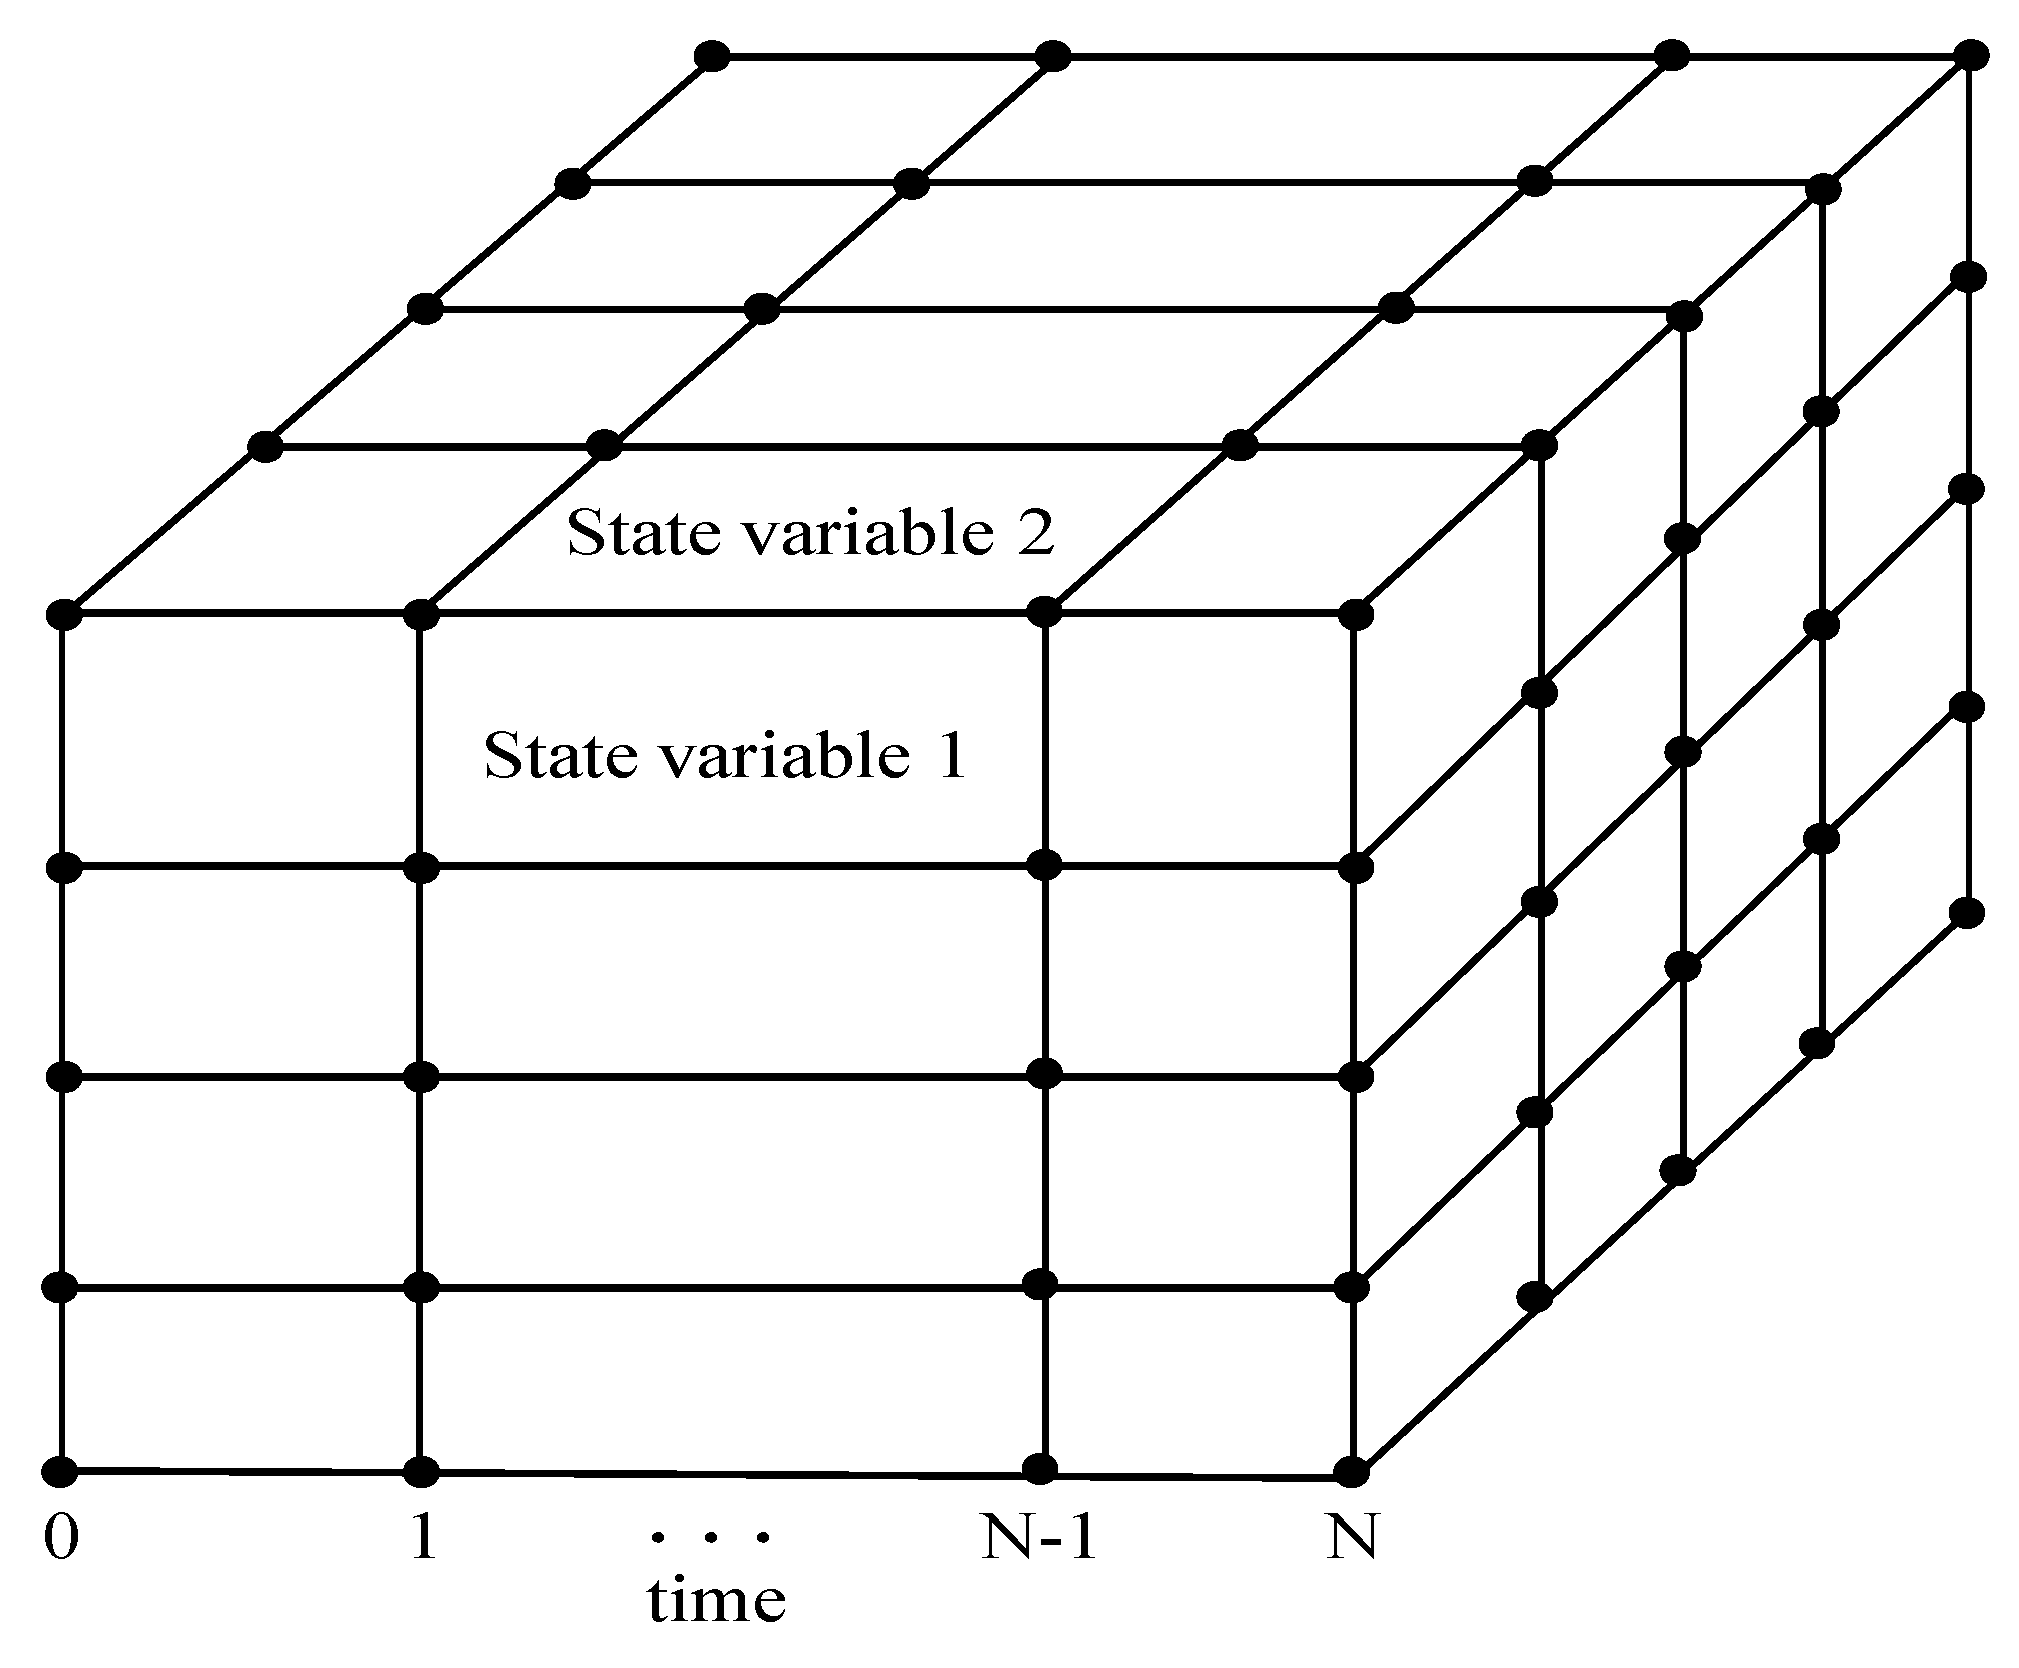
Assuming that the number of the stage (or number of discrete time points) is N, it needs to calculate the performance index s d × s v × s a × c × N time at each state. Figure 5 shows the storage capacity of the two-dimensional state space. It indicates that the amount of data is the “Curse of Dimensionality” [41]. Though several theories have been applied to optimize such problem, including Adaptive Critic Design [42] and Neuro-Dynamic Programming [43], that is not in the scope of our research. Instead, Pontryagin’s Minimum Principle (PMP) provides us with a more convenient method to complete the solution.
As another principle of the Optimal Control Theory, PMP is based on the classical variational method. It performs satisfactorily in solving general nonlinear optimal control problems with the equality or inequality constraints of control variables and state variables. The idea of the analytic solution allows us to avoid the problem of the “Curse of Dimensionality”. In order to mitigate the complexity and the difficulty of the algorithm, we employed the PMP theory to solve tour model.

4.3. Solution of Function without Constraints

The Hamiltonian equation for this issue is:
H i = 1 2 ( w 1 a i 2 ( t ) + w 2 j i 2 ( t ) ) + λ i d v i ( t ) + λ i v a i ( t ) + λ i a j i ( t ) ,
where λ i d , λ i v , λ i a are the covariates.
As mentioned before, the basic velocity constraint is v i ( t ) 0 , and the Lagrange multiplier is used to add this basic constraint to the Hamiltonian equation. Then, (9) can be rewritten as follows:
H i = 1 2 ( w 1 a i 2 ( t ) + w 2 j i 2 ( t ) ) + λ i d v i ( t ) + λ i v a i ( t ) + λ i a j i ( t ) + μ i ( v i ( t ) )
where μ i is the Lagrange multiplier with
μ i = { > 0 , v i ( t ) = 0 = 0 , v i ( t ) > 0
Hence, the target, with regard with the minimal value of O ( j i ( t ) ) , would convert to minimize H i .
The canonical equations of the system are
λ i d · = H i d i = 0
λ i v · = H i v i = { λ i d , v i ( t ) > 0 λ i d + μ i , v i ( t ) = 0
λ i a · = H i a i = ( w 1 a i ( t ) + λ i v )
First of all, we ignore v i ( t ) = 0 , which will be analyzed in the next section. As such, Formula (13) is simplified to:
λ i v · = H i v i = λ i d
The necessary condition for Formula (9) to take extremum is
H i j i = w 2 j i ( t ) + λ i a = 0
Based on the above Equations (10), (12), and (14)–(16), we can obtain
λ i d = b 1
λ i v = b 1 t b 2
λ i a = w 1 w 2 b 3 e w 1 w 2 t + w 1 w 2 b 4 e w 1 w 2 t b 1 w 2 w 1
j i * ( t ) = w 1 w 2 b 3 e w 1 w 2 t w 1 w 2 b 4 e w 1 w 2 t + b 1 w 1
a i * ( t ) = b 3 e w 1 w 2 t + b 4 e w 1 w 2 t + b 1 w 1 t + b 2 w 1
v i * ( t ) = w 2 w 1 b 3 e w 1 w 2 t w 2 w 1 b 4 e w 1 w 2 t + b 1 2 w 1 t 2 + b 2 w 1 t + b 5
d i * ( t ) = w 2 w 1 b 3 e w 1 w 2 t + w 2 w 1 b 4 e w 1 w 2 t + b 1 6 w 1 t 3 + b 2 2 w 1 t 2 + b 5 t + b 6
where b 1 , b 2 , b 3 , b 4 , b 5 , b 6 are undetermined parameters that can be obtained according to the initial and final conditions of the system.
The above Equations (20)–(23) are the general solutions to the vehicle control problem. When the constraints are not activated, the optimal vehicle trajectory can be obtained by solving the above formulas.

4.4. Vehicle Velocity Minimum Limit Activated

In the above analysis, we assume that the minimum velocity limit is not activated, which that means v i ( t ) = 0 does not occur. However, a trajectory segment may exist where the vehicle velocity is negative when the velocity formula is solved, which is not allowed in reality (vehicle is not allowed to drive backwards). Therefore, once the optimized vehicle velocity violates the constraint, the vehicle velocity minimum limit will be activated to replace this trajectory segment with parking, which ensures v i ( t ) 0 . Furthermore, the optimal vehicle trajectory results can be obtained via compartmentalizing the general solution with multiple solutions for acceleration, parking, and deceleration segments under the velocity constraint.

4.5. Vehicle Following Constraint Activated

The vehicle following constraint is a necessary prerequisite for the safety pilot. A reasonable following gap can not only avoid rear-end collisions, but also prevent the decrease of traffic efficiency caused by an excessive vehicle gap. One of the strategies is to combine the vehicle following constraint with the Hamlitonian equation with the specification of the Lagrange multipliers to solve the optimal trajectory problem [44], which would result in the formula being more complicated. Other methods apply the shadow trajectory of the preceding vehicle under the previous constraint [45,46]. Hence, considering the complexity of the model, the latter method is adopted.
The shadow trajectory of vehicle i indicates the safe headway g a p min + l that other vehicles need to maintain with vehicle i, where g a p min refers to the minimum gap of two vehicles, and l refers to the length of vehicle. When d i ( t ) d i 1 ( t ) > g a p min + l , vehicle i does not violate the shadow trajectory of its proceeding vehicle i − 1, so vehicle i can follow the planned trajectory. Moreover, vehicle i violates the shadow trajectory of its proceeding vehicle i − 1 during this time period t i t i β , leading to d i ( t ) d i 1 ( t ) g a p min + l . Therefore, let t i γ = ( t i + t i β ) / 2 and optimize the vehicle trajectory during t i 1 t i γ and t i γ t i 2 . The algorithm would repeat the above steps until satisfying the vehicle following constraint.

5. Parameters Analysis and Simulation Evaluation

5.1. Model Correlation Coefficients Analysis and Solution

We have obtained the general trajectory equations for vehicles through PMP. However, it contains several undetermined coefficients. The purpose of this section is to solve these unknown coefficients through the initial and final states of the system.
For the ORZ, the initial and final states of the control problem include:
d i ( t i 1 ) = D 0 , d i ( t i 2 ) = D 0 + D C , v i ( t i 1 ) = v 0 , v i ( t i 2 ) = v d , a i ( t i 1 ) = a 0 , a i ( t i 2 ) = a d
where D 0 represents the initial position of vehicle i when it enters the control zone of the ORZ. We set the initial position of the control zone at ORZ as the coordinate origin, and set the east direction as the positive direction of the x-axis, i.e., D 0 = 0 . v 0 , v d represent the initial and final velocity of vehicle i, respectively. The allowable maximum velocity is designated as the initial velocity to reduce vehicle travel time, i.e., v 0 = v d = v max . a 0 , a d represent the initial and final acceleration of vehicle i and a 0 = a d = a max .
Since the undetermined coefficients of the ORZ vehicle trajectory optimization equations are b 1 , b 2 , b 3 , b 4 , b 5 , b 6 , by substituting the above six known initial and final states (24) into the trajectory Equations (20–23), the corresponding analytical results can be obtained as follows:
a i ( t i 1 ) = b 3 e w 1 w 2 t i 1 + b 4 e w 1 w 2 t i 1 + b 1 w 1 t i 1 + b 2 w 1
a i ( t i 2 ) = b 3 e w 1 w 2 t i 2 + b 4 e w 1 w 2 t i 2 + b 1 w 1 t i 2 + b 2 w 1
v i ( t i 1 ) = w 2 w 1 b 3 e w 1 w 2 t i 1 w 2 w 1 b 4 e w 1 w 2 t i 1 + b 1 2 w 1 ( t i 1 ) 2 + b 2 w 1 t i 1 + b 5
v i ( t i 2 ) = w 2 w 1 b 3 e w 1 w 2 t i 2 w 2 w 1 b 4 e w 1 w 2 t i 2 + b 1 2 w 1 ( t i 2 ) 2 + b 2 w 1 t i 2 + b 5
d i ( t i 1 ) = w 2 w 1 b 3 e w 1 w 2 t i 1 + w 2 w 1 b 4 e w 1 w 2 t i 1 + b 1 6 w 1 ( t i 1 ) 3 + b 2 2 w 1 ( t i 1 ) 2 + b 5 t i 1 + b 6
d i ( t i 2 ) = w 2 w 1 b 3 e w 1 w 2 t i 2 + w 2 w 1 b 4 e w 1 w 2 t i 2 + b 1 6 w 1 ( t i 2 ) 3 + b 2 2 w 1 ( t i 2 ) 2 + b 5 t i 2 + b 6
According to (25)–(30), the corresponding trajectory equation expressions can be obtained.
Similarly, the trajectory equation expressions of DI can be calculated.

5.2. Control Framework

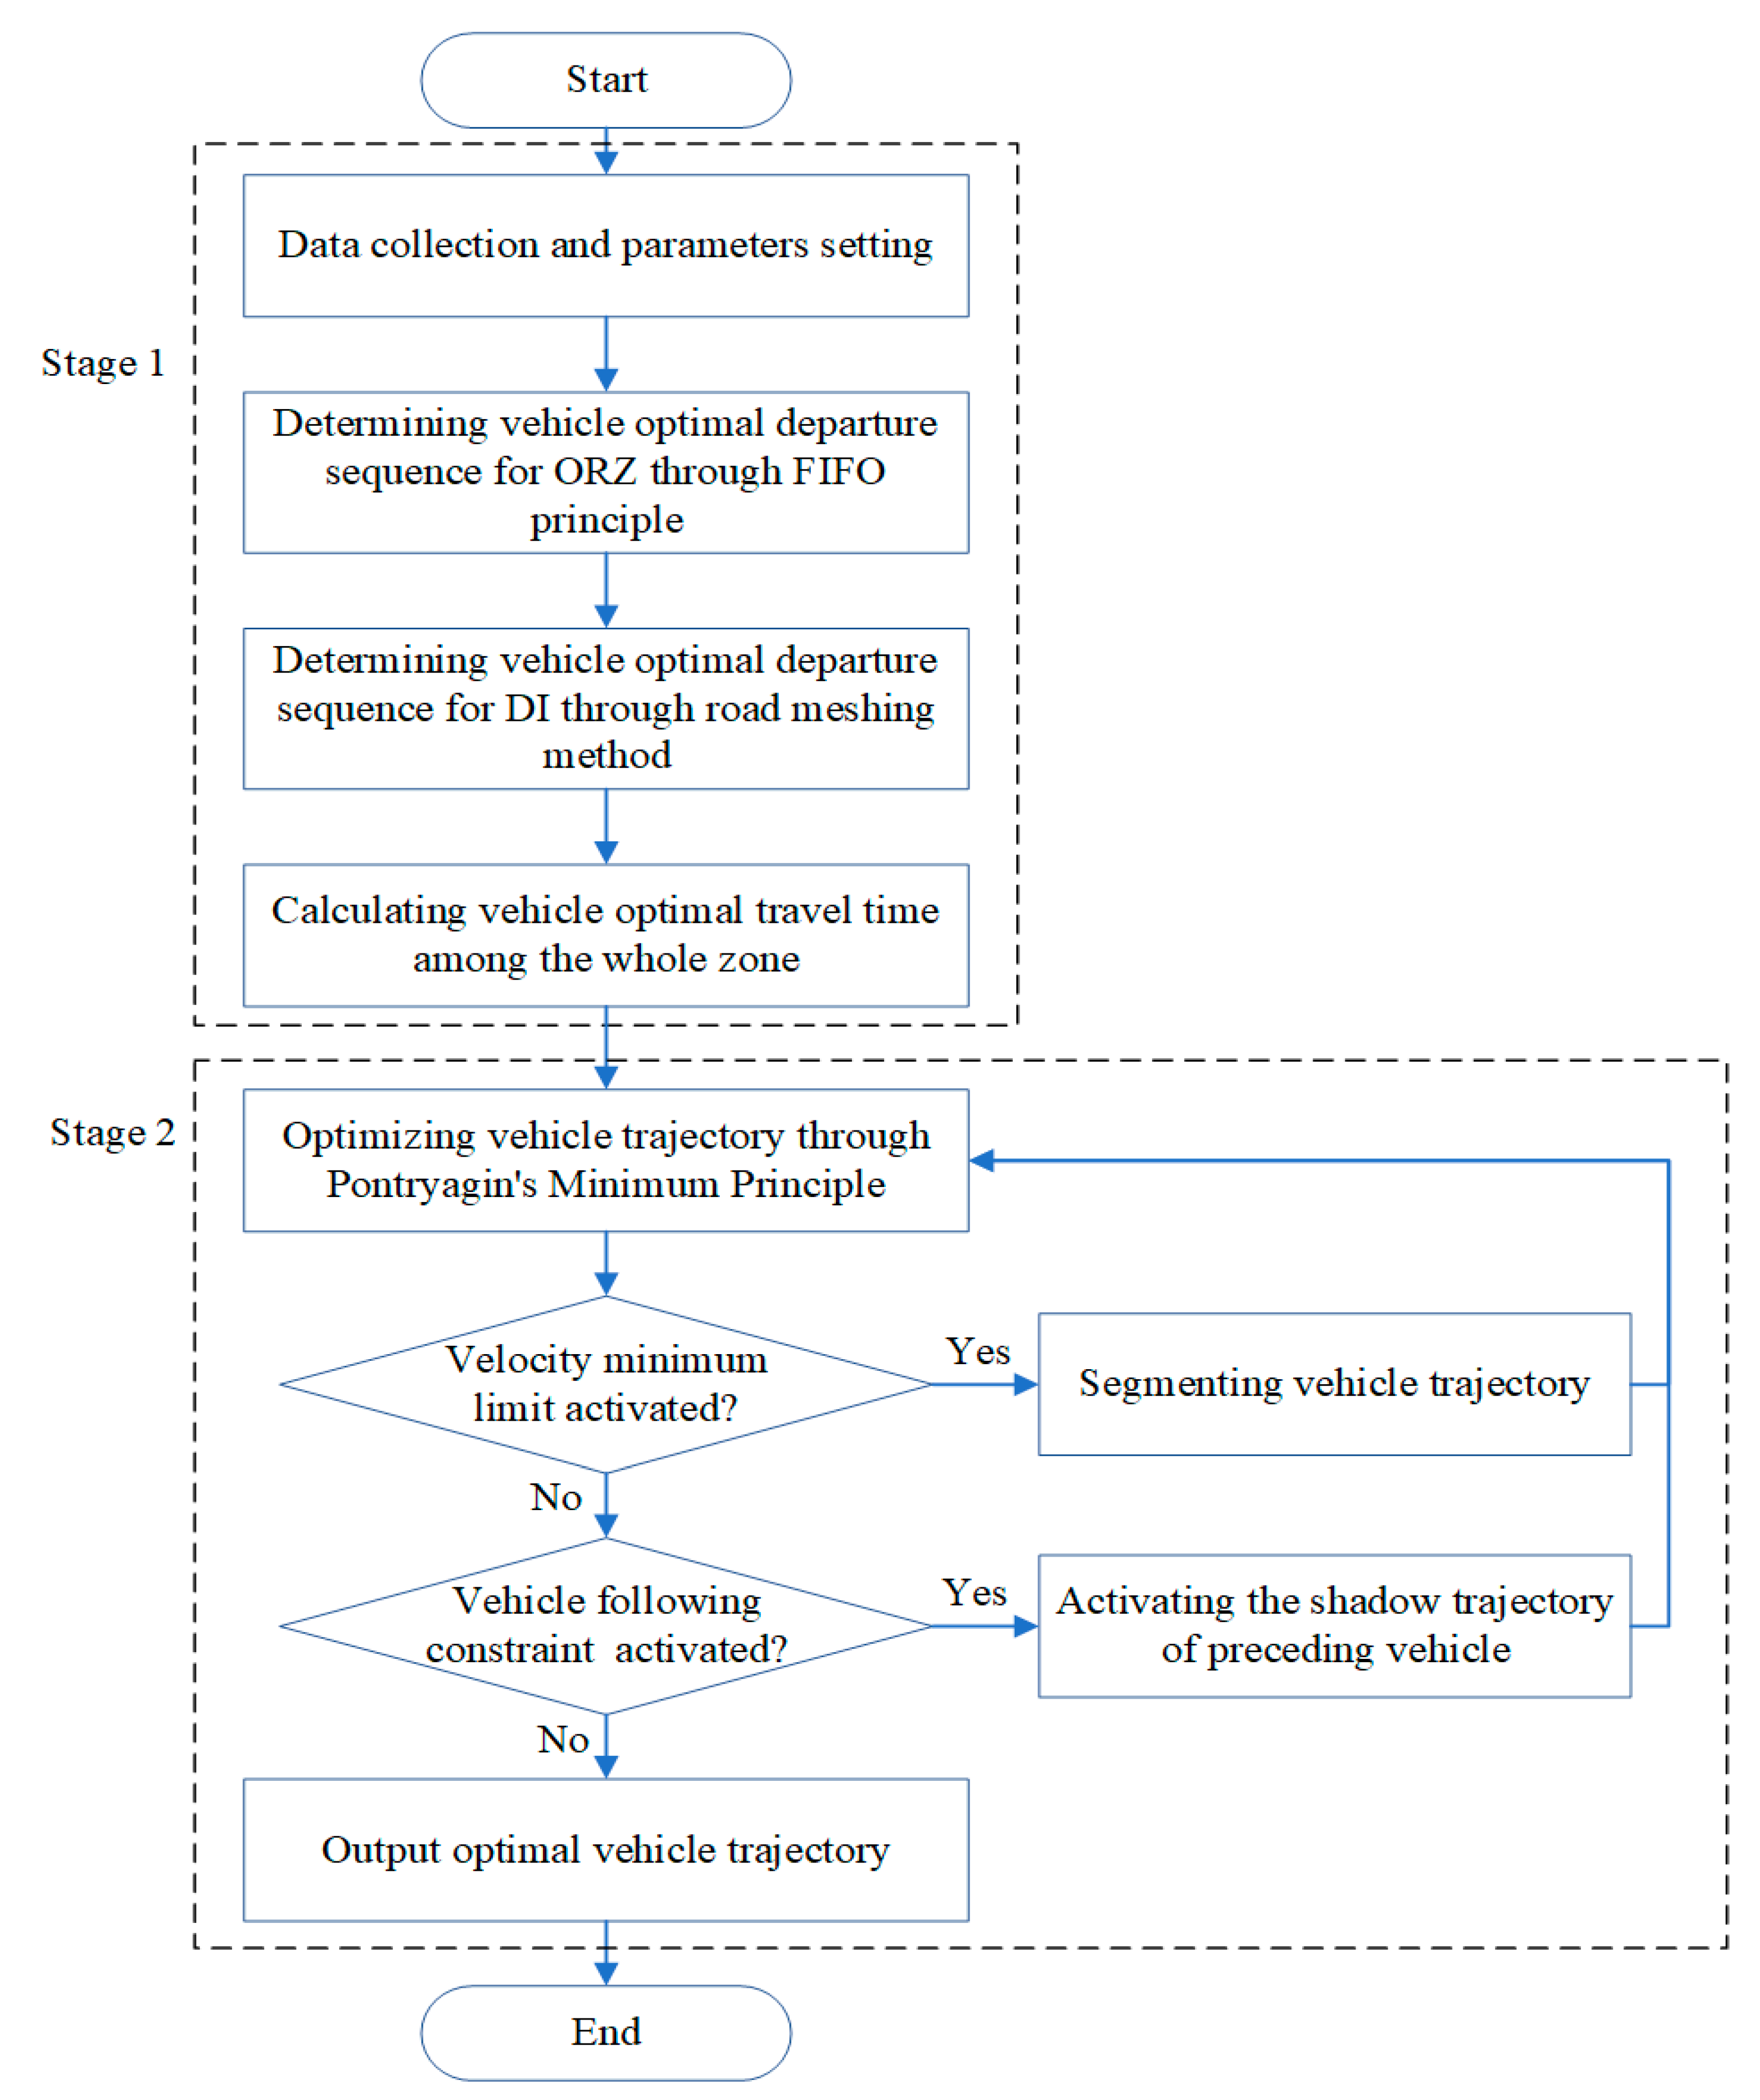
Figure 6 shows the control structure of the proposed CAV trajectory optimization strategy. The control process consists of two stages, including vehicle travel time determination and vehicle trajectory optimization. In Stage 1, different vehicle travel time determination methods are applied to determine the vehicle’s optimal departure sequence and time considering the different topological structures of the subarea. The optimal vehicle trajectory is calculated through PMP in Stage 2.

5.3. Simulation Results Evaluation

In order to evaluate the feasibility of the proposed vehicle trajectory optimization strategy, we employed MATLAB and VISSIM to construct a joint simulation framework. Within the framework, MATLAB is used to iteratively calculate each vehicle optimal trajectory while travelling through the junction. VISSIM, a micro traffic simulation software, is linked with MATLAB through the COM interface to execute the optimal trajectory, which is where the testing network is developed. The simulation results, including fuel consumption and vehicle delay, are compared for different strategies. Furthermore, Microsoft Visual Studio Community 2020 was employed to compile C++ code and to build Dynamic Link Library (DLL) files. By using this External Driver Model DLL in VISSIM, we can modify the vehicle behaviors for CAVs.

5.3.1. Selection of Comparison Strategies

Two other strategies are considered for comparison with the proposed strategy.
Benchmark: among this scenario, vehicles travel along the junction and only following the default driving model of VISSIM, which is used to simulate human driving behavior.
Cooperative Adaptive Cruise Control (CACC): A CACC system is the combination of automated velocity control with a cooperative element, such as vehicle-to-vehicle (V2V) and infrastructure-to-vehicle (I2V) communication [47]. It takes advantage of advanced CAV technologies to improve safety, improve traffic flow dynamics by damping disturbances, save energy, and so on, and its effectiveness has been proven by [48]. The model parameters are also borrowed from [48].

5.3.2. Simulation Parameters

The road parameters are D C = 300   m , D U = 100   m . The relevant vehicle dynamics parameters are all vehicles are homogeneous, the maximum speed v max = 20   m / s , the minimum speed v min = 0   m / s , the maximum acceleration a max = 5   m / s 2 , the minimum acceleration a min = 5   m / s 2 , the maximum jerk j max = 4   m / s 3 , and the minimum jerk j min = 4   m / s 3 . Other related parameters are the minimum safe following time headway Δ i = 1   s and the vehicle length l = 3.5   m .
A simulation network was established in VISSIM. The network consists of a freeway and an urban road connected by an off-ramp. Note that the default following model is based on the physiological–psychological driving behavior model, which is also called the Wiedemann 74 model. The initial vehicle states are subject to the default generation rules of VISSIM to show real traffic behavior. There are three cases with different traffic demands for the urban road that are considered, including 900   v e h / h , 1100   v e h / h , and 1300   v e h / h . Moreover, the traffic demands of the off-ramp and the secondary roads of the downstream intersection, including Arm 2 and Arm 4 is attached to 700   v e h / h .

5.3.3. Metrics for Evaluation

Two metrics are considered to evaluate the efficiency of the proposed strategy, including vehicle delay and fuel consumption.
Vehicle delay is a primary indicator to assess the efficiency of traffic operation, which can be represented as follows:
t i d = t i a L i v i d e s
where t i d is the delay time of vehicle i. t i a , L i represent the actual travel time and the travel distance of vehicle i, respectively. v i d e s is the desired velocity, which usually equals to the maximum allowable velocity.
Fuel consumption is another important indicator to judge the control strategy. In the objective function of the proposed model, fuel consumption is approximated by the square of acceleration. Here, a more accurate fuel consumption calculation method is introduced. According to the studies of [8] and [39], the fuel consumption rate is determined by vehicle acceleration and velocity:
E = { 0 , a < 0 0 n r n v n , a = 0 0 n r n v n + R 0 s p s v s , a > 0
where E is the fuel consumption rate; when the vehicle decelerates ( a < 0 ), it does not consume fuel. When the vehicle drives at a constant speed ( a = 0 ), the fuel consumption rate is a fixed value, and when the vehicle accelerates ( a > 0 ), extra fuel is consumed due to the increasing of speed. r n represents speed coefficient of the vehicle at a cruise speed, where n = 0 , 1 , 2 , 3 and correspondingly, w 0 = 0.1569 , w 1 = 2.450 × 10 2 , w 2 = 7.415 × 10 4 , w 3 = 5.975 × 10 5 . p s represents acceleration coefficient, where n = 0 , 1 , 2 and correspondingly, p 0 = 7.224 × 10 2 , p 1 = 9.681 × 10 2 , p 2 = 1.075 × 10 4 . R = a γ g ( 1 / 2 M ) C D ρ A A v v 2 . The rolling resistance coefficient of the wheels γ = 0.015 , the gravity acceleration g = 9.8   m / s 2 , the vehicle mass M = 1200   kg , the drag coefficient C D = 0.32 , the fluid density ρ A = 1.184   k g / m 2 , and the front area of the vehicle A v = 2.5   m 2 .

5.3.4. Computing Efficiency Evaluation

Experiments were conducted on a computer (Inter (R) i5-4460, CPU @2.3 GHZ) to evaluate the computational efficiency of the proposed strategy with the DP solution. Time, state variables, and control variables were discretized by iteration computation. The discrete time step was set to be 0.1 s.
Table 2 shows the average computational time of each vehicle under different traffic demands for the two methods. This clearly proves the low computational complexity of using PMP instead of DP, and especially with the rising of traffic demands, the calculation time of DP increases drastically.

5.3.5. Comparative Analysis of Optimization Results

In order to verify the benefits of our proposed strategy, we investigated distance, speed, and acceleration profiles of the three strategies, the including benchmark, CACC, and the proposed strategy.
Figure 7, Figure 8 and Figure 9 show the distance, speed, and acceleration profiles of the benchmark, CACC strategy, and the proposed strategy with medium traffic demand ( 1100   v e h / h ), respectively. Without loss of generality, 25 vehicles that come from upstream of the urban road network or off-ramp (the dotted line and solid line represent vehicles from the off-ramp and from upstream of urban roads, respectively) are intercepted from the whole simulation to display. That means that the initial states of these 25 vehicles shown in Figure 7, Figure 8 and Figure 9 are identical. Only the diversity of the control strategies causes entirely different trajectory profiles.
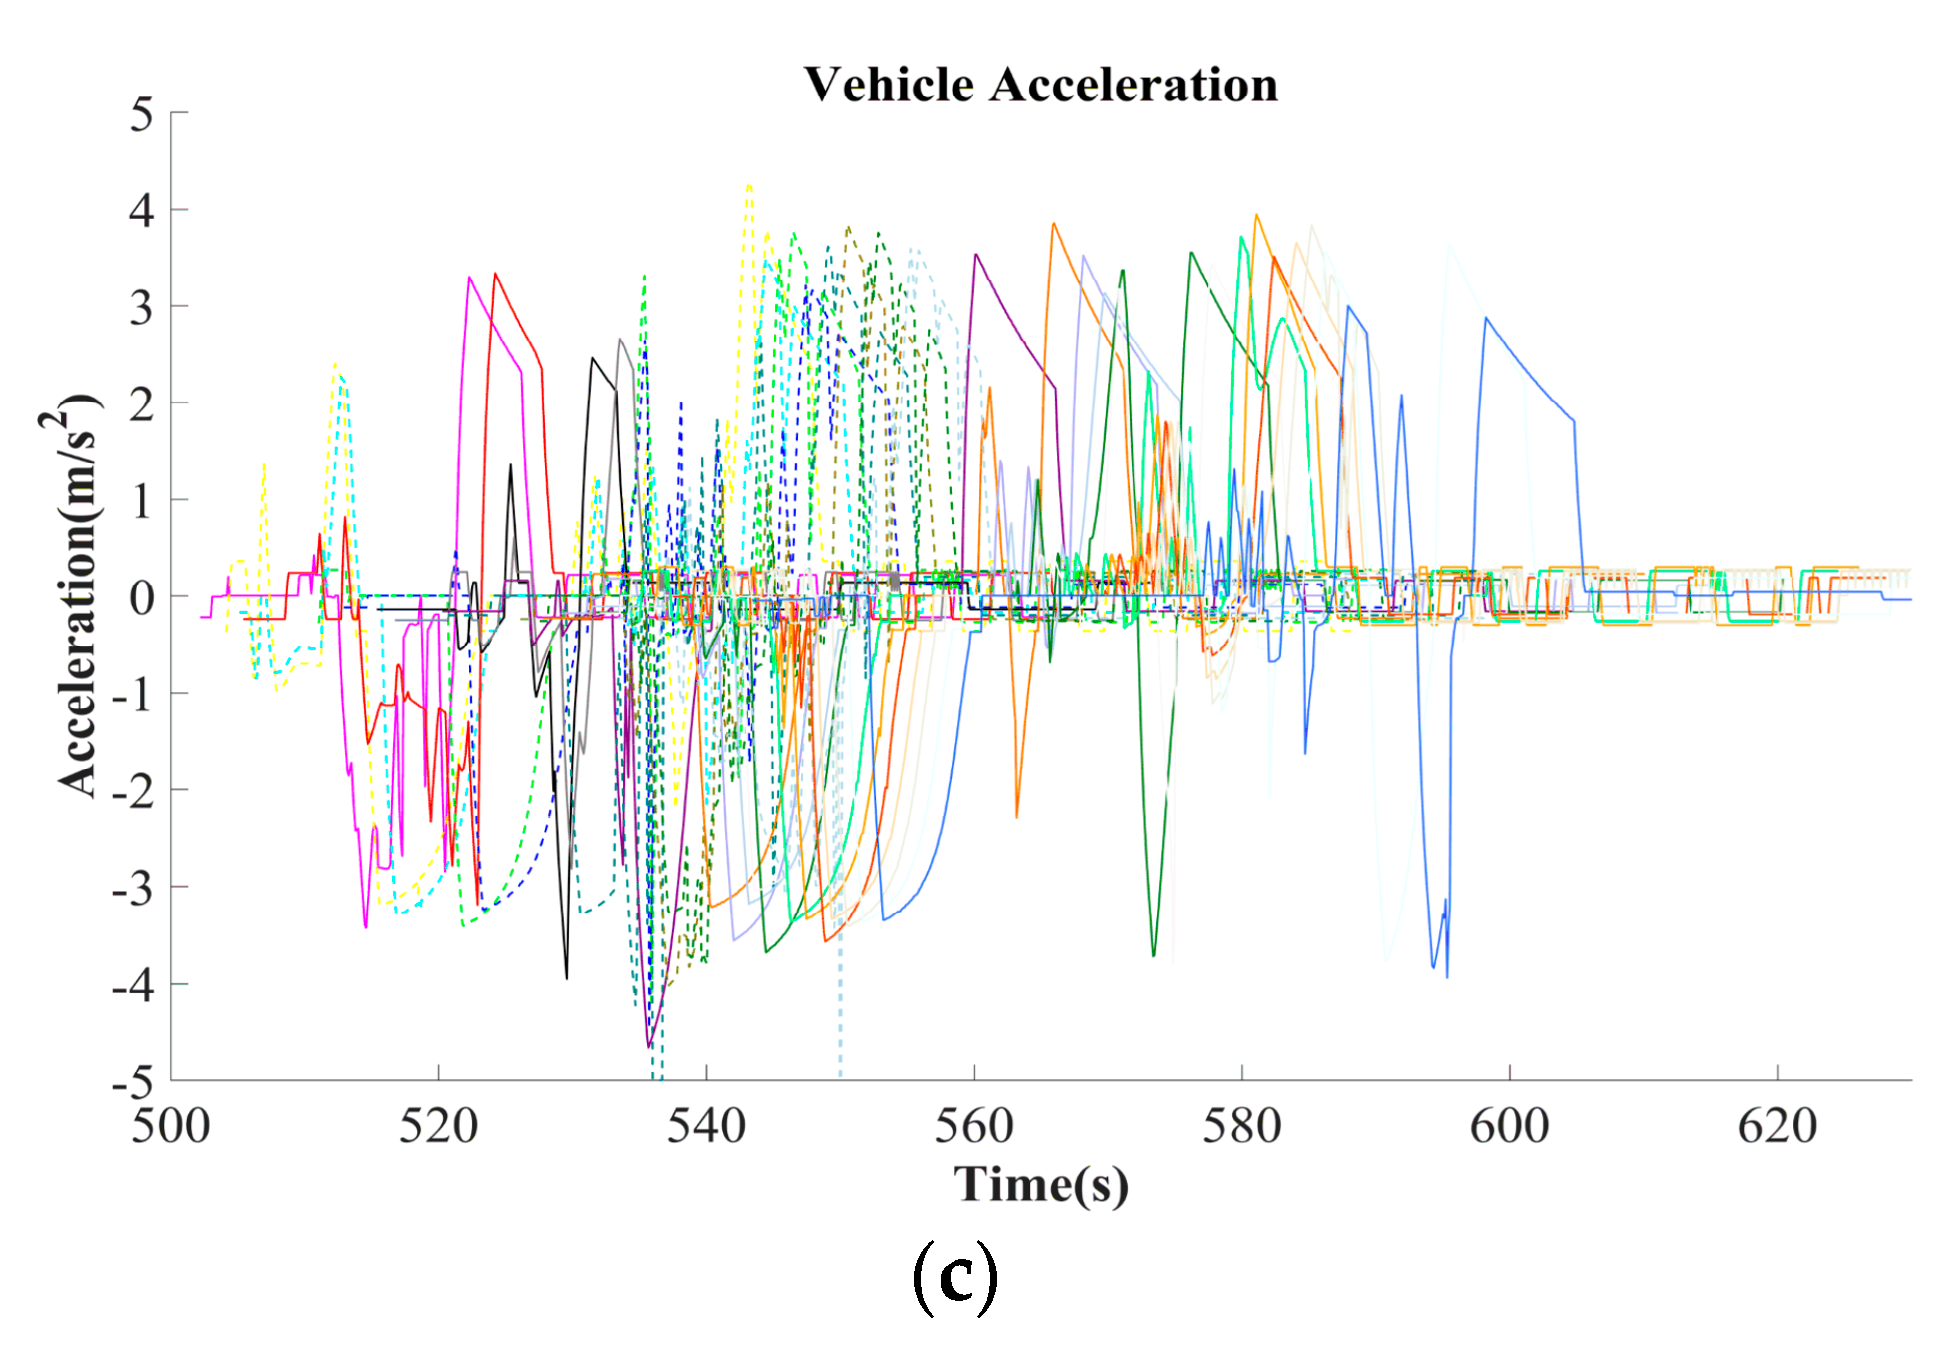
Figure 7 indicates that the trajectory profiles fluctuate frequently, especially near the MZ. This is because the MZ is a critical bottleneck of the junction. When the two traffic flows merge, it will inevitably cause serious congestion if appropriate control measures are not taken. As shown in Figure 7a, most vehicles must stop at the upstream portion of the MZ and must wait a longer time before crossing the area. However, it also that shows such vehicles need almost no waiting to pass the IZ. This has to do with the passing rules of the roads we set. The passing rule of the IZ is set as “main road priority” (vehicles coming from Arm 2 and Arm 4 should make way for these cars from Arm 1 and Arm 3). Even so, as shown in Figure 7b,c, many vehicles still need to accelerate and decelerate frequently, and the deceleration boundary value even reaches 5   m / s 2 .
As shown in Figure 8, the vehicle trajectory controlled by the CACC strategy is smoother than the benchmark, and fewer vehicles need to stop. However, Figure 8a shows fluctuations still exist at the position of 700 –730 m. This is mainly because of the dramatic increase in vehicles at the IZ. Figure 8b also implies this characteristic at about 550 s, when the speed of some vehicles drops to almost 0 to give way to the vehicles coming from other roads. Even though the vehicles can communicate with each other to adjust their trajectory in a timely manner, this strategy cannot handle this situation well when the number of vehicles increases dramatically.
According to Figure 9, we can find that each vehicle trajectory under the control of the proposed strategy is smooth. Vehicles from both off-ramp and urban road interflow are orderly at MZ and travel along the urban roads. Furthermore, these vehicles are hardly affected by the vehicles coming from the secondary roads (Arm 2 and Arm 4) at the IZ. This benefit is from the determination of the optimal travel time that we employed. Each vehicle can travel among the whole area with relatively high speed (all higher than 15   m / s ), which is clearly manifested from Figure 9b. It should be noted that it seems that there are less than 25 vehicle speed profiles in Figure 9b. This is because several vehicles can maintain the desired speed at all times, so these profiles overlap. Additionally, Figure 9c shows that the change in vehicle speed is small; in other words, the acceleration and deceleration process is unabiding. Even the speed when vehicles travel near the merging zone or interweaving zone is high, which means such strategy eliminates the stop-and-go phenomenon caused by the complex traffic behavior of intersection or confluence areas.
In short, according to the 25 vehicle profiles shown in Figure 7, Figure 8 and Figure 9, we find the proposed strategy competent to handle the vehicle trajectory optimization problem for these junctions. It almost eliminates the traffic fluctuations and enables vehicles to maintain a higher speed to travel along the road.
Figure 10 shows average fuel consumption and delays in each zone for different control scenarios under medium traffic demands. The results are calculated based on the same vehicle arrival situation as described in Figure 7, Figure 8 and Figure 9. The proposed strategy performs better than the other two strategies in each zone in terms of fuel consumption and delays. As show in Figure 10a, the average fuel consumption per second for each vehicle optimized by the proposed strategy in the three zones is almost the same, and both are kept lower. That further means that vehicles can drive through each zone smoothly. To sum up, the proposed strategy reduces average fuel consumption by 37.1–49.1% in different zones compared to the benchmark and by 23.3–36.4% compared to CACC. Moreover, Figure 10b also indicates that vehicles can drive through each zone more quickly under the proposed strategy than under other strategies. The proposed strategy reduces average delays by 57.8–77.4% in different zones compared to the benchmark and by 52.9–63.8% compared to CACC.
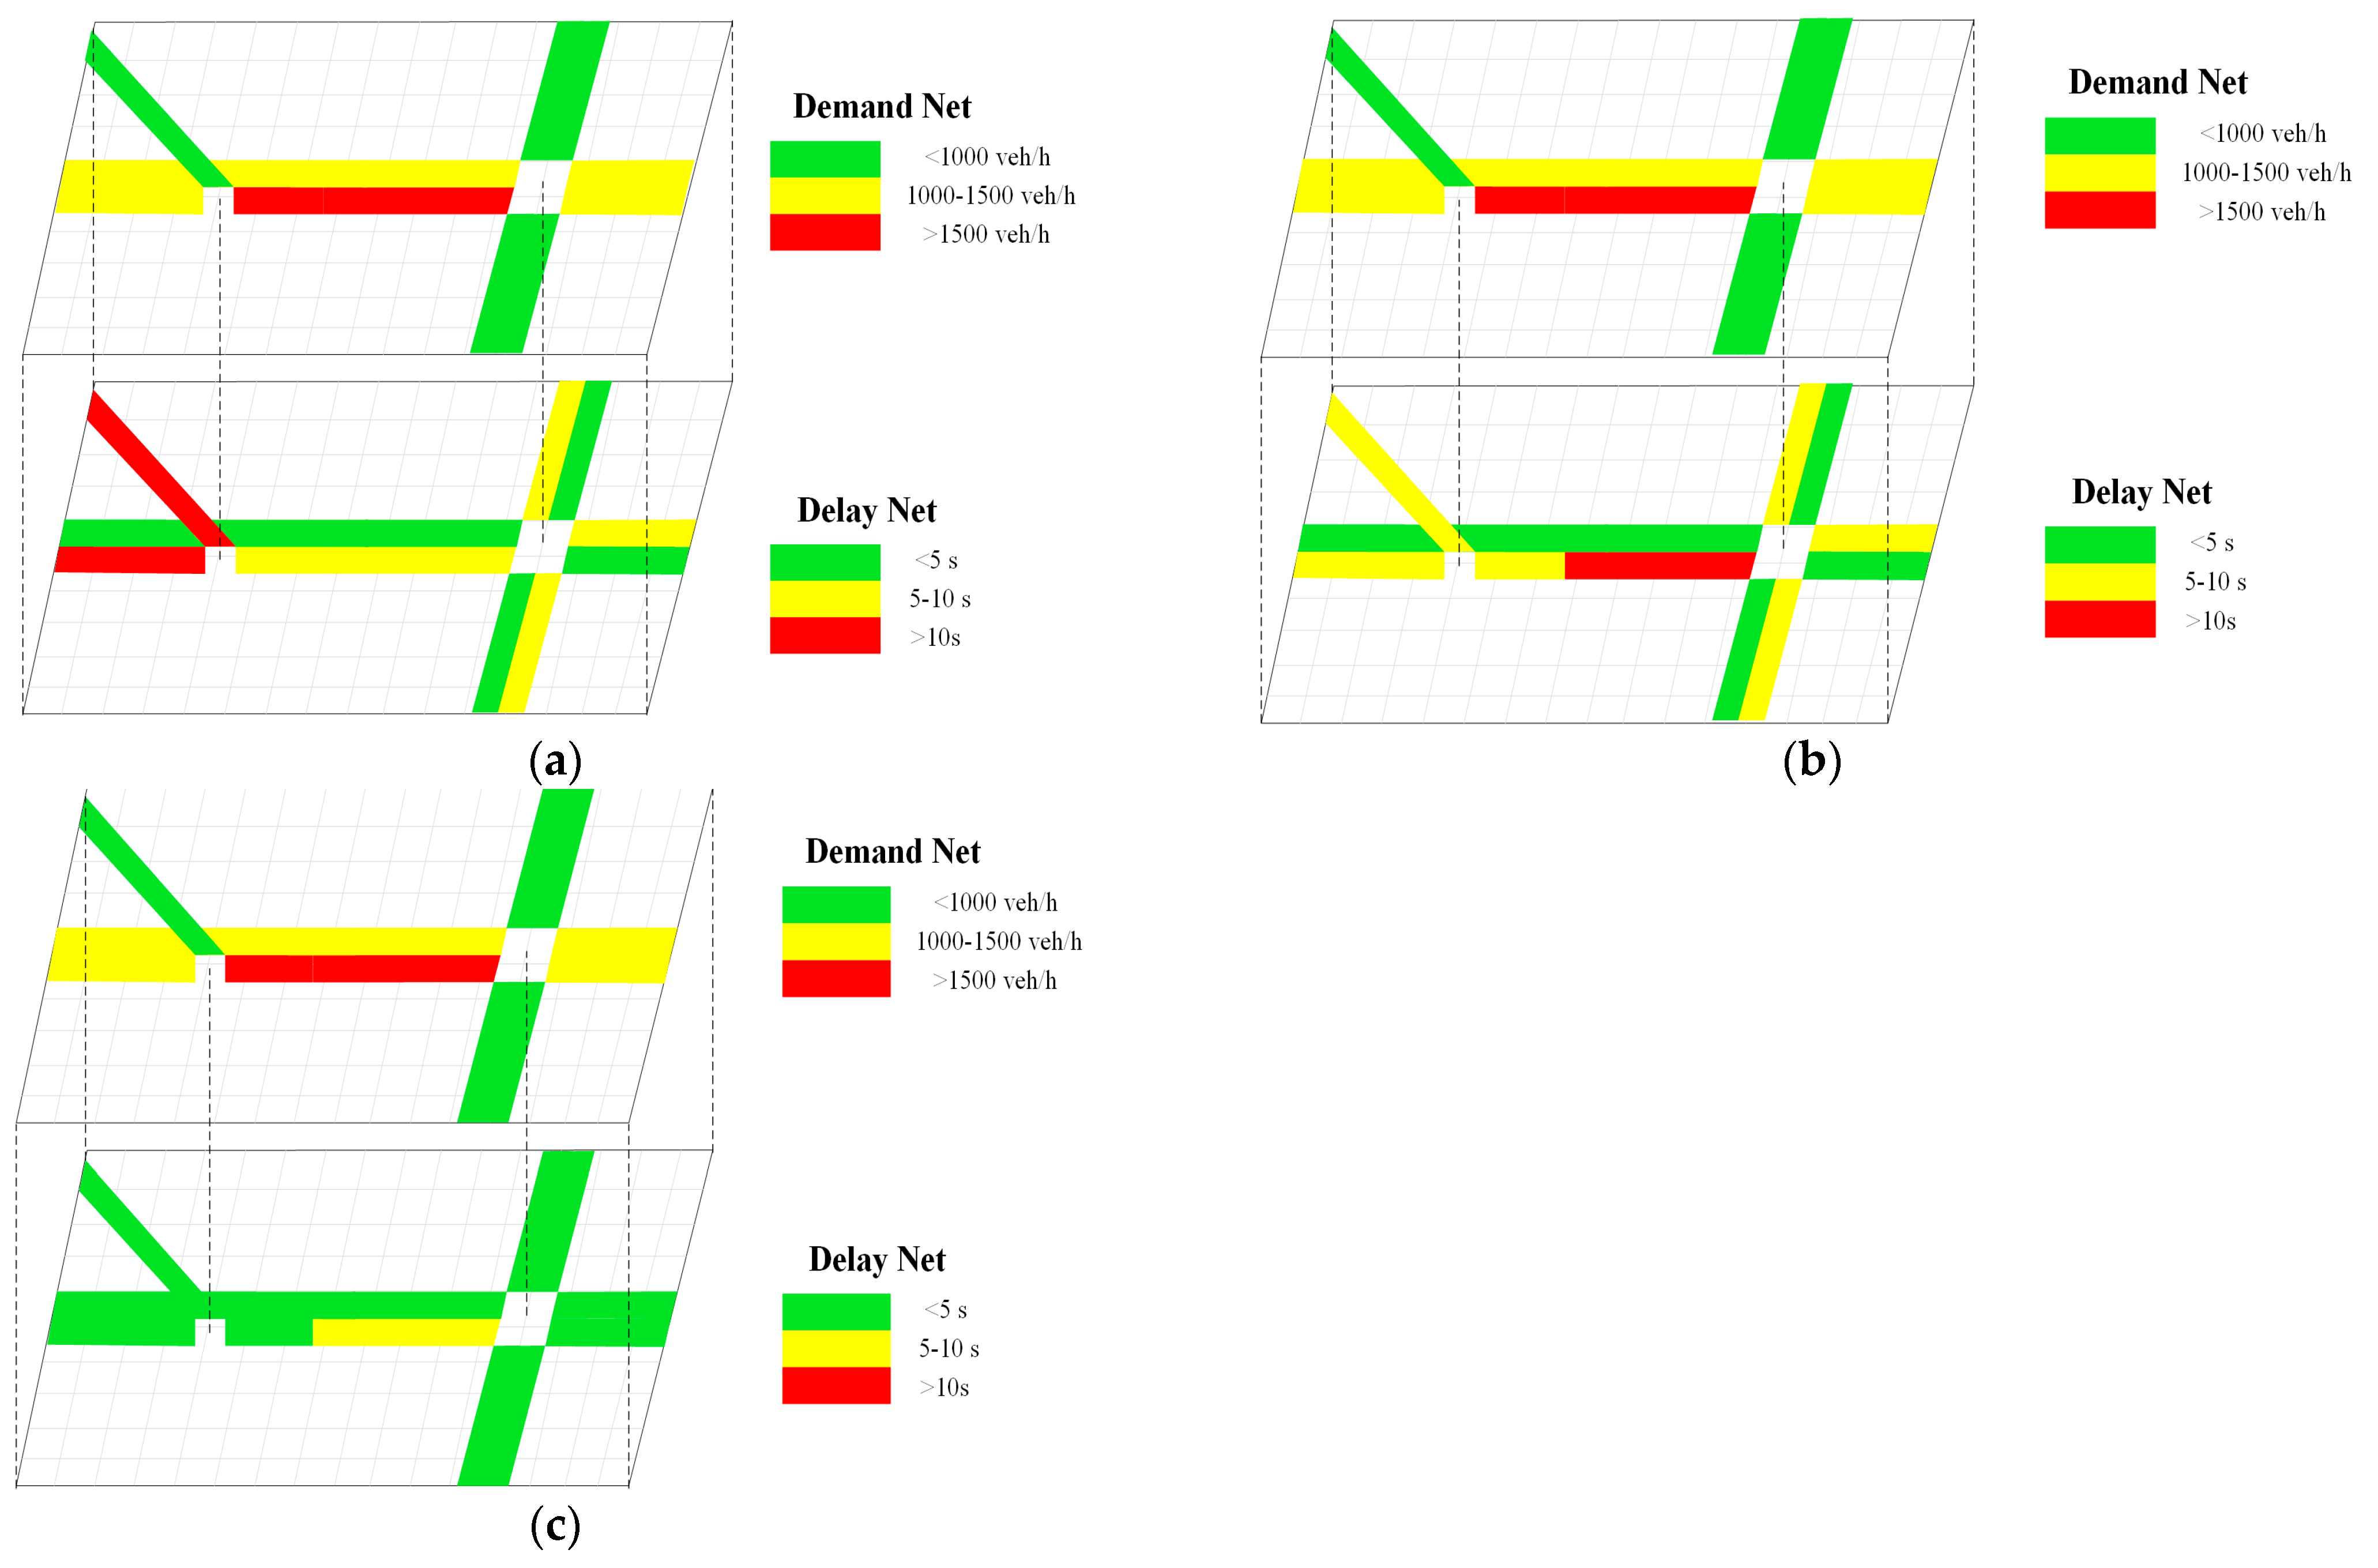
Further, we discussed the impact of the three strategies in each road segment. The simulation results are illustrated in Figure 11. It can be seen from the figures that the delays from the proposed strategy are evenly distributed in the road network and are almost all less than 5 s long for each road segment, even on the secondary roads (Arm 2, 3 and 4 of DI). Considering that Arm 1 of the DI collects all of the vehicles coming from main roads and the freeway, the delays on this segment increase slightly. Nevertheless, the proposed strategy still greatly reduces the delay of vehicles in this segment compared to the benchmark and the CACC.
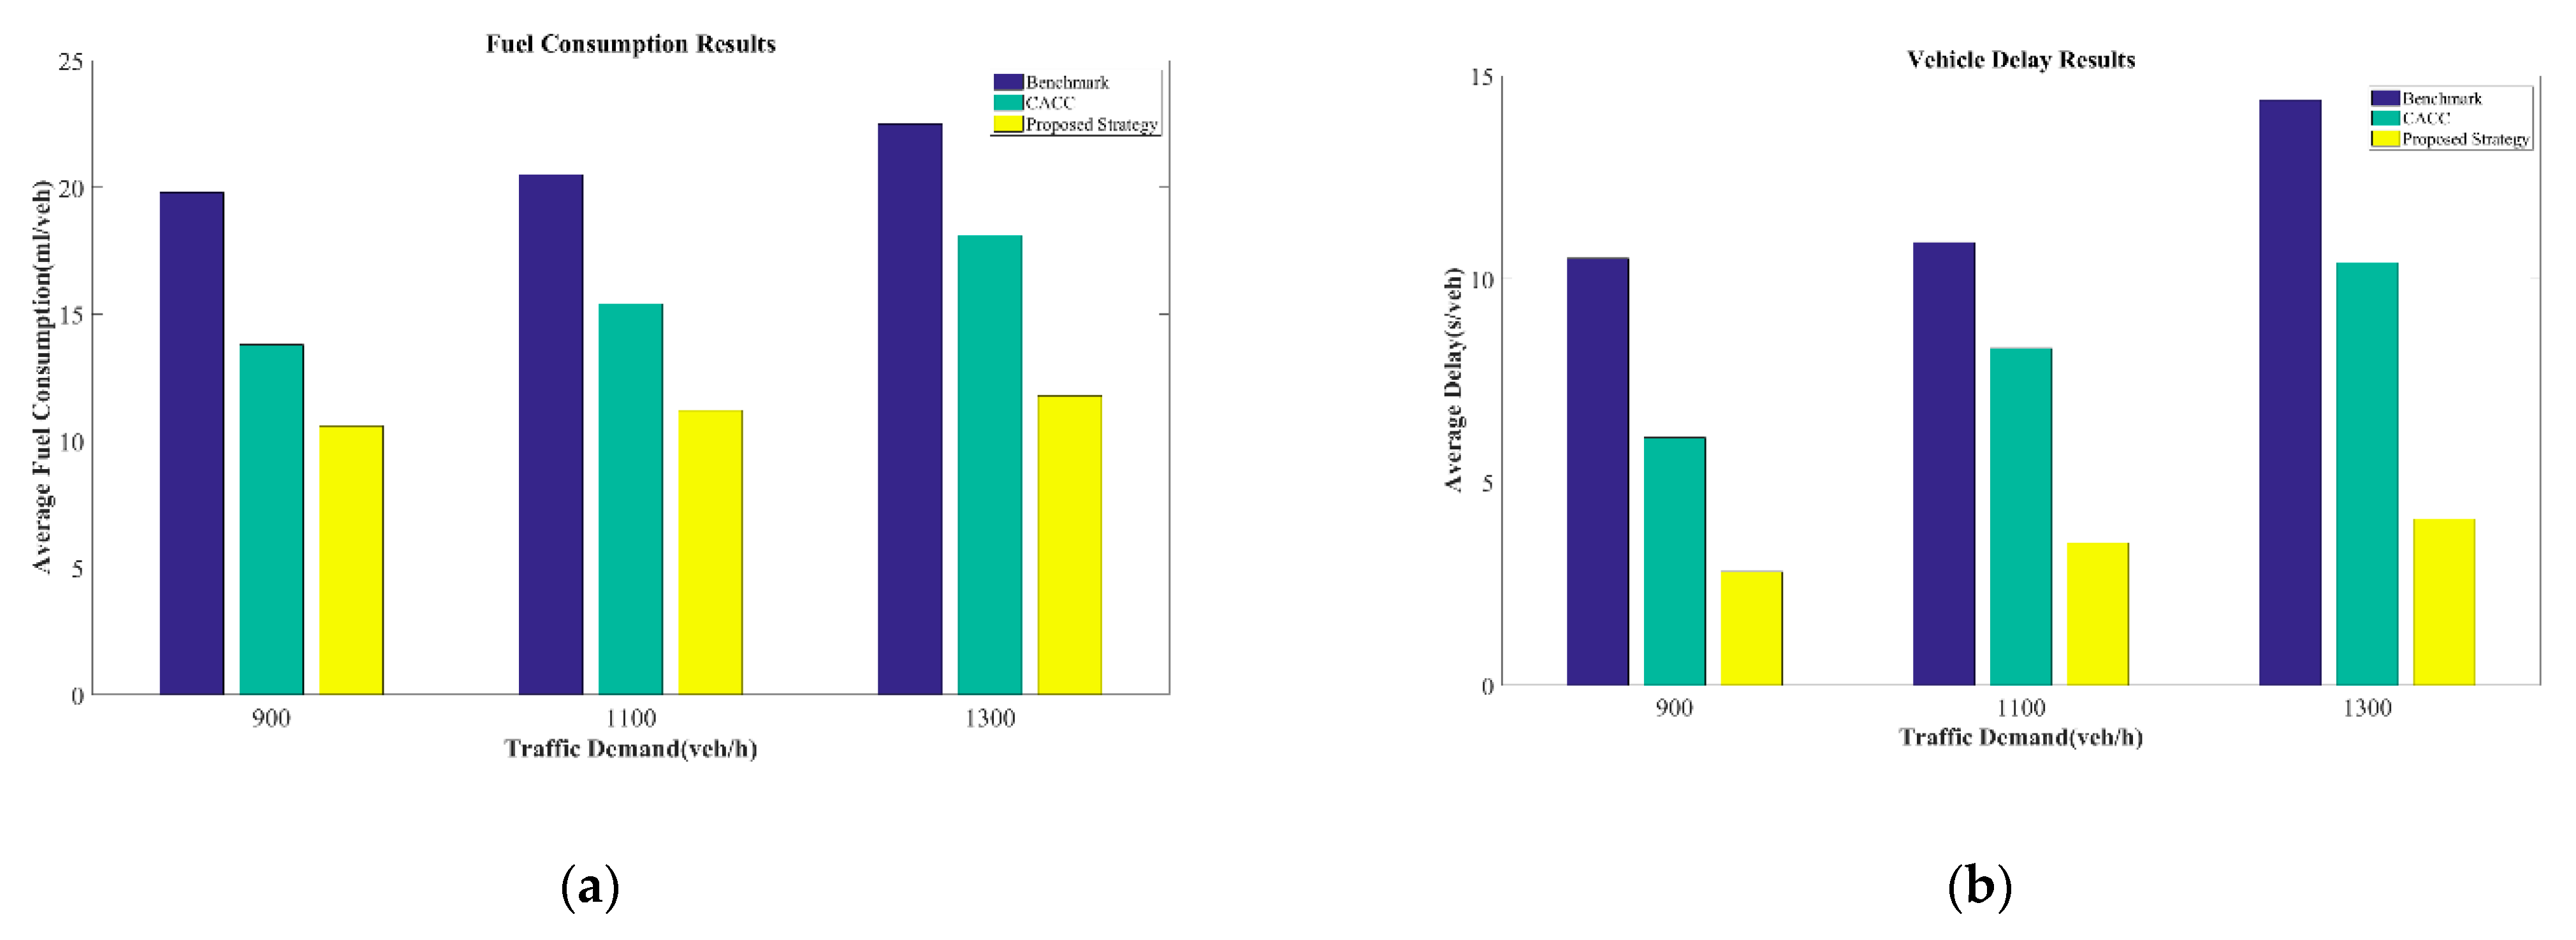
In the end, we investigated the evaluation metrics of each strategy under different traffic demands for the whole junction, which is shown in Figure 12. Each case runs for 1000 s, and the random seed in VISSIM is set to the same value for each case to generate an identical initial vehicle sequence. Through Figure 12, we can see that the fuel consumption and delay patterns per vehicle for the three evaluated strategies are almost the same. As traffic demands increase, so does every metric of each strategy.
As shown in Figure 12a, the proposed strategy can improve fuel economy under any traffic demand compared to the other two strategies, especially at high traffic demands. A benefit of the optimization of vehicle travel time and sequence is that vehicles can maintain a relatively stable and high speed. As such, the increase of fuel consumption for our strategy is slow. Simulation data show that the proposed strategy significantly reduces vehicle fuel consumption for each vehicle by 45.4–47.6% over the benchmark and by 23.2–34.9% over the CACC strategy under the three traffic demands.
As seen from Figure 12b, the proposed strategy reduces average vehicle delay by 67.9–73.3% over the benchmark and by 54.1–60.6% over the CACC strategy under the three traffic demands. It is a reasonable result; however, it seems to be a huge boost since such an improvement is based on per vehicle delay and results in the percentage being large. However, as mentioned above, on account of the elimination of stop-and-go driving behavior, vehicles do not need to waste time waiting and can make use of every piece of time. That is what we expected.
Therefore, compared to the benchmark and CACC, the proposed strategy can not only reduce vehicle fuel consumption, but it can also improve traffic efficiency under different traffic demands, which can significantly eliminate traffic congestion.

6. Conclusions and Future Work

We developed a two-stage CAV trajectory optimization strategy for the junction between the freeway and the urban road network in this work. Maximum capacity was introduced as the primary objective of this strategy. Moreover, fuel economy and driving comfort were also considered in the trajectory optimization process. In Stage 1, the FIFO principle and road meshing method were applied for the off-ramp zone and the downstream intersection when the vehicle departure sequence was determined. Subsequently, a framework was built to determine the terminal time for vehicles with different conflict relationships. Then, vehicle trajectory optimization equations were established through PMP theory in Stage 2, and the targeted methods were devised to avoid driving backwards and to ensure the optimal vehicle gap, which made up for the shortcomings of the PMP theory. Finally, simulation experiments demonstrated the effectiveness of the proposed strategy.
We compared the performance of the proposed strategy with the benchmark and the CACC strategy under different traffic demands. Simulation results illustrated their efficiency and effectiveness. First, the vehicle trajectory profiles implied that our strategy can almost eliminate the fluctuation of traffic and the stop-and-go traffic phenomenon, which enabled vehicles to keep a higher speed to travel along the road. Second, the statistical results verified that the proposed strategy effectively reduced fuel consumption and vehicle delay for each zone. Furthermore, road network heat maps also revealed that our strategy can greatly reduce vehicle delay in each segment compared to the benchmark and CACC strategy. Finally, we made it clear that the proposed strategy is competent for different traffic demands by comparing fuel consumption and vehicle delay. It showed that fuel consumption was reduced by 45.4–47.6% over the benchmark and by 23.2–34.9% over the CACC strategy and that vehicle delay was reduced by 67.9–73.3% over the benchmark and by 54.1–60.6% over the CACC strategy.
Some subsequent research should be considered in the future. First, simulation results show that the improvement of the proposed strategy seems to be higher than expected, and it is thought that experimental verification is conducted in the simulation software, which is an ideal environment. As such, it is necessary to verify this by simulating a more realistic traffic environment. Second, we would consider building a more reasonable trajectory optimization strategy for a mixed flow of automated and human-driven vehicles. Moreover, extending the study to multilane traffic at such junction would be meaningful.

Author Contributions

Conceptualization, Z.J. and D.Y.; methodology, Z.J. and D.Y.; software, H.Z.; validation, Z.J., S.L. and H.Z.; formal analysis, Z.J. and X.X.; investigation, Z.J. and S.L.; resources, Z.J.; data curation, H.Z.; writing—original draft preparation, Z.J.; writing—review and editing, S.L. and X.X.; visualization, Z.J.; supervision, D.Y. All authors have read and agreed to the published version of the manuscript.

Funding

This work was supported by the Projects of Jilin Provincial Education Department (JJKH20200253KJ).

Institutional Review Board Statement

Not applicable.

Informed Consent Statement

Not applicable.

Data Availability Statement

Not applicable.

Acknowledgments

Thank you to all reviewers for their suggestions to make this paper better.

Conflicts of Interest

The authors declare no conflict of interest.

References

  1. U.S. Environmental Protection Agency. Sources of Greenhouse Gas Emission. 2018. Available online: https://www.epa.gov/ghgemissions/inventory-us-greenhouse-gas-emissions-and-sinks (accessed on 27 August 2021).
  2. Ahmane, M.; Abbas-Turki, A.; Perronnet, F.; Wu, J.; Moudni, A.E.; Buisson, J.; Zeo, R. Modeling and controlling an isolated urban intersection based on cooperative vehicles. Transp. Res. Part C Emerg. Technol. 2013, 28, 44–62. [Google Scholar] [CrossRef] [Green Version]
  3. Jiang, H.; Hu, J.; An, S.; Wang, M.; Park, B.B. Eco approaching at an isolated signalized intersection under partially connected and automated vehicles environment. Transp. Res. Part C Emerg. Technol. 2017, 79, 290–307. [Google Scholar] [CrossRef]
  4. Lee, W.H.; Chiu, C.Y. Design and Implementation of a Smart Traffic Signal Control System for Smart City Applications. Sensors 2020, 20, 508. [Google Scholar] [CrossRef] [Green Version]
  5. Xu, B.; Ban, X.J.; Bian, Y.; Wang, J.; Li, K. V2I based cooperation between traffic signal and approaching automated vehicles. In Proceedings of the 2017 28th IEEE Intelligent Vehicles Symposium, Los Angeles, CA, USA, 11–17 June 2017. [Google Scholar]
  6. Tribioli, L.; Barbieri, M.; Capata, R.; Sciubba, E.; Jannelli, E.; Bella, G. A Real Time Energy Management Strategy for Plug-in Hybrid Electric Vehicles based on Optimal Control Theory. Energy Procedia 2014, 45, 949–958. [Google Scholar] [CrossRef]
  7. He, X.; Liu, H.X.; Liu, X. Optimal vehicle speed trajectory on a signalized arterial with consideration of queue. Transp. Res. Part C Emerg. Technol. 2015, 61, 106–120. [Google Scholar] [CrossRef]
  8. Malikopoulos, A.A.; Hong, S.; Park, B.B.; Lee, J.; Ryu, S. Optimal Control for Speed Harmonization of Automated Vehicles. IEEE Trans. Intell. Transp. Syst. 2019, 20, 2405–2417. [Google Scholar] [CrossRef] [Green Version]
  9. Chen, L.; Englund, C. Cooperative Intersection Management: A Survey. IEEE Trans. Intell. Transp. Syst 2016, 17, 570–586. [Google Scholar] [CrossRef]
  10. Mandava, S.; Boriboonsomsin, K.; Barth, M. Arterial velocity planning based on traffic signal information under light traffic conditions. In Proceedings of the 2009 12th International IEEE Conference on Intelligent Transportation Systems, St. Louis, MO, USA, 4–7 October 2009; pp. 1–6. [Google Scholar]
  11. Lioris, J.; Pedarsani, R.; Tascikaraoglu, F.Y.; Varaiya, P. Platoons of connected vehicles can double throughput in urban roads. Transp. Res. Part C Emerg. Technol. 2017, 77, 292–305. [Google Scholar] [CrossRef] [Green Version]
  12. Feng, Y.; Head, K.L.; Khoshmagham, S.; Zamanipour, M. A real-time adaptive signal control in a connected vehicle environment. Transp. Res. Part C Emerg. Technol. 2015, 55, 460–473. [Google Scholar] [CrossRef]
  13. Chen, X.; Xu, B.; Qin, X.; Bian, Y.; Hu, M.; Sun, N. Non-signalized intersection network management with connected and automated vehicles. IEEE Access 2020, 8, 122065–122077. [Google Scholar] [CrossRef]
  14. Dresner, K.; Stone, P. Multiagent traffic management: A reservation based intersection control mechanism. In Proceedings of the Third International Joint Conference on Autonomous Agents and Multiagent Systems, AAMAS 2004, New York, NY, USA, 23 July 2004; pp. 530–537. [Google Scholar]
  15. Pueboobpaphan, R.; Liu, F.; van Arem, B. The impacts of a communication based merging assistant on traffic flows of manual and equipped vehicles at an on-ramp using traffic flow simulation. In Proceedings of the 13th International IEEE Conference on Intelligent Transportation Systems, Funchal, Portugal, 19–22 September 2010; pp. 1468–1473. [Google Scholar]
  16. Milanes, V.; Godoy, J.; Villagra, J.; Perez, J. Automated On-Ramp Merging System for Congested Traffic Situations. IEEE Trans. Intell. Transp. Syst 2011, 12, 500–508. [Google Scholar] [CrossRef] [Green Version]
  17. Sun, J.; Ouyang, J.; Yang, J. Modeling and Analysis of Merging Behavior at Expressway On-Ramp Bottlenecks. Trans. Res. Rec. 2014, 2421, 74–81. [Google Scholar] [CrossRef]
  18. Sun, Z.; Huang, T.; Zhang, P. Cooperative decision-making for mixed traffic: A ramp merging example. Transp. Res. Part C Emerg. Technol. 2020, 120. [Google Scholar] [CrossRef]
  19. Scarinci, R.; Heydecker, B. Control Concepts for Facilitating Motorway On-ramp Merging Using Intelligent Vehicles. Transport Reviews 2014, 34, 775–797. [Google Scholar] [CrossRef]
  20. Dresner, K.; Stone, P. Learning policy selection for autonomous intersection management. In Proceedings of the AAMAS 2007 Workshop on Adaptive and Learning Agents, Honolulu, HI, USA, 8–9 May 2007; pp. 34–39. [Google Scholar]
  21. Schepperle, H.; Böhm, K. Agent-Based Traffic Control Using Auctions. Coop. Inf. Agents XI 2007, 4676, 119–133. [Google Scholar] [CrossRef]
  22. Naumann, R.; Rasche, R.; Tacken, J. Managing autonomous vehicles at intersections. IEEE Intell. Syst. Appl. 1998, 13, 82–86. [Google Scholar] [CrossRef]
  23. Rios-Torres, J.; Malikopoulos, A.A. Automated and Cooperative Vehicle Merging at Highway On-Ramps. IEEE Trans. Intell. Transp. Syst 2017, 18, 780–789. [Google Scholar] [CrossRef]
  24. Ferreira, M.; Fernandes, R.; Conceição, H.; Viriyasitavat, W.; Tonguz, O.K. Self-organized traffic control. In Self-Organized Traffic Control, Proceeding of the Seventh ACM International Workshop on VehiculAr InterNETworking (VANET ’10), New York, NY, USA, 24 September 2010; Association for Computing Machinery: New York, NY, USA, 2010; pp. 85–90. [Google Scholar]
  25. Fathollahnejad, N.; Villani, E.; Pathan, R.; Barbosa, R.; Karlsson, J. On reliability analysis of leader election protocols for virtual traffic lights. In Proceedings of the 2013 43rd Annual IEEE/IFIP Conference on Dependable Systems and Networks Workshop (DSN-W), Budapest, Hungary, 24–27 June 2013; pp. 1–12. [Google Scholar]
  26. Li, L.; Wang, F.-Y. Cooperative Driving at Blind Crossings Using Intervehicle Communication. IEEE Trans. Veh. Tech. 2006, 55, 1712–1724. [Google Scholar] [CrossRef]
  27. Kamal, M.A.S.; Hayakawa, T.; Imura, J. Development and Evaluation of an Adaptive Traffic Signal Control Scheme Under a Mixed-Automated Traffic Scenario. IEEE Trans. Intell. Transp. Syst. 2020, 21, 590–602. [Google Scholar] [CrossRef]
  28. Malikopoulos, A.A.; Cassandras, C.G.; Zhang, Y.J. A decentralized energy-optimal control framework for connected automated vehicles at signal-free intersections. Automatica 2018, 93, 244–256. [Google Scholar] [CrossRef] [Green Version]
  29. Ge, Q.; Sun, Z.Q.; Wang, S.; Li, Z.; Zheng, S. Centralized Coordination of Connected Vehicles at Intersections using Graphical Mixed Integer Optimization. arXiv 2020, arXiv:2008.13081. [Google Scholar] [CrossRef]
  30. Bian, Y.; Li, S.E.; Ren, W.; Wang, J.; Li, K.; Liu, H.X. Cooperation of Multiple Connected Vehicles at Unsignalized Intersections: Distributed Observation, Optimization, and Control. IEEE Trans. Ind. Electron. 2020, 67, 10744–10754. [Google Scholar] [CrossRef]
  31. Ntousakis, I.A.; Nikolos, I.K.; Papageorgiou, M. Optimal vehicle trajectory planning in the context of cooperative merging on highways. Transp. Res. Part C Emerg. Technol. 2016, 71, 464–488. [Google Scholar] [CrossRef]
  32. Rios-Torres, J.; Malikopoulos, A.; Pisu, P. Online Optimal Control of Connected Vehicles for Efficient Traffic Flow at Merging Roads. In Proceedings of the 2015 IEEE 18th International Conference on Intelligent Transportation Systems, Gran Canaria, Spain, 15–18 September 2015; pp. 2432–2437. [Google Scholar]
  33. Cao, W.; Mukai, M.; Kawabe, T.; Nishira, H.; Fujiki, N. Cooperative vehicle path generation during merging using model predictive control with real-time optimization. Control Eng. Pract. 2015, 34, 98–105. [Google Scholar] [CrossRef]
  34. I Papamichail, I.; Papageorgiou, M. Traffic-Responsive Linked Ramp-Metering Control. IEEE Trans. Intell. Transp. Syst 2008, 9, 111–121. [Google Scholar] [CrossRef]
  35. Kotsialos, A.; Papageorgiou, M.; Mangeas, M.; Haj-Salem, H. Coordinated and integrated control of motorway networks via nonlinear optimal control. Trans. Res. 2002, 10, 65–84. [Google Scholar] [CrossRef]
  36. Zhao, J.; Ma, W.; Xu, H. Increasing the capacity of the intersection downstream of the freeway off-ramp using presignals. Comput. Aided Civ. Infrastruct. Eng 2017, 32, 674–690. [Google Scholar] [CrossRef]
  37. Zhang, Y.J.; Malikopoulos, A.A.; Cassandras, C.G. Optimal control and coordination of connected and automated vehicles at urban traffic intersections. In Proceedings of the 2016 American Control Conference, Boston, MA, USA, 6–8 July 2016. [Google Scholar]
  38. Hoberock, L.L. A Survey of Longitudinal Acceleration Comfort Studies in Ground Transportation Vehicles. Jour. Dyna. Sys. Meas. Control 1977, 99, 76–84. [Google Scholar] [CrossRef]
  39. Kamal, M.A.S.; Mukai, M.; Murata, J.; Kawabe, T. Model Predictive Control of Vehicles on Urban Roads for Improved Fuel Economy. IEEE Trans. Con. Sys. Tech. 2013, 21, 831–841. [Google Scholar] [CrossRef]
  40. Bellman, R.; Lee, E. History and development of dynamic programming. IEEE Contr. Syst. Mag. 1984, 44, 24–28. [Google Scholar] [CrossRef]
  41. Kiessler, P.C. Approximate Dynamic Programming: Solving the Curses of Dimensionality. J. Am. Stat. Assoc. 2009, 104, 1714. [Google Scholar]
  42. Yang, X.; He, H. Adaptive critic designs for optimal control of uncertain nonlinear systems with unmatched interconnections. Neural Netw. 2018, 105, 142–153. [Google Scholar] [CrossRef] [PubMed]
  43. Su, Z.C.; Chow, A.H.F.; Zheng, N.; Huang, Y.P.; Liang, E.M.; Zhong, R.X. Neuro-dynamic programming for optimal control of macroscopic fundamental diagram systems. Transp. Res. Part C Emerg. Technol. 2020, 116. [Google Scholar] [CrossRef]
  44. Zhang, Y.; Cassandras, C.G. Decentralized optimal control of Connected Automated Vehicles at signal-free intersections including comfort-constrained turns and safety guarantees. Automatica 2019, 109. [Google Scholar] [CrossRef] [Green Version]
  45. Guo, Y.; Ma, J.Q.; Xiong, C.F.; Li, X.P.; Zhou, F.; Hao, W. Joint optimization of vehicle trajectories and intersection controllers with connected automated vehicles: Combined dynamic programming and shooting heuristic approach. Transp. Res. Part C Emerg. Technol. 2019, 98, 54–72. [Google Scholar] [CrossRef]
  46. Wang, Y.P.; Cai, P.L.; Lu, G.Q. Cooperative autonomous traffic organization method for connected automated vehicles in multi-intersection road networks. Transp. Res. Part C Emerg. Technol. 2020, 111, 458–476. [Google Scholar] [CrossRef]
  47. Shladover, S.E.; Christopher, N.; Lu, X.Y.; Robert, F. Cooperative Adaptive Cruise Control: Definitions and Operating Concepts. Transport. Res. Rec. 2015, 2489, 145–152. [Google Scholar] [CrossRef]
  48. Fyfe, M.R.W. Safety Evaluation of Connected Vehicle Applications Using Micro-Simulation. Master Thesis, University of British Columbia, Vancouver, Canada, 21 January 2017. [Google Scholar]
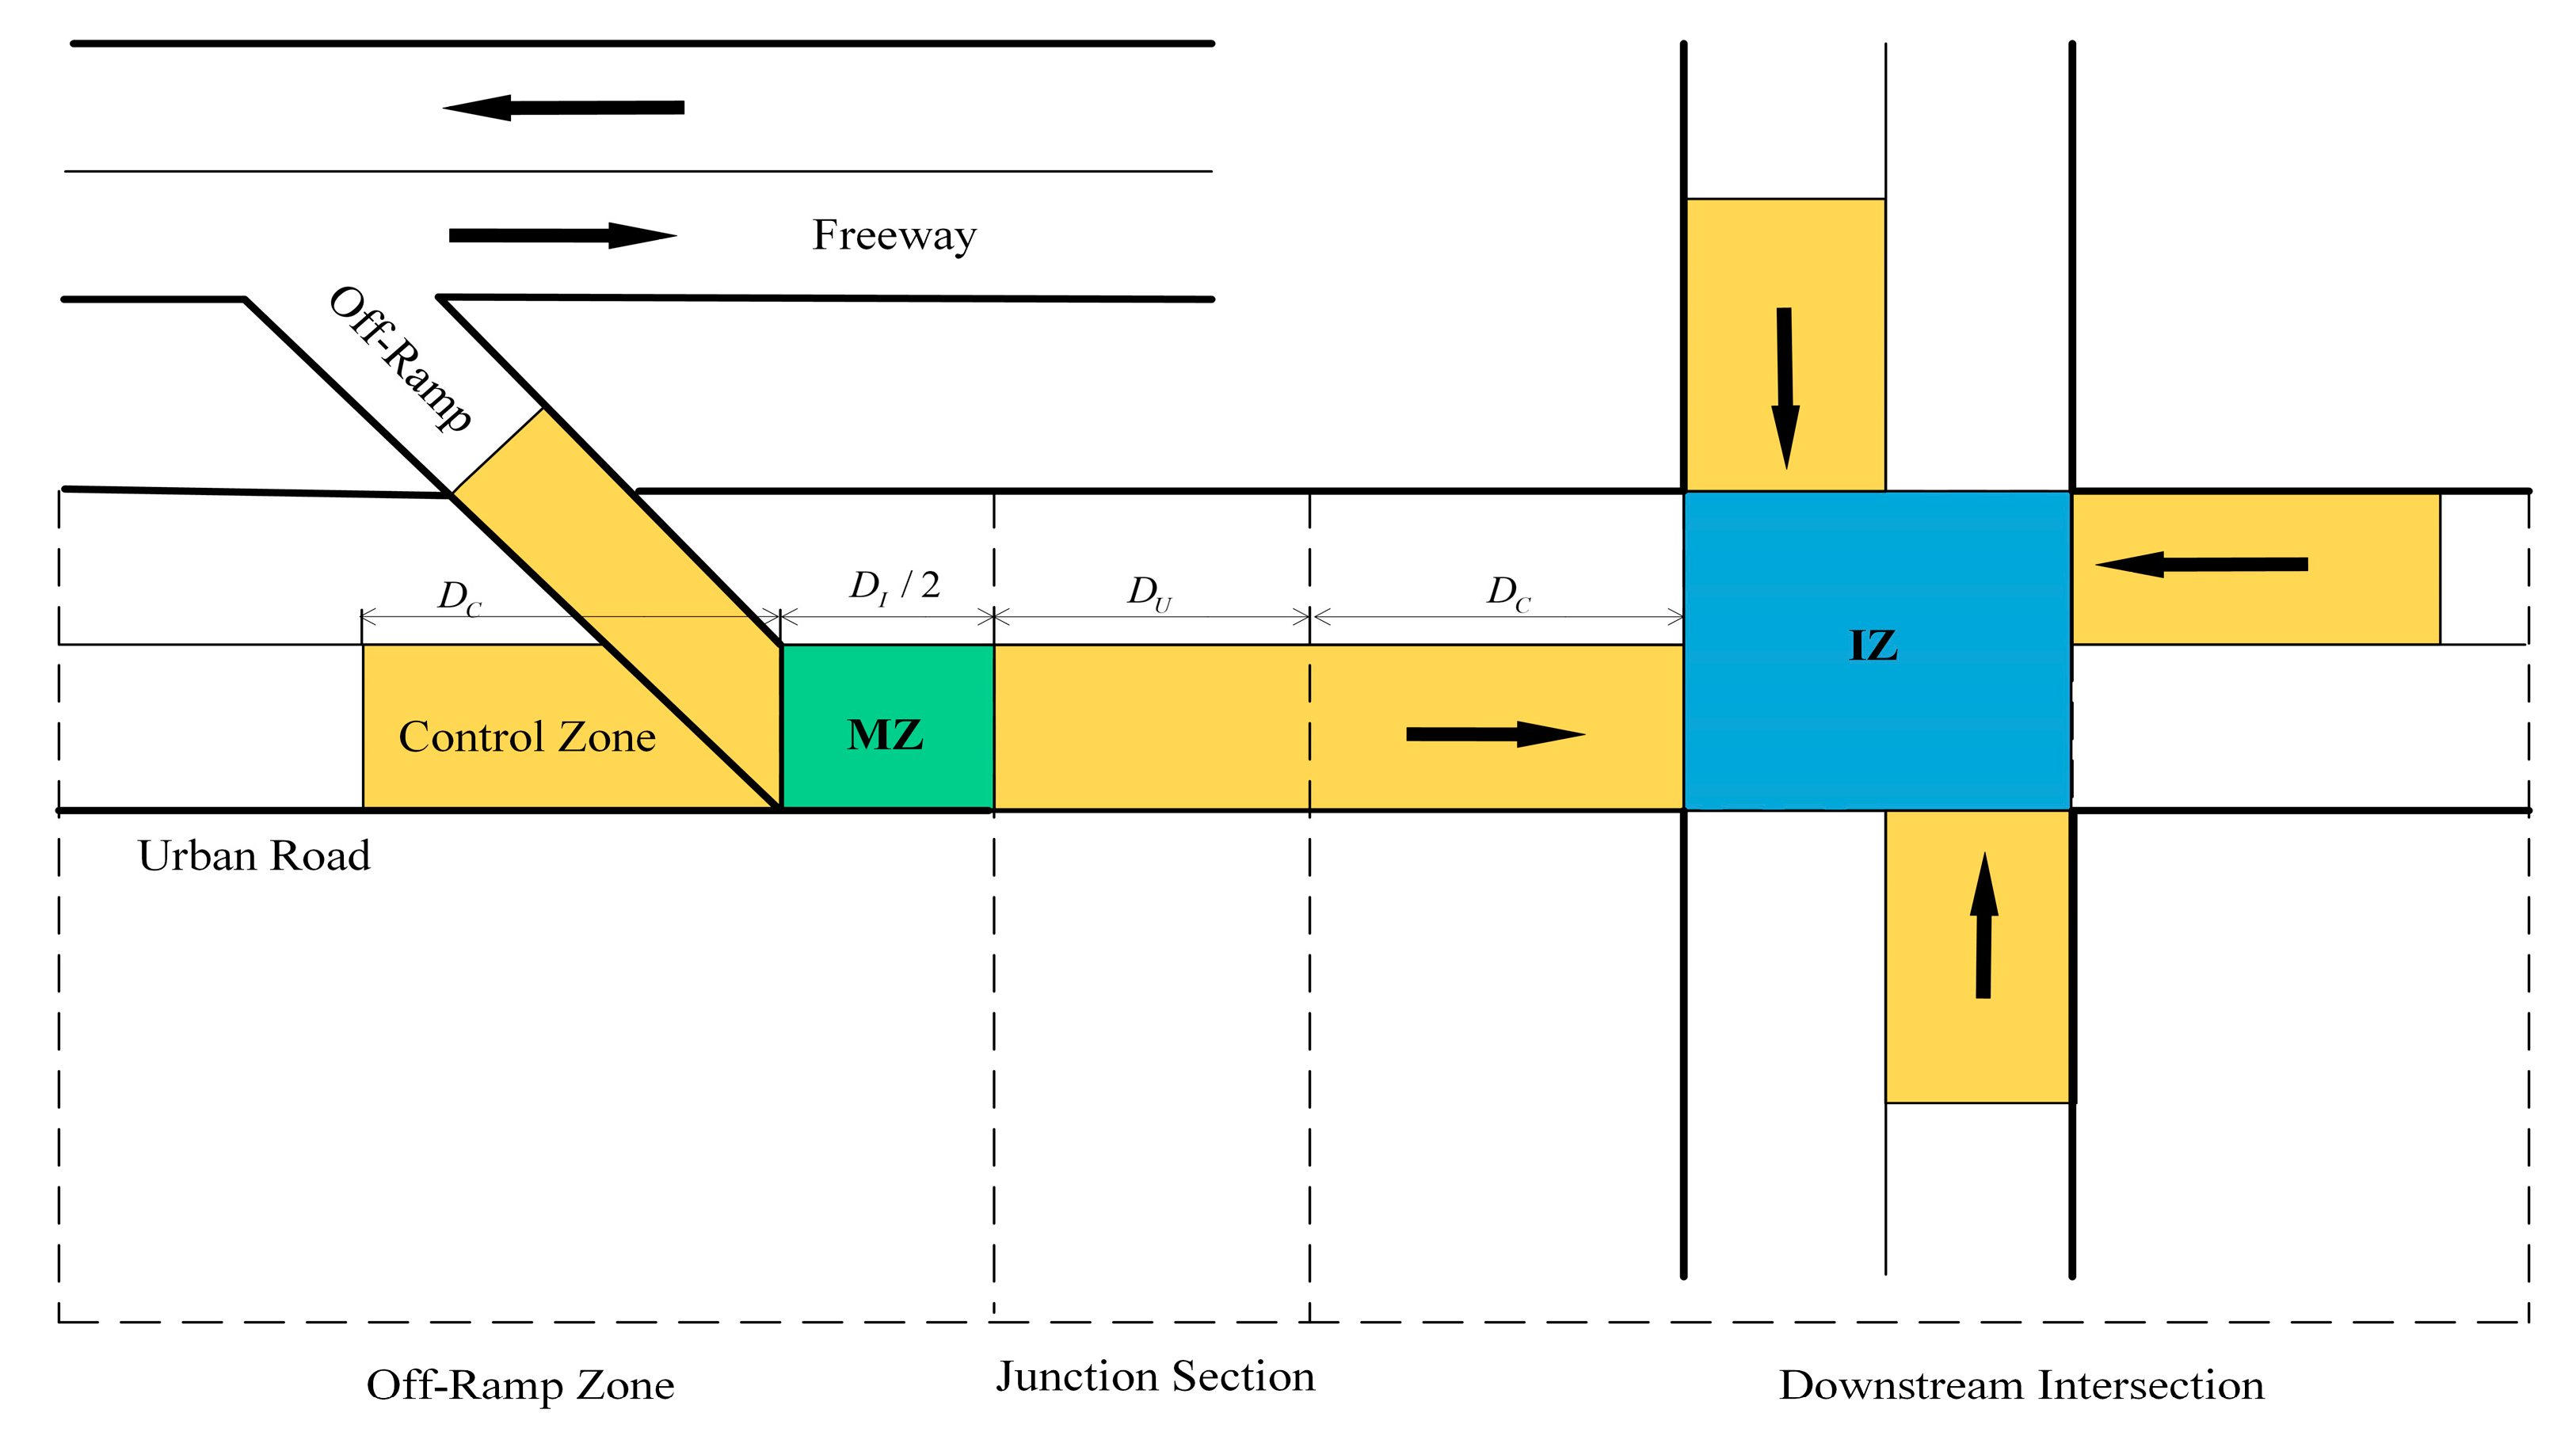
Figure 1. The topological structure of the whole junction.
Sustainability 13 09933 g001
Figure 2. The principle of urban road priority at the ORZ. The solid line and dotted line mean that the following vehicles come from the urban road and the off-ramp, respectively.
Sustainability 13 09933 g002
Figure 3. The principle of First-In-First-Out at the ORZ. The solid line and dotted line mean that the following vehicles come from the urban road and the off-ramp, respectively.
Sustainability 13 09933 g003
Figure 4. Road meshing for the IZ.
Sustainability 13 09933 g004
Figure 5. The storage capacity of the two-dimensional state space.
Sustainability 13 09933 g005
Figure 6. Control structure of the proposed CAV trajectory optimization strategy.
Sustainability 13 09933 g006
Figure 7. Trajectory profiles for 1100 veh/h at the benchmark (the dotted line and solid line represent vehicles from the off-ramp and from urban roads, respectively): (a) vehicle distance trajectory profiles; (b) vehicle speed trajectory profiles; and (c) vehicle acceleration trajectory profiles.
Sustainability 13 09933 g007aSustainability 13 09933 g007b
Figure 8. Trajectory profiles for 1100 veh/h in CACC strategy (the dotted line and solid line represent vehicles from the off-ramp and from urban roads, respectively): (a) vehicle distance trajectory profiles; (b) vehicle speed trajectory profiles; and (c) vehicle acceleration trajectory profiles.
Sustainability 13 09933 g008
Figure 9. Trajectory profiles for 1100 veh/h in the proposed strategy (the dotted line and solid line represent vehicles from the off-ramp and from urban roads, respectively): (a) vehicle distance trajectory profiles; (b) vehicle speed trajectory profiles; and (c) vehicle acceleration trajectory profiles.
Sustainability 13 09933 g009
Figure 10. Average fuel consumption and delay in each zone for different control scenarios under medium traffic demand: (a) average fuel consumption and (b) average delay.
Sustainability 13 09933 g010
Figure 11. The influence on the delay of the three strategies for the road network: (a) benchmark; (b) CACC; and (c) proposed strategy.
Sustainability 13 09933 g011
Figure 12. Comparison results of fuel consumption and vehicle delay under different demands: (a) fuel consumption and (b) delay.
Sustainability 13 09933 g012
Table 1. Notations and corresponding meanings.
NotationMeaning
Proper noun abbreviation
ORZOff-Ramp Zone
JSJunction Section
DIDownstream Intersection
MZMerging Zone
IZInterweaving zone at DI
Geometric parameters
D C The distance of the vehicle trajectory control zone
D U The distance of the JS
D I The distance of the IZ
Time parameters
t i 1 The time that the vehicle i arrives in the control zone of ORZ
t i 2 The time that the vehicle i arrives in MZ
t i 3 The time that the vehicle i leaves MZ
t i 4 The time that the vehicle i arrives at DI
t i 5 The time that the vehicle i arrives in IZ
t i 6 The time that the vehicle i leaves IZ
t i min The minimum time that the vehicle i passes the control zone
Δ i The minimum safe time headway
Vehicle parameters
iThe current controlled vehicle
lThe length of the vehicle
g a p min The minimum gap between two vehicles
Variables
d i ( t ) The location of the vehicle i at time t
v i ( t ) The velocity of the vehicle i at time t
a i ( t ) The acceleration of the vehicle i at time t
j i ( t ) The jerk of the vehicle i at time t
Table 2. Average computational time.
Traffic Demand
(veh/h)
Average Computational Time of Each Vehicle (s)
DPPMP
9000.1830.014
11000.5160.032
13001.3270.067
Publisher’s Note: MDPI stays neutral with regard to jurisdictional claims in published maps and institutional affiliations.