Article

Sustainability Opportunities for Mediterranean Food Products through New Formulations Based on Carob Flour (Ceratonia siliqua L.)

1
Lab-NAFS Nutrition-Functional Food & Vascular Health, Faculty of Medicine, University of Monastir, Monastir 5000, Tunisia
2
Department of Biotechnology, Faculty of Science & Technology, University of Kairouan, Kairouan 9100, Tunisia
3
Department of Pharmacy, University of Pisa, 56126 Pisa, Italy
4
Mediterranean Institute for Agriculture, Environment and Development, University of Algarve Edf 8, Campus de Gambelas, 8005-139 Faro, Portugal
*
Author to whom correspondence should be addressed.
Sustainability 2021, 13(14), 8026; https://doi.org/10.3390/su13148026
Submission received: 17 May 2021 / Revised: 9 July 2021 / Accepted: 13 July 2021 / Published: 19 July 2021
(This article belongs to the Special Issue Sustainable Food Systems and Circular Bioeconomy)

Abstract

:
Carob flour is increasingly popular in innovative functional foods. Its main producers are Mediterranean countries, facing health and nutrition challenges, and difficulties in tackling climate change. This study aims at formulating innovative sustainable bakery products of high nutritional value while pleasing the consumer and addressing regional challenges. Hence, carob flour was obtained by grinding sun-dried carob pods, thus reducing the environmental impact, and preserving carob’s high nutraceutical value. Different bread formulations resulted from the blend of wheat flour with carob pulp (5, 10, 20, and 30%) and/or seed powder (5 and 10%), with no added fats, additives, or processing aids. New products were evaluated for their textural, chromatic, nutritional, aromatic, and hedonic properties. Carob is rich in aroma, antioxidants, and prebiotic fibers, and does not contain gluten, so when combined with wheat, the proportion of gluten in bread is reduced. Carob is also rich in minerals (4.16% and 2.00% ash, respectively in seed and pulp), and breadmaking seems to generate lesser furane derivatives than in white bread. In short, carob is typically Mediterranean and is a valuable local resource in the formulation of sustainable foods with high nutritional value, low carbon footprint, safe, healthy, tasty, and affordable, all at once.

1. Introduction

We live in an era of unprecedented human population growth and technological development but bordering on the catastrophic consequences of climate change. In the long run, the survival of our own species is at stake, and in the short term, the states face increased expenses with healthcare systems (partly due to diet-related non-communicable diseases), with the mitigation of environmental damage (pollution, soil degradation), etc. Not to mention the erosion of biodiversity, as extinction is definitive and represents an economic loss [1,2]. The United Nations, world leaders, and the younger generations are calling for urgent action. However, the demand for water, food, and energy continues to increase, as the global population grows and intensifies consumption, further contributing to aggravate climate change [3]. Despite the fact that the biggest drivers of global warming are not adequately addressing the problem, many actions are within the reach of individuals and small business owners, and many individual contributions will make a difference: reducing the consumption of water, energy, and food (waste) will have direct big economic and environmental impacts. Acting on the water–food–energy nexus is crucial for sustainable development as it can be achieved by merging scientific knowledge and ancient wisdom in optimizing the use of resources [4,5,6,7].
The food sector is critical for human survival and well-being, but it is also a major source of GHG (greenhouse gases) emissions [8,9,10]. The food paradigm of systems must shift from mass production of non-sustainable unhealthy foods to the production of healthy foods that make the best use of local resources [11,12,13,14].
In the Mediterranean region small businesses still prevail, agri-biodiversity is still rich, and the climate provides for an abundance of sunlight. In addition, the ancient wisdom enclosed in the Mediterranean Diet [15,16,17] has been revamped, and various successful commercial examples can be found, namely at Algarve, Portugal (data not shown). The trend of the rising demand for traditional bread from ancient wheat varieties, and the blends with other flours, such as carob flour, is noteworthy in south European countries (e.g., Portugal and Greece).
The carob, Ceratonia siliqua (Fabaceae family), is an evergreen xerophyte tree, native to the Mediterranean region (also found in Africa and Latin America) that produces large pods with several seeds [18,19,20]. The carob tree is an excellent decorative plant for private and public gardens, parking areas, and sidewalks, making places more attractive while opening new opportunities of exploring land resources in the cities to produce food, in line with educated suggestions from some researchers [6,21,22]. Ceratonia siliqua is also a forest tree; it can stop erosion and modify the appearance of areas. This plant can survive in very precarious conditions: its rich root system retains and protects the soil from erosion. It tolerates sterile and dry calcareous soils [23] and even rocky soils. This plant is an excellent alternative to act on climate change. According to Correia and Pestana [23], carob trees absorb 15.56 t CO2 eq/ha/y. Moreover, the food processing of carob pods does not generate waste. Once used as feed and viewed as a famine food, carob pods, and carob seeds are now utilized in the food industry. The industrial applications of carob seeds were reviewed by Barak and Mudgil [24], while carob flour is increasingly used in bakeries [20,23,25], with potential benefits for human health and the environment, as it can be obtained with a reduced environmental impact. Conversely, white wheat flour is produced from the endosperm of the grain after removing the bran and germ (while whole wheat flour includes the bran and germ). Prior to milling, the grain must be tempered with moisture to soften the endosperm and toughen the bran to facilitate grinding and separation, in a multi-step process that includes drying to ensure preservation. Moreover, the conventional wheat grain production requires much more energy and water than the production of carob pods, especially when the grain is obtained from high-input intensive monoculture systems. In respect to health and nutritional aspects (and conversely to ultra-processed bakery foods), several authors report that carob and carob products can be important sources of nutrients and essential elements of crucial importance in human metabolism, healthy growth, and prevention of diseases [20,26,27,28].
The present work, carried out in Tunisia, consisted of testing bread formulations aiming to find ways to improve sustainability, nutritional content, and health-promoting properties while meeting consumer demands. In other words, our work intended to qualitatively assess the practical and economic feasibility of replacing mainstream white wheat bread recipes (mostly ultra-processed) with healthier and sustainable formulations, in order to help small businesses in transitioning to the circular economy model. The paper describes how to prepare bakery products from different blends of wheat flour with carob flour, the effect on rheological properties and volatile compounds, and consumer acceptance. Potential positive impacts on human health and the environment are also argued.

2. Materials and Methods

2.1. Plant Material, Dough, and Bread Preparation

Carob (Ceratonia siliqua L.) was grown in northern Tunisia, harvested late summer in 2017′s, purchased and used in February 2018. Carob samples and related information were obtained from the producer at the market in the city of Bizert, Tunisia. According to the producer, after harvesting the carob pods, they were left to dry under the sun, in open trays, to evaporate the moisture until a sufficiently low aw, as required for grinding. The process took about a couple of weeks (15 days), with the pods exposed to the sun during the daylight time (for about 12h), at temperatures commonly ranging between 30–35 °C and very low relative humidity and moved indoors overnight (to avoid condensation and/or to minimize attack by pests). Figure 1 summarizes the steps carried out to obtain the carob flour (from seeds and pods) used in the bakery formulations described in the present work. Different bread formulations were prepared by blending white wheat flour (commercially available) and different proportions of each of the fractions shown in Figure 1. All assays were performed in triplicate under the same conditions and suitable controls were used (detailed when appropriate). Different proportions of wheat flour and carob flour-carob pulp flour (5, 10, 20, and 30%) and seed flour (5 and 10%) were combined without ingredients or processing aids, other than water (200 mL), salt (3 g), and commercially available dry baker’s yeast with the aid of pilot-scale equipment-Spiral mixer Fimak SPM (SEAD) and a Climator unit and moisturizing equipment (SEAD) for the fermentation step. Baking was carried out in a Steam pipe oven (SEAD). Cakes were prepared from locally marketed ingredients, using the same equipment, and included 8 eggs, 200 g of saccharose, 20 g of vanilla-flavored sugar (containing glucose and vanilla extract), 20 g baking powder, 250 mL of milk, 250 mL of olive oil, and 400 g of the corresponding flour blend (wheat and carob) as used for bread. The schematic steps of flour obtainment (on the left) and of cake and bread processing steps (on the right) are presented in Figure 1.
The worked dough was allowed to ferment at room temperature (about 25 °C during about 45–60 min), after which the “baguettes” were baked in an oven, as shown in Figure 2.
The tested bread formulations corresponded to combinations of two or three types of flour (wheat, carob pod, and carob seed) coded as follows:
  • C1: carob pod powder, only
  • C2: carob seed powder, only
  • C3: white wheat flour (WF)
  • C4: carob pod powder 5% (+95% WF)
  • C5: carob pod powder 10% (+90% WF)
  • C6: carob pod powder 20% (+80% WF)
  • C7: carob pod powder 30% (+70% WF)
  • C8: carob seed powder 5% (+95% WF)
  • C9: carob seed powder 10% (+90% WF)
  • C10: blend of 10% carob pod powder/10% carob seed powder (+80% WF)
  • C11: blend of 15% carob seed powder/5% carob pod powder (+80% WF)
  • C1″ to C11″: baked cakes’ samples based on the corresponding blend formulation (as listed above).

2.2. Rheological Parameters Determination

Humidity is crucial in rheological determinations, and it was determined by the reference method ISO 712: 2009 [29], consisting of determining the water content of a 5 g sample after 1 h and 30 min, at atmospheric pressure and at 130 °C. Alveograph measurements were performed using the Alveo PC (Chopin Technology, La Garenne, France) following the standardized method (AACC 54-30) [30]. Besides the wheat flour sample (control C3), all the fortified preparations were evaluated. The following alveographic parameters: tenacity (p), extensibility (L), baking strength (W), and elasticity (I.e) were automatically recorded by the software. The protocol consisted of four steps. Firstly, a mixture of flour and salted water was prepared; secondly, the steps of preparation of five calibrated pieces of dough took place. Finally, the dough was left to rest, and it automatically rises until the resulting bubbles burst. The test began with the preparation of the dough by mixing flour, distilled water, and salt (0.25 g). Rheological properties (firmness and extensibility of the dough) were measured with a Chopin alveograph apparatus (Chopin Technology, La Garenne, France), within a 40 min test consisting of the three-dimensional extension of a sample of dough (water + salt + flour) under the action of a constant flow of air, and the formation of a cell. Since humidity is critical to the test, the initial conditions were set to T = 22–25 °C and relative humidity 55–70%. The alveograph apparatus includes a special graduated ICC burette containing a 2.5% NaCl aqueous solution (in distilled water). The volume of the water introduced depends on the humidity and it is calculated according to a conversion table by the device. A sample of 250 g of flour was poured into the apparatus’ kneader and the calculated amount of water was dispensed in 20 s through the hole in the lid of the device. Kneading time (8 min) and water content were constant along the test. At the end of kneading, the dough was rolled and cut into circular specimens. After 20 min resting time, and adjustment of the thickness of the dough pieces, a dough disk was placed in the alveograph apparatus, at a constant airflow rate. Dough resists pressure by swelling in the form of bubbles, and the graphic recording of the pressure variations inside the bubble as a function of time is the alveograph and the end of this test corresponds to the rupture of the bubble. The analysis of the alveograph curve informs about the rheological properties of the sample under test, notably the firmness of the gluten and the extensibility of the dough.

2.3. Color Determination

Color parameters were measured according to CIELAB color scale. The colorimeter (Chroma Meters Measuring Head CR 400- Konica Minolta, Japan) was placed directly on the sample in detecting the following parameters: L*—lightness (0–100%) and representing dark to light; a*—green to red (−60 to 60), with a higher positive a* value indicating more red, and b*—blue to yellow (−60 to 60), with a higher positive b* value indicating more yellow.

2.4. Texture Determination (and Related Parameters)

The texture of the dough and bread was measured, at ambient temperature using a Perkin Elmer TVT 6700 Texture Analyzer type texturometer and assessing several parameters, such as hardness, elasticity, weight, in bread and cake samples.

2.5. Flour Composition

Determination of the ash rate was performed after incineration of the test sample at 900 °C according to ISO 2171:2007 [31]. From a 10 g sample of flour, three gluten parameters were determined: wet gluten, dry gluten, and gluten index, according to ISO 21415-2:2015 [32].

2.6. Aroma Volatile Compounds Analysis

The aromatic profiles of the studied samples (wheat flour, carob flour, cakes, and breads) were analyzed using a Supelco Solid Phase Micro-Extraction (SPME) fiber coated with polydimethylsiloxane (PDMS, 100 µm); a 2 g sample was placed into a 5 mL glass vial and left to equilibrate for 30 min. Then the headspace was sampled for 50 min at room temperature using the same fiber and same conditions for all the samples and blanks, which were executed before each first SPME extraction and randomly repeated during each series. Comparisons of relative peak areas were performed between the same chemicals in the different samples. For GC-MS analysis, an Agilent 7890B gas chromatograph (Agilent Technologies Inc., Santa Clara, CA, USA) equipped with an Agilent HB-5MS (Agilent Technologies Inc., Santa Clara, CA, USA) capillary column (30 m × 0.25 mm; coating thickness 0.25 μm) and an Agilent 5977B single quadrupole mass detector (Agilent Technologies Inc., Santa Clara, CA, USA) were used. Injector and transfer line temperatures were 220 and 240 °C, respectively; oven temperature programmed from 60 °C to 240 °C, at 3 °C min−1; carrier gas helium at 1 mL min−1; splitless injection. Compounds were identified based on their retention times, in relation to those of pure standards, comparing their linear retention indices (L.R.I.) relative to the series of n-hydrocarbons, using the information from the National Institute of Standards and Technology library (NIST 2014 and ADAMS) and homemade library mass spectra built from pure substances and components of known mixtures, and MS literature data.

2.7. Acceptance Test

One hundred volunteer consumers were recruited, in public places (e.g., open-air markets, schools), at different locations in Tunisia to performed hedonic tests; informed consent was granted, and personal data were not disclosed; inclusion criteria were age from 18 to 65 years old, frequency of basic school, and a pre-assessment of their overall liking of bread and bakery (deduced from purchasing and consumption frequency, as well as familiarity with breads). Group diversity was sought regarding gender, age, and scholarly level as well as professional occupation/socio-economic status. Participants were mostly women (70%), the predominant age range was 19–29 y. The highest group variability was by educational level (from incomplete basic school to higher education degrees) and by professional level (including unemployed, students, and various occupations), and hence the socio-economical level. These naïf consumers (non-trained) were asked to participate in three tasting sessions with 11 samples each, assessing overall appreciation (mostly aspect, and smell), texture, taste, and odor, by scoring each parameter in an anonymized form. Consumers involved in the study were asked to evaluate samples before and after the enrichment process according to their preference and expressing their degree of liking using a 9-point hedonic scale (scores: like extremely: 9; like very much: 8; like moderately: 7; like slightly: 6; neither like nor dislike: 5; dislike slightly 4; dislike moderately: 3; dislike very much: 2; dislike extremely: 1) [33]. Each consumer filled out a questionnaire on personal data and other information (age, gender, region of origin, socio-professional category, and consumption frequency of bread). Blind and randomized bread samples (50 g) were served at room temperature, in transparent glasses labeled with a three-digit code, ensuring the consumers are deprived of any background information concerning the samples to be tasted.

2.8. Statistical Analysis

Data were processed by SPSS statistical package (Version 12.00 for Window, SPSS Inc. Chicago, IL, USA, 2003). The significance of differences at a 5% level among means was determined by ANOVA, using Tukey’s test. For the acceptance sensory test, to check if a difference between samples existed, statistical analysis using the two-way ANOVA test was used.

3. Results and Discussion

Two types of carob flour were used in the formulation experiments, and both were produced from Tunisian carob pods (also termed carob pulp) dried under the sun. The obtained carob pulp powder, or pod flour (C1) and carob seed flour (C2) (see Figure 1) were then blended in different proportions with white wheat flour (C3/WF), analyzed, baked, and finally submitted to different tests, from bread composition analysis to consumer acceptance, as described in the materials and methods section. The different bread formulations showed different shades of color, mainly due to the quantity of carob in the blend as shown in Figure 2. Results from C4 are not shown or discussed below.

3.1. Rheological Properties of Flour (Wheat Flour, Carob Flour, Carob Seed Flour, and Flour Mixture)

Concerning consumer acceptance in respect to the rheological properties of the tested bread formulations (that is firmness and extensibility of the dough), it is noteworthy that Tunisian and most probably many other bread consumers from all over the world, are used to the properties of white wheat bread (first row in Table 1). Thus, WF is herein used as a positive control (for desirable rheological properties) of alveographical parameters, namely extensibility (p) and elasticity (I.e) contributed by gluten.
Breads made of 100% carob pulp flour and of 100% carob seed flour were herein used as negative controls because carob does not contain gluten and hence p and I.e do not change during the alveograph test (null values for the alveographic parameters).
The first row of Table 1 shows that the moisture content (H) of the white flour complies with Tunisian regulations (13 < H < 15 %), with a tolerance of 1%, according to the ministerial decree of November 22, 1966. Despite the carob seed flour (C2), the sixth column has a very low humidity (5.9 ± 0.5%), its inclusion in the tested blends did not have much influence on the humidity of final flour mixtures. The tenacity of the dough (p) is its resistance to deformation and the p-value of the wheat white flour (71.2 mm) complies with the Tunisian regulations (60 < p < 80 mm). We observed that this parameter generally decreases with the addition of carob pulp to white flour and increases with the addition of carob seed powder. The recorded variation was 55.4 < p < 276.7 mm, with the lowest value corresponding to WF enriched with 10% carob pod (C5), and the highest value corresponding to WF enriched with 10% carob seed flour (C9). Thus, a remarkable increase in tenacity (p), of up to four times upon the addition of carob seed flour to WF, was observed.
The extensibility of the dough (L) is the length of the swelling curve. For the tested formulations, it was 14.4 < L < 60.6 mm, with the highest value corresponding to WF and the lowest obtained with C11 (see Section 2 for details on sample coding). We noticed a general decrease of L upon the addition of carob pod flour or carob seed flour to WF (Table 1).
The parameter “G”, expressed in cm3, represents the ability of the dough to swell. The highest swelling capacity was obtained with WF control (G = 17.08 cm3), while the lowest G value (8.4 cm3) was observed for C11 flour blend (5% of carob pulp + 15% carob seed + 80% wheat). On the other hand, the baking strength (W) is an important rheological parameter that represents the work of deformation applied to the dough. The W lowest value (58 × 10−4 J) was obtained for C7 (30% carob pod + 70% baking flour), while the highest one (W = 186.7 × 10⁻⁴ J) was showed by C9 (10% carob seed powder + 90% white flour). As can be observed in Table 1, W generally decreases with the addition of carob pulp, while it increases with the proportion of carob seed in the formulation. The absence of rheological properties in the control formulations C1 and C2 was predictable and can be attributed to the absence of gluten. It is noteworthy to recall herein that the term “gluten” refers to a family of proteins present in wheat, rye, and barley that are responsible for “sticking” the starch molecules, communicating volume, elasticity, and a soft texture to bread (and other foods).

3.2. Flour Composition

Each type of flour was analyzed for ash and gluten content (% w/w). The ash content is a measure of the total mineral elements present in a food and it results from the incineration of the samples followed by the destruction of organic matter. In the present work an ash content of 0.3% in the WF control sample was registered, much lower than the ash content of carob pod and carob seed flour, respectively 2% and 4.16%, which implies that the mineral contents of carob pod and seed are seven times higher than that of WF. It can therefore be deduced that carob (pulp and seed) is rich in mineral matter, possibly making a relevant contribution of potassium (K) and calcium (Ca), as well as iron (Fe), to the human diet. Özcan et al. [19] identified 20 mineral compounds in carob flour: aluminum (Al), boron (B), barium (Ba), calcium (Ca), cobalt (Co), chromium (Cr), copper (Cu), iron (Fe), potassium (K), lithium (Li), magnesium (Mg), manganese (Mn), silver (Ag), sodium (Na), nickel (Ni), phosphorus (p), strontium (Sr), titanium (Ti), vanadium (V) and zinc (Zn). Among them, four minerals dominated the fraction: K, p, Ca, and Na. The same authors [19] reported that carob flour had higher calcium and potassium content than shelled almonds, dried apples, dried and sulfured apricots, salted and roasted cashews, roasted and shelled European chestnuts, roasted and unsalted peanuts. They also showed that carob flour had higher protein values than dried apricot, dried figs, raisin, and roasted chestnuts [19]. It seems that this protein fraction is completely gluten-free. We registered a gluten content of about 12 g/100 g in WF control and no gluten was detected in any of the carob flour types (Table 2).
Coeliac disease and gluten-related disorders, which have been typically affecting around 1% of the population worldwide, have been reported to be rising [34,35,36]. Independently of the full understanding of the causes and the debates on remedial approaches, there is undisputable and increasing evidence for non-celiac-gluten-sensitivity (NCGS). On the other hand, the quantity of gluten in our daily food intake has been increasing with advances in food processing, and the issue is particularly of concern when noting the proportion of ultra-processed foods in the diet [37]. In the case of white wheat flour, it is easily deduced that by removing certain compounds during refining processes (e.g., fibers, polyphenols) the proportion of the others automatically increases (e.g., gluten, readily digestible starch). Food intolerance issues are recognised by food authorities and addressed by specific regulations, including food labeling [38].

3.3. Textural Proprieties of Carob Enriched Bread Formulations

The quality of bread is often described by the texture, volume, and aroma. As expected, the textural properties of bread containing carob flour are different from those of white wheat. We noticed a negative relationship between the height of the sample and the amount of enriching carob powder. The lowest value (22.91 mm) was registered for C11 (15/5) with a value that is about half that of white flour bread (44.48 mm). On the other hand, the hardness of breads enriched with carob pulp increased with the addition of carob powder from a value of 446.7 g (C4) to a value of 1404.3 g (C7). The C11 blend (15% C + 5% G + 70% WF) was about four times harder than white bread (WF), with a value of 2062.3 g. The enrichment of WF with carob powder (pulp and carob seed) allowed to gradually increase the hardness. The elasticity of white bread had a value of around 0.45 mm. This parameter gradually increased with the addition of carob seed flour, up to a value of 0.49 mm obtained for C9 and C8. The blend with the highest springiness value was C2 (0.51 mm). Therefore, it can be inferred that adding carob seed powder to WF makes the resulting bread more elastic (probably applies to other bakery goods as well).

3.4. Color Properties of Carob-Enriched Bread Formulations

The chromatic properties of a food can be described by the parameters: L*, a*, and b*: L indicates the brightness of the product, “a” indicates the red index, and “b” indicates the yellow index. Thus, if L tends to 100, the product is clearer, and if L* tends to 0, the product is darker. Values of a* range in a scale of color from green to red, while blue and yellow are indicated by the letter b*. Note that the clarity values of the crust of breads C8 (57.6), C5 (57.5) C11 (52.1), and C6 (51.9) are slightly higher than the control WF bread (51.5), while the crust clarity of C1 and C2 are the lowest values among all the samples tested, respectively 28.7 and 31.9. In other words, C1 and C2 are the darkest bread formulations. The values of a* and b* are highest for the control WF bread (21 for the red index and 34.7 for the yellow index). The values for the chromatic parameters of tested bread formulations are summarized in Figure 3, which indicates that the incorporation of carob pod powder (C1) and carob seed powder (C2) increases the red color index (up to a value of 12.5 for C5), and decreases the value of the yellow index, reaching 15.1 for C2 and 19.4 in the case of C6.

3.5. Aroma Compounds and Volatile Contaminants

The aromatic composition is considered to be a quality criterion for bakery and pastry products, since it is essential for their approval by the consumer, and therefore all the ingredients and the final products have been characterized. We registered the presence of isocetane in higher amounts in white flour, in proportional amounts in the carob/wheat blends, and it was not detected in carob. Isocetane is thus associated with refined wheat flour (WF). The main aromatic compounds present in white flour were: n-heptane (14.7%), isobutyric acid (8.3%), 3-ethyl-1-hexanol (18.9%), limonene (18.9%), and 1,8-cineole (7.8%). In terms of series, non-terpene derivatives are the dominant aromatic fraction, with 28.7% of non-terpene hydrocarbons, 9% of non-terpene aldehydes/ketones, 22.5% of non-terpene alcohols/ethers, and 8.3% of acids (data not shown). Isobutyric acid was the major aromatic compound in carob seed (39.9%) followed by acetic acid (10.2%), limonene (9.2%), and n-hexane (5.5%). The present study is in good agreement with the literature, which confirms the abundance of isobutyric acid in carob flour, the volatile compound responsible for its typical sweet and buttery flavor [39,40,41]. Isobutyric acid is a branched short-chain fatty acid (SCFA) recently referred to as important for gut health and other conditions, including in coeliac disease [42,43].
Carob flour was found to contain other SCFA, mainly pentanoic acid (27.2%) and hexanoic acid (15.7%), in addition to other aroma compounds such as carvone (6.0%), limonene (5.5%), 1,8-cineole (5.4%), and linalool (4.8%). Krokou, Stylianou, and Agapiou [41] have studied the volatile profile of carob (Ceratonia siliqua L.) and they found different volatiles corresponding to different organs of the plant. Thus, in the carob fruit, that is in flour obtained from the pod, acids were the dominant volatile group, followed by esters, while terpenoids dominated in the flower of the C. siliqua. Isobutyric acid was found to be the main acid in both, whereas ethanol dominated the volatile fraction in the flower. Krokou, Stylianou, and Agapiou [41] identified more than 50 volatile compounds in carob powder, represented mainly by propanoic acid, 2-methybutanoic acid, pentanoic acid, hexanoic acid, furfural, and heptanoic acid [44,45].
Baking and pastry processing modifies the volatile fraction of the products formulated from white wheat and carob flour. Firstly, we have noted that the baking process stimulated the formation of compounds other than those produced by pastry. The baking process mainly stimulated the formation of acetoin (55.0%), 1,3-butanediol (15.20%), isopentyl alcohol (9.50%), and 2,3-butanediol (6.90%). Other minor compounds, such as 3-ethyl-1-hexanol, phenylethyl alcohol, and limonene were also detected (Table 3). Hence, bread aroma is more complex than that of flour since it is influenced by fermentation and baking.
As previously observed by Issaoui et al. [46], the baking process stimulates the formation of certain compounds, mostly from Maillard reactions, which determine sensorial properties and cause accumulation of less desirable compounds, sometimes designated as natural contaminants. A relevant category of such compounds encompasses furan derivatives, such as 2-methylfuran, dihydro-2-methyl-3(2H)-furanone, furfural, furfuryl alcohol, 5-methylfurfural, 2-pentyl furan and 2-butanoyl-5-methylfuran [38,47,48]. In our study, we noted that the pastry manufacture process generated more furan compounds than the baking process (Figure 4).
Indeed, the levels of furan compounds in the case of cake samples are between 9.1% and 9.4%. Another relevant remark is that cakes produced from white flour have the highest amount of furan compounds compared to cakes produced from carob flour. In addition, the cakes produced from carob pulp flour have lesser amounts of furan derivatives than those formulated from carob seed flour. It is important to remember that the amount of sugar added to produce cake is the same for all the samples of pastry products. However, the amount of furan compounds present in the white flour cakes (9.4%) is three times greater than that in the cakes produced from carob bean flour (3.8%) and six times more concentrated than cakes made from carob pulp flour (1.4%). Papageorgiou et al. [25] associated aromatic notes with various furan compounds and they stated that many of these derivatives resemble the smell of caramel. Among them, 2-pentyl furan, a product of the oxidative degradation of linolenic acid, exerts a very significant aromatic impact with a very low odor threshold, reminiscent of green, earthy, and beany. Another important aroma compound, 5-methyl-furfural, gives the cake balsamic, cinnamon, sweet, and cocoa notes. Furfural, which contributes to the final aroma with its sweet and almond-like odor, was present at low levels in the studied samples (Figure 4). The major differences between our samples and those analyzed by Papageorgiou et al. [25] in terms of furan derivatives can be explained by the fact that in our samples, carob was used raw, whilst those authors [25] roasted carob flour before the baking process. Despite the benefits of providing aromatic notes and odors that appeal to consumers, furan compounds can be carcinogenic, as demonstrated by many authors and authorities. The European Food Safety Authority (EFSA) has stated that regular consumption of furan and/or its derivatives through food could lead to liver damage in the long term [47].
Based on the experimental evidence of this study, it is possible to state that producing bakery products from carob is safer than making them from wheat white flour, at least in terms of furan compounds.
Maillard reactions’ products were also identified, among the volatiles emitted by both bread and pastry, (Figure 4). Schieberle and Grosch [49] reported high levels of pyrazine compounds in bread crust and other authors also refer to it in the crumb [50]. Pyrazines are produced by the complex heat-induced Maillard reactions that mainly occur on the dough surface during baking [51]. External factors, such as temperature and humidity, favor the production of Maillard compounds [52]. In the present study, pyrazine derivatives are present in bread and cake samples produced from white wheat flour in percentages of about 1.3 and 1.4%, respectively (Figure 4). Methylpyrazine is the unique derivative of this chemical class identified in cakes. On the contrary, bread contains four derivatives: 2,3-dimethylpyrazine (0.1%), 2-ethylpyrazine (0.2%), 2,5-dimethylpyrazine (0.2%), and methylpyrazine (0.8%). No pyrazine compounds occurred among aroma compounds of cakes produced from carob flour, and only 2,5-dimethylpyrazine (0.8%) was detected in carob seed flour cakes. The bread obtained from the blends of flour (white wheat, carob pod/pulp, carob seed) produced an important level of pyrazine compounds (13.7%). Each pyrazine derivative confers a roast-like odor. However, there are some small differences in the final note of each derivative, that is, methylpyrazine is characterized by an odor of roasted, burnt, and sweet, whereas 2,5-dimethylpyrazine, 2-ethylpyrazine, and 2,3-dimethylpyrazine recall the smell of crust popcorn, nutty and roasted [53].

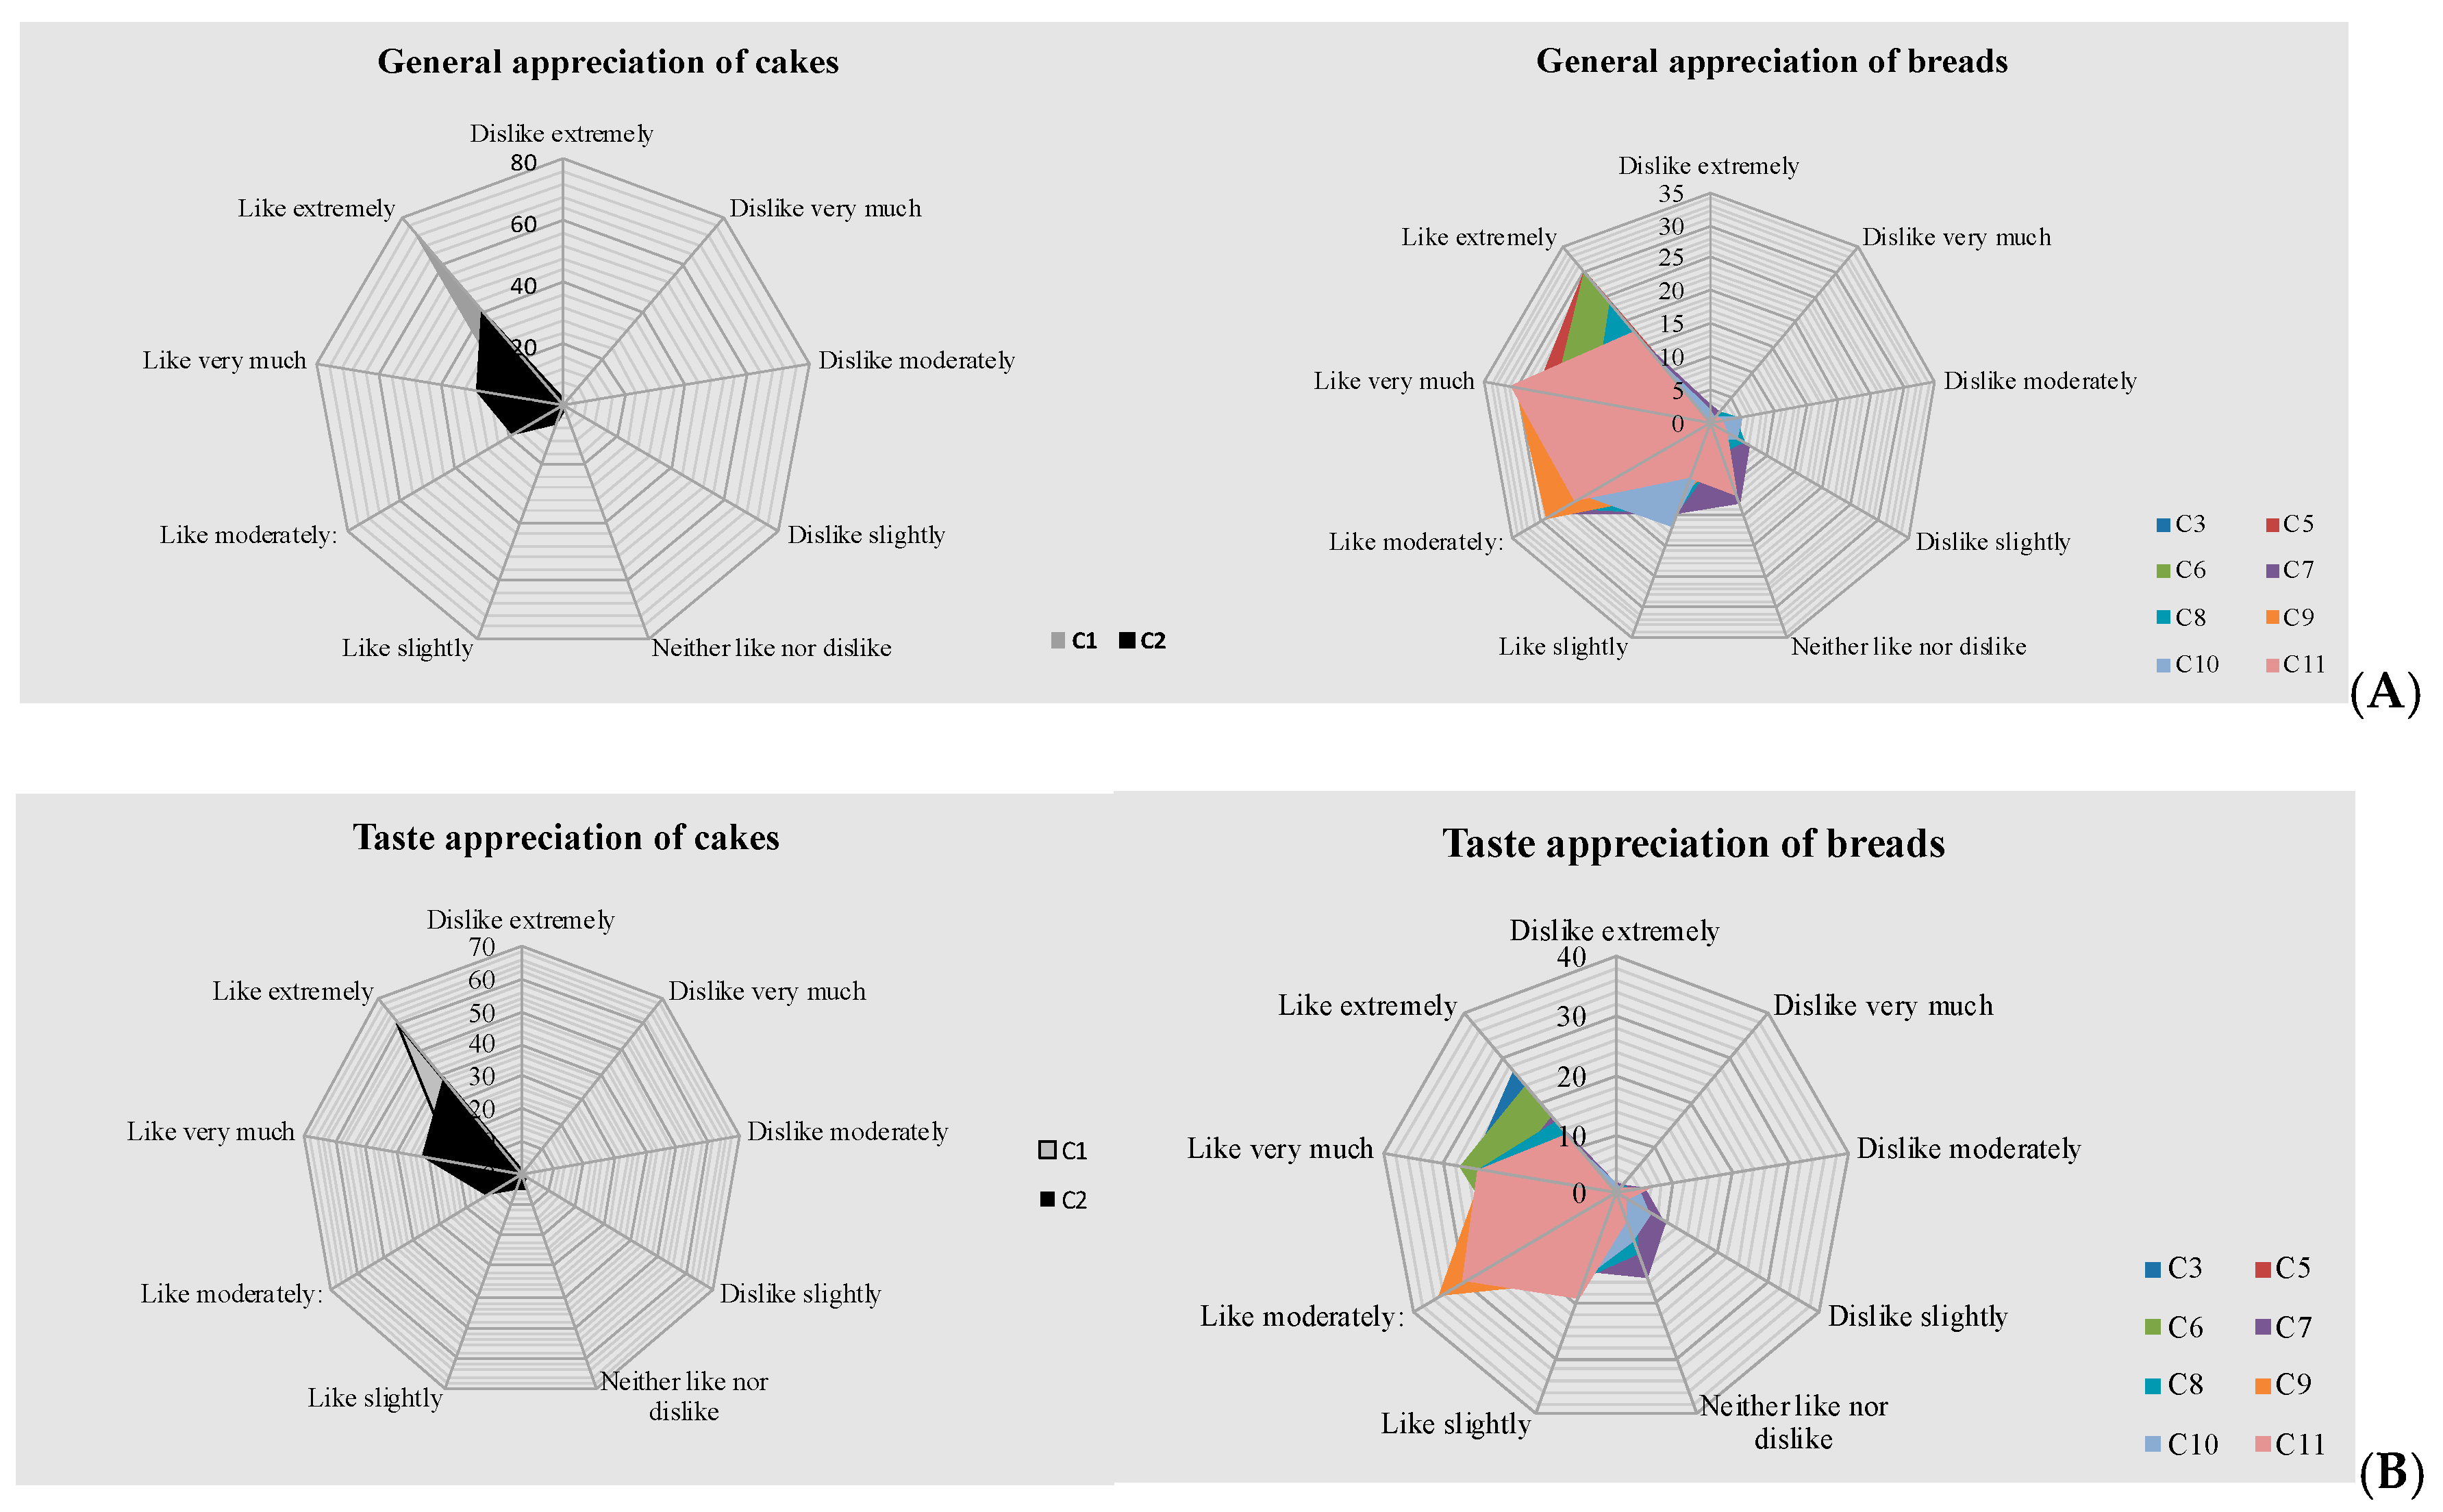
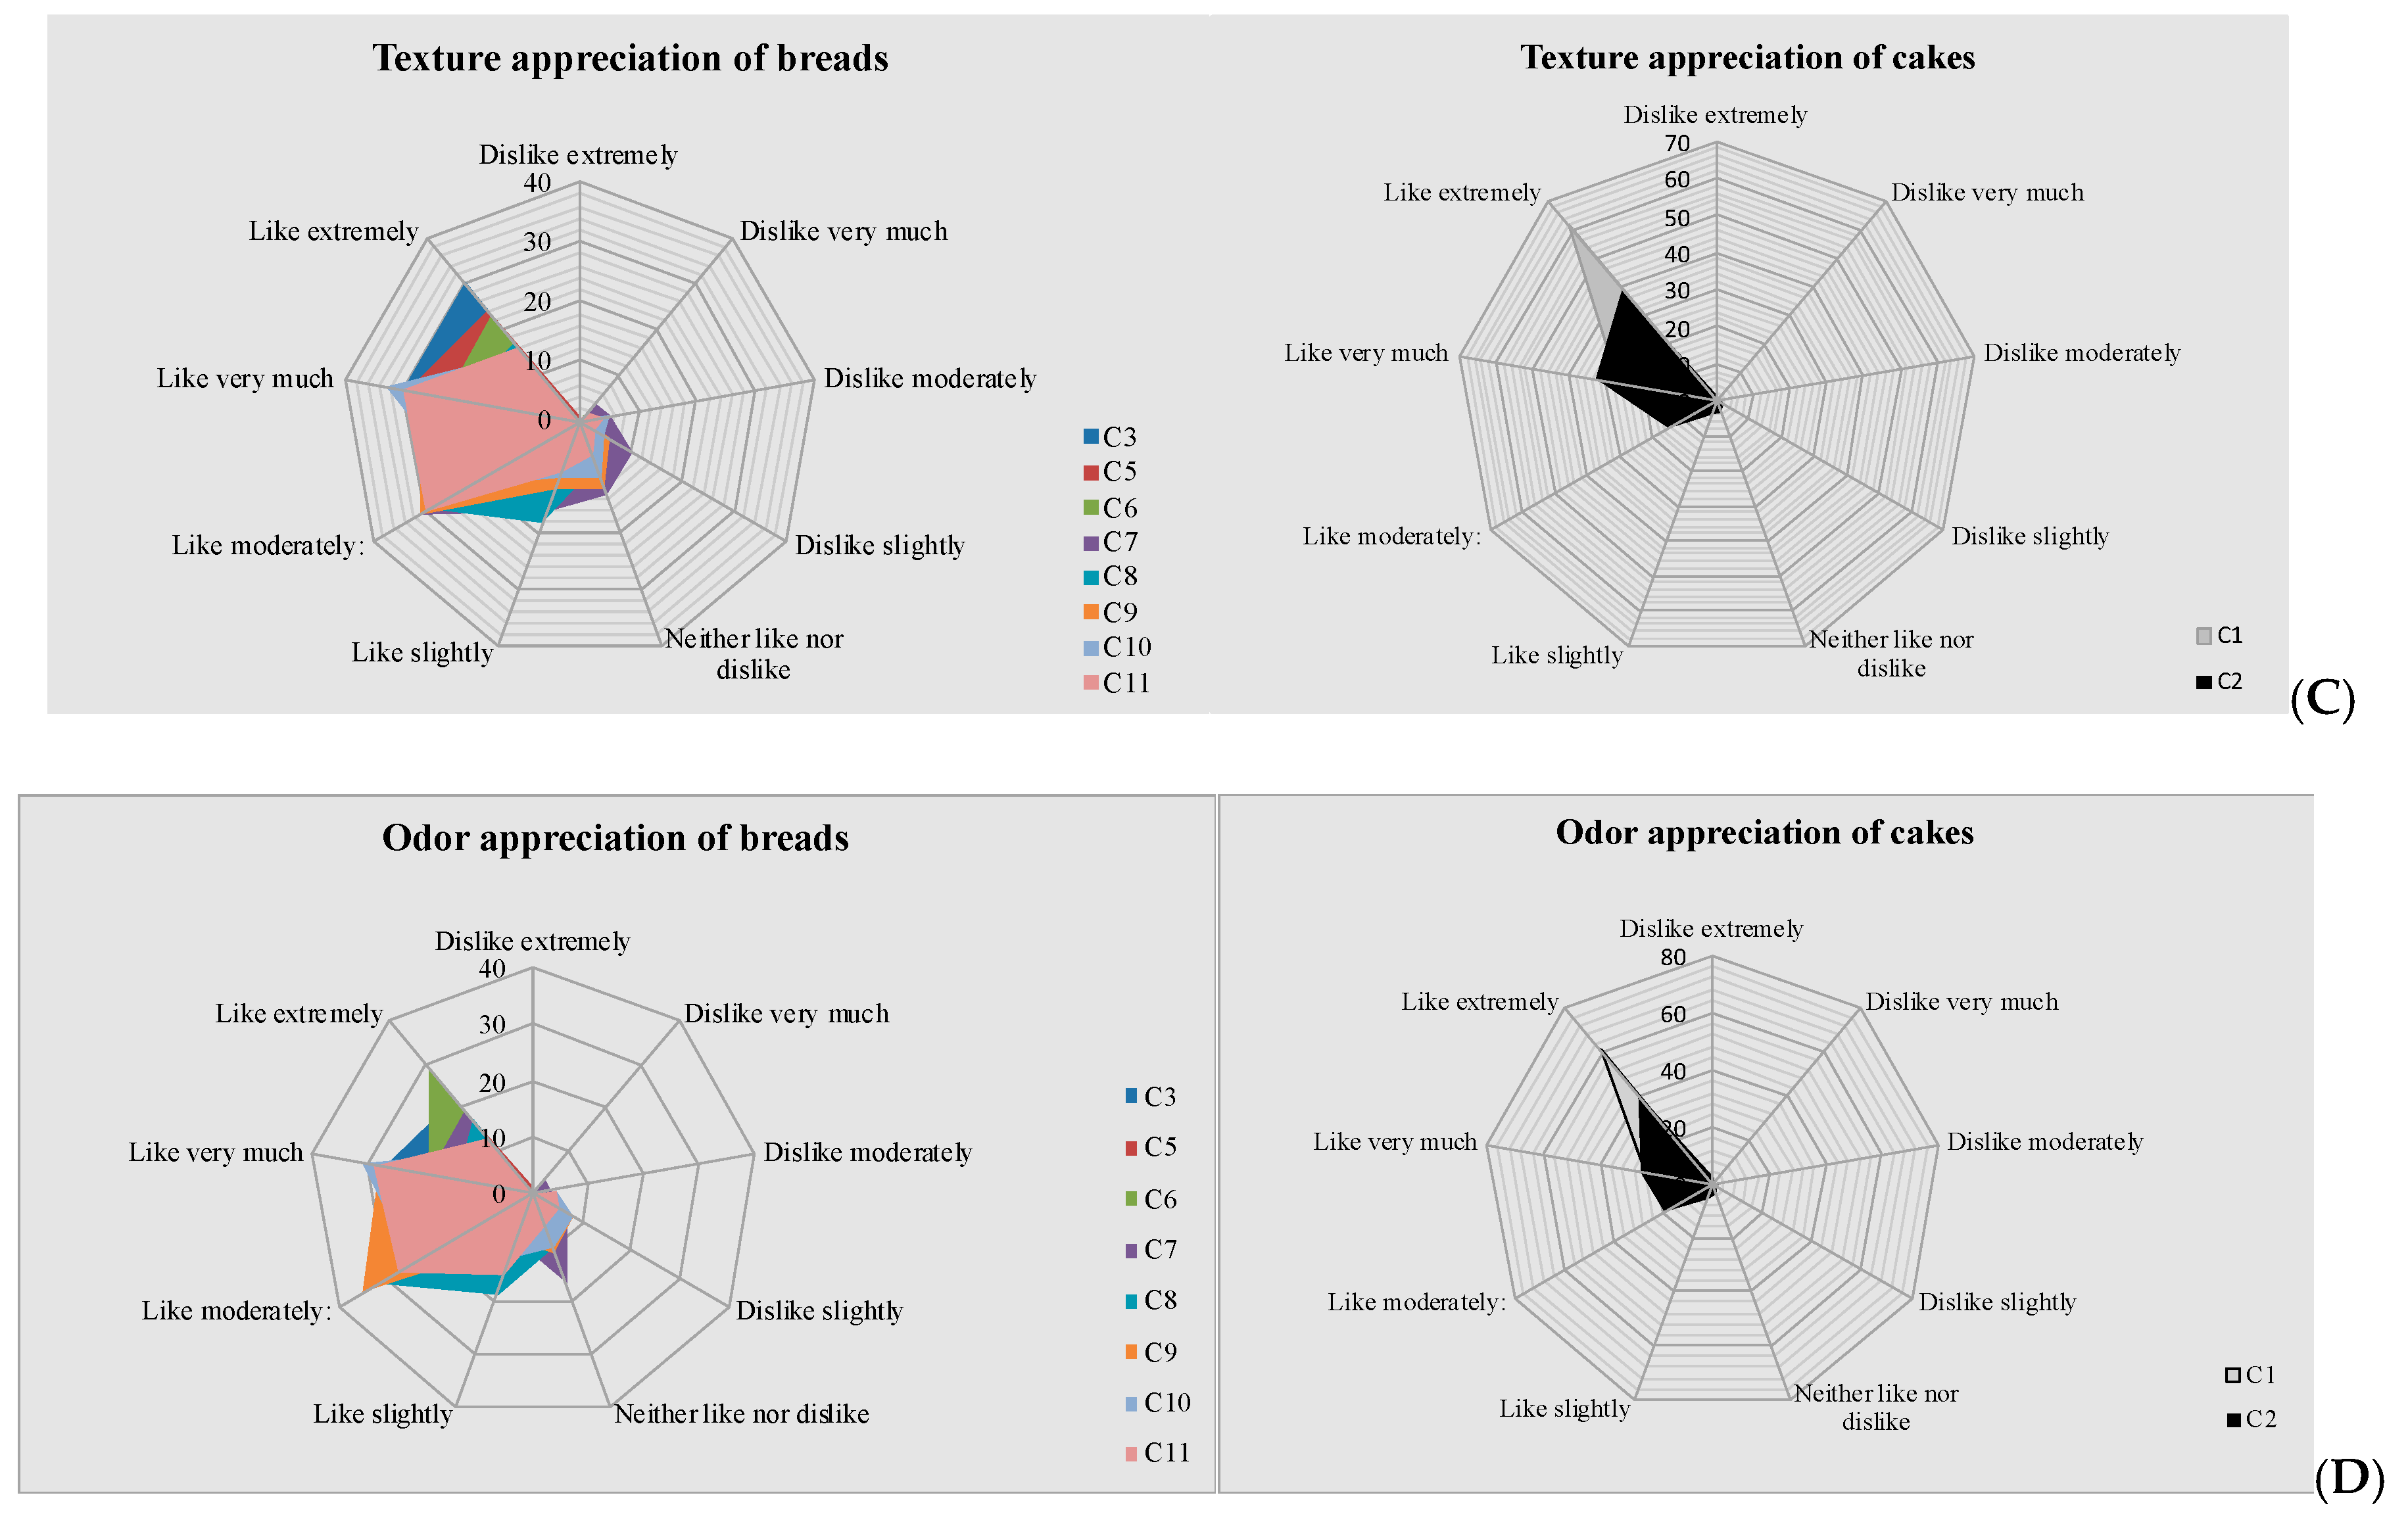
3.6. Hedonic Studies

For the hedonic evaluation, 100 Tunisian consumers of various ages, gender, and socio-economic levels were recruited to voluntarily taste both samples of WF bread and those obtained with the carob blend formulations. Consumers were asked to state their preference for the new products by filling out a questionnaire, focusing on the following parameters: taste, texture, odor, and overall appreciation (Figure 5).
With respect to consumer appreciation, the best-scored bread samples were the two cake formulations based on carob pod powder and carob seed powder. The carob pod cake formulation (C1) was the most appreciated by consumers with about 75% overall appreciation (Figure 5), followed by the seed cake (C2) with an appreciation of 40%. On the other hand, and regarding bread, C10 and C7 were the least accepted formulations. In respect to texture, samples of fortified bread (C5 to C11) were less appreciated than C3 (WF control bread), and the worst score was obtained by C7 (bread from WF + 30% carob pod powder), because, as above-mentioned in respect to textural properties, this blend resulted to be very hard (1404.3 g). In relation to odor, and within the enriched bread formulations, the consumers showed a preference for C5 and C6 (bread made from WF blended respectively with 10% and 20% carob pod or pulp). The Tunisian consumers verbally expressed their high appreciation for the carob smell, for it reminds one of the smell of cocoa. The less appreciated formulations, in terms of odor, were C9 and C10 (bread made from WF blended respectively with 10% seed flour and from the blend with 10% carob pulp powder + 10% carob seed powder). The results were thus encouraging with respect to the general preference for the fortified bread formulations.
Carob flour has no rheological properties since the gluten content of enriched bread formulations is lower than in white wheat flour and, in general, blending it with wheat flour negatively affects these properties in the resulting bread. The incorporation of the carob pulp powder increases the deformation energy. However, the carob seed powder appears to strongly induce an increase in extensibility, related to the WF control. We verified that pastry products obtained from carob flour contain fewer furan contaminants than those obtained from white flour.
The hedonic study disclosed the consumers’ preference for carob pastries based on formulations C1 and C2 (corresponding to the prominent lines—‘like extremely’ of Figure 5). The blend of carob flour in white wheat flour changed the color profile but not necessarily in a negative manner.
In closing this section, it should be noted that white wheat bread is a staple food practically worldwide, often found in some ultra-processed version (of high glycemic index, high in gluten, and poor in micronutrients and nutraceuticals), being simultaneous a burden to health and to the environment, even if not accounting for the increased probability of carrying contaminants of various types and origins. Espinoza-Orias et al. [54] estimated the carbon footprint of current white bread as about 1200 g of CO2 eq. per 800 g unit bread (150 g CO2 eq./100 g of white bread). By using standardized life cycle analysis (LCA) methodologies, these authors as well as and Kulak et al. [55] found bread emissions’ hotspots to be firstly wheat cultivation, and secondly processing steps (as milling and refining of flour, extra-ingredients and additives, the cold storage of the dough, and baking). By replacing part of the white flour with carob (e.g., 10%) a noticeable decrease in the carbon footprint can be expected.
Firstly, at the cultivation level, the C footprint of cereal cultivation is generally high although depending on how heavily machinery (and fuel), water, fertilizers, and pesticides are used, and on the amount of waste generated at harvest. Conversely, carob pods (with their seeds within) are manually harvested from trees and no waste is generated. Moreover, the commonly used intensive modes for cereal cultivation cause soil degradation and more, while the carob tree (Ceratonia siliqua) generally acts regeneratively, including by sequestering CO2 [21,22,23,56], a trait which is at least as important as the crop’s low water requirement and labor demand.
Secondly, at the processing stage, as the large dry pods are easy to grind, and thus, the obtainment of carob flour is a simpler process than wheat milling and refining. Thus, white wheat flour obtainment from grain consumes relevant amounts of water and energy, as referred above, while the energy requirements in the obtainment of carob flour are much lower, and no water is used.
Concerning environmental impact, carob-enriched bakery products will thus perform much better than common ultra-processed bakery products. Ultra-processed bakery foodstuffs include ingredients as palm oil derivatives and emulsifiers that increase the environmental footprint of the final product (against SDG 13 and SDG 15 indicators). The processing steps of such mainstream products generally rely on refrigerated stocking of the dough adding extra energy consumption and hence substantially increasing the carbon footprint of ultra-processed bread and bakery goods. Conversely, since artisanal-type bread-making generally involves a yeast fermentation step, dough refrigeration is not a usual practice, thus resulting in important energy saving.
However, in many cases (e.g., including with other foodstuffs), cooling is often unavoidable for food safety reasons, but the issue of refrigeration can be handled by agri-food enterprises in different ways, such as optimizing the already installed cooling capacity by using, for instance, closed coupled components in compact refrigeration packages, electronic refrigerant injection control technology, and by optimizing compressors’ operation [57].
The environmental impact of other energy-intensive processing stages, such as baking, can be minimized in several different ways, namely through the optimization of thermal exchanges and insulation. For example, exhaust gases from the baking process can be recovered to preheat combustion air in existing systems, based on thermal power generation, delivering significant fuel, cost, and CO2 savings [58]. The use of renewable energies may further contribute to decreasing the C footprint by avoiding the use of fossil fuels in energy-demanding steps and may include the use of direct solar radiation or solar cooking systems [59,60]. Moreover, from a public health perspective, the results and the approach herein presented, of carob-enriched bread, are in line with Turfani and others [61], demonstrating that sustainable innovation practices can be easily adopted, with advantages to all.

4. Conclusions

A demand by consumers for healthier and sustainable foods has resulted in a panoply of innovative foodstuffs, some of which are inspired by the Mediterranean tradition of combining carob flour with wheat flour in making bread and pastries, once used in times of scarcity. In south European countries (e.g., Portugal, Greece), such revisited traditions and revamped products are presently the core businesses of familiar companies, and such simple, sustainable, and profitable practices can be replicated in poorer Mediterranean regions and inspire change in other food manufacturing sectors. Thus, a simple change in bread formulation may help improve:
(a)
SDG2, zero hunger, by tackling obesity, allergies, and nutritional deficiencies if consumers prefer nutrient-dense wheat and carob bread, instead of the ultra-processed types (nutritionally poor and deleterious to health). On the other hand, environmental impact can be simultaneously minimized while valuing local biodiversity and local food traditions, which are concerns of today’s consumers;
(b)
SDG 12, responsible consumption, and production, because partially replacing wheat by carob, decreases are expected in production-based nitrogen emissions and nitrogen emissions embodied in imports, given the low requirements of carob trees when compared to cereals;
(c)
SDG 13, climate action, by adopting simpler formulations (e.g., removing palm oil), significant reductions in CO2 emissions embodied in imports can be achieved; lower energy-related CO₂ emissions are to expect in consequence of the partial replacement of wheat flour (obtained from energy-intensive processes) by carob flour (requiring less energy). When artisanal breadmaking and less processed bakery products are adopted, local distribution and shorter supply chains become more adequate, and thus transportation-related CO2 emissions are also expected to be lower;
(d)
SDG 15, life on land, improvements are expected for the same reasons, since promoting sustainable breadmaking over ultra-processed versions (encompassing the elimination of palm oil) will halt the permanent deforestation, also decreasing the contribution to terrestrial and freshwater biodiversity threats embodied in imports.
The bakery sector is an example of one that needs changes in food processing and this work points to clues and feasible ways to do so. From the sustainability point of view and taking into consideration the Life Cycle Assessment, the steps with more negative environmental impact (or higher Carbon footprint) are cultivation, milling, baking, retail, and all the transportation involved. Retail and transportation are common factors with many other food industries and were not herein analyzed, but there is an obvious need for change, namely by reducing food transportation especially under refrigeration.
In short, the present work shows that the manufacture of more sustainable and healthy bakery products is within the reach of all, as we propose herein a simple affordable approach consisting in enriching the widely available white wheat flour, with a nutrient-rich, locally produced flour, with some extra efforts in energy savings (e.g., by preferring solar) accompanying these new formulations.
To top it all off, carob is a typical Mediterranean product that allows for the formulation of a wide variety of sustainable foodstuffs with high nutritive value, lower carbon footprint, and which are safe, healthy, tasty, and affordable all at once.

Author Contributions

Conceptualization and laboratory investigation by M.I. and G.F.; original draft preparation by all authors, review and editing by A.D. All authors have read and agreed to the published version of the manuscript.

Funding

This research was supported by the Tunisian Ministry of Higher Education and Scientific Research (UR03ES08).

Institutional Review Board Statement

Ethical review and approval were waived for this study, due to the anonymity of the research questionnaire.

Informed Consent Statement

Informed consent was obtained from all subjects involved in the study.

Data Availability Statement

Experimental data are herein published and additional data can be made available upon request.

Acknowledgments

Aroma analyses were performed at the Dipartimento di Farmacia, Università di Pisa, Italy. Other experimental work was carried at the Department of Biotechnology, Faculty of Science and Technology of Sidi Bouzid, University of Kairouan, Sidi Bouzid, Tunisia.

Conflicts of Interest

The authors declare no conflict of interest.

References

  1. Dasgupta, P. The Economics of Biodiversity: The Dasgupta Review, Abridge version; HM Treasury: London, UK, 2021. [Google Scholar]
  2. TEEB. TEEB for Agriculture & Food: Scientific and Economic Foundations; UN Environment: Geneva, Switzerland, 2018. [Google Scholar]
  3. UNEP (United Nations Environment Programme). Emissions Gap Report 2019. Available online: http://www.unenvironment.org/emissionsgap (accessed on 20 January 2021).
  4. Keairns, D.L.; Darton, R.C.; Irabien, A. The Energy-Water-Food Nexus. Annu. Rev. Chem. Biomol. Eng. 2016, 7, 239–262. [Google Scholar] [CrossRef]
  5. Lange, L.; Connor, K.O.; Arason, S.; Bundgård-Jørgensen, U.; Canalis, A.; Carrez, D.; Gallagher, J.; Gøtke, N.; Huyghe, C.; Jarry, B.; et al. Developing a Sustainable and Circular Bio-Based Economy in EU: By Partnering across Sectors, Upscaling and Using New Knowledge Faster, and for the Benefit of Climate, Environment & Biodiversity, and People & Business. Front. Bioeng. Biotechnol. 2021, 8, 1456. [Google Scholar] [CrossRef]
  6. Rippin, H.L.; Wickramasinghe, K.; Halloran, A.; Whiting, S.; Williams, J.; Hetz, K.; Pinedo, A.; Breda, J.J. Disrupted food systems in the WHO European region—A threat or opportunity for healthy and sustainable food and nutrition? Food Secur. 2020, 23, 1–6. [Google Scholar] [CrossRef] [PubMed]
  7. Serres, A.; Murtin, F.; Nicoletti, G. A Framework for Assessing Green Growth Policies. In OECD Economics Department Working Papers; No. 774; OECD Publishing: Paris, France, 2010. [Google Scholar] [CrossRef]
  8. Clark, M.A.; Domingo, N.; Colgan, K.; Thakrar, S.K.; Tilman, D.; Lynch, J.; Azevedo, I.L.; Hill, J.D. Global food system emissions could preclude achieving the 1.5 °C and 2 °C climate change targets. Science 2020, 370, 705–708. [Google Scholar] [CrossRef] [PubMed]
  9. Kok, K.P.W.; Boer, A.C.L.; Cesuroglu, T.; Meij, M.G.; Wildt-Liesveld, R.; Regeer, B.J.; Broerse, J.E.W. Transforming Research and Innovation for Sustainable Food Systems—A Coupled-Systems Perspective. Sustainability 2019, 11, 7176. [Google Scholar] [CrossRef] [Green Version]
  10. Food and Agriculture Organization of the United Nations. Livestock’s Long Shadow–Environmental Issues and Options; FAO: Rome, Italy, 2006. [Google Scholar]
  11. Clark, M.; Tilman, D. Comparative analysis of environmental impacts of agricultural production systems, agricultural input efficiency, and food choice. Environ. Res. Lett. 2017, 12, 064016. [Google Scholar] [CrossRef]
  12. FAO & CIHEAM. FAO-CIHEAM Partnership—Advancing Sustainable Rural Development in the Mediterranean; FAO: Rome, Italy, 2020. [Google Scholar]
  13. Poore, J.; Nemecek, T. Reducing food’s environmental impacts through producers and consumers. Science 2019, 363, eaaw9908, Erratum in 2018, 360, 987–992. [Google Scholar] [CrossRef] [PubMed] [Green Version]
  14. Willett, W.; Rockström, J.; Loken, B.; Springmann, M.; Lang, T.; Vermeulen, S.; Garnett, T.; Tilman, D.; DeClerck, F.; Wood, A.; et al. Food in the Anthropocene: The EAT-Lancet Commission on healthy diets from sustainable food systems. Lancet 2019, 393, 447–492. [Google Scholar] [CrossRef]
  15. Serra-Majem, L.; Tomaino, L.; Dernini, S.; Berry, E.M.; Lairon, D.; Ngo de la Cruz, J.; Bach-Faig, A.; Donini, L.M.; Medina, F.X.; Belahsen, R.; et al. Updating the Mediterranean Diet Pyramid towards Sustainability: Focus on Environmental Concerns. Int. J. Environ. Res. Public Health 2020, 17, 8758. [Google Scholar] [CrossRef]
  16. Tarsitano, E.; Calvano, G.; Cavalcanti, E. The Mediterranean Way a model to achieve the 2030 Agenda Sustainable Development Goals (SDGs). J. Sustain. 2019, 12, 108–119. [Google Scholar] [CrossRef]
  17. UNESCO. Intangible Cultural Heritage, Mediterranean Diet. Available online: https://ich.unesco.org/en/RL/mediterranean-diet-00884 (accessed on 20 January 2021).
  18. Food and Agriculture Organization of the United Nations. FAO. FAOSTAT. Available online: http://www.fao.org/faostat/en/#data/QC (accessed on 11 July 2020).
  19. Özcan, M.M.; Arslan, D.; Gökçalik, H. Some compositional properties and mineral contents of carob (Ceratonia siliqua) fruit, flour and syrup. Int. J. Food Sci. Nutr. 2007, 58, 652–658. [Google Scholar] [CrossRef]
  20. Papaefstathiou, E.; Agapiou, A.; Giannopoulos, S.; Kokkinofta, R. Nutritional characterization of carobs and traditional carob products. Food Sci. Nutr. 2018, 6, 2151–2161. [Google Scholar] [CrossRef] [PubMed]
  21. Lal, R. Home gardening and urban agriculture for advancing food and nutritional security in response to the COVID-19 pandemic. Food Secur. 2020, 23, 1–6. [Google Scholar] [CrossRef]
  22. Vanham, D.; Mak, T.N.; Gawlik, B.M. Urban food consumption and associated water resources: The example of Dutch cities. Sci. Total Environ. 2016, 565, 232–239. [Google Scholar] [CrossRef]
  23. Correia, P.J.; Pestana, M. Exploratory Analysis of the Productivity of Carob Tree (Ceratonia siliqua) Orchards Conducted under Dry-Farming Conditions. Sustainability 2018, 10, 2250. [Google Scholar] [CrossRef] [Green Version]
  24. Barak, S.; Mudgil, D. Locust bean gum: Processing, properties and food applications—A review. Int. J. Biol. Macromol. 2014, 66, 74–80. [Google Scholar] [CrossRef]
  25. Papageorgiou, M.; Paraskevopoulou, A.; Pantazi, F.; Skendi, A. Cake Perception, Texture and Aroma Profile as Affected by Wheat Flour and Cocoa Replacement with Carob Flour. Foods 2020, 9, 1586. [Google Scholar] [CrossRef]
  26. Goulas, V.; Stylos, E.; Chatziathanasiadou, M.V.; Mavromoustakos, T.; Tzakos, A.G. Functional Components of Carob Fruit: Linking the Chemical and Biological Space. Int. J. Mol. Sci. 2016, 17, 1875. [Google Scholar] [CrossRef] [PubMed]
  27. Tsatsaragkou, K.; Gounaropoulos, G.; Mandala, I. Development of gluten free bread containing carob flour and resistant starch. LWT Food Sci. Technol. 2014, 58, 124–129. [Google Scholar] [CrossRef]
  28. Rodríguez-Solana, R.; Coelho, N.; Santos-Rufo, A.; Gonçalves, S.; Pérez-Santín, E.; Romano, A. The Influence of In Vitro Gastrointestinal Digestion on the Chemical Composition and Antioxidant and Enzyme Inhibitory Capacities of Carob Liqueurs Obtained with Different Elaboration Techniques. Antioxidants 2019, 8, 563. [Google Scholar] [CrossRef] [PubMed] [Green Version]
  29. ISO 712:2009. Cereals and Cereal Products—Determination of Water Content—Reference Method; International Organization for Standardization: Geneva, Switzerland, 2009. [Google Scholar]
  30. AACC. Alveograph Method for Soft and Hard Wheat Flour. In Approved Methods of Analysis, 11th ed.; AACC Method 54-30.02; Cereals & Grains Association: St. Paul, MN, USA, 1999. [Google Scholar]
  31. ISO 2171:2007. Cereals, Pulses and By-Products—Determination of Ash Yield by Incineration; International Organization for Standardization: Geneva, Switzerland, 2007. [Google Scholar]
  32. ISO 21415-2:2015. Wheat and Wheat Flour—Gluten Content—Part 2: Determination of Wet Gluten and Gluten Index by Mechanical Means; International Organization for Standardization: Geneva, Switzerland, 2015. [Google Scholar]
  33. Peryam, D.R.; Girardot, N.F. Advanced taste method. J. Food Eng. 1952, 24, 58–61. [Google Scholar]
  34. Fasano, A.; Sapone, A.; Zevallos, V.; Schuppan, D. Nonceliac gluten sensitivity. Gastroenterology 2015, 148, 1195–1204. [Google Scholar] [CrossRef]
  35. Ford, R.P.K. The gluten syndrome: A neurological disease. Med. Hypotheses 2009, 73, 438–440. [Google Scholar] [CrossRef] [PubMed]
  36. Lebwohl, B.; Sanders, D.S.; Green, P. Coeliac disease. Lancet 2018, 391, 70–81. [Google Scholar] [CrossRef]
  37. Fardet, A. Wheat-based foods and non celiac gluten/wheat sensitivity: Is drastic processing the main key issue? Med. Hypotheses 2015, 85, 934–939. [Google Scholar] [CrossRef]
  38. European Commission—Directorate for Health and Food Safety. Guidelines Relating to the Provision of Information on Substances or Products Causing Allergies or Intolerances as Listed in Annex II of Regulation (EU) No 1169/2011 on the Provision of Food Information to Consumers; European Commission: Brussels, Belgium, 2011. [Google Scholar]
  39. Pali-Schöll, I.; Untersmayr, E.; Klems, M.; Jensen-Jarolim, E. The Effect of Digestion and Digestibility on Allergenicity of Food. Nutrients 2018, 10, 1129. [Google Scholar] [CrossRef] [Green Version]
  40. Boublenza, I.; Lazouni, H.A.; Ghaffari, L.; Ruiz, K.; Fabiano-Tixier, A.S.; Chemat, F. Influence of roasting on sensory, antioxidant, aromas, and physicochemical properties of carob pod powder (Ceratonia siliqua L.). J. Food Qual. 2017, 2017, 1–10. [Google Scholar] [CrossRef] [Green Version]
  41. Krokou, A.; Stylianou, M.; Agapiou, A. Assessing the volatile profile of carob tree (Ceratonia siliqua L.). Environ. Sci. Pollut. Res. Int. 2019, 26, 35365–35374. [Google Scholar] [CrossRef]
  42. Niccolai, E.; Baldi, S.; Ricci, F.; Russo, E.; Nannini, G.; Menicatti, M.; Poli, G.; Taddei, A.; Bartolucci, G.; Calabrò, A.S.; et al. Evaluation and comparison of short chain fatty acids composition in gut diseases. World J. Gastroenterol. 2019, 25, 5543–5558. [Google Scholar] [CrossRef]
  43. Rios-Covian, D.; González, S.; Nogacka, A.M.; Arboleya, S.; Salazar, N.; Gueimonde, M.; de Los Reyes-Gavilán, C.G. An Overview on Fecal Branched Short-Chain Fatty Acids Along Human Life and as Related with Body Mass Index: Associated Dietary and Anthropometric Factors. Front. Microbiol. 2020, 11, 973. [Google Scholar] [CrossRef] [PubMed]
  44. Farag, M.A.; El-Kersh, D.M. Volatiles profiling in Ceratonia siliqua (carob bean) from Egypt and in response to roasting as analyzed via solid-phase microextraction coupled to chemometrics. J. Adv. Res. 2017, 8, 379–385. [Google Scholar] [CrossRef]
  45. Racolta, E.; Tofana, M.; Muresan, C.C.; Socaci, C.; Florin, G.G.; Vlad, M. Volatile compounds and sensory evaluation of spreadable creams based on roasted sunflower kernels and cocoa or carob powder. Bull. UASVM Food Sci. Technol. 2014, 71, 107–113. [Google Scholar] [CrossRef]
  46. Issaoui, M.; Nesrine, M.; Flamini, G.; Delgado, A. Enrichment of white flour with spices positively impacts safety and consumer acceptance of bread. Int. J. Food Sci. Technol. 2020, 14834, 1–13. [Google Scholar] [CrossRef]
  47. European Food Safety Authority (EFSA). Furan in Food—EFSA Confirms Health Concerns. 2017. Available online: https://www.efsa.europa.eu/en/press/news/171025 (accessed on 10 December 2020).
  48. FAO/WHO; Commission du Codex Alimentarius; Programme Mixte FAO/OMS sur les Normes Alimentaires; Comité du CODEX sur les Contaminants dans L’Alimentation. 5eme Session, CX/CF 11/5/13, Document de Travail sur le Furane; FAO/WHO: Hague, the Netherlands, 2011. [Google Scholar]
  49. Schieberle, P.; Grosch, W. Potent odorants of rye bread crust—Differences from the crumb and from wheat bread crust. Z. Lebensm. Unters. Forsch. 1994, 198, 292–296. [Google Scholar] [CrossRef]
  50. Martins, S.I.F.S.; Jongen, W.M.F.; van Boekel, M.A.J.S. A review of Maillard reaction in food and implications to kinetic modelling. Trends Food Sci. Technol. 2000, 11, 364–373. [Google Scholar] [CrossRef]
  51. Hodge, J.E. Dehydrated foods–Chemistry of browning reactions in model systems. J. Agric. Food Chem. 1953, 1, 928–943. [Google Scholar] [CrossRef]
  52. Kaminski, E.; Przybilski, R.; Gruchala, L. Thermal degradation of precursors and formation of flavour compounds during heating of cereal products. Part I. Changes of amino acids and sugars. Food Nahr. 1981, 25, 507–518. [Google Scholar] [CrossRef]
  53. Pico, J.; Bernal, J.; Gómez, M. Wheat bread aroma compounds in crumb and crust: A review. Food Res. Int. 2015, 75, 200–215. [Google Scholar] [CrossRef] [PubMed]
  54. Espinoza-Orias, N.; Stichnothe, H.; Azapagic, A. The carbon footprint of bread. Int. J. Life Cycle Assess. 2011, 16, 351–365. [Google Scholar] [CrossRef]
  55. Kulak, M.; Nemecek, T.; Frossard, E.; Chable, V.; Gaillard, G. Life cycle assessment of bread from several alternative food networks in Europe. J. Clean. Prod. 2015, 90, 104–113. [Google Scholar] [CrossRef]
  56. Correia, P.J.; Guerreiro, J.F.; Pestana, M.; Martins-Loução, M.A. Management of carob tree orchards in Mediterranean ecosystems: Strategies for a carbon economy implementation. Agrofor. Syst. 2017, 91, 295–306. [Google Scholar] [CrossRef]
  57. Medici, M.; Canavari, M.; Toselli, M. Interpreting Environmental Impacts Resulting from Fruit Cultivation in a Business Innovation Perspective. Sustainability 2020, 12, 9793. [Google Scholar] [CrossRef]
  58. Mukherjee, S.; Asthana, A.; Howarth, M.; Chowdhury, J.I. Techno-Economic Assessment of Waste Heat Recovery Technologies for the Food Processing Industry. Energies 2020, 13, 6446. [Google Scholar] [CrossRef]
  59. Cuce, E.; Cuce, P.M. Theoretical investigation of hot box solar cookers having conventional and finned absorber plates. Int. J. Low Carbon Technol. 2015, 10, 238–245. [Google Scholar] [CrossRef] [Green Version]
  60. Panwar, N.L.; Kaushik, S.C.; Kothari, S. State of the art of solar cooking: An overview. Renew. Sustain. Energy Rev. 2012, 16, 3776–3785. [Google Scholar] [CrossRef]
  61. Turfani, V.; Narducci, V.; Durazzo, A.; Galli, V.; Carcea, M. Technological, nutritional and functional properties of wheat bread enriched with lentil or carob flours. LWT 2017, 78, 361–366. [Google Scholar] [CrossRef]
Figure 1. Diagram summarizing the manufacturing steps of carob pod and seed flours (on the left), and processing steps involved in the preparation of cakes (with different wheat/carob flour blends) and bread, also manufactured with wheat flour enriched with carob bean and carob pulp flour (on the right).
Sustainability 13 08026 g001
Figure 2. Artisanal bakery products prepared from different blends of wheat flour with carob flour (pod, and/or seed, sundried, ground, and sieved to obtain a defined particle size); three samples of each formulation (n = 3) with different color tones according to the amount of carob in the blend; (A) artisanal “baguette” bread; (B) baked cakes based on the same flour blend formulations.
Sustainability 13 08026 g002
Figure 3. Color proprieties of the crust (A) and crumb (B) of bakery products obtained from the tested formulations of carob and wheat flour blends; M1 to M11 are the same describers that C1 to C11, the ordinate scale shows the values for color parameters b*: indicates the yellow index; a*: red index; L*: indicates the clarity of the product. (Displayed mean values (n = 3) should be regarded as trends, only).
Sustainability 13 08026 g003
Figure 4. Compounds formed during the baking process. (A): furanic compounds; (B): Pyrazine compounds; sample fractions as represented in the figure from the left to the right; C3: bread obtained from white flour, only; C3″: cake obtained from white flour, only; C1: cake from carob pulp powder, only; C7: bread from 30% carob pulp powder; C6: bread from 20% carob pulp powder; C5: bread from 10% carob pulp powder; C2: cake from carob seed powder, only; C9: bread from 10% carob seed powder; C8: bread from 5% carob seed powder; C10: bread from blend of 10% carob pulp powder + 10% carob seed powder; C11: bread from blend of 15% carob seed powder + 5% carob pulp powder. (Results are presented as means; n = 3; standard error = 0.068).
Sustainability 13 08026 g004aSustainability 13 08026 g004b
Figure 5. Sensorial evaluation of bread/cake formulations by a non-trained panel (hedonic studies); evaluated parameters were general appreciation (A), taste (B), texture (C), and odor (D).
Sustainability 13 08026 g005aSustainability 13 08026 g005b
Table 1. Humidity and rheological proprieties of wheat flour (WF) and of different blends of wheat/carob flour (from pod and/or seed, sundried, ground, and sieved to obtain a defined particle size) presented as average values ± standard deviation (n = 3).
WFCarob Pulp Powder (%)Carob Seed Powder (%)Mixture
C3C1C7C6C5C2C9C8C10C11
H (%)14.80 a ± 0.1113.53 ± 0.7513.40 b ± 0.7513.50 b ± 0.1113.70 b ± 0.005.90 c ± 0.5014.0 a ± 0.0014.20 a ± 0.1113.60 b ± 0.2313.20 b ± 0.00
p(mmH2O)71.20 c ± 4.26nd69.00 c ± 1.7389.60 c ± 6.8755.40 c ± 2.60nd276.7 a ± 4.99134.60 b ± 5.94253.40 a ± 3.48164.0 b ± 1.54
L (mm)60.60 a ± 2.39nd20.20 b ± 3.1130.80 b ± 5.5853.4 a ± 7.63nd15.75 c ± 2.3630.80 b ± 4.8114.80 c ± 0.0014.40 c ± 3.57
G (cm³)17.08 a ± 2.85nd9.96 c ± 0.7512.28 b ± 1.1216.18 a ± 1.15nd8.80 c ± 0.6612.26 b ± 0.968.54 c ± 0.258.40 c ± 1.04
W (10−4j)152.0 ab ± 2.95nd58.00 c ± 1.81119.4 b ± 9.50103.6 b ± 13.39nd186.7 a ± 4.80178.2 a ± 2.52160.4 ab ± 15.9397.20 b ± 7.93
p/L1.28 d ± 0.43nd3.55 c ± 1.362.82 ± 0.701.05 d ± 0.14nd17.57 a ± 1.654.45 c ± 0.6517.15 a ± 2.5012.63 b ± 9.97
I.e47.9 a ± 1.33ndndnd41.12 a ± 3.19ndndndndnd
Hardness (g)446.7 f ± 6.00410.8 f ± 14.61404.3 b ± 5.20879.6 c ± 9.95646.9 d ± 4.40541.8 e ± 25.35668.3 d ± 6.08512.1 e ± 34.04671.9 d ± 74.642062.3 a ± 87.10
Elasticity (mm)0.45 b ± 0.000.45 b ± 0.000.44 b ± 0.010.41 b ± 0.010.42 b ± 0.010.51 a ± 0.010.49 a ± 0.010.49 a ± 0.010.48 ab ± 0.010.45 b ± 0.00
Weight (g)44.48 d ± 1.9064 b ± 5.9958 bc.0 ± 2.6461 b.0 ± 1.7355.0 c ± 1.0084 a ± 5.5667.0 b ± 3.6066 b.0 ± 1.7363 b.0 ± 2.0056 c ± 1.73
Height (mm)65.00 a ± 2.6440.58 b ± 0.6927.89 d ± 0.9036.37 c ± 0.3335.44 c ± 0.4842.78 b ± 0.3133.77 c ± 0.3039.77 bc ± 0.0736.45 c ± 0.0922.91 d ± 0.11
Values in the same row with different superscript letters (a,b,c,d,e,f) represent significant differences between treatment for the same sample at p < 0.05 by Tukey’s test (n = 3); nd: not detected; WF: white wheat flour; C1: carob pod powder; C2: carob seed powder; C3: white flour only; C4: carob pod powder 5%; C5: carob pod powder 10%; C6: carob pod powder 20%; C7: carob pod powder 30%; C8: carob seed powder 5%; C9: carob seed powder 10%; C10: blend of 10% carob pod powder/10% carob seed powder; C11: blend of 15% carob seed powder and 5% carob pod powder.
Table 2. Ash and gluten content of Wheat white Flour (WF) and of different blends of wheat/carob flour (from pod and/or seed, sundried, ground, and sieved to obtain a defined particle size) presented as average values ± standard deviation (n = 3).
Wheat FlourFlour Enriched with Different % of Carob Pulp PowderFlour Enriched with Different % of Carob Seed PowderFlour Enriched with Mixture (Seed & Pulp)
C3C1C7C6C5C2C9C8C10C11
Ash (%)0.33 e ± 0.001.99 b ± 0.000.66 d ±0.000.66 d ± 0.000.66 d ±0.004.16 a ±0.231.00 c ± 0.000.66 d ± 0.000.99 bc ± 0.001.00 c ± 0.00
Gluten hydration (%)65.84 b ± 0.21nd53.90 c ± 3.2661.84 b ± 0.8465.92 b ± 0.23nd70.35 a ± 3.1065.69 b ± 6.2223.34 d ± 2.4123.25 d ± 2.01
Gluten, humid (g)35.86 b ± 4.30nd18.45 d ± 4.5836.3 b ± 0.6330.69 b ± 1.14nd26.19 c ± 5.3434.71 b ± 8.3554.41 a ± 6.5454.83 a ± 8.01
Gluten, dry (g)12.25 a ± 1.54nd8.58 c ± 2.7113.84 a ± 0.0610.45 b ± 0.31nd7.84 c ± 2.3912.16 a ± 5.0210.56 b ± 0.4210.50 b ± 2.54
Values in the same row with different superscript letters (a,b,c,d,e) represent significant differences between treatment for the same sample at p < 0.05 by Tukey’s test (n = 3); nd: not detected.WF: wheat flour; C1: carob pod powder, only; C2: carob seed powder, only; C3: wheat flour, only; C5: WF + 10% carob pod powder; C6: WF + 20% carob pod powder; C7: WF + 30% carob pod powder; C8: WF + 5% carob seed powder; C9: WF + 10% carob seed powder; C10: WF + blend 10% carob pod powder/10% carob seed powder; C11: WF + 15% carob seed powder/5% carob pod powder.
Table 3. Aromatic compounds detected in commercial wheat flour and in different blends of wheat flour and carob powder (from pod and/or seed, sundried, ground, and sieved to obtain a defined particle size).
Volatile Compounds (%)Retention indicesWhite Wheat FlourCarob Pulp Enriched FlourCarob Seed Enriched FlourBlend (Carob Pulp & Seed)
C3″ C3C1″C6C5C2″C9C8C10C11
CakeBreadCakeBreadBreadCakeBreadBreadBreadBread
Acetic acid603ndnd2.70 ± 0.14ndnd2.5 ± 0.214.1 ± 0.144.3 ± 0.216.9 ± 0.282.5 ± 0.21
Isovaleraldehyde65413.8 ± 0.28nd1.40 ± 0.14ndndndndndndnd
2-methylbutanal65713.7 ± 0.28ndndndndndndndndnd
2-pentanone697ndndndnd40.0 ± 1.062.3 ± 0.14ndnd0.3 ± 0.000.7 ± 0.07
n-heptane700ndndndnd10.2 ± 0.35nd1.1 ± 0.14nd0.9 ± 0.070.4 ± 0.07
Methyl isobutyrate6934.30 ± 0.21ndndndndndndndndnd
Pentanal7013.50 ± 0.14ndndndndndndndndnd
Acetoin707nd55.0 ± 0.640.6 ± 0.146.2 ± 0.281.1 ± 0.0748.9 ± 0.6438.5 ± 0.4951.8 ± 0.574.7 ± 0.1425.5 ± 0.28
Isopentyl alcohol7361.90 ± 0.079.50 ± 0.350.5 ± 0.003.5 ± 0.145.7 ± 0.21ndndnd6.2± 0.21nd
Isobutyric acid773ndnd74.4 ± 1.1368.5 ± 0.71ndndndnd46.1 ± 0.64nd
1-ethoxy-2-propanol7483.3 ± 0.14ndndndndndndndndnd
1,3-butanediol788nd15.20 ± 0.35ndnd7.8 ± 0.2115.0 ± 0.2826.3 ± 0.3516.6 ± 0.35nd27.0 ± 0.42
2,3-butanediol790nd6.90 ± 0.14ndnd5.8 ± 0.1415.3 ± 0.3516.6 ± 0.288.2 ± 0.21nd14.8 ± 0.35
Butyric acid801ndnd4.4 ± 0.214.0 ± 0.21ndndndnd2.6 ± 0.14nd
Hexanal80211.9 ± 0.28ndndndndndndndndnd
2-methylbutyric acid863ndnd1.7 ± 0.073.7 ± 0.14ndndndndndnd
1-hexanol8697.2 ± 0.21ndndndndnd0.3 ± 0.00ndndnd
Anisole920ndndndndndndndndnd14.7 ± 0.35
Hexanoic acid989ndnd4.1 ± 0.28ndndndndndndnd
Butyl butyrate9962.4 ± 0.07ndndndndndndndndnd
3-ethyl-1-hexanol10310.5 ± 0.072.80 ± 0.14ndnd4.0 ± 0.14nd2.1 ± 0.070.6 ± 0.070.4 ± 0.07nd
Limonene10327.50 ± 0.143.60 ± 0.21nd1.2 ± 0.146.6 ± 0.28nd1.3 ± 0.141.8 ± 0.071.8 ± 0.071.1 ± 0.14
Phenylethyl alcohol1111nd1.40 ± 0.07ndndndndndndndnd
Veratrole1149ndndndndndndndndnd3.1 ± 0.28
p-vinylanisole1154ndndndndndndndndnd3.6 ± 0.14
WF: white wheat flour; C1: carob pod powder, only; C2: carob seed powder, only; C3: white wheat flour, only; C5: WF enriched with 10% carob pod powder; C6: WF + 20% carob pod powder; C7: WF + 30% carob pod powder; C8: WF + 5% carob seed powder; C9: WF + 10% carob seed powder; C10: WF enriched with blend of 10% carob pod powder/10% carob seed powder; C11: WF enriched with blend of 15% carob seed powder/5% carob pod powder. C1″-C11″: the same flour blends when used in cakes; nd: not detected (results are presented as mean ± standard deviation; n = 3).
Publisher’s Note: MDPI stays neutral with regard to jurisdictional claims in published maps and institutional affiliations.

