Abstract
More than half of the world’s population lives in cities. A large part of the emissions and energy consumption corresponds to buildings, both in the residential sector and in the service sector. This means that a large part of the measures taken by governments to reduce energy consumption and greenhouse gas emissions are focused on this sector. With this background, this paper studies energy consumption in city buildings and the CO2 emissions they produce. It only makes use of publicly available data. The analysis is made from the point of view of income per inhabitant, and the results are obtained per inhabitant and household. To facilitate the analysis of the results, an index has been defined. The main contributions of this work are to analyze energy consumption and emissions due to buildings, study them from the point of view of the income of their inhabitants, and consider cities individually. The proposed methodology has been applied to the case of Spain. A total of 145 Spanish cities that have more than 50,000 inhabitants have been studied. The results show that the higher the income, the higher the consumption and emissions. Electricity consumptions are almost inelastic, while those of thermal origin are greatly influenced by the level of income. Regarding CO2 emissions, the percentage of emissions of electrical origin with respect to total emissions is higher than that of thermal origin. In addition, the lower the income, the higher the percentage of emissions of electrical origin.
1. Introduction
Among the main greenhouse gases (GHG), CO2 is the most worrying since it represents 80% of total emissions. Furthermore, more than 80% of emissions are due to energy, with only a third corresponding to transport [1]. A very important part of this energy consumption and of these emissions corresponds to buildings, both in the residential sector and in the service sector. They account for 40% of emissions and 36% of energy consumption [2].
More than half of the world’s population lives in cities. They consume between 60 and 80% of energy and produce 75% of carbon emissions [3]. Therefore, it is clear how important cities are to achieve efficient use of energy and a reduction in GHG emissions. In fact, within the United Nations sustainable development goals, goal 11 focuses specifically on them, although it is also present in goals 7, 12, and 13 [3].
The COVID−19 pandemic has mainly affected cities, where more than 90% of cases have occurred [4], and also caused a major economic crisis. Because of this, the European Union has launched a EUR 750 billion recovery plan, Next Generation EU, based on The European Green Deal with the aim of building a greener, more inclusive, digital, and sustainable Europe [5]. To achieve this, it has issued an action plan for boosting the circular economy. This plan focuses on six fields of action, one of which is construction and buildings [6].
Therefore, considering the importance that cities in general and buildings have on saving energy and reducing GHG emissions, policy makers have focused their attention on them. For this reason, this article studies the consumption of electrical and thermal energy (natural gas) in city buildings. It should be taken into account that these types of energy are those usually consumed in buildings [7]. This knowledge of the relationship between population income, emissions, and energy consumption aims to be one more element that helps utilities and policy makers in their decision-making task to favor the reduction of emissions, energy savings, and infrastructure planning. Other studies have provided this help by providing information on cities through the geographical information system to characterize the energy performance [8] and consider them as positive energy districts [9].
Considering the whole city as an entity, this study presents a methodology to analyze the influence that income has on both energy consumption and emissions in each city. In addition, it makes use of public information in order not to have to invest time or money in studies and surveys to obtain the information. The information exists, but it must be treated appropriately. As in other studies, the objective is to obtain results from some variables, in this case, from population income. For this, the method used is based on others that, although classic, have still been used recently. These are based on the use of information from statistical databases [10,11,12] and on the creation of synthetic populations [13].
Finally, the application of the proposed methodology to the specific case of Spanish cities with more than 50,000 inhabitants is shown. To the knowledge of the authors, a similar analysis has not been carried out. The main contributions of this paper are to analyze energy consumption and emissions due to buildings at the city level, study them from the point of view of the income of their inhabitants, and take into consideration all the cities of a country separately and not in aggregate.
The article is structured as follows: Section 2 presents studies that relate energy consumption and emissions in cities with the income of their inhabitants; Section 3 describes the proposed methodology, based on the use of information available from different official databases; Section 4 shows the detail of the proposed application to the case of Spanish cities with more than 50,000 inhabitants; Section 5 presents the results and their discussion; and finally, Section 6 summarizes the conclusions of the study.
2. Literature Review
The works that study what is investigated by this paper are reviewed, and income is the variable whose influence is analyzed, so this review focuses on it. This study analyzes, based on the income of its inhabitants, the consumption of energy in the form of electricity and natural gas, and the CO2 emissions produced in cities. However, what appears in the literature is the influence that certain variables have on each other. Among them are gross domestic product (GDP), CO2 emissions, energy, and other variables that, in one way or another, may influence the geographical area of study. Even when the work refers to the variable economic growth, it essentially refers to GDP. The geographical areas considered are normally extensive: at the country level or even larger. Therefore, they do not descend to the city level and do not give them the importance that, progressively more, they are given by public administrations.
Usually, the studies that use the income variable what they do is analyze the behaviors of households with low [14] or high income [15]. For the other cases, GDP is the variable used. Two types of research are those that are frequently found with this variable: prediction of consumption and degree of influence of it and other variables on certain parameters of interest. In this way, it is used for the prediction of electricity consumption [16], gas [17], electricity and gas [18], energy in general [19], or other resources in addition to energy [20]; additionally, it is used to analyze the influence of extreme events [21]. Other works investigate how GDP affects residential electricity consumption [22] or industry [23]. A large study covering 160 countries analyzes the relationship between GDP, electricity consumption, supply risk, and urbanization rate and concludes that the relationship is very sensitive to differences between countries [24].
A review of the studies that relate to the environment, economic growth, and energy (electric, nuclear, renewable, and non-renewable) has been carried out [25]. It concludes that the results are not homogeneous or obvious. The review of the studies that relate to economic growth and energy consumption has also been carried out [26]. The analysis distinguishes between four types of energy consumption: total, electric, nuclear, and renewable. Depending on the study being analyzed, there is bidirectional causality, unidirectional, or even no relationship between them. Therefore, there are also no conclusive results. It is assumed that the cause may be due to the data used or the econometric approaches applied.
As with electricity, the studies that analyze gas consumption do not include income as a variable either but rather GDP. In addition, what they do is a prediction of consumption or an analysis of different variables. Prediction is carried out both at the national level, using GDP, population, and gas price [27], and at the sector level, such as residential, making use of GDP, the price of gas, and heating degree days as variables [28]. The influence that some variables of interest have on others, such as energy consumption on economic growth, has also been analyzed, reaching the conclusion that natural gas has a lot of influence on GDP [29].
Regarding CO2 emissions, ref. [30] reviews the studies on household CO2 emissions and states that the importance of households on reducing emissions is reflected in the increase that is occurring in these studies. At the country level, household emissions in Ireland were studied. The conclusion was that the higher the income, the higher the emissions [31]. A similar study was carried out for France and the USA, obtaining identical conclusions [32]. Similar studies have also been conducted for China [33,34] and for a panel of 170 countries [35]. Income has also been used to assess the influence it has on energy consumption and emissions in the Chinese residential sector [36]. Thus, 31 provincial regions have been analyzed, reaching the conclusion that income and education level are the most important parameters.
Regarding CO2 emissions, predictions have been made, using GDP, in five West African countries [37] or the building sector [38]. However, the most common is once again the analysis of the influence that certain variables, including GDP, have on emissions. The relationship between emissions, GDP, and energy consumption has also been studied in different scenarios [39] and in different countries: in 54 African countries [40], in 17 countries in Europe and Asia [41], and in 30 Chinese provinces [42]. The results show that non-renewable energies have a positive causality on CO2 emissions. However, if the energy comes from renewable sources, the effect is the opposite.
GDP, considered as economic growth, is used to analyze the influence on CO2 emissions. A review of the papers that relate CO2 emissions and economic growth has been carried out by [43], finding that there is bidirectional causality between both variables. The relationship in different countries has also been analyzed: South Africa [44], Pakistan [45], China [46], and 47 countries around the world [47]. In all cases, the results obtained conclude that economic growth implies an increase in emissions. Even [48] analyzed 83 middle-income countries. In this work, it was found that energy use is the variable that most influences the increase in emissions and that the higher the income, the greater the emissions.
Additionally, the different parameters that influence CO2 emissions in the residential sector of China and India were investigated. The conclusion reached is that per capita income level is the factor that most influences CO2 emissions [49]. However, the use of GDP, as it is a more generic variable, does not allow more detailed analysis, as it occurs when using income as a variable. Even the few works that indicate that they analyze the influence of income, what they essentially study is GDP per capita and not the concrete income of the population.
Finally, at the city level, little research has been carried out. Emission studies in 49 Japanese cities [50], comparison of GHG emissions in 10 cities considering geophysical and technical factors [51], residential building sector in 4 Chinese cities [52], and 73 Chinese cities [53] have been realized. The findings show that the results varied widely from city to city.
Therefore, the studies that deal with energy consumption do not focus on the influence that population income has on such important elements as buildings neither in its energy consumption nor its CO2 emissions, and even less at the city level considered independently. Rather, they focus on the prediction of consumption in certain areas and the influence that some variables have on others, using GDP as a variable. Therefore, to the knowledge of the authors, the investigation carried out in this work, considering energy consumption and CO2 emissions of each city and the income of its inhabitants, is novel.
3. Materials and Methods
In the proposed methodology, the study area to be considered is first established. Next, the criteria for selecting the cities to be analyzed within that area are defined. These cities are then classified according to the income of their inhabitants. Subsequently, the consumption data in each city are obtained. These consumptions are calculated per inhabitant and per household. Finally, CO2 emissions are calculated from these consumptions.
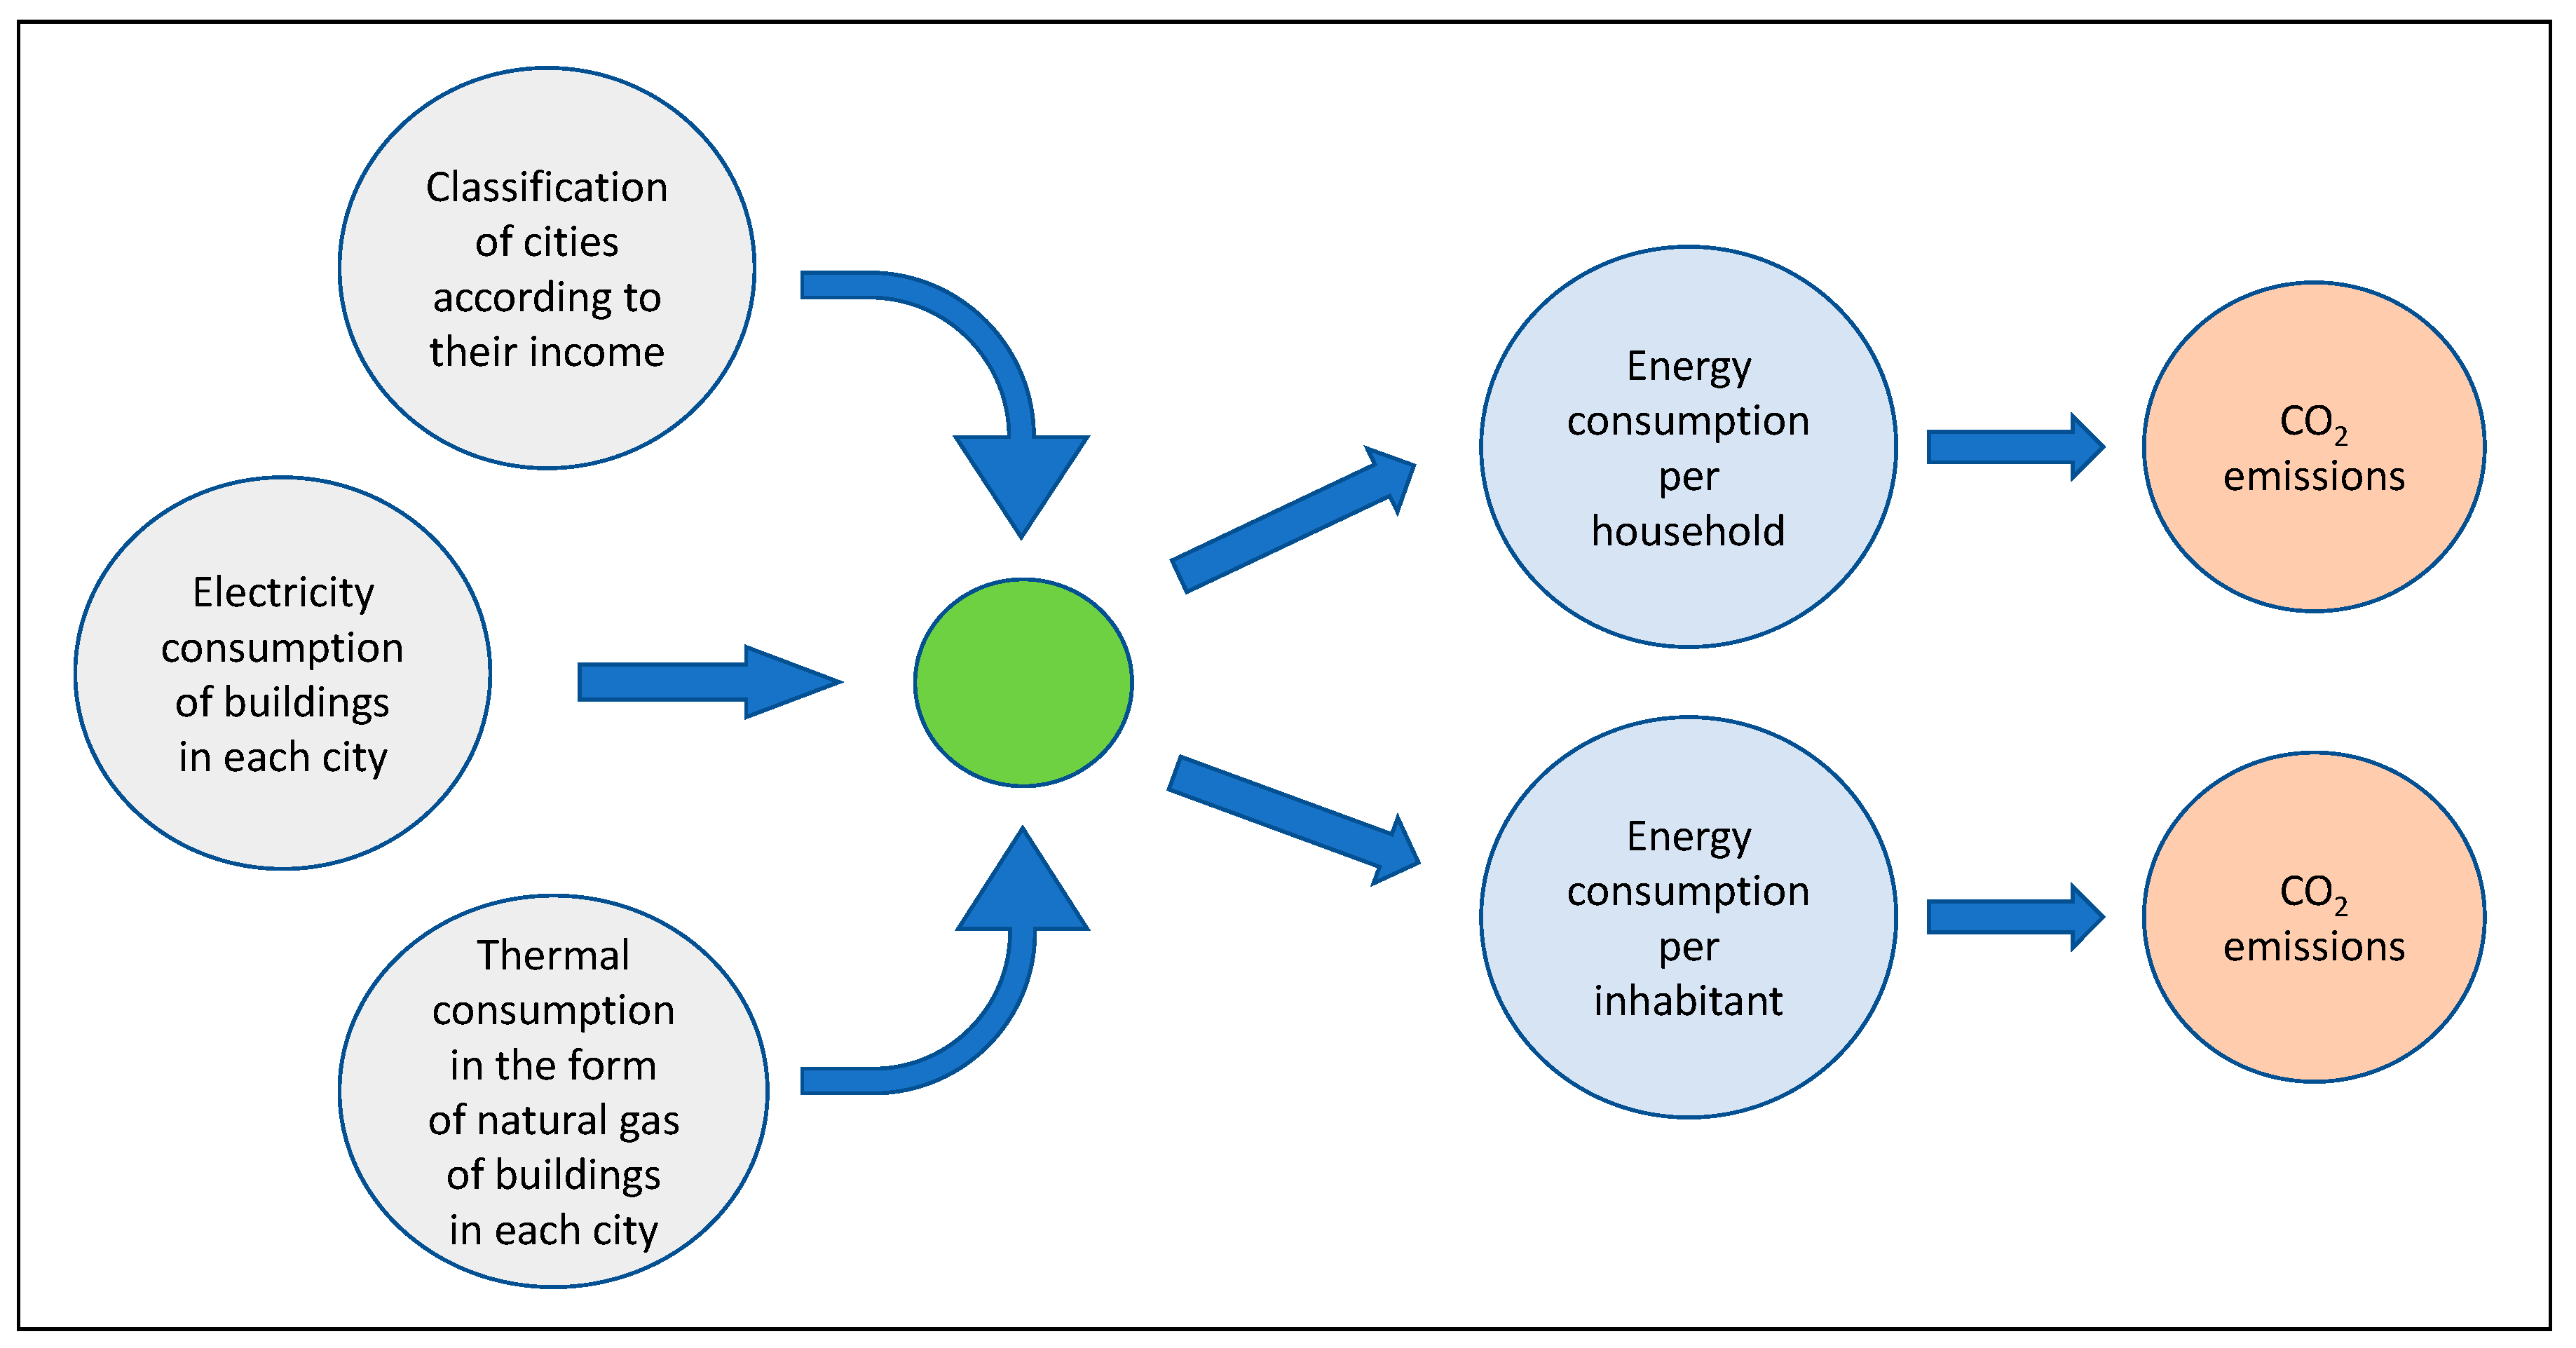
The data used are obtained from public sources and are provided by different administrations. All that available information must be treated appropriately to reach the desired results: know energy consumption and emissions due to buildings at the city level from the point of view of the income of their inhabitants. This information may be one more to be taken into account by utilities and policy makers. The methodological approach is shown in Figure 1.
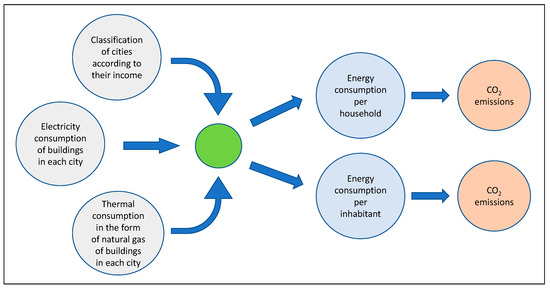
Figure 1.
Methodological approach.
Although other factors (for example, the type of building or if household is owned or rented) may influence energy consumption in buildings, their removal is beyond the scope of the study. Therefore, it is possible influence has not been eliminated.
3.1. Classification of Cities by the Income of Their Inhabitants
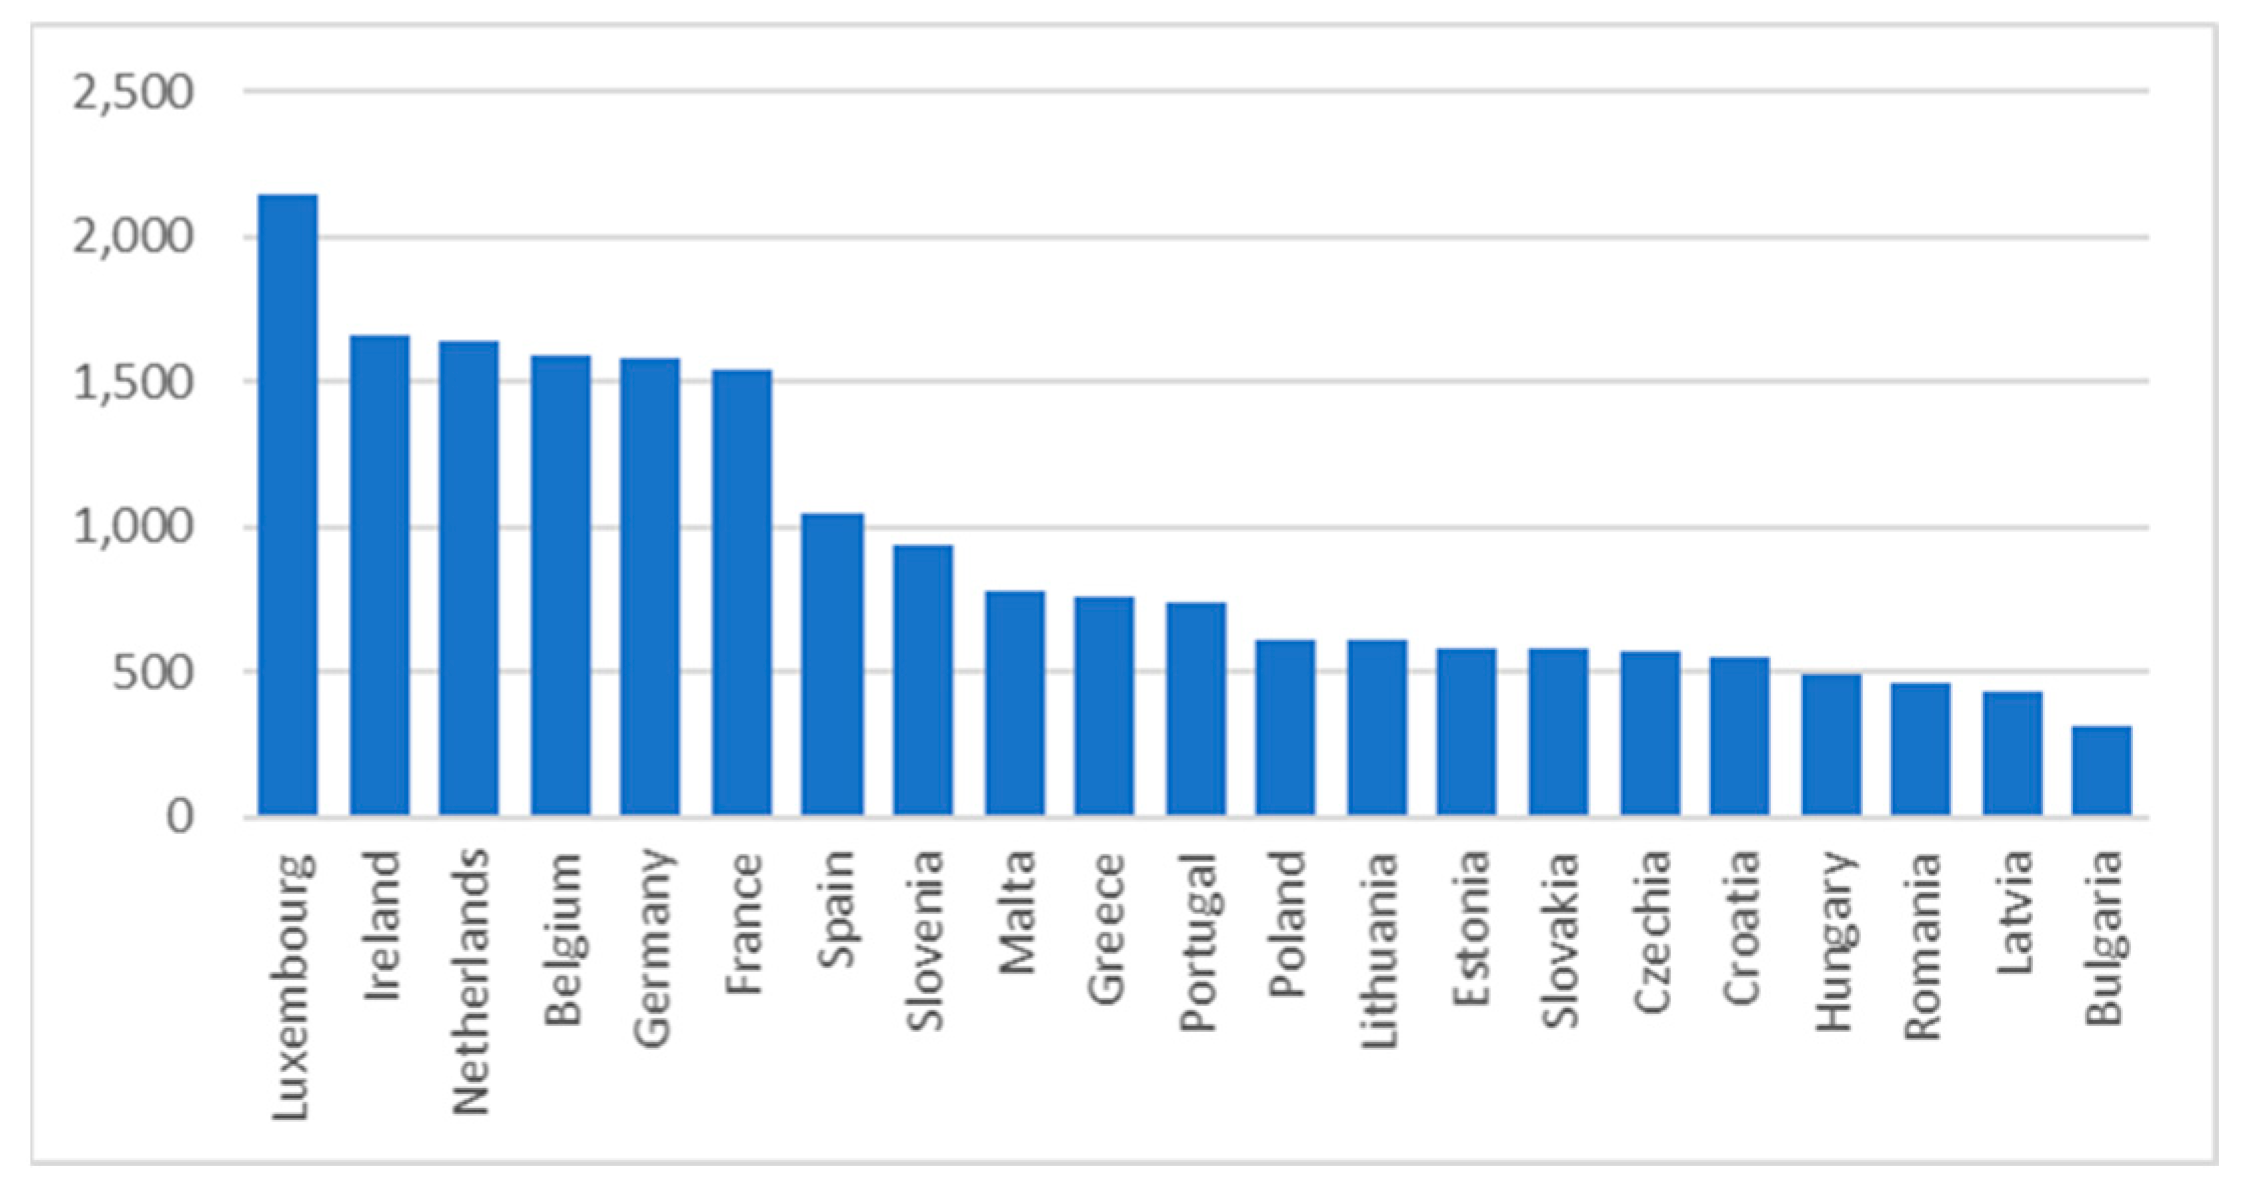
First, the size of the cities to be studied must be defined. Its size may vary depending on the scope of the study. Next, the cities within the study area are selected. The income corresponding to its inhabitants is assigned to each of the cities. Income can be considered according to different criteria, one of which can be from the national minimum wage (NMW) or a relationship with it. Subsequently, cities with similar incomes are grouped together. Figure 2 presents the monthly NMW of the states of the European Union as of January 1, 2020. It should be noted that six of them do not have NNW: Denmark, Italy, Cyprus, Austria, Finland, and Sweden [54].
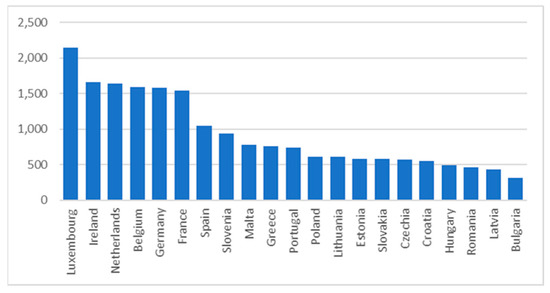
Figure 2.
National minimum wages in the European Union.
The main statistical data of electric, thermal, and total energy consumptions for each group of cities are presented:
where ni is the number of cities that belong to group i; is the mean energy consumed in group i; Eij is the energy consumption of city j, which is in group i; and si is the standard deviation of the energy consumed in the cities of group i. The energy consumed will be thermal, electric, or total depending on the case study, and cities consumptions should be listed in ascending order to calculate the median.
An index has been defined to analyze the variations in energy consumption. This index is analogous to the one defined in [55]. It allows evaluating the variations in consumption in each group. The income variation index (IVI) is defined as follows:
where is the index of the group of cities that have size i, is the energy consumption mean value of group I, and is the mean energy consumption of all cities (of all groups). This index makes it easy to identify the groups of cities with the highest consumption rates.
To compare consumption in cities, a common reference must be selected. The most basic is to calculate per capita consumption. A second criterion is to use equivalized disposable income. As the article analyses energy consumption and emissions according to income both per inhabitant and per household, the latter criterion is, in the opinion of the authors, the most appropriate and is the one used to carry out the analyses.
3.2. Equivalized Disposable Income
Equivalized disposable income is based on considering the economy of scale that occurs in a household based on the number of members of the household and their ages: both the overall household income after taxes and other deductions, as well as the expenses they share. To do this, people are converted to equivalent consumption units using the modified OECD scale. This scale attributes a weight of 1 to the first adult, 0.5 to the other adults in the household, and 0.3 to those under 14 years of age. Equivalent income is calculated by dividing the total disposable income of the household by the number of equivalent consumption units that compose it. This income is allocated equally to all members of the household [56]. In this case, it is necessary to know the published data regarding disposable income per inhabitant and city, as well as that of inhabitants per household and city.
Note that the word income used in this paper will refer from now on to the equivalized disposable income.
3.3. Electric and Thermal Energy Consumption
When conducting the study, the city has been considered as a living being that consumes energy and produces waste. In addition, the criteria set by international organizations for giving great importance to buildings are followed. Therefore, the energy consumption of the industries that may exist in the cities is not considered. These consumptions could distort the results since they would be higher or lower depending on the level of industrialization that the city could have. Another energy consumption not considered is due to means of transport. However, the consumption of the tertiary sector is considered.
People spend a significant part of their lives in buildings that are not properly their home, but that without them, they would not be able to live in cities. Therefore, both household consumption and that of public administration and commercial buildings are considered since they are essential for the development of the human activity. For this reason, the consumption of these buildings will be added to those corresponding to each person for the development of their daily life in the city.
To calculate electricity and thermal consumption per inhabitant and household, the information available on the population and consumption per city is used. This information is usually published grouped, so it must be previously processed to obtain disaggregated data. The electricity consumption data are itemized according to the classification of the Statistical Classification of Economic Activities in the European Community, commonly referred to as NACE (for the French term “nomenclature statistique des activités économiques dans la Communauté européenne”) [57]. The following items have been considered: from 36 to 39, 53, 60, 61, 72, from 84 to 88 (exc. 85.5 and 85.6), 91, 99, from 45 to 47, 58.2, 59, from 62 to 71, from 73 to 75, from 77 to 82, 85.5, 85.6, 90, from 92 to 98.
The data used to calculate the consumption of thermal energy are those corresponding to natural gas with a pressure equal to or less than 4 bar. They are the ones that are consumed in homes, stores, public administrations, and services. The consumption of these supplies is between 5000 and 50,000 kWh per year.
3.4. CO2 Emissions
To know the CO2 emissions produced by electricity consumption, it is necessary to know the country’s generation mix. The same happens to know those corresponding to the consumption of thermal energy. Therefore, from the knowledge of the sources of electrical and thermal generation, the emissions produced by them can be obtained.
4. Application of This Study to the Case of Spain
The methodology proposed in this work is applied as an example to the case of Spain. To the knowledge of the authors, no work has been carried out in Spain identifying the consumption and emissions of Spanish cities with this level of analysis. The scope of the study is all Spanish cities with more than 50,000 inhabitants.
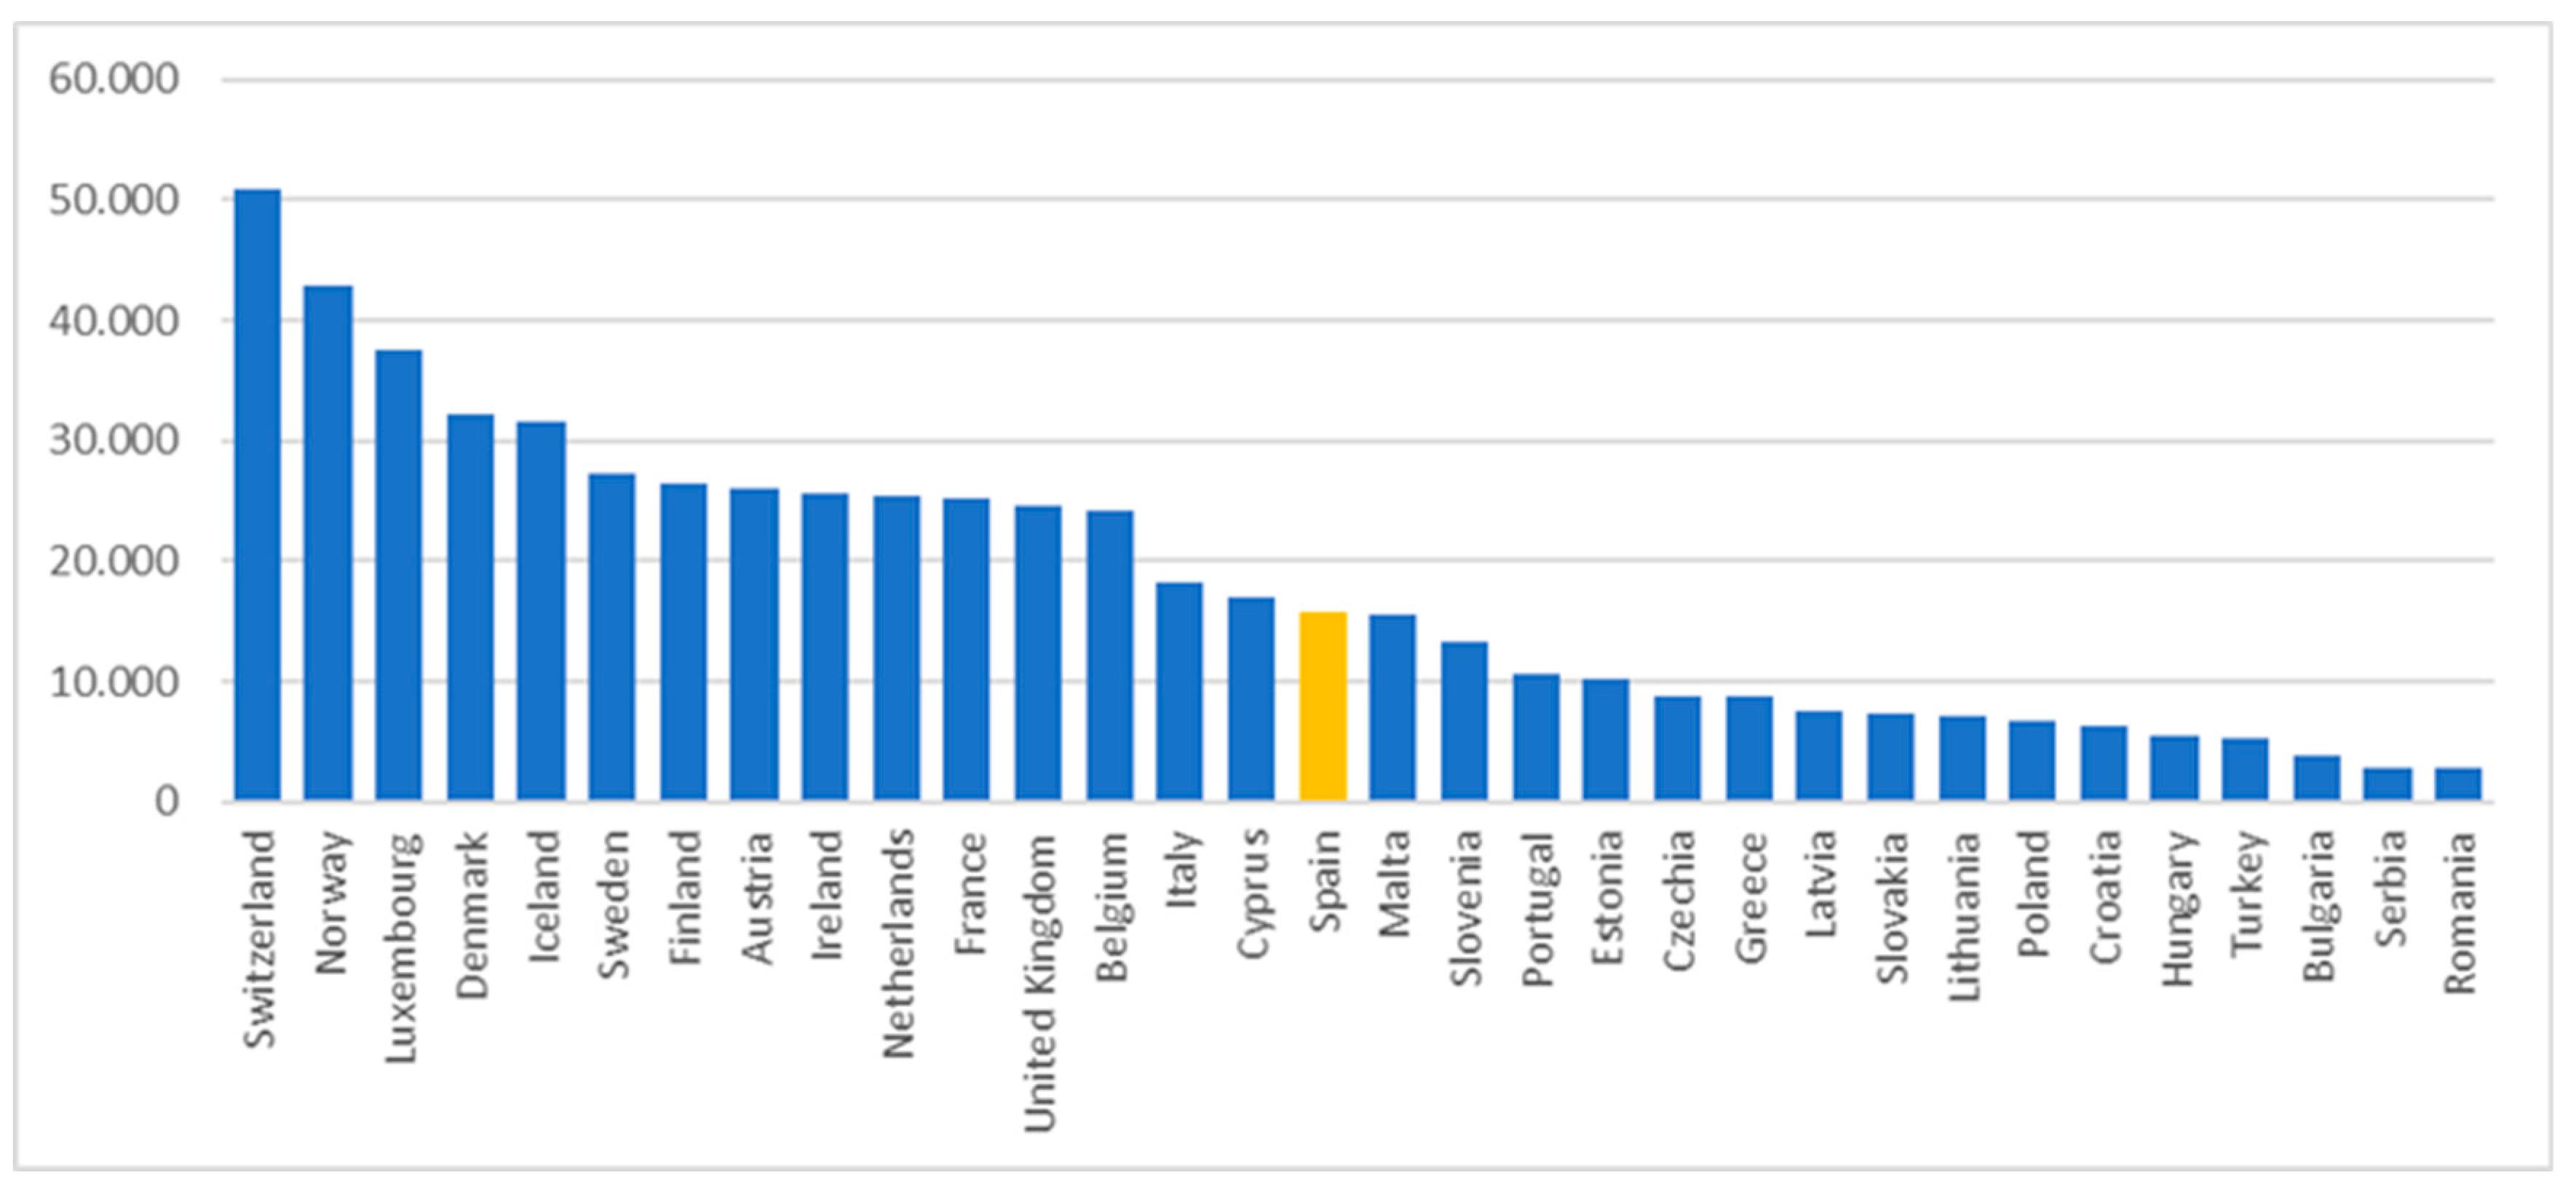
To relate the level of income that exists in Spain and locate it in reference to the neighboring countries, Figure 3 shows the mean income of Europe. With the income of Spain and Malta, the median is obtained, this being EUR 16,674. The highest income is that of Switzerland with EUR 50,859, the lowest that of Romania with EUR 2746, and the average income is EUR 17,907. Therefore, Spain is below the average of the neighboring countries. The data used in this study are those corresponding to 2016 [58].

Figure 3.
Mean equivalized disposable income in Europe.
4.1. Classification of Spanish Cities by Equivalized Disposable Income
The population of Spain amounts to 46.5 million, and more than 50% (24.5 million) live in cities with more than 50,000 inhabitants. Of these, 9 million live in the 10 most populous cities (almost 20% of the population) [59]. Hence, the fact that emissions and energy consumption are so important in cities, as in the rest of the countries. Thus, knowing the CO2 emissions, the necessary measures can be taken in each city to mitigate them through renewable energy sources, and knowing the consumptions in each city, the necessary facilities can be planned to cover their energy demand.
The scope of the study is that of cities with more than 50,000 inhabitants. In Spain, this number of cities is 145. For each city, the following have been considered: number of inhabitants, income, consumption of electricity in their buildings, consumption of thermal energy in the form of natural gas in them, and CO2 emissions produced by both types of consumption.
To carry out the studies, the cities have been grouped into five groups according to their income. The groups have been formed from the NMW, which in 2016 was established at EUR 7429.97 [60]: Group 1 is made up of cities with incomes less than 2 times the NMW; Group 2 for those who have it between 2 and 2.5 times; Group 3 includes cities with incomes between 2.5 and 3 NMW; Group 4 for those who have it between 3 and 4; and Group 5 for those with incomes greater than 4 NMW. Table 1 shows the cities belonging to each of the five groups arranged alphabetically.

Table 1.
Classification of Spanish cities by equivalized disposable income.
4.2. Thermal and Electric Energy Consumption of Spanish Cities
The data used for the study come from the following government agencies: Spanish National Statistics Institute [61], National Commission on Markets and Competition [62] (they are both dependent on the Ministry of Economic Affairs and Digital Transformation), and Secretary of State for Energy [63], which depends on the Ministry for Ecological Transition and Demographic Challenge. The data used are those corresponding to the year 2016.
4.3. CO2 Emissions of Spanish Cities
In 2010, the European Union issued Directive 2010/31/UE of the European Parliament and the Council of 19 May 2010. It establishes the requirements for the energy performance of buildings. In application of this directive, the government of Spain established the CO2 emission factors: for electricity points of consumption considering all types of generators and sources, it is 0.291 tCO2/MWh; for natural gas, it is 0.252 tCO2/MWh. These factors are applicable from January 14, 2016 [64].
5. Results and Discussion
5.1. Sample of the Study
The study sample covers the 145 cities with more than 50,000 inhabitants in Spain. Their buildings were considered, which include both households and the tertiary sector, public services, and government agencies. The data used come from official published sources and have been appropriately processed for the study. The cities have been separated into five groups according to the criteria established in Section 4.1 based on the NMW. The energy consumption considered is that normally used in buildings: electrical and thermal in the form of natural gas.
Figure 4 shows the number of cities in each group. The largest group corresponds to cities with incomes between 2 and 2.5 NMW (Group 2), followed by cities with incomes below 2 NMW (Group 1). The number of cities in groups 3, 4, and 5 decreases as income increases. Regarding the number of inhabitants of each of the groups, the most populated corresponds to the one with the largest number of cities (Group 2), followed by Group 4, even though the latter is only made up of eight cities. The group with the lowest number of inhabitants is Group 5, which is also the one with the fewest cities (Figure 5).
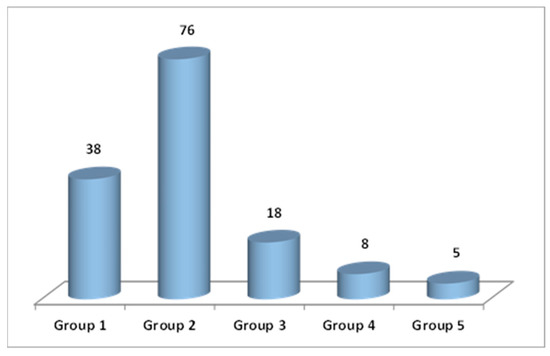
Figure 4.
Number of cities of each group.
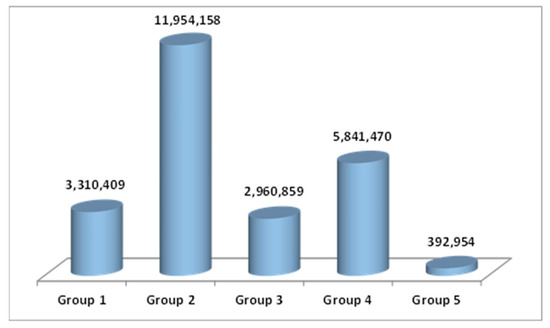
Figure 5.
Population of each group of cities.
The main statistical data of the five groups are presented in Table 2. It shows both population and household data. The statistical data of the households follow a similar behavior to that of the population.
Table 2.
Statistical data by population and household of the five defined groups of cities.
5.2. Total Energy Consumption
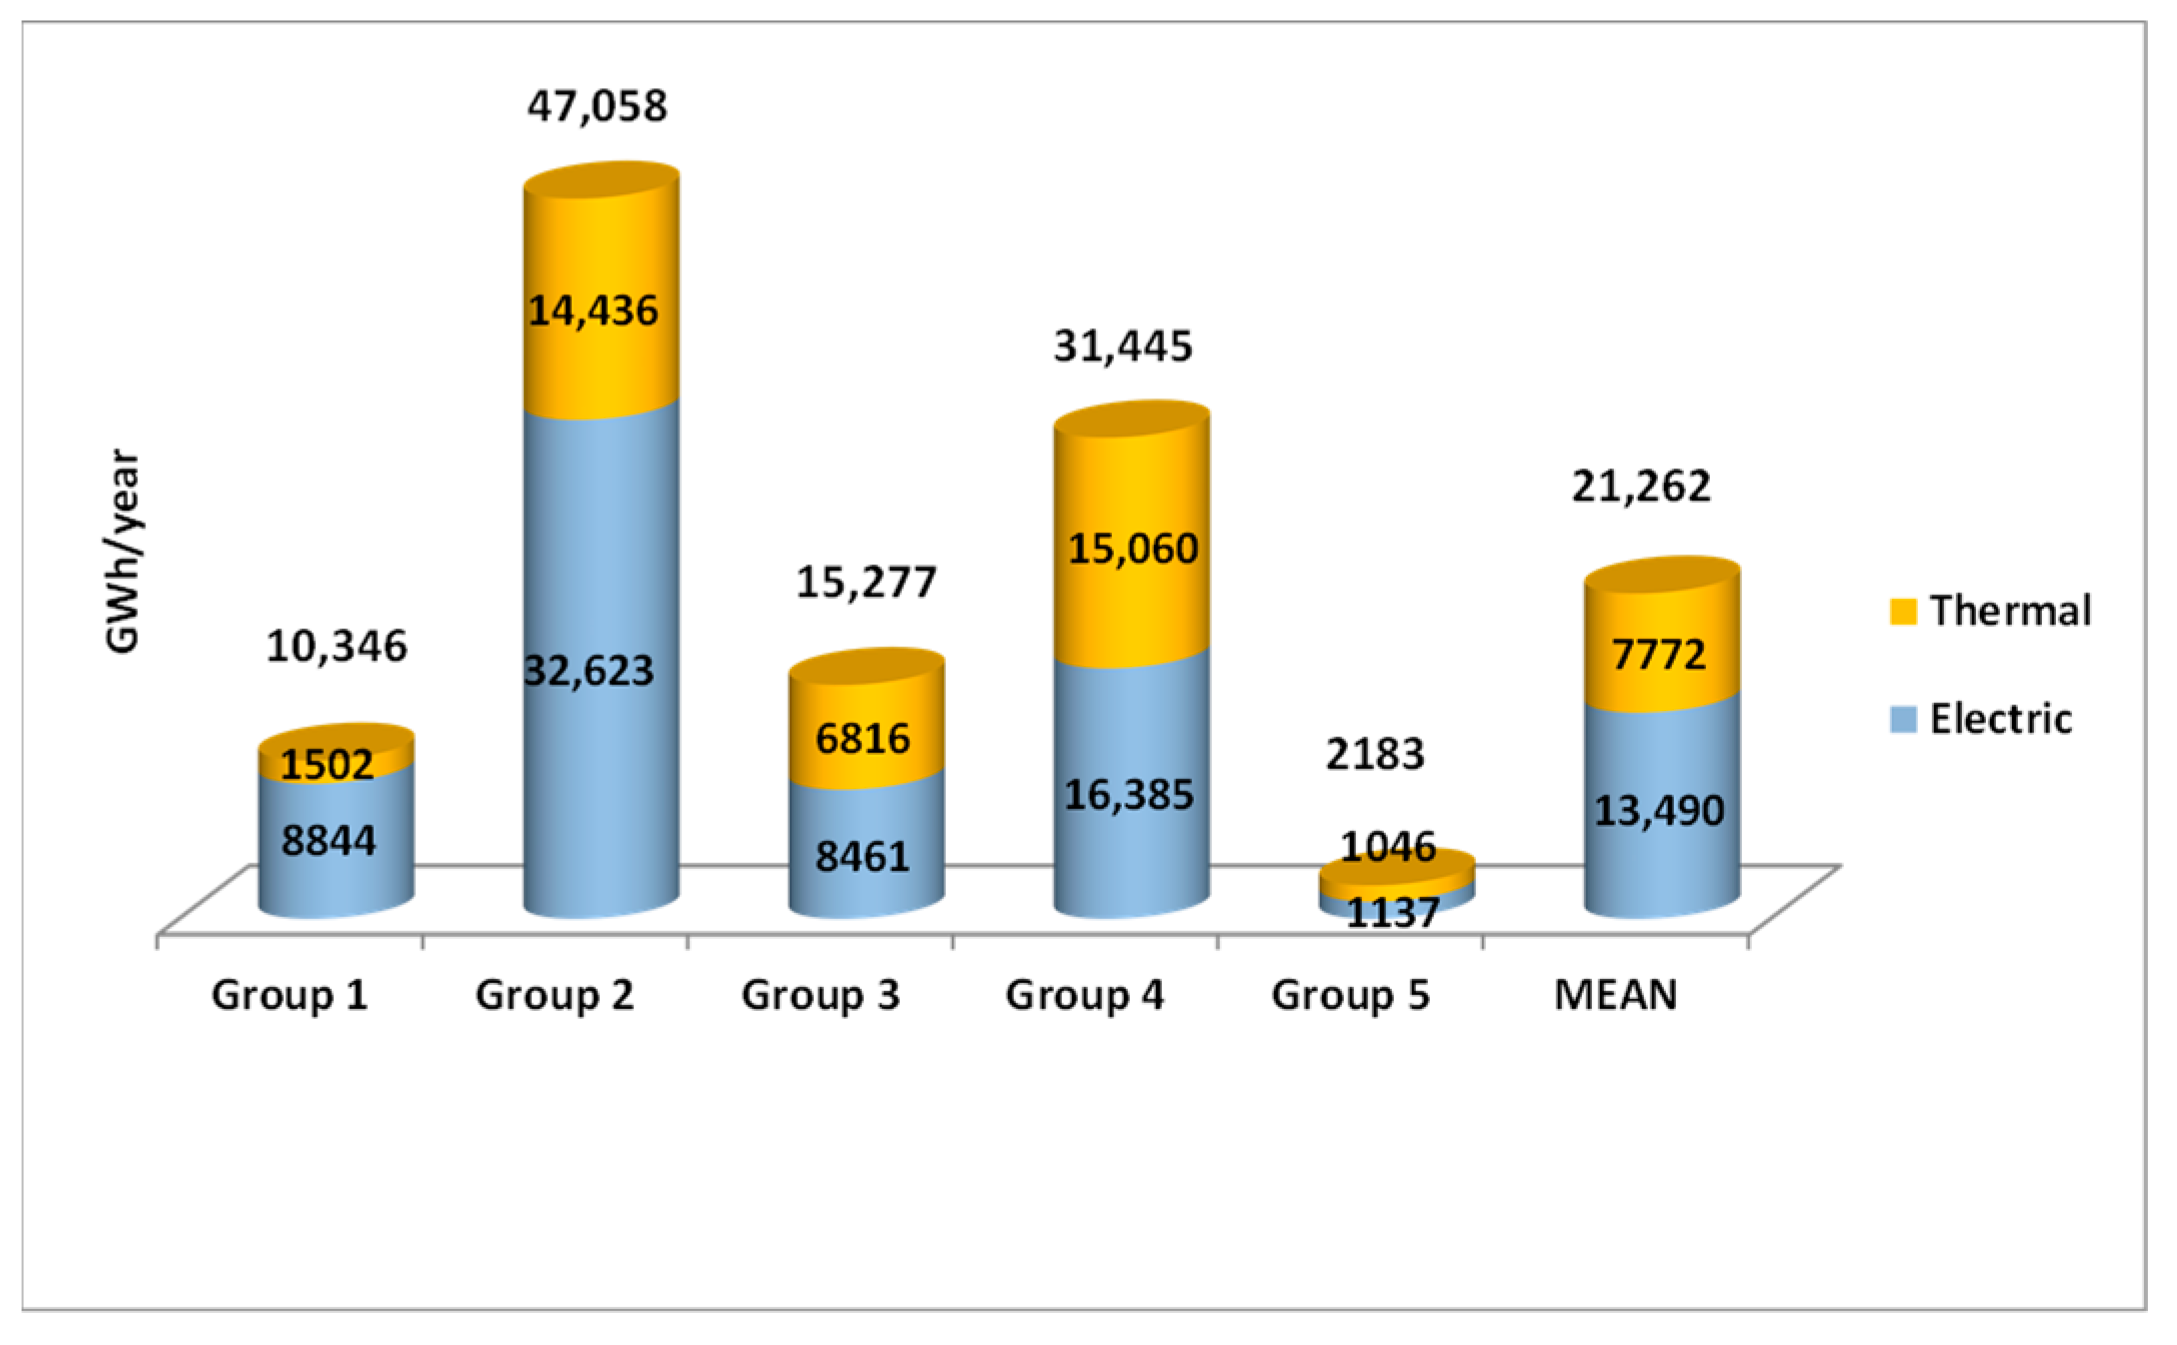
The statistical data of the consumption of the cities of each group are presented in Table 3. The total, thermal, and electrical energy consumption are shown in MWh per year. The highest consumption occurs in Group 2, corresponding to cities with incomes between 2 and 2.5 NMW, followed by Group 4, of cities with incomes between 3 and 4 NMW. The next group with income between 2.5 and 3 NMW has a consumption that is half of the previous one. Group 5 is the one with the lowest consumption. The two groups with the highest consumption correspond to the most populated. However, the third in consumption is the fourth most populated, and the least populated is the one with the least consumption.
Table 3.
Statistical data of total, thermal, and electric consumption of cities by group of cities.
Regarding electricity consumption, the groups follow the same order in consumption as in relation to the population. However, in thermal consumption, Group 4 is the one with the highest consumption, despite having half the population of Group 2, which is the next in consumption. Next, Group 3 follows, which is the fourth in population.
Figure 6 shows the electricity, thermal, and total consumption of each group in GWh per year, in addition to what an average group would present. Only Groups 2 and 4 have higher values than those of the group of average value in the three types of consumption.

Figure 6.
Thermal, electric, and total mean energy consumption by group of cities.
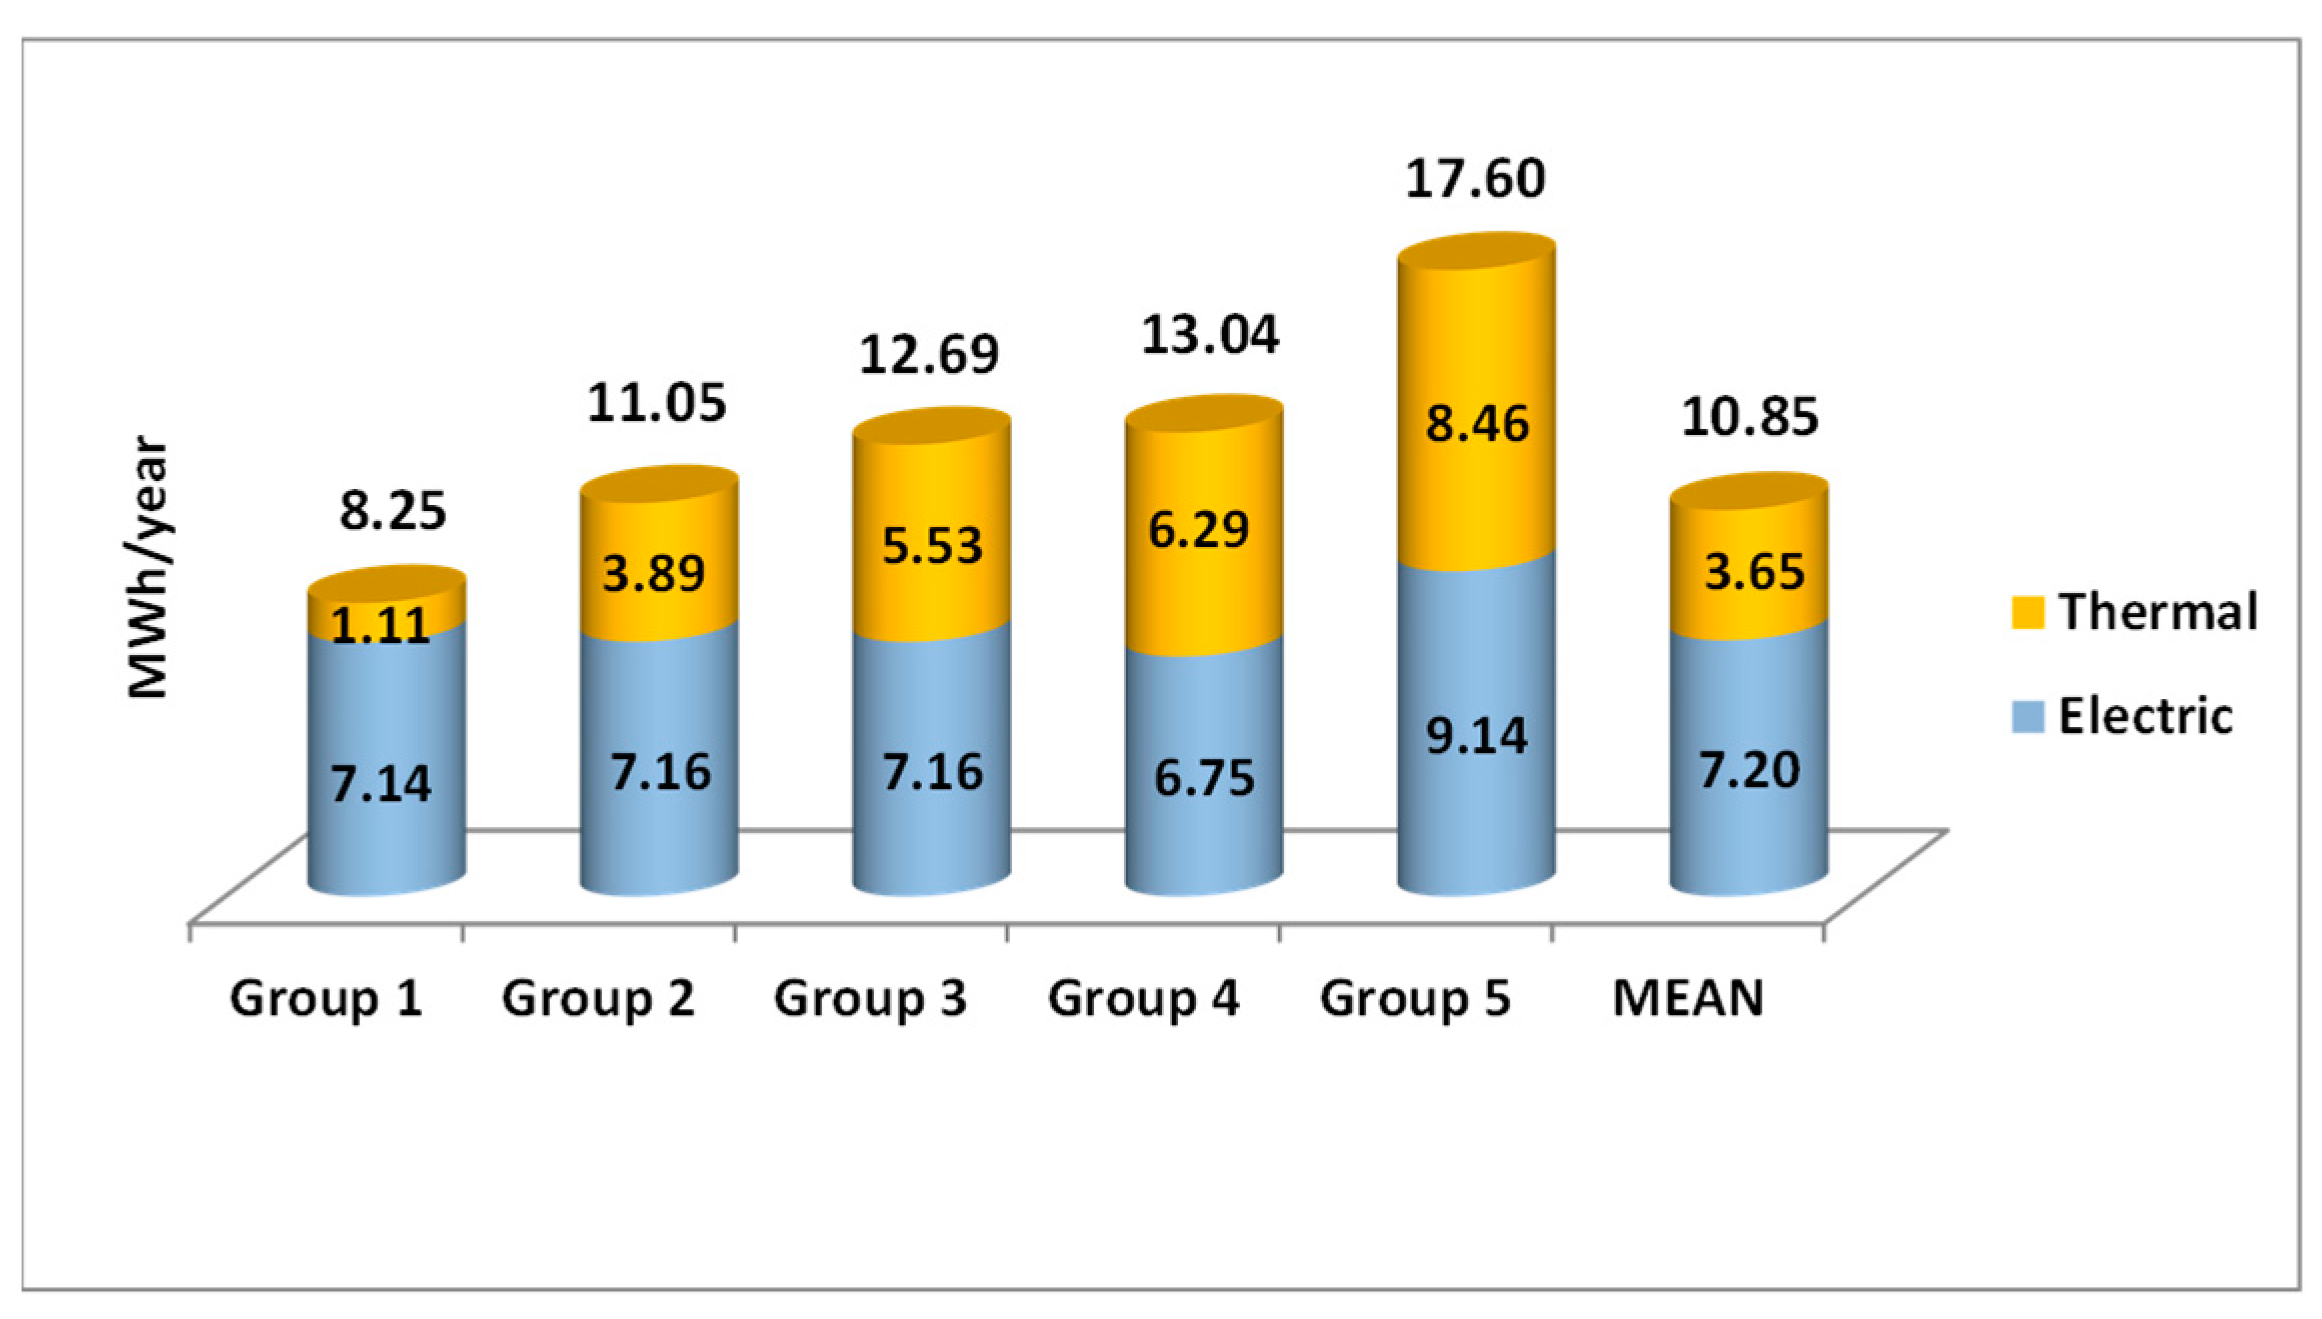
5.3. Energy Consumptions per Household
The consumption habits per household of each group of cities can be seen in Table 4 and Figure 7. The main statistical data of consumption, in MWh per year, are shown in Table 4. Figure 7 presents the mean values of each group, as well as that corresponding to the average consumption of all groups. Total consumption increases from the group with the lowest income to the group with the highest value. Only Group 1, with incomes less than two times the NMW, is the one with a lower value than the average. The group with the highest consumption is the one with income greater than four times the NMW and exceeds the average total consumption by more than 60%. It is even 35% higher than the group that follows, which is the one with an income between three and four times the NMW. The variation between the groups with the lowest and highest consumption is greater than 110%.
Table 4.
Statistical data of household consumptions by group of cities.
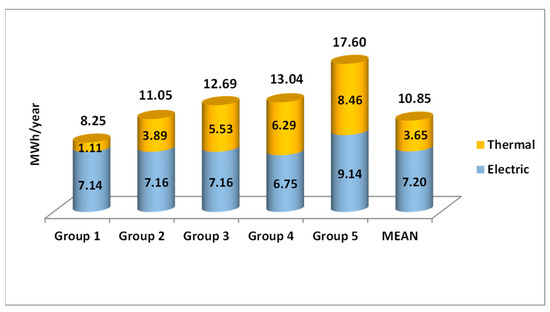
Figure 7.
Thermal, electric, and total mean energy consumption per household by group of cities.
The thermal consumption of the groups follows a similar behavior to the total consumption. It is repeated once again that thermal consumption increases as income grows. Only Group 1 has a lower-than-average consumption. However, the differences are more pronounced, reaching a variation close to 700% between the groups with the lowest and highest consumption. Regarding electricity consumption, the situation varies somewhat. In this case, the groups with incomes below 3 NMW have almost identical consumption, with a variation of less than 0.3%. Group 4, whose income is between three and four times the NMW, is the one with the lowest consumption, although without reaching 6%. Additionally, the group with the highest income continues to be the one with the highest consumption, in this case, 25% higher than the average.
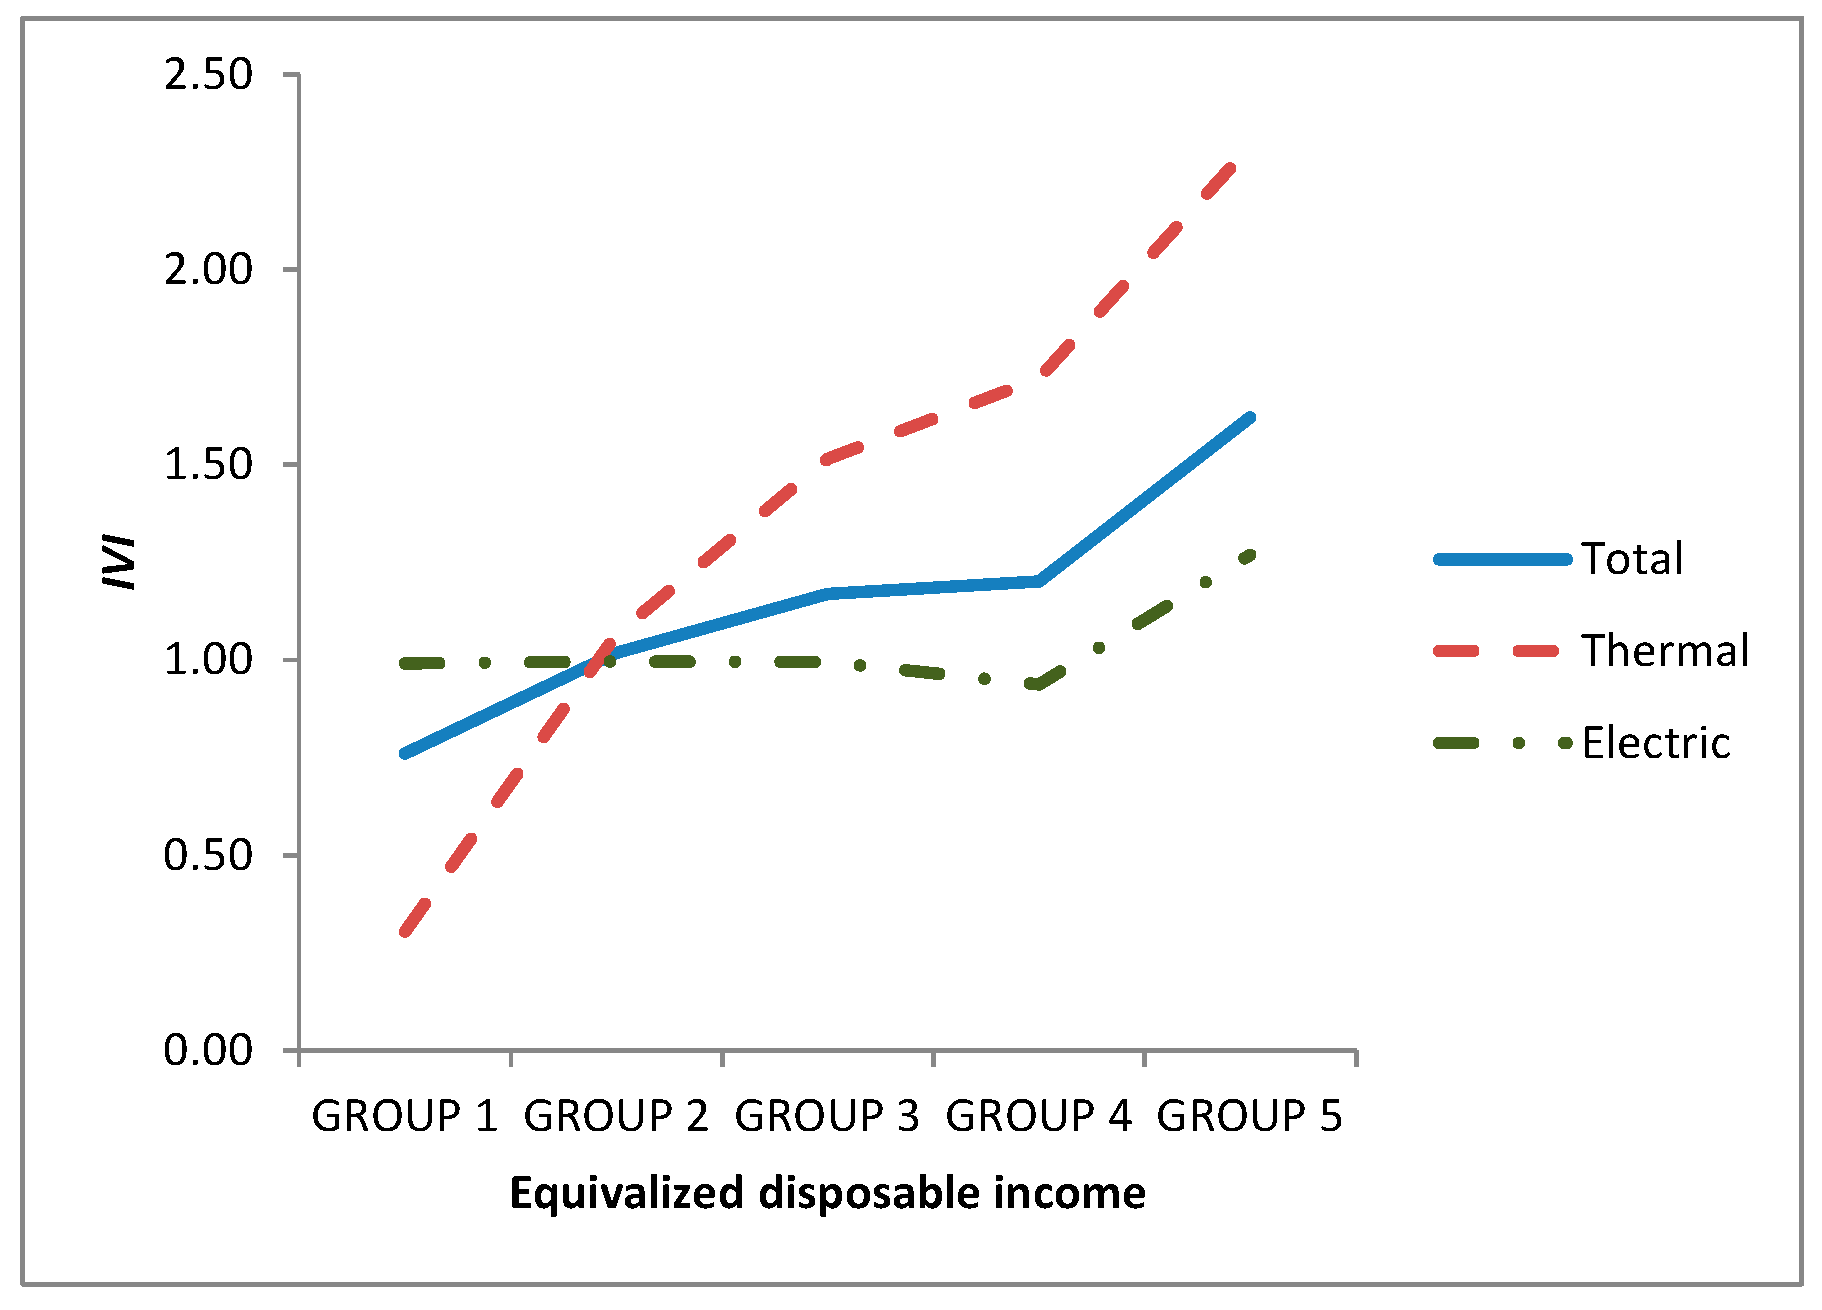
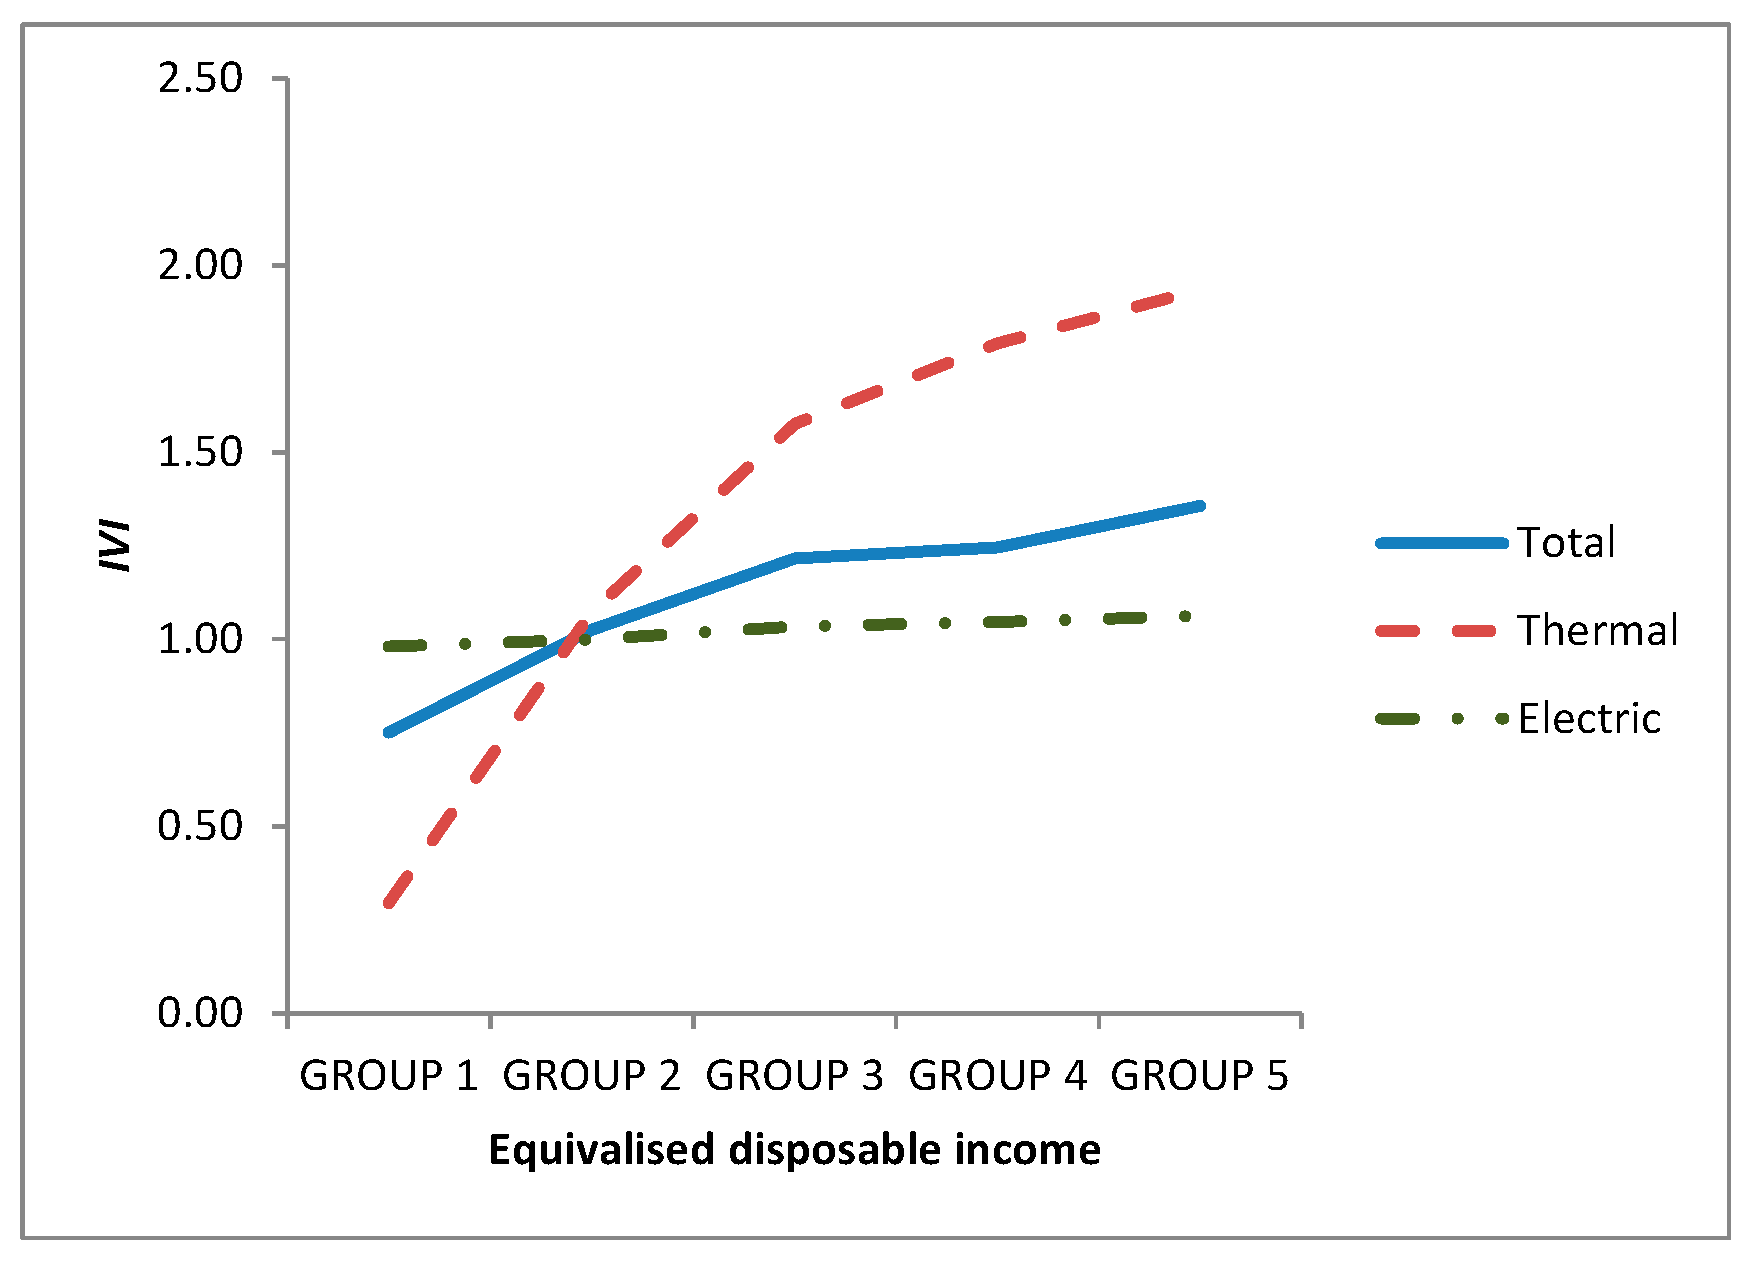
The IVI index defined in Section 3.1 has been used to analyze the variations in consumption of each group. Figure 8 presents the index for the total, thermal, and electrical consumptions of each group. For total energy consumption, it can be observed that as income grows, this index increases. In other words, cities with higher incomes have higher energy consumption. The cities with the lowest income, Group 1, have a consumption 24% lower than the average consumption of all groups. In the case of the group of cities with the highest income, their average consumption is 62% higher than the average consumption of the groups.

Figure 8.
Variation of the IVI index for energy consumptions per household by group of cities.
The variation of the IVI index for thermal consumption follows a similar pattern to that of total consumption, although much more marked. Thus, while the consumption of the group with the lowest income is 70% lower than the average consumption, that corresponding to the group with the highest income is 132%. In this case, it is also the case that the higher the income, the higher the thermal consumption. Regarding electricity consumption, the groups with incomes below 4 NMW are very similar. Only those corresponding to the group with the highest income have an electricity consumption greater than 25%.
In conclusion, the higher the income, the higher the consumption. Furthermore, electricity consumption is almost inelastic, except when income is very high. However, thermal consumption is very elastic, depending a lot on the income level of each household.
Utilities analyze the increase in energy demand globally. With this prediction of demand, they plan the infrastructures that must be built and the date on which they must be in service. With the conclusion obtained, a segmentation of the cities can be carried out and the planning particularized for each one of them since depending on the income, consumption will be different. Likewise, policy makers may set rates that encourage energy savings based on the energy consumption that is made.
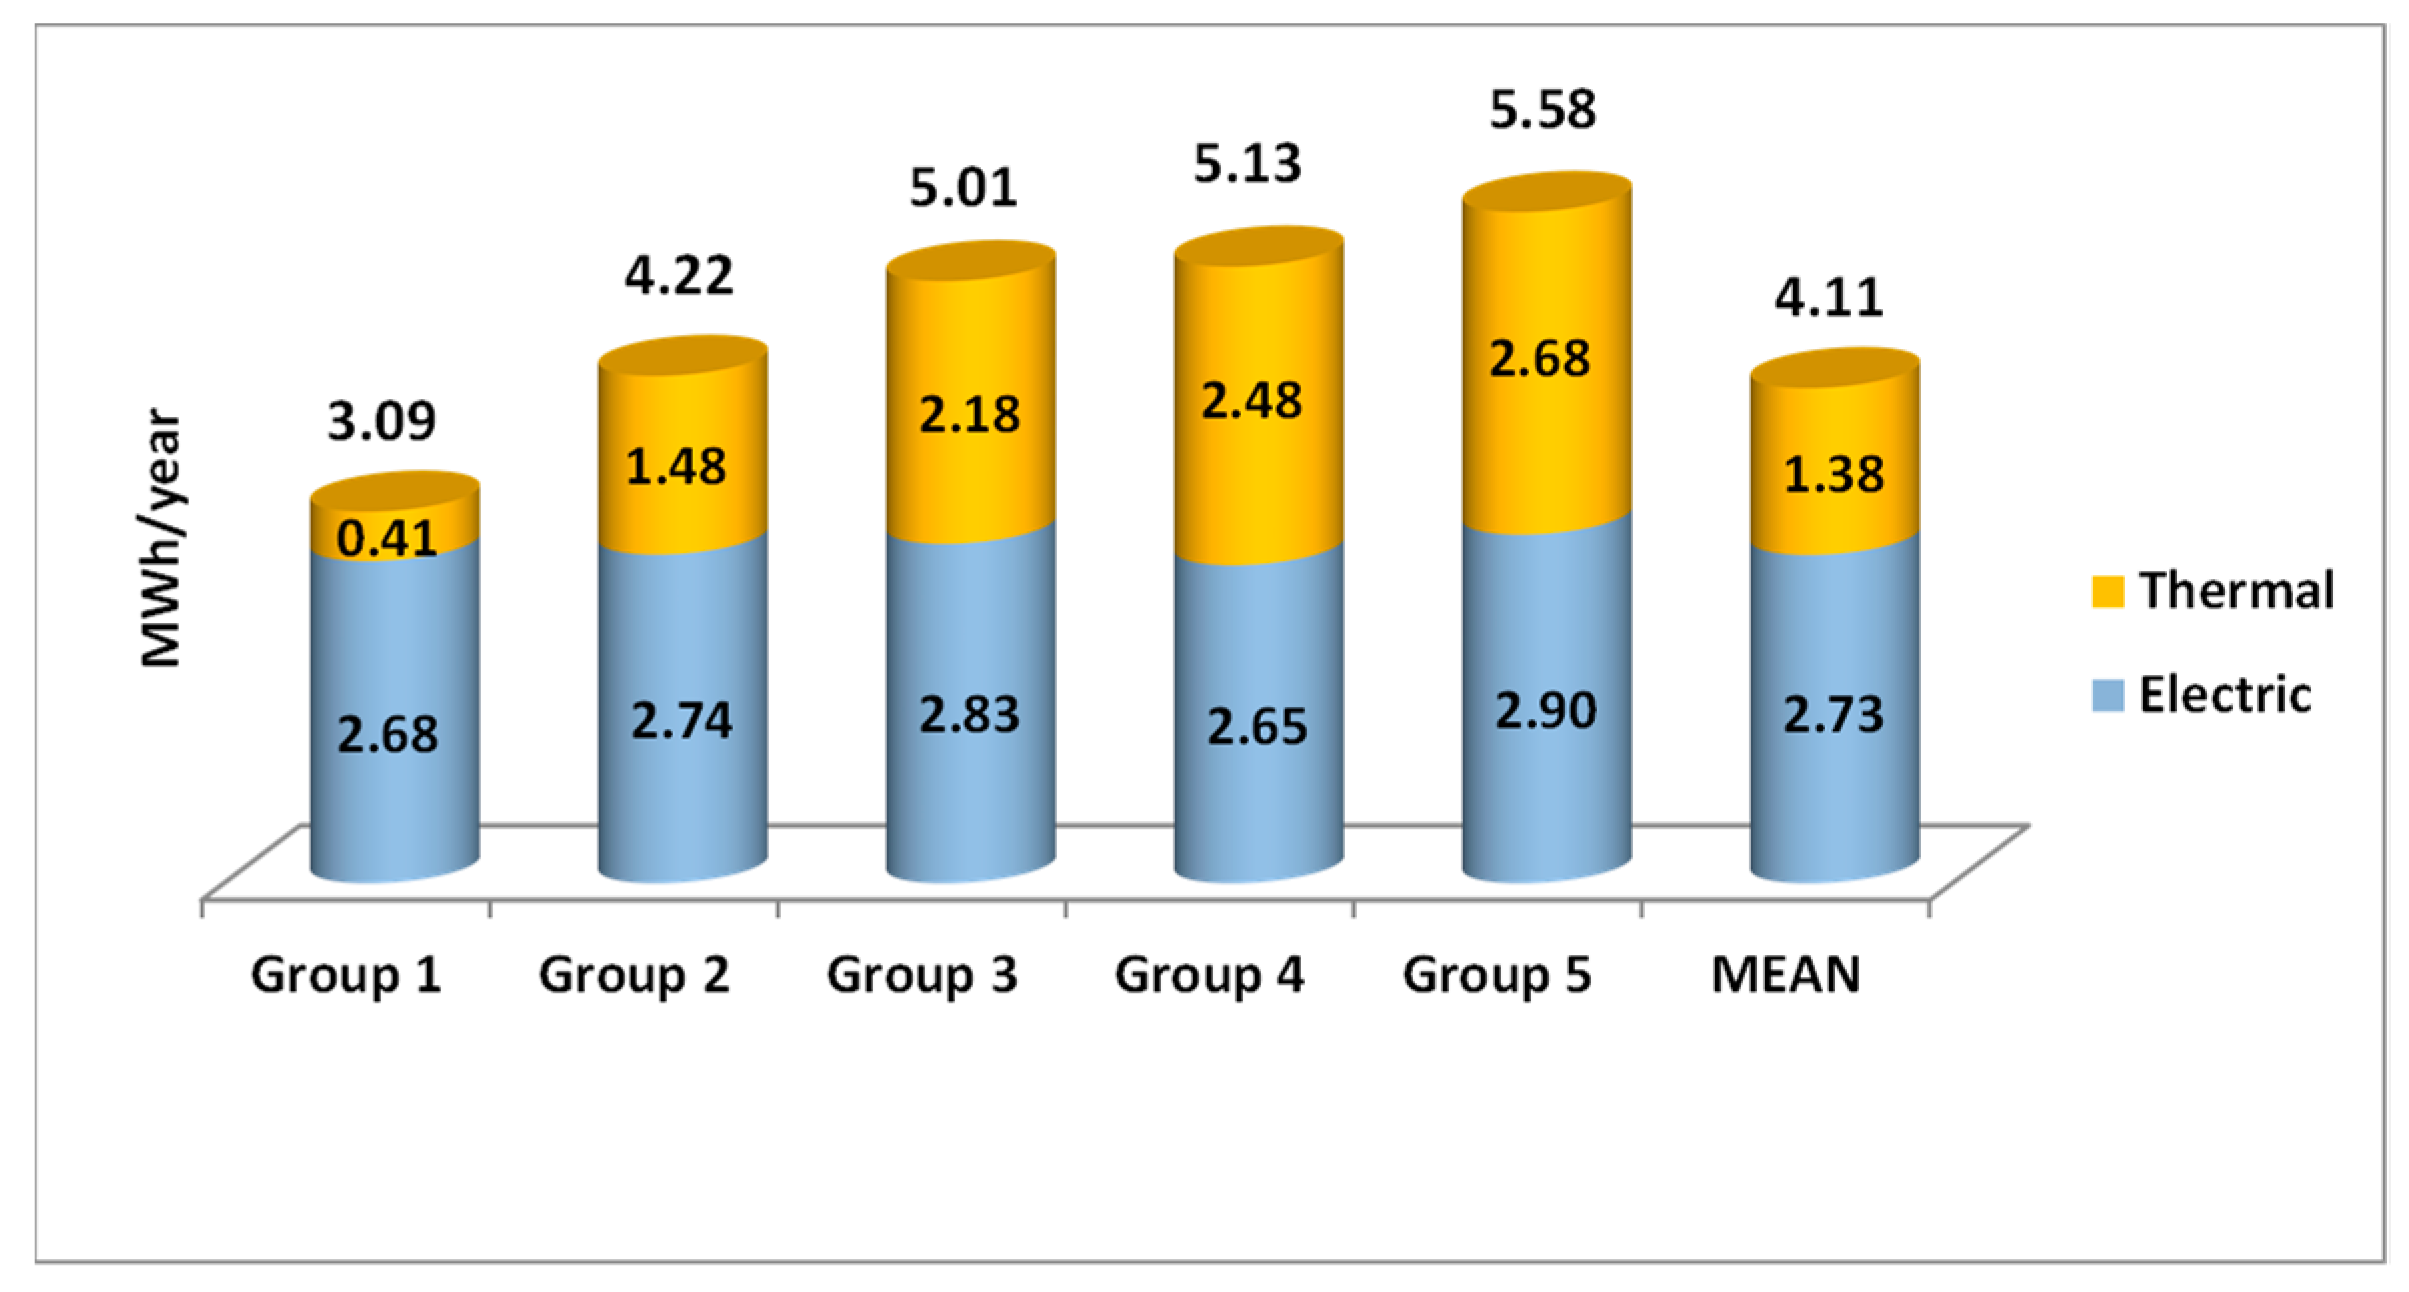
5.4. Energy Consumptions per Inhabitant
Consumption habits per inhabitant, in MWh per year, is shown in Table 5 and Figure 9. Table 5 shows the main statistical data on energy consumption per inhabitant. The mean values of each group are presented in Figure 9. The higher the income, the higher the total consumption. As in the case of consumption per household, only Group 1, which corresponds to an income below two times the NMW, has a lower value than the average of the groups, being 33% lower. The consumption of the group of cities with the highest income has a consumption greater than 80% of that corresponding to the one with the lowest income.
Table 5.
Statistical data of energy consumptions per inhabitant by group of cities.
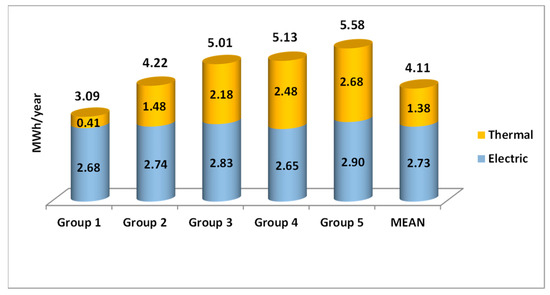
Figure 9.
Thermal, electric, and total mean energy consumption per inhabitant by group of cities.
Thermal consumption follows a similar behavior: the higher consumption, the higher the income. However, the variation between the groups with the lowest and highest incomes is much greater, becoming more than six times higher. Additionally, in this case, the only group with values lower than the group of average value is the group with the lowest income. Regarding electricity consumption, the group with the lowest consumption is Group 4, and the group with the highest consumption is Group 5, although the variation between the two is 8%. However, if Group 5 is not considered, the variation in consumption is 1%.
The IVI index was used to analyze the variations in consumption in each group. Figure 10 shows the variation of the index for each group. Regarding total consumption, as income increases, so does the index. In this case, Group 1 has a consumption 25% lower than the average consumption of the groups and Group 5 a consumption 36% higher than the average. Therefore, the total consumption per inhabitant has a behavior like that of the household.
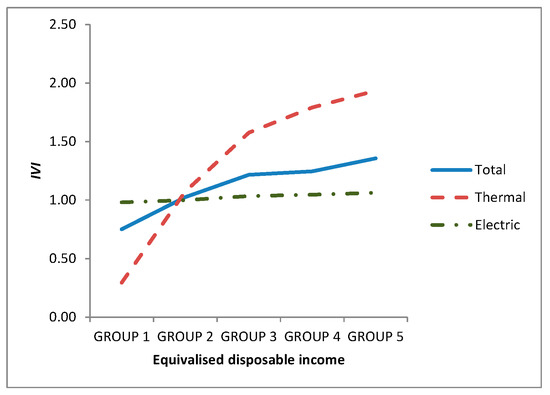
Figure 10.
Variation of the IVI index for energy consumptions per inhabitant by group of cities.
The same thing happens with thermal consumption, but in a much more accentuated way. Group 1 has a consumption that is 70% lower than the average consumption, while Group 5 has it 94% above it. Regarding electricity consumption, there is hardly any variation between the different groups.
Therefore, the conclusions are like those obtained for consumption per household: the higher the income, the higher the consumption; electricity consumption is inelastic, while thermal consumption is very elastic and depends largely on the income of the inhabitants.
Consequences like those obtained by household can be deduced from the conclusions by inhabitant. Depending on the type of study that utilities or policy makers do, they should use some results or others.
5.5. CO2 Emissions
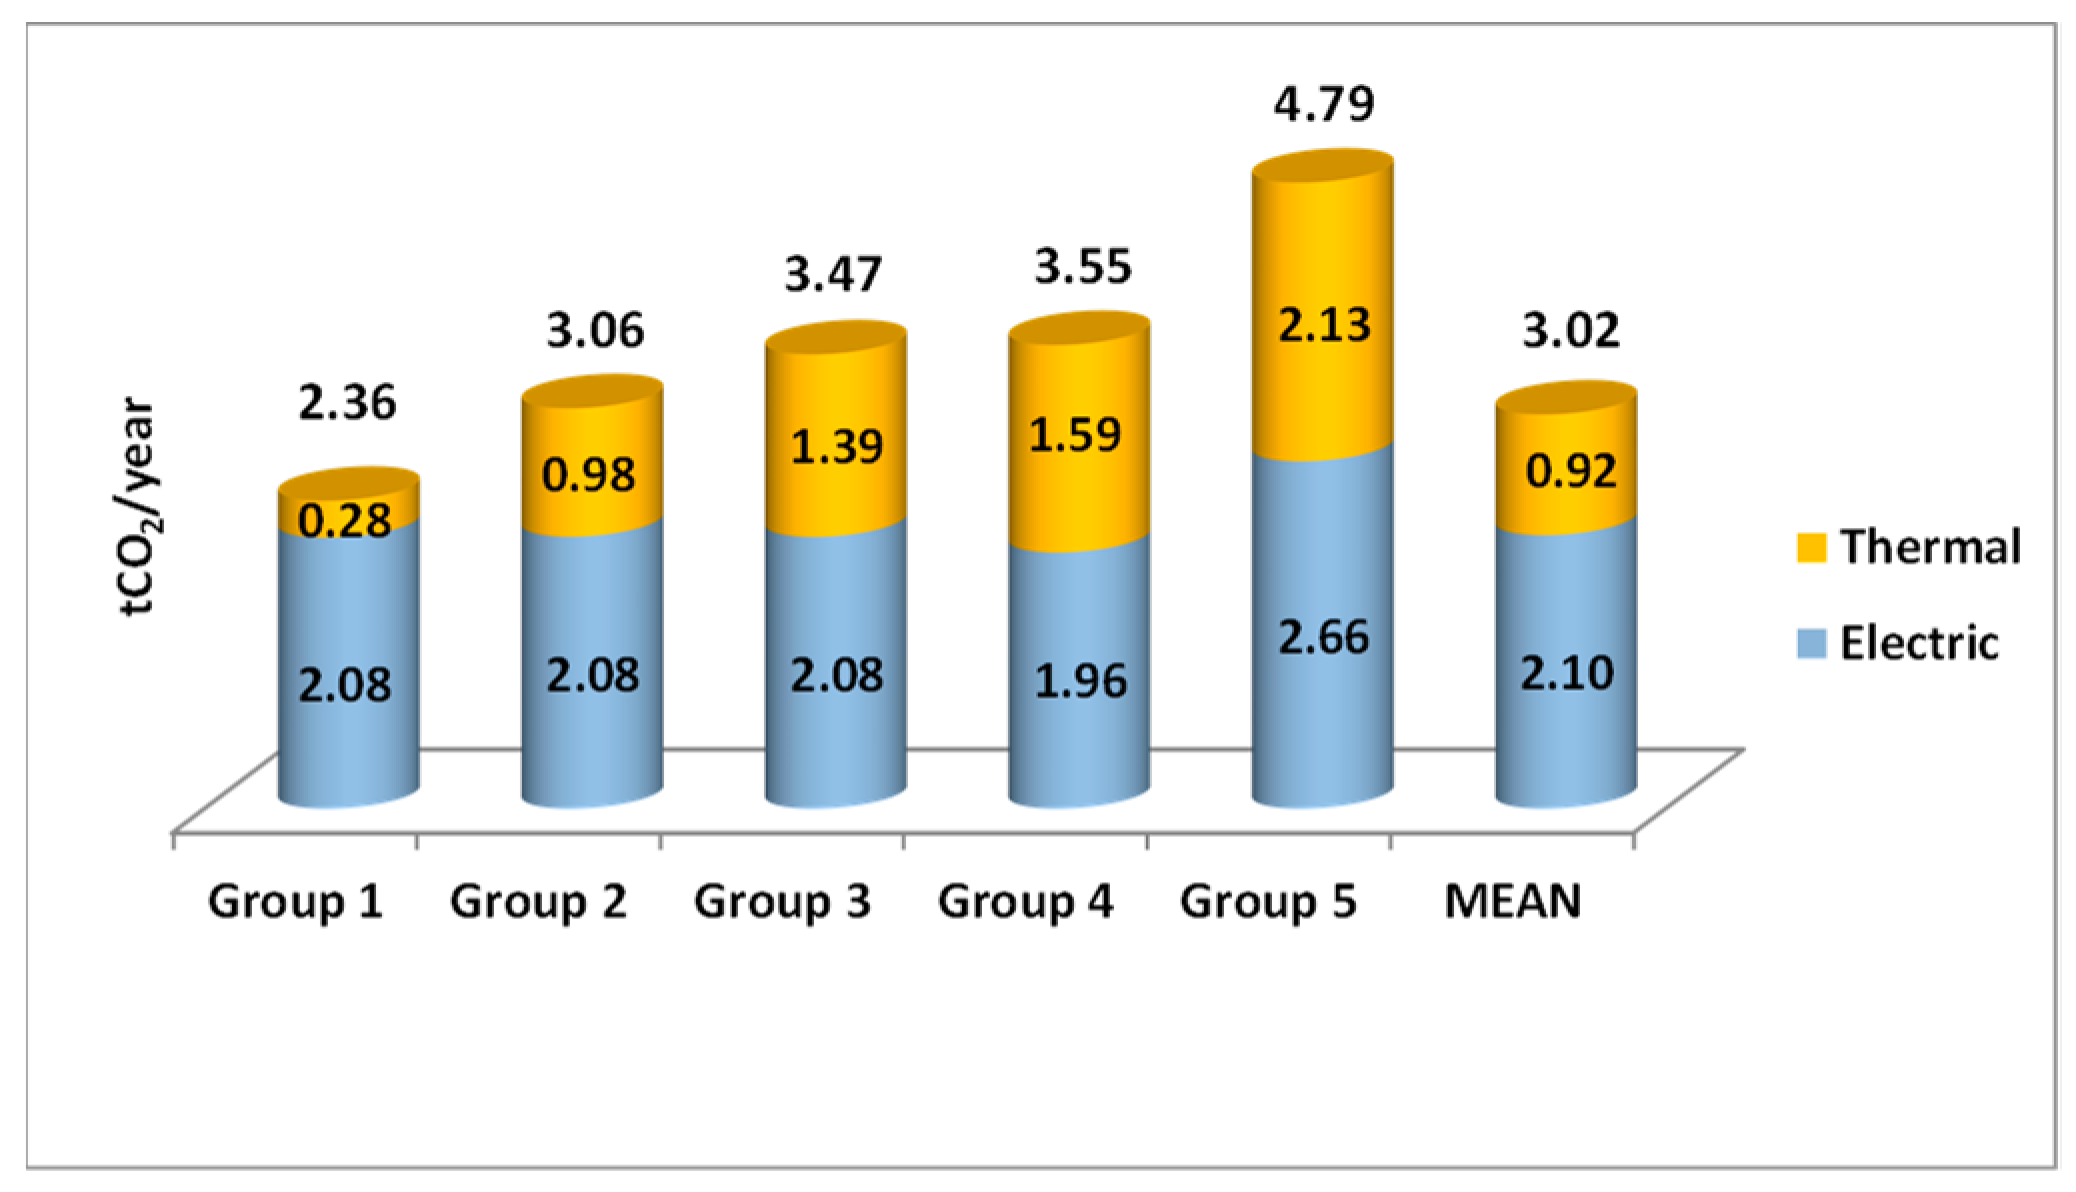
Once the thermal, electrical, and total consumption of each of the groups has been analyzed, the CO2 emissions can be obtained through the values established by the government of Spain: 0.252 tCO2/MWh for natural gas consumption and 0.291 tCO2/MWh for electricity consumption. Figure 11 shows the emissions, in tCO2 per year, due to the consumption of thermal, electrical, and total energy in households. Total emissions grow as income does; except for those corresponding to the group with income below two times the NMW, the rest of the groups produce emissions above the value of the average group. Group 1 emissions are 22% below the average value. However, emissions from cities with incomes higher than four times the NMW are almost 60% higher. Therefore, the higher the income, the higher the CO2 emissions.
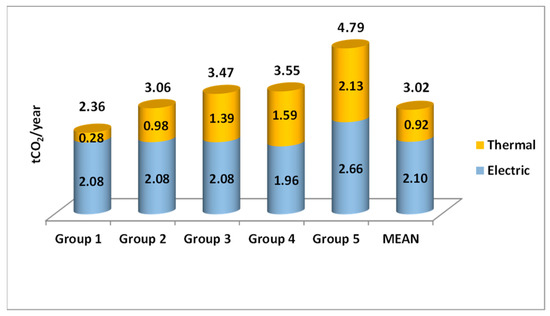
Figure 11.
Thermal, electric, and total CO2 emissions per household by group of cities.
Something similar happens with emissions due to thermal consumption: the higher the income, the higher the emissions. However, the differences are more pronounced. While the emissions of Group 1 households are 70% lower than the average, those of Group 5 are higher than 130%. However, in the emissions due to electricity consumption, there is a clear difference between the emissions of the group with the highest income and the rest: all groups with incomes below four times the NMW are below the average value, and the difference between them is less 1%; however, the highest income group is 27% above the rest.
Regarding the proportion between the emissions due to thermal or electrical consumption, the following is observed: those produced by electricity consumption are always greater than those produced by thermal consumption; the proportion of emissions of electrical origin varies from 88% of the total emissions in Group 1 to 55% of the total in Group 5. That is, the lower the income, the higher the emissions of electrical origin compared to the total emissions.
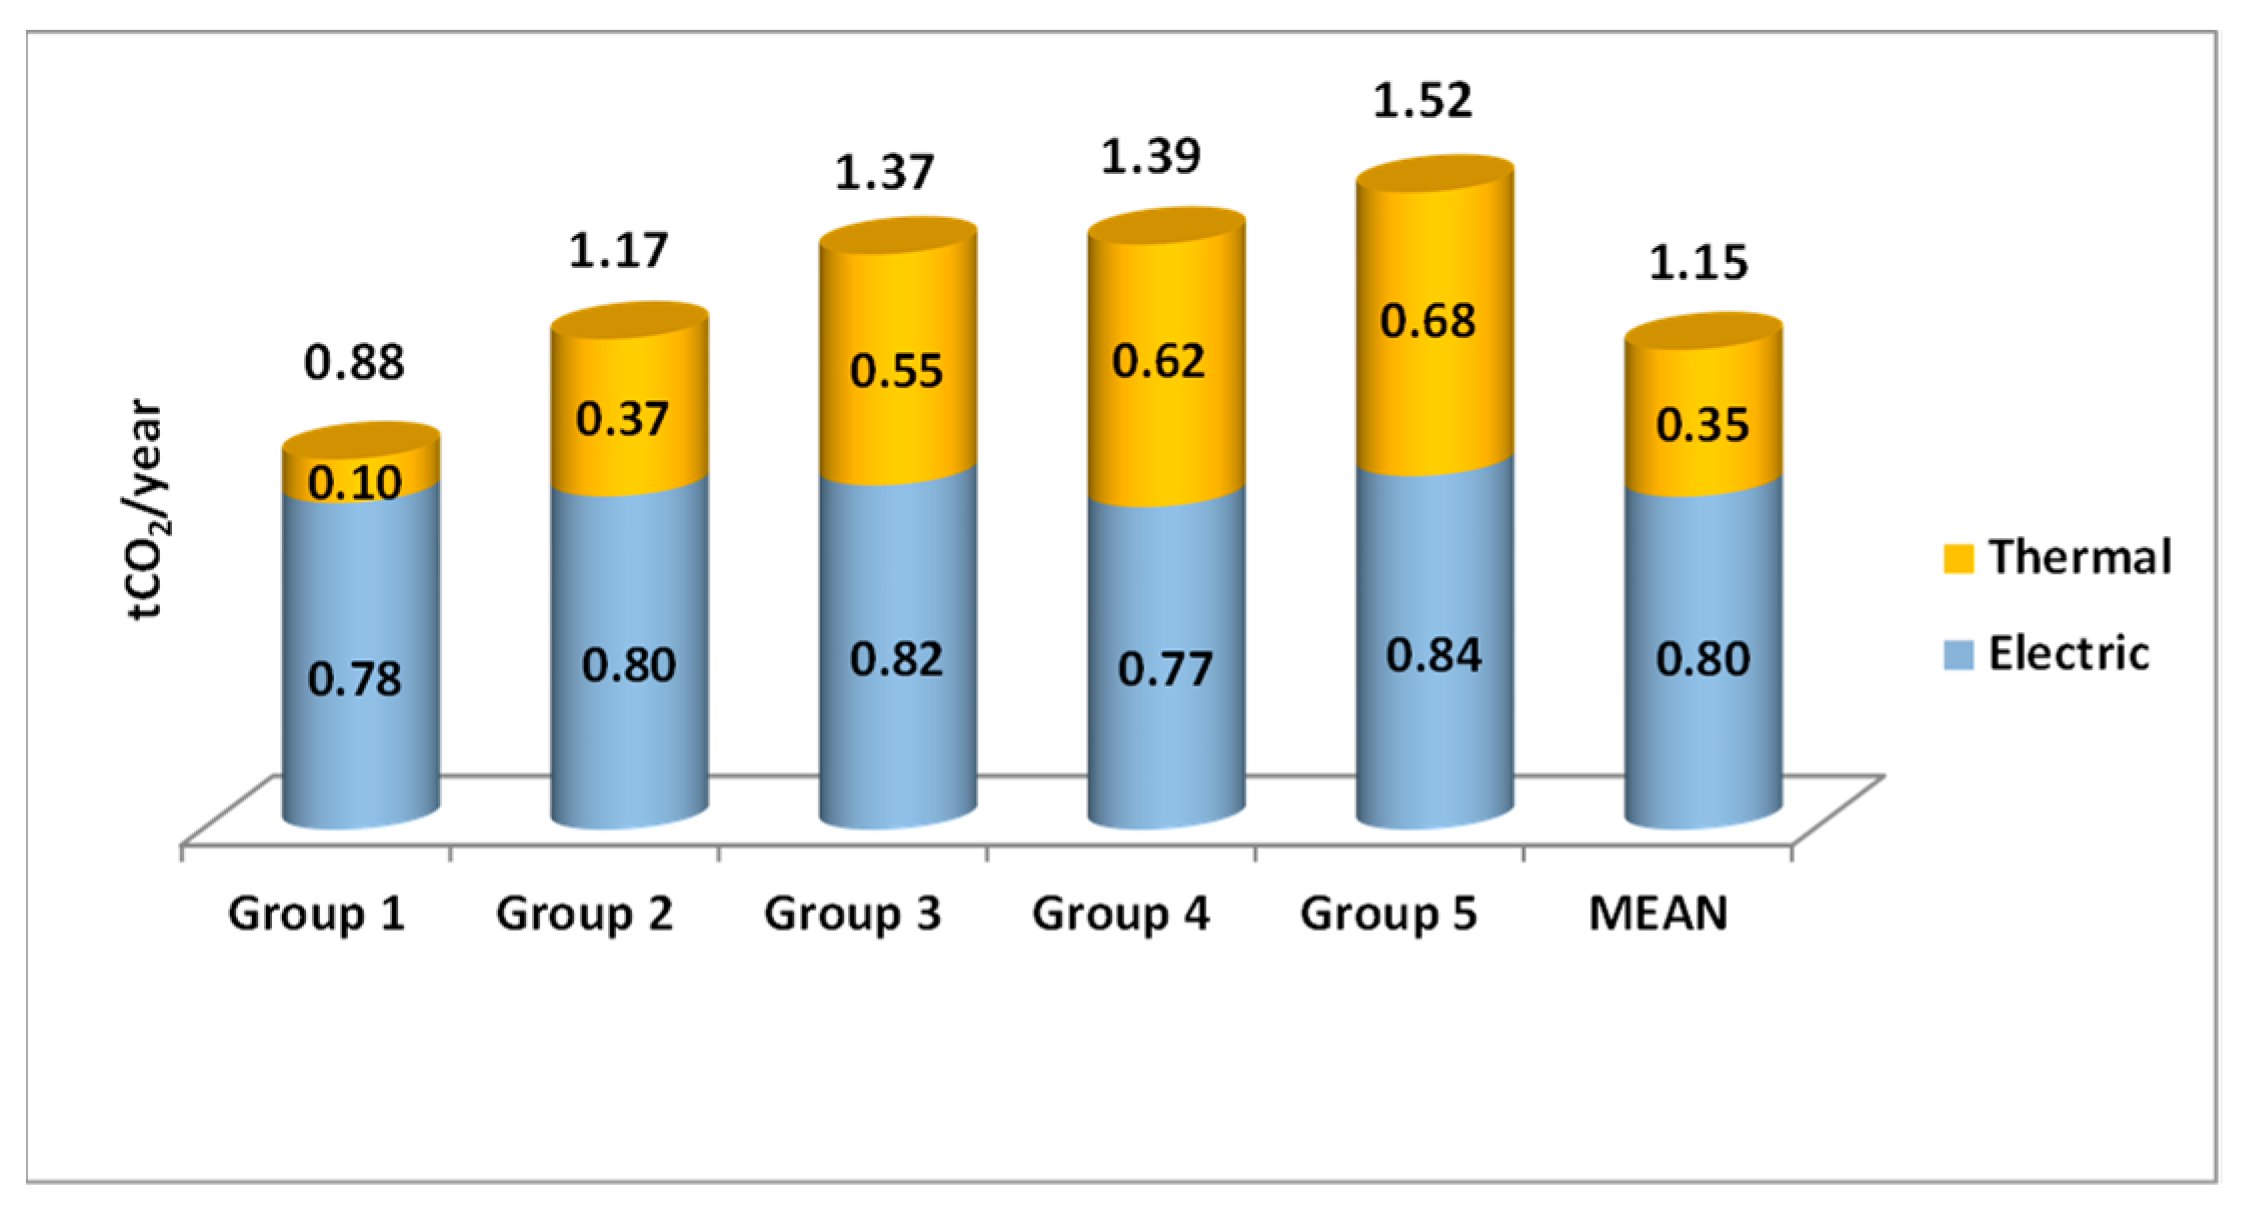
Figure 12 presents the emissions, in tCO2 per year, due to thermal, electrical, and total emissions per inhabitant. As in the case of emissions per household, total emissions grow as income grows. All groups except Group 1 produce emissions above the average value. Variations range from 23% below the average in Group 1 to 32% above in the case of Group 5.
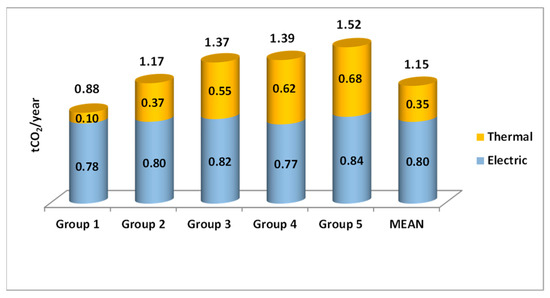
Figure 12.
Thermal, electric, and total CO2 emissions per inhabitant by group of cities.
Regarding emissions due to thermal consumption, they follow a similar pattern. Emissions are higher as income increases. Regarding the variations, these are greater: from 71% lower than the average in Group 1 to 95% higher than the average in Group 5. Regarding emissions of electricity origin, there are hardly any variations between the groups. The variations do not reach 10% between those corresponding to the group with the lowest emissions and the group with the highest, which is once again the one with the highest income.
The conclusions obtained regarding the proportion of emissions of thermal and electrical origin are similar: those of electrical origin are higher than those of thermal origin; the proportion varies from 88% in the case of Group 1 to 55% in Group 5. Therefore, the lower the income, the higher the proportion of emissions due to electricity.
These conclusions can be useful to utilities to plan the renewable facilities that they must build so that increased demand does not generate higher emissions or to substitute current energy sources to reduce current emissions. Additionally, they can also help policy makers in setting incentives that reduce emissions based on consumption.
6. Conclusions
More than half of the world’s population lives in cities, where more than 60% of energy is consumed and 75% of carbon emissions are produced. A large part of the emissions and energy consumption corresponds to buildings, both in the residential sector and in the tertiary sector. A total of 40% of emissions are produced in them, and 36% of energy is consumed. In Europe, almost 75% of the population live in cities, and more than 80% of emissions are due to energy, and only a third corresponds to transport. In addition, the COVID-19 pandemic has greatly affected cities and produced a major economic crisis. With this background, governments are aware of the importance that cities in general, and buildings, have for the reduction of greenhouse emissions and the planning of energy infrastructures from renewable sources. In that sense, the European Union has launched a EUR 750 billion recovery plan. Among the six fields of action contemplated in this plan, construction and buildings is one of them.
In this paper, a methodology has been presented to analyze the energy consumption of buildings in cities and their CO2 emissions based on equivalized disposable income. To do this, cities are grouped according to their income. These groupings were based on the national minimum wage. The consumption analyzed has been in the two most common forms of use in buildings: electrical and thermal in the form of natural gas. The data used for the study are published by government agencies. The results were obtained by household and by inhabitant. The proposed methodology was applied to the 145 Spanish cities with more than 50,000 inhabitants. Additionally, an index has been introduced to facilitate analysis.
In addition to the five groups in which the cities have been divided, a sixth group has been created. This sixth group represents a single group that contains all the cities studied. The results have been obtained at a total, thermal, and electrical level.
The results obtained by household show that, at the level of total consumption, the higher the income, the higher the total energy consumption. The consumption of natural gas follows a similar behavior, although much more accentuated. Thus, while the total consumption of cities with the highest consumption is slightly more than double that of those with the lowest consumption (100%), in the case of thermal consumption, this difference reaches almost 900%. However, electricity consumption remains almost constant, except for cities with higher incomes, where they increase considerably.
The behavior followed by consumption by inhabitant is like that shown in consumption by household: the higher the income, the higher the total energy consumption. It is once again the thermal consumption that shows the most marked differences between the different groups of cities. Regarding electricity consumption, it remains approximately constant in all groups, except in cities with the highest consumption. These have much higher consumption than the others, approximately 25% higher. Therefore, it can be concluded that electricity consumption is inelastic with respect to income, while thermal consumption is elastic.
CO2 emissions have been calculated from thermal and electrical energy consumption. The conclusion obtained for total emissions, both at the household level and at the inhabitant level, is that the higher the income, the higher the emissions. Emissions of thermal origin follow the same pattern, although in this case, the difference between groups of cities is greater. Therefore, the higher the income, the higher the emissions. With regard to emissions of electrical origin, they are almost constant in all cases, except in the cities with the highest incomes, where they are higher.
Another important conclusion obtained is that the emissions due to electricity consumption are greater than those corresponding to thermal consumption in each group. These emissions range from 88% in the cities with the lowest incomes to 55% in those with the highest incomes. Therefore, the lower the income, the higher the proportion of emissions due to electricity.
Author Contributions
Conceptualization, I.M.Z.-S. and P.J.Z.-P.; methodology, I.M.Z.-S. and P.J.Z.-P.; validation, I.M.Z.-S., F.J.Z.-S., and P.J.Z.-P.; formal analysis, I.M.Z.-S., F.J.Z.-S., and P.J.Z.-P.; investigation, I.M.Z.-S. and P.J.Z.-P.; data curation, I.M.Z.-S. and F.J.Z.-S.; writing—original draft preparation, I.M.Z.-S.; writing—review and editing, I.M.Z.-S., F.J.Z.-S., and P.J.Z.-P.; visualization, I.M.Z.-S. and F.J.Z.-S.; supervision, P.J.Z.-P.; project administration, P.J.Z.-P.; funding acquisition, P.J.Z.-P. All authors have read and agreed to the published version of the manuscript.
Funding
The authors would like to acknowledge the financial support of the Spanish State Research Agency under Grant No. PID2020-116433RB-I00 (PID2020-116433RB-I00/AEI/10.13039/501100011033).
Informed Consent statement
Not applicable.
Data Availability Statement
Not applicable.
Acknowledgments
The authors would like to thank the eCitySevilla project for providing facilities to conduct the research. The authors would like to acknowledge the support of the Spanish State Research Agency under Grant No. PID2020-116433RB-I00 (PID2020-116433RB-I00/AEI/ 10.13039/501100011033).
Conflicts of Interest
The authors declare no conflict of interest.
References
- European Parliament News. Available online: https://www.europarl.europa.eu/news/en/headlines/society/20180301STO98928/greenhouse-gas-emissions-bycountry-and-sector-infographic (accessed on 12 October 2020).
- International Energy Agency. 2018 Global Status Report: Towards a Zero-Emission, Efficient and Resilient Buildings and Construction Sector; United Nations Environment Programme: Pris, France, 2018. [Google Scholar]
- Sustainable Development Goals. Available online: https://www.un.org/sustainabledevelopment/ (accessed on 13 May 2020).
- Department of Economic and Social Affairs. Available online: https://sdgs.un.org/goals/goal11 (accessed on 14 September 2020).
- European Parliament News. Available online: https://www.europarl.europa.eu/news/en/headlines/society/20200618STO81513/green-deal-key-to-a-climate-neutral-and-sustainable-eu (accessed on 25 July 2020).
- COM. A New Circular Economy Action Plan for a Cleaner and More Competitive Europe; European Commission: Brussels, Belgium, 2020. [Google Scholar]
- Gaglia, A.G.; Balaras, C.A.; Mirasgedis, S.; Georgopoulou, E.; Sarafidis, Y.; Lalas, D.P. Empirical assessment of the Hellenic non-residential building stock, energy consumption, emissions and potential energy savings. Energy Conv. Manag. 2007, 48, 1160–1175. [Google Scholar] [CrossRef]
- Gagliano, A.; Nocera, F.; D’Amico, A.; Spataru, C. Geographical information system as support tool for sustainable energy action plan. Energy Procedia 2015, 83, 310–319. [Google Scholar] [CrossRef] [Green Version]
- Moreno, A.G.; Vélez, F.; Alpagut, B.; Hernández, P.; Montalvillo, C.S. How to achieve positive energy districts for sustainable cities: A proposed calculation methodology. Sustainability 2021, 13, 710. [Google Scholar] [CrossRef]
- Jiang, L.; Xing, R.; Chen, X.; Xue, B. A survey-based investigation of greenhouse gas and pollutant emissions from household energy consumption in the Qinghai-Tibet Plateau of China. Energy Build. 2021, 235, 110753. [Google Scholar] [CrossRef]
- Zarco-Soto, I.M.; Zarco-Periñán, P.J.; Sánchez-Durán, R. Influence of cities population size on their energy consumption and CO2 emissions: The case of Spain. Environ. Sci. Pollut. Res. 2021, 28, 28146–28147. [Google Scholar] [CrossRef]
- Huo, T.; Ren, H.; Cai, W. Estimating urban residential building-related energy consumption and energy intensity in China based on improved building stock turnover model. Sci. Total Environ. 2019, 650, 427–437. [Google Scholar] [CrossRef]
- Nageli, C.; Camarasa, C.; Jakob, M.; Catenazzi, G.; Ostermeyer, Y. Synthetic building stocks as a way to assess the energy demand and greenhouse gas emissions of national building stocks. Energy Build. 2018, 173, 443–460. [Google Scholar] [CrossRef]
- Mutumbi, U.; Thondhlana, G.; Ruwanza, S. Reported behavioural patterns of electricity use among low-income households in Makhanda, South Africa. Sustainability 2021, 13, 7271. [Google Scholar] [CrossRef]
- Williams, S.P.; Thondhlana, G.; Kua, H.W. Electricity use behaviour in a high-income neighbourhood in Johannesburg, South Africa. Sustainability 2020, 12, 4571. [Google Scholar] [CrossRef]
- Mir, A.A.; Alghassab, M.; Ullah, K.; Khn, Z.A.; Lu, Y.; Imran, M. A review of electricity demand forecasting in low and middle income countries: The demand determinants and horizons. Sustainability 2020, 12, 5931. [Google Scholar] [CrossRef]
- Anagnostis, A.; Papageorgiou, E.; Bochtis, D. Application of artificial neural networks for natural gas consumption forecasting. Sustainability 2020, 12, 6409. [Google Scholar] [CrossRef]
- Botzen, W.J.W.; Nees, T.; Estrada, F. Temperature effects on electricity and gas consumption: Empirical evidence from Mexico and projections under future climate conditions. Sustainability 2021, 13, 305. [Google Scholar] [CrossRef]
- Liu, W.C. The relationship between primaty energy consumption and real gross domestic product: Evidence from major Asian countries. Sustainability 2020, 12, 2568. [Google Scholar] [CrossRef] [Green Version]
- Balatsky, A.V.; Balatsky, G.I.; Borysov, S.S. Resource demand growth and sustainability due to increased world consumption. Sustainability 2015, 7, 3430–3440. [Google Scholar] [CrossRef] [Green Version]
- Vieira, F.; Ribeiro, M.A.; Francisco, A.C.; Lenzi, G.G. Influence of extreme events in electric energy consumption and gross domestic product. Sustainability 2019, 11, 672. [Google Scholar] [CrossRef] [Green Version]
- Chen, Y.T. The factors affecting electricity consumption and the consumption characteristics in the residential sector—A case example of Taiwan. Sustainability 2017, 9, 1484. [Google Scholar] [CrossRef] [Green Version]
- Lu, W.C. Electricity consumption and economic growth: Evidence from 17 Taiwanese industries. Sustainability 2017, 9, 50. [Google Scholar] [CrossRef]
- Karanfil, F.; Li, Y. Electricity consumption and economic growth: Exploring panel-specific differences. Energy Policy 2015, 82, 264–277. [Google Scholar] [CrossRef]
- Tiba, S.; Omri, A. Literature survey on the relationships between energy, environment and economic growth. Renew. Sust. Energ. Rev. 2017, 69, 1129–1146. [Google Scholar] [CrossRef]
- Omri, A. An international literature survey on energy-economic growth nexus: Evidence from country-specific studies. Renew. Sust. Energ. Rev. 2014, 38, 951–959. [Google Scholar] [CrossRef] [Green Version]
- Wadud, Z.; Dey, H.S.; Kabir, M.d.A.; Khan, S.I. Modeling and forecasting natural gas demand in Bangladesh. Energy Policy 2011, 39, 7372–7380. [Google Scholar] [CrossRef] [Green Version]
- Bianco, V.; Scarpa, F.; Tagliafico, L.A. Analysis and future outlook of natural gas consumption n the Italian residential sector. Energy Conv. Manag. 2014, 87, 754–764. [Google Scholar] [CrossRef]
- Cheng, M.; Liu, B. Analysis on the influence of China’s energy consumption on economic growth. Sustainability 2019, 11, 3982. [Google Scholar] [CrossRef] [Green Version]
- Liu, L.; Qu, J.; Maraseni, T.N.; Niu, Y.; Zeng, J.; Zhang, L.; Xu, L. Household CO2 emissions: Current status and future perspectives. Int. J. Environ. Res. Public Health. 2020, 17, 7077. [Google Scholar] [CrossRef]
- Lyons, S.; Pentecost, A.; Tol, R.S.J. Socioeconomic distribution of emissions and resource use in Ireland. J. Environ. Manag. 2012, 112, 186–198. [Google Scholar] [CrossRef] [PubMed] [Green Version]
- Chancel, L. Are younger generations higher carbon emitters than their elders? Inequalities, generations and CO2 emissions in France and in the USA. Ecol. Econ. 2014, 100, 195–207. [Google Scholar] [CrossRef]
- Qu, J.; Zeng, J.; Li, Y.; Wang, Q.; Maraseni, T.; Zhang, L.; Zhang, Z.; Clarque-Sather, A. Household carbon dioxide emissions from peasants and herdsmen in northwestern arid-alpine regions, China. Energy Policy 2013, 57, 133–140. [Google Scholar] [CrossRef]
- Golley, J.; Meng, X. Income inequality and carbon dioxide emissions: The case of Chinese urban households. Energy Econ. 2012, 34, 1864–1872. [Google Scholar] [CrossRef]
- Wang, S.; Guangdong, L.; Fang, C. Urbanization, economic growth, energy consumption, and CO2 emissions: Empirical evidence form countries with different income level. Renew. Sust. Energ. Rev. 2018, 81, 2144–2159. [Google Scholar] [CrossRef]
- Xing, R.; Hanaoka, T.; Kanamori, Y.; Masui, T. Greenhouse gas and air pollutant emissions of China’s residential sector: The importance of considering energy transition. Sustainability 2017, 9, 614. [Google Scholar] [CrossRef] [Green Version]
- Ameyaw, B.; Yao, L. Analyzing the impact of GDP on CO2 emissions and forecasting Africa’s total CO2 emissions with non-assumption driven bidirectional long short-term memory. Sustainability 2018, 10, 3110. [Google Scholar] [CrossRef] [Green Version]
- Tian, C.; Feng, G.; Li, S.; Xu, F. Scenario analysis on energy consumption and CO2 emissions reduction potential in building heating sector al community level. Sustainability 2019, 11, 5392. [Google Scholar] [CrossRef] [Green Version]
- Wang, J.; Song, C.; Yuan, R. CO2 emissions from electricity generation in China during 1997–2040: The roles of energy transition and thermal power generation efficiency. Sci. Total Environ. 2021, 773, 145026. [Google Scholar] [CrossRef] [PubMed]
- Tachega, M.A.; Yao, X.; Liu, Y.; Ahmed, D.; Ackaah, W.; Gabir, M.; Gyimah, J. Income heterogeneity and the environmental Kuznets curve turning points: Evidence from Africa. Sustainability 2021, 13, 5634. [Google Scholar] [CrossRef]
- Mitic, P.; Ivanovic, O.M.; Zdravkovic, A. A cointegration analysis of real GDP and CO2 emissions in transitional countries. Sustainability 2017, 9, 568. [Google Scholar] [CrossRef] [Green Version]
- Sun, J.; Shi, J.; Shen, B.; Li, S.; Wang, Y. Nexus among energy consumption, economic growth, urbanization and carbon emissions: Heterogeneous panel evidence considering China’s regional differences. Sustainability 2018, 10, 2383. [Google Scholar] [CrossRef] [Green Version]
- Mardani, A.; Streimikiene, D.; Cavallaro, F.; Loganathan, N.; Khoshniudi, M. Carbon dioxide (CO2) emissions and economic growth: A systematic review of two decades of research from 1995 to 2017. Sci. Total Environ. 2019, 649, 31–49. [Google Scholar] [CrossRef]
- Shikwambana, L.; Mhangara, P.; Kganyago, M. Assessing the relationship between economic growth and emissions levels in South Africa between 1994 and 2019. Sustainability 2021, 13, 2645. [Google Scholar] [CrossRef]
- Khan, M.K.; Teng, J.; Khan, U.I.; Khan, M.O. Impact of globalization, economic factors and energy consumption on CO2 emissions in Pakistan. Sci. Total Environ. 2019, 688, 424–436. [Google Scholar] [CrossRef]
- Ma, X.; Wang, C.; Dong, B.; Gu, G.; Chen, R.; Li, Y.; Zou, H.; Zhang, W.; Li, Q. Carbon emissions from energy consumption in China: Its measurement and driving factors. Sci. Total Environ. 2019, 648, 1411–1420. [Google Scholar] [CrossRef] [PubMed]
- Yang, B.; Ali, M.; Hashmi, S.H.; Shabir, M. Income inequality and CO2 emissions in developing countries: The moderating role of financial instability. Sustainability 2020, 12, 6810. [Google Scholar] [CrossRef]
- Sohag, K.; Mamun, M.d.A.; Uddin, G.S.; Ahmed, A.M. Sectoral output, energy use, and CO2 emission in middle-income countries. Environ. Sci. Pollut. Res. 2017, 24, 9754–9764. [Google Scholar] [CrossRef] [Green Version]
- Yeo, Y.; Shim, D.; Lee, J.D.; Altmann, J. Driving forces of CO2 emissions in emerging countries: LDMI decomposition analysis on China and India’s residential sector. Sustainability 2015, 7, 16108–16129. [Google Scholar] [CrossRef] [Green Version]
- Hirano, Y.; Ihara, T.; Hara, M.; Honjo, K. Estimation of direct and indirect household CO2 emissions in 49 Japanese cities with consideration of regional conditions. Sustainability 2020, 12, 4678. [Google Scholar] [CrossRef]
- Kennedy, C.; Steinberger, J.; Gasson, B.; Hansen, Y.; Hillman, T.; Havránek, M.; Pataki, D.; Phdunngsilp, A.; Ramaswami, A.; Mendez, G.V. Greenhouse gas emissions from global cities. Environ. Sci. Technol. 2009, 43, 7297–7302. [Google Scholar] [CrossRef] [PubMed]
- Liang, Y.; Cai, W.; Ma, M. Carbon dioxide intensity and income level in the Chinese megacities’ residential building sector: Decomposition and decoupling analyses. Sci. Total Environ. 2019, 677, 315–327. [Google Scholar] [CrossRef]
- Zheng, H.; Hu, J.; Guan, R.; Wang, S. Examining determinants of CO2 emissions in 73 cities in China. Sustainability 2016, 8, 1296. [Google Scholar] [CrossRef]
- Eurostat. European Commission. 2020. Available online: https://ec.europa.eu/eurostat/web/products-eurostat-news/-/DDN-20200203-2 (accessed on 12 October 2020).
- Zarco-Soto, I.M.; Zarco-Periñán, P.J.; Sánchez-Durán, R. Influence of climate on energy consumption and CO2 emissions: The case of Spain. Environ. Sci. Pollut. Res. 2020, 27, 15645–15662. [Google Scholar] [CrossRef]
- Eurostat. Available online: https://ec.europa.eu/eurostat/statistics-explained/index.php/Glossary:Equivalised_disposable_income (accessed on 8 December 2019).
- Eurostat Methodologies and Working Papers. Statistical Classification of Economic Activities in the European Community; Europen Commission: Luxembourg, 2008. [Google Scholar]
- Eurostat. Available online: https://appsso.eurostat.ec.europa.eu/nui/submitViewTableAction.do (accessed on 25 July 2020).
- Instituto Nacional de Estadística. Cifras de población, Ministerio de Asuntos Económicos y Transformación Digital. Available online: http://www.ine.es/dyngs/INEbase/es/operacion.htm?c=Estadistica_C&cid=1254736176951&menu=ultiDatos&idp=1254735572981 (accessed on 12 October 2020).
- Ministerio de Empleo y Seguridad Social. Real Decreto 1171/2015, de 29 de diciembre, por el que se fija el salario mínimo interprofesional para 2016. In Boletín Oficial del Estado; Agencia Estatal Boletín Oficial del Estado: Madrid, Spain, 2015. [Google Scholar]
- Instituto Nacional de Estadística. Demografía y población, Ministerio de Asuntos Económicos y Transformación Digital. Available online: http://www.ine.es/ss/Satellite?L=es_ES&c=Page&cid=1254735910183&p=1254735910183&pagename=INE%2FINELayout (accessed on 1 November 2020).
- Comisión Nacional de los Mercados y la Competencia. Informe de Supervisión del Mercado de Gas Natural en España; Ministerio de Economía, Industria y Competitividad: Madrid, Spain, 2017. [Google Scholar]
- Secretaría de Estado de la Energía. Estadísticas y Balances Energéticos; Ministerio para la Transición Ecológica: Madrid, Spain, 2018. [Google Scholar]
- Ministerio de Industria, Energía y Turismo; Ministerio de Fomento. Factores de emisión de CO2 y Coeficientes de Paso a Energía Primaria de Diferentes Fuentes de Energía Final Consumidas en el Sector de Edificios de España. Available online: https://energia.gob.es/desarrollo/EficienciaEnergetica/RITE/Reconocidos/Paginas/IndexDocumentosReconocidos.aspx (accessed on 19 March 2020).


Publisher’s Note: MDPI stays neutral with regard to jurisdictional claims in published maps and institutional affiliations. |
© 2021 by the authors. Licensee MDPI, Basel, Switzerland. This article is an open access article distributed under the terms and conditions of the Creative Commons Attribution (CC BY) license (https://creativecommons.org/licenses/by/4.0/).