Abstract
The recycling of demolition waste is essential to lower the construction sectors primary material demand, responsible for 50% of the global primary material consumption. Almost all demolition waste is used as filler material for the construction of roads, preventing further reuse or recycling after this application. The built environment generates considerable annual material in-and outflows. However, there has been little discussion on the availability and further application of this potential supply of secondary materials as a replacement for primary materials. In this study, we quantify the percentage of demolition waste that can be repurposed as secondary materials in the Dutch construction sector. We analyzed the yearly building material flows for the municipality of Leiden using municipal data on demolition and construction to explore the viability of the Dutch government’s policy goal to reduce primary materials consumption by 50% before 2030. From this analysis, we find that the recycling of demolition waste has a sizable potential but just falls short of the stated policy goal. Even in a situation with more construction than demolition, there will remain a considerable mismatch in the yearly construction material demand and available supply of demolition waste for our municipal-wide case study. More importantly, the current processing of demolition waste in the Netherlands will require significant improvements to achieve this goal. New governmental policies are required to focus on maintaining material quality and allowing further use of recycled materials as buildings materials.
1. Introduction
The worldwide extraction of materials has tripled over the past 40 years. Driven by the urbanization of the developing world and an ever-growing population, the global demand for materials is expected to triple again before 2050 [1]. The construction sector is currently responsible for a significant share (50%) of this material demand [2]. In Western Europe, the construction sector accounts for 40% of primary material use [3]. At the same time a substantial percentage of the built environment is demolished each year, especially in already developed urban regions, which generates large volumes of waste that could be reused as secondary construction material.
Currently, construction and demolition waste (C&DW) is most commonly reused as aggregates as road foundation [4]. The materials are downcycled, and further reuse is not possible. To prevent this wasteful form of reuse, one can look at urban mining as a concept for reclaiming and high-level recycling materials from the built environment [5,6].
Based on the European Commission’s Circular Economy Action Plan, the Dutch government formulated its circular economy policy to reduce the country-wide use of primary materials (minerals, metals, and fossil fuels) by 50% before 2030, including the construction sector [7,8].
In this paper, we quantify to what extent secondary materials generated through urban mining could replace the primary material demand in the Dutch construction sector. We also explore the potential yearly mismatch between the building material supply and demand and its influence on the recycling of demolition waste. We use the municipality of Leiden as a representative case study for three reasons. First, it is a typical medium-sized Dutch municipality (around 125,000 inhabitants) with a lot of old historical buildings in the city center and more modern surrounding areas. Second, based on the Dutch policy goals [8], the municipality of Leiden developed their building material policies [9]. Finally, the municipality of Leiden has been registering data on demolition and construction work, which enables us to quantify the construction material demand and supply in this municipality over time. Our municipal-wide analysis provides implications for building material recycling for the Netherlands as a country. Furthermore, we analyze the yearly building material flows and explore the Dutch construction sector’s goal to reduce primary material consumption by 50% before 2030 [8].
Building Material Stock Dynamics and Reuse Potential
Recently, multiple building material databases have been published to harmonize the available data on building materials, enabling the comparison of studies and their data between multiple countries. Continuing on the earlier work by [10,11], Heeren and Fishman summarized 301 building material data points across 21 countries [12]. Using the currently available building data, Marinova et al. (2020) and Deetman et al. (2020) were able to estimate global building material stocks and flows for residential and service sector buildings [13,14].
Müller, (2006), established the cyclical behavior of demolition and construction materials flows, with the availability of demolition waste lagging behind the construction material demand in size and time [15]. Until a building stock is saturated, logically, a mismatch in the availability of demolition waste and the demand for construction materials will occur [6,16]. Numerous studies further developed the modelling of stock dynamics for a wider variety of construction materials and case studies, amongst others, for China [17,18], Switzerland [16,19], Luxembourg, [20], Japan, [21,22], Padua, Italy, [23], and the US [24]. Hypothetically, evenly matched quantities of demolition and construction material flows can lead to a closed construction material cycle. However, as noted by Heeren and Hellweg, (2018), it is important to further explore the recycling potential of demolition waste as secondary materials to achieve this [16].
In addition to the studies that explored the dynamics of the building material stocks for a wide range of building materials, a few studies have been able to quantify the recycling potential of these building materials. Most of these studies focused on the recycling of a single material or material type, ranging from glass [25], gypsum [26], and concrete [27] to metals [28].
In the present study, we explore the topic of urban mining and C&DW, by quantitatively assessing the potential supply of secondary materials as a replacement for primary materials. By using real-world data sourced from a medium-sized Dutch city, we can quantify potential yearly (mis)match between the demand for construction material on the one hand, and the supply of demolition waste that realistically be reused as a construction material on the other hand.
2. Materials and Methods
We quantified the building material stocks and flows for 12 materials in the municipality of Leiden for the period 2019−2030. First, we calculated the municipal-wide material stocks and the material flows for this period using the information provided by the municipality on the demolition and construction projects planned between 2019 and 2030. The BAG3D, a dataset of the Dutch government containing GIS data on the Dutch building stock was used for the building properties [29]. We used an end-of-life (EOL) collection rate to determine the demolition waste available for recycling. Based on scientific and grey literature, a recycled content potential in the production of new material was used to determine the maximum amount of demolition waste that can be used as a secondary construction material. Furthermore, to determine the reduction in primary material demand, the future demand for construction materials was compared to the potential yearly available supply of secondary materials.
When available, the yearly surplus of secondary materials was used to determine the overall material mismatch. In this research, we use our case study, the municipality of Leiden, and their available data on demolition and construction to explore the country-wide implications for the Dutch construction sector. The recycling of demolition waste within a municipal-wide boundary is a theoretical assumption and not necessarily the preferred option in a real-life situation. We will debate more on this topic in the discussion section.
2.1. Building Typology and Material Intensities
Volumes of building materials were calculated using material intensity (MI) data derived from Sprecher et al. (2020, accepted with revisions), which compiled a MI database for the Netherlands. The average MIs in Sprecher et al., (2021, accepted with revisions) range from 604 kg/m2 for row houses to 2216 kg/m2 for apartments. Detached houses are among the most material-intensive building categories because foundations have a standardized minimal size and are over-dimensioned for this type of building. Apartments have the highest average MI as Dutch apartment buildings often include a parking garage. The other included building categories are more comparable, with an average MI of 604 to 1148 kg/m2. The MIs found for the Dutch built environment are in line with the findings of other studies (Sprecher et al., (2020, accepted with revisions).
In our analysis, the following building types are used for residential buildings: [a] detached houses, [b] row houses, [c] apartments, [d] high rise; for utility buildings: [e] offices, [f] commercial buildings, and [g] other. Most of these building types were already included in the BAG3D dataset and could easily be identified. Only the high-rise buildings were identified separately as residential buildings with more than 5 floors (approximately 20 m in height).
The analysis includes structural materials and also materials extracted from window frames, ceilings, doorframes, etc. For the building materials, the following materials were included, concrete, brick, wood, roof gravel, glass, ceramic, gypsum, bitumen, steel, cast iron, aluminum, and others. The category "other" contains a multitude of materials resulting from the demolition process which are difficult to identify and quantify. This category includes all the materials present in buildings that were not mentioned earlier in this paragraph. Figure 1 shows an overview of the average MIs per building type.
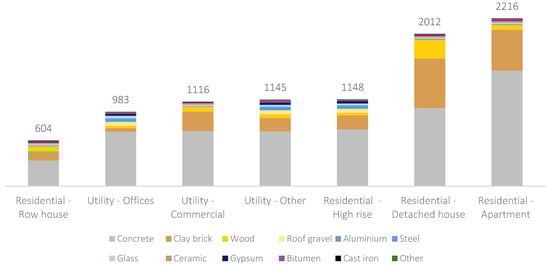
Figure 1.
Average material intensity (MI) in kg/m2 per building type (Sprecher et al., 2020).
2.2. Modelling of the Municipal-Wide Material Stocks
To model the building stock, we combined the MIs with the BAG3D GIS database for the municipality of Leiden using a Python script and the GeoPandas Python package. For the Python script, see Supplementary Information IV. The BAG3D database contains the dimensions, location, year of construction, and building type of each building in the Dutch built environment [29]. Of the 38,990 buildings in the case study, 29,013 are residential and 9997 utility. Buildings with less than 15 m2 of functional floor area, representing sheds and small garage boxes, were filtered out of the dataset. Of the 53.173 objects in the BAG3D dataset of the municipality of Leiden, 17.345 objects, or 33%, have less than 15 m2 of functional floor area. In terms of total floor area, these smaller objects account for 134.461 m2, or 3% of the 4.149.493 m2 total floor area in Leiden.
The MI per building type was projected on the GIS file of buildings planned for demolition. For each building, the material stocks were calculated, based on the building type, functional floor area and year of construction. As a result, the material stocks per building were calculated as follows
where the MI for each material (j) is dependent on the building type (k) and the year of construction (l). Although we do not have enough data to make statistical inferences, we do observe in the data that older residential buildings (<1950) contain more brick and wood in comparison with more recently constructed residential buildings. For roof gravel and bitumen, the roof area was multiplied with the MI. To identify the density of material stocks in the municipality, the total amount of material per building was converted to tonnes per land-related area. In the first part of the results, the material stocks per material category and the total building weight are shown.
2.3. Modelling of the Material Flows and Stocks for the Period 2019−2030
The material supply and demand used in our analysis was based on present knowledge of the planned demolition and construction projects for the case study. Between 2019 and 2030, 585,483 m2 of building floor area is planned to be demolished, while 995,480 m2 floor area is scheduled for construction. The predictability of new materials flows as a result of the planned demolition and construction projects (the opening of new urban mines) allows a short-term forecast of supply and demand. The long-term development of this material supply and demand is more challenging because building material composition is influenced by more factors, such as the energy transition, increasing residential floor area per capita, and different buildings techniques. The overview of the annual planned demolition and construction per building type can be found in Tables S1 and S2 in Supplementary Information I.
The information provided by the municipality included the number of planned buildings to be demolished and constructed, m2 of floor area, building types and construction timeframe. Material flows are also generated by refurbishment and repurposing of buildings, but these were not described in the construction and demolition dataset.
Materials involved in the demolition and construction projects were calculated based on the information of the building types and m2 of floor area. With this method, we quantify the potentially available material for reuse in a circular economy and the possible mismatch of material demand and supply. The material flows resulting from demolition projects per building type for the period 2019−2030 are visualized and quantified in a Sankey diagram. For the years 2026−2028, there was no data available on the predicted construction and demolition of buildings. To fill this gap, we extrapolated the average demolition- and construction rate of the years 2019−2025, assuming a short-term continuity in the demolition and construction projects.
The demolition- and construction rate, or the yearly demolition/construction in tonnes divided over the total building stock in tonnes, was also included to explain the size of demolition and construction in comparison to the total building stock. This rate was calculated as follows
The total material balance resulting from demolition and construction is calculated and visualized for each year in the period 2019−2030. To improve readability, only the two materials with the biggest mass are shown. This overview shows the yearly available materials for reuse and illustrates the difference in the available quantities from demolition and the construction demand over time. The extrapolated data for 2026−2028, no data was available for those years, is shown in the corresponding figure with a dotted pattern fill gradient. In Supplementary Information II, the material balance per year is given for each material.
2.4. Available Supply of Secondary Materials
To determine the viability of the stated policy goal to reduce primary material consumption in the construction sector by 50% before 2030, we calculated the share of primary material demand that can be potentially replaced with demolition waste. First, we determined the available supply of materials resulting from demolition within the case study and the given timeframe. Second, to determine the percentage of demolition waste that could potentially replace primary materials, we used an EOL collection rate and potential recycled content [30]. The yearly surplus in secondary materials was defined as the mismatch in material supply and demand. Lastly, we quantified how much of these materials could potentially be recycled and utilized as secondary materials by using an end of life recycling rate (EOL recycling rate) [30]. The total available supply of demolition waste was determined with the calculation presented in Section 2.3. The EOL recycling rate was calculated as follows
2.4.1. End-of-Life Collection of Demolition Waste
The recyclability of a material is not only determined by its intrinsic properties, but also by the quality of the recycling streams [30]. For the demolition of existing buildings, we assumed the use of a circular demolition process. In this process, all the materials are individually harvested from a building to prevent contamination and mixing of material streams. For example, concrete is separately collected instead of mixed in the waste container with the other demolition waste. Smaller objects, such as doors and toilets, are separately collected and kept in good condition. This process is more time-consuming and more labor-intensive than conventional demolition, but it increases the EOL collection rate and the purity of the demolition waste [31]. The EOL collection rate was calculated as follows
We determined the EOL collection rate for each material by conducting interviews with a Dutch demolition company. An overview of the EOL collection rate for each material is given in Table 1.

Table 1.
End-of-Life (EOL) collection rate and recycled content potential for demolition waste.
2.4.2. Recycling of Demolition Waste
Recycling is currently the most widely applied solution for the recovery of demolition waste as construction materials, while the reuse of building components is far less common [4]. For our analysis, we assume the use of recycling for the processing of the demolition waste. To determine the potential maximum amount of primary materials that can be replaced with demolition waste, we used the recycled content potential (%). We defined this as the potential maximum fraction of secondary materials in the total input of material production [30].
For most of the mentioned materials, the main limiting factor of their recycling potential after ensuring the material quality and mechanical properties is the legislation regarding construction materials. While useful to standardize material characteristics, the current legislation limits the addition or recycling of secondary materials in the production process [31]. New legislation is required to achieve the mentioned recycled content potentials without adversely affecting the material properties whilst maintaining the structural integrity of newly constructed buildings.
Whereas policy on the recycling of demolition waste is designed and implemented by the Dutch national government, municipalities have a strong influence on a large number of tender contracts. Through requirements in tender contracts to at least use recycled materials, or the proper processing of demolition waste in a demolition project, the municipalities have a method to align the interests of the commercial construction and demolition companies with those of the local and national government.
The recycled content potentials of the different types of demolition waste were derived from multiple scientific sources (see Table 1 for the overview). By taking the recycled content potential per material from Table 1 and multiplying these with the material demand, we calculated the recycled content limits for each material. These limits were used to calculate the amount of primary material demand that can be replaced with demolition waste in our case study. In reality, the recycling of demolition waste will not be limited to the case study boundaries. During disposal, roof gravel is treated as dangerous waste as it contains multiple harmful chemical compounds [34], and therefore we excluded the material from the collection and recycling process in the analysis. Our calculations for the recycling of demolition waste can be found in Supplementary Information III.
Though some materials theoretically have a recycled content potential of 96%, it is impossible to completely avoid the extraction of primary materials by recycling old materials. For example, in metals impurities and different alloy combinations makes it more difficult to recycle them and keep their desired material properties [38,39]. Primary material input will remain necessary to retain desired material properties, and this input is influenced by the quality of the recycled material [38]. The secondary materials available for use in the construction of new buildings were calculated by multiplying the EOL collection rate and the recycled content potential with the demolition waste. Based on the following, the availability of the secondary materials was calculated as follows
With the secondary material availability calculated for each material (j). This calculation is applied to the results in Section 3.2 and Section 3.2.2.
3. Results
3.1. Municipal-Wide Material Stocks
The built environment of Leiden in 2018 contains 18 × 103 kilotons of materials (Table 2). The two largest material stocks are concrete (11 × 103 kilotons) and clay brick (4.0 × 10³ kilotons). Wood, glass, steel and Gypsum stocks comprise between 0.64 × 10³ and 0.18 × 10³ kilotons. The smallest material stocks are ceramic, roof gravel, aluminum, cast iron and bitumen, ranging from 110 to 42 kilotons. Furthermore, in the total material stock, we found 930 kilotons of other materials. The material density of most buildings was measured at around 1–4 tonnes per m2. For taller buildings in Leiden, material density varies between 5 and 30 tonnes per m2 of ground space.
Table 2.
Materials in the built environment of Leiden in 2018.
The results presented in Figure 2 show that the material stocks largely consist of concrete and clay brick, followed by wood, glass, steel, and gypsum. Metals constitute relatively small stocks in the overall material composition.
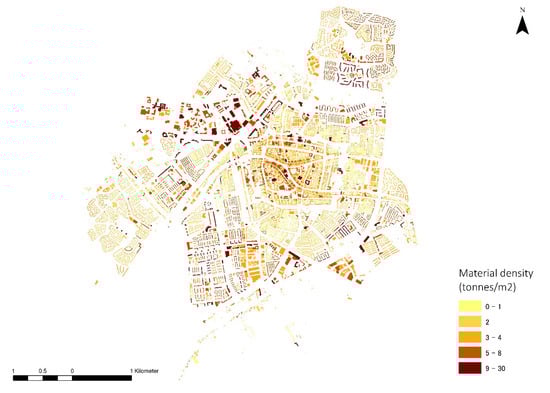
Figure 2.
The material density of building material stocks in the municipality of Leiden.
3.2. Material Flows Resulting from Construction and Demolition for 2019–2030
3.2.1. Material Flows Resulting from Demolition, Aggregate 2019–2030
The demolition of buildings in Leiden for the period 2019−2030 will result in a total of 94 × 104 tons of material flows. As shown in Figure 3, concrete (63 × 104 tons) and brick (18 × 104 tons) account for the largest materials streams. The greatest share of the materials results from the demolition of apartment buildings, offices, high-rise and other types of buildings. Their material impact is explained by the fact the municipality plans to demolish a larger share of these building types. The other material outflows are ranging from 36 × 103 tons for wood to 5.2 × 10³ tons for the other materials category. In Supplementary Materials II, Tables S3 and S4 give this information the material flows for each year and building type in tabular format.
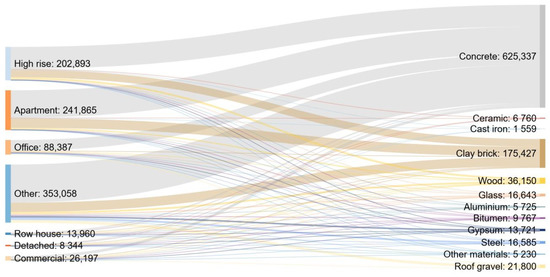
Figure 3.
The aggregate material outflow per building type in Leiden based on the demolition plans over the period 2019–2030 (tonnes).
On average, we found an annual demolition rate of 0.7% and a construction rate of 0.8%. This means that each year the total mass of the building stock in our case study increases with 0.1%.
3.2.2. Secondary Materials Availability from Demolition, Compared to Construction Material Demand on a Timeline from 2019 to 2030
By matching of materials flow on an annual basis, we found that there is a greater demand for construction material than the volume of secondary materials that could be supplied locally from demolition projects. This deficit means that even with a full implementation of circular economy policies, there will be a primary material demand of 41 (2019) up to 170 (2025) kilotons per year within the case study.
In Figure 4 we also observe considerable yearly differences between the availability of demolition waste and the demand for construction materials. The planned construction of buildings during the period 2019−2023 can be expected to generate a yearly material demand of 90–180 kilotons per year. The availability of secondary materials has a larger variability per year. Based on the available data for the period 2019−2023, demolition can be expected to generate between 10 and 90 kilotons of secondary material.
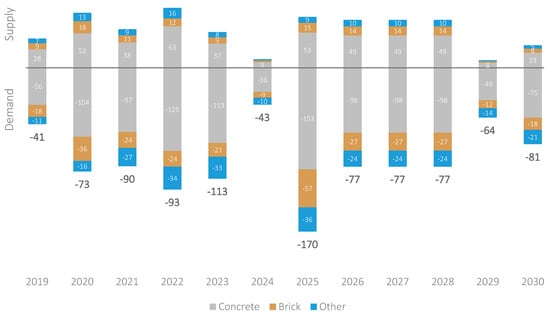
Figure 4.
Annual secondary material availability resulting from demolition (positive) and material demand from construction (negative) for the municipality of Leiden from 2019 to 2030 (kilotons, and extrapolated data shown with a pattern fill).
The overall trend in Figure 4 shows that the construction material demand during the period 2019−2030 exceeds the availability of secondary materials. This means that it is harder to match the material demand with the available secondary material supply from demolition, but in the long term, the high construction rate increases the recycling potential for the demolition waste within the boundaries of our case study. Between 2019 and 2030, 585,483 m2 of building floor area is planned to be demolished, while 995,480 m2 floor area is scheduled for construction. The material losses in the collection and recycling of demolition waste further increase the deficit between the secondary materials availability and the construction material demand.
3.3. Recycling Potential and Mismatch for Secondary Material Flows Resulting from Demolition
On average, secondary materials can supply around 41% of the demand for construction materials in our case study city. Furthermore, around 66% of the available demolition waste within our case study can be recycling in the construction of new buildings for the period 2019–2030 (EOL recycling rate, the calculation in Supplementary Materials III, Tables S6 and S7). Within the theoretical limits of our chosen case study, meeting the material demand across all materials with secondary supply varies from 29% for bitumen up to 76% for cast iron. As shown in Figure 5, none of the materials surpasses the potential recycled content limits, allowing for a considerable recycling potential of materials. A downside of this situation is that there will remain a considerable demand for primary materials. For concrete, brick, and gypsum, the recycled content limit could prove to be a limitation in a situation where construction and demolition are more evenly matched.
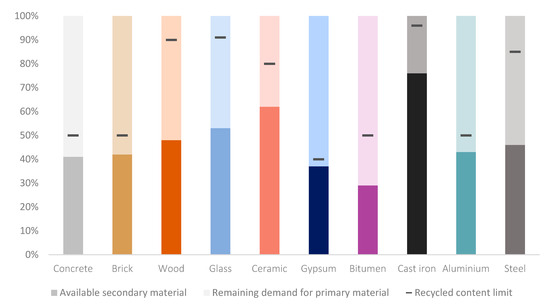
Figure 5.
Matching construction material supply and demand for Leiden including potential recycled content limits from 2019 to 2030.
Of the available demolition waste, 20% cannot be recycled due to mismatches in the yearly demand and supply of demolition waste. Another 14% is collected during demolition as material not suitable for recycling (see Supplementary Materials III for the calculation). Matching the timing of demolition and construction projects could be considered to alleviate part of the problem of a mismatch between material supply and demand.
The results show that the Dutch policy goal of reducing primary material demand by 50% is not achieved. In a situation with a lower construction material demand, it will be even harder to recycle the available supply of secondary materials. However, a situation with more demolition would increase the number of secondary materials that could replace the primary material demand, especially since the share of recycled content in our case study could still be increased.
4. Discussion
Achieving a 50% reduction in primary material demand for the Dutch construction sector will require significant changes in the current processing of demolition waste. This study provides an analysis of building stocks and flows over time, showing the potential of Urban Mining in reducing primary material demand for the Dutch construction sector. A key innovation is that we used the real-world demolition and construction agenda of the municipality of Leiden to quantify and match building material flows on a year-to-year basis.
Our findings indicate a considerable potential for the recycling of demolition waste. The yearly demand for construction materials in our case study can be lowered by around 41% with the use of demolition waste, falling just short of the Dutch policy goal of 50%. Furthermore, around 66% of the generated demolition waste can be recycled and implemented in the construction of new buildings at its EOL. In our case study city, however, the demand for building materials was higher than the supply of secondary materials, enabling higher recycling rates. Crucially, we found that 20% of the demolition waste could not be recycled due to a mismatch in time, where construction material demand occurred in one year and suitable secondary material supply in another.
The results of this study illustrate the mismatch between the yearly supply of recyclable demolition waste and the demand for building materials. We found that in our municipal-wide case study, the material surpluses and deficits vary strongly per year. Overall, we found that the supply of secondary material is not enough to meet the demand for construction materials. The material losses in the collection and recycling of demolition waste further increase the deficit between the secondary materials availability and the construction material demand. Nevertheless, in some years, for some materials, there were more secondary materials available than required for local construction. We also found that the recycled content potential of construction materials can be a limitation for the recycling of some demolition waste (concrete, brick, gypsum, and aluminum) in a situation where building demolition and construction are more evenly matched than in our case study.
While most Dutch municipalities do not have the local capacity to recycle their demolition waste, they can ensure the proper processing of this waste. Policy goals on the recycling of demolition waste are set by the Dutch national government, whereas the demolition waste is recycled by commercial companies, leaving the municipalities in an intermediary position. For example, in tenders with construction companies, municipalities can specify requirements regarding the use of secondary materials. Furthermore, the reduction in primary material demand can be used by municipalities as an indicator for circularity. However, a potential alternative measure of the local recycling of demolition waste could focus more on quantifying the recycling of the municipal-wide produced demolition waste. For municipalities, the challenge is to align the interests of the construction and demolition companies to ensure the proper processing of demolition waste, and to increase the demand for recycled materials.
All this implies that it will be challenging to fully close the Dutch construction and demolition waste cycle. In addition to the potential mismatch in building material supply and demand, historically the extent of construction has generally exceeded the extent of demolition. Furthermore, the increasing demand for more floor space per capita further increases the average material demand for each resident. Even in a situation without additional building stock growth, the collection and recycling process cannot recycle 100% of the generated demolition waste, leading to continued demand for primary materials.
Dutch legislation for construction materials should be considered as another limiting factor in the recycling of demolition waste is the current. While it is useful to ensure quality standards for new materials, the current legislation never considered the recycling of old demolition waste on a significant scale. Therefore, construction companies regard the use of demolition waste as secondary materials as a potential risk [31]. New governmental policies are required to focus on retaining material quality while allowing further use of recycled materials as building materials.
A limitation of this study is the uncertainty of demolition and construction planning. We also assumed that the material composition of buildings will remain the same in the next decade, while some future developments will influence the size and composition of these materials stocks. The growing population of the Netherlands will increase the need for housing and consequently all materials. Furthermore, the energy transition drives higher demand for metals and insulation, while bio-based building techniques will increase the share of bio-based materials [19,40].
5. Conclusions
In conclusion, our results show that the current processing of demolition waste in the Netherlands will require significant improvements to achieve the Dutch government’s goal of reducing its construction sectors primary material consumption by 50%. This goal can only be reached if there is enough secondary material supply in comparison with the construction material demand. Our case study shows a deficit of demolition waste, enabling high recycling rates. In addition to the recycling of demolition waste, new governmental policies are required to stimulate the use of secondary materials in the construction of buildings. For municipalities, the challenge is to specify requirements for their construction and demolition tenders to ensure proper processing and use of the construction materials. This study may provide a starting point for a country-wide analysis of material stocks and flows and the potential recycling of demolition waste as secondary materials.
A natural progression of this work is to analyze the impact of future building material composition on the recycling of demolition waste. More broadly, a comparison of the material supply and demand in multiple cities or municipalities could help generate further insight into building stocks and flows and clarify on which scale a circular economy of building materials can operate.
Supplementary Materials
The following are available online at https://www.mdpi.com/2071-1050/13/2/653/s1.
Author Contributions
T.J.V., conceptualization, methodology, formal analysis, software, validation, analysis, writing and editing, visualization; M.L.S., conceptualization, methodology, validation, formal analysis, writing, visualization; E.v.d.V., conceptualization, review and editing, supervision; B.S., conceptualization, writing, review and editing, supervision. All authors have read and agreed to the published version of the manuscript.
Funding
This work was partially funded by ACCEZ, a collaboration between the Province Zuid-Holland, employers association VNO-NCW West, Leiden University, TU Delft, Erasmus University, and Wageningen Research University.
Institutional Review Board Statement
Not applicable.
Informed Consent Statement
Not applicable.
Data Availability Statement
Data is contained within the article or supplementary material.
Acknowledgments
The authors would like to thank New Horizon for providing us with knowledge on the circular demolition of buildings. We also wish to thank the municipality of Leiden for sharing their demolition and construction agenda with us for this research.
Conflicts of Interest
The authors declare no conflict of interest.
References
- International Resource Panel. Global Material Flows and Resource Productivity. 2016. Available online: www.resourcepanel.org/file/423/download?token=Av9xJsGS (accessed on 1 November 2020).
- United Nations Environment. Global Status Report 2017. 2017. Available online: https://www.worldgbc.org/sites/default/files/UNEP%20188_GABC_en%20%28web%29.pdf (accessed on 1 November 2020).
- Copenhagen Resource Institute. Resource Efficiency in the Building Sector. 2014. Available online: https://ec.europa.eu/environment/eussd/pdf/Resource%20efficiency%20in%20the%20building%20sector.pdf (accessed on 1 November 2020).
- Di Maria, A.; Eyckmans, J.; Van Acker, K. Downcycling versus recycling of construction and demolition waste: Combining LCA and LCC to support sustainable policy making. Waste Manag. 2018, 75, 3–21. [Google Scholar] [CrossRef] [PubMed]
- Cossu, R.; Williams, I.D. Urban mining: Concepts, terminology, challenges. Waste Manag. 2015, 45, 1–3. [Google Scholar] [CrossRef] [PubMed]
- Schiller, G.; Müller, F.; Ortlepp, R. Mapping the anthropogenic stock in Germany: Metabolic evidence for a circular economy. Resour. Conserv. Recycl. 2017, 123, 93–107. [Google Scholar] [CrossRef]
- European commission. Circular Economy Action Plan. 2017. Available online: https://ec.europa.eu/environment/circular-economy/implementation_report.pdf (accessed on 3 January 2020).
- Rijksoverheid. Nederland Circulair in 2050. 2018. Available online: https://www.circulaireeconomienederland.nl/rijksbreed+programma+circulaire+economie/default.aspx (accessed on 1 November 2020).
- Municipality of Leiden. Strategie Duurzaam Leiden. 2019. Available online: https://www.gagoed.nl/uploads/1904034_GD_ECWD_Circulaire-economie-Leiden-2020-2023_web.pdf (accessed on 1 November 2020).
- Kleemann, F.; Lederer, J.; Rechberger, H.; Fellner, J. GIS-based analysis of vienna’s material stock in buildings. J. Ind. Ecol. 2017, 21, 368–380. [Google Scholar] [CrossRef]
- Ortlepp, R.; Gruhler, K.; Schiller, G. Materials in Germany’s domestic building stock: Calculation model and uncertainties. Build. Res. Inf. 2018, 46, 164–178. [Google Scholar] [CrossRef]
- Heeren, N.; Fishman, T. A database seed for a community-driven material intensity research platform. Sci. Data 2019, 6, 23. [Google Scholar] [CrossRef]
- Marinova, S.; Deetman, S.; Van Der Voet, E.; Daioglou, V. Global construction materials database and stock analysis of residential buildings between 1970–2050. J. Clean. Prod. 2020, 247, 119146. [Google Scholar] [CrossRef]
- Deetman, S.; Marinova, S.; Van Der Voet, E.; Van Vuuren, D.P.; Edelenbosch, O.; Heijungs, R. Modelling global material stocks and flows for residential and service sector buildings towards 2050. J. Clean. Prod. 2020, 245, 118658. [Google Scholar] [CrossRef]
- Müller, D. Stock dynamics for forecasting material flows—Case study for housing in The Netherlands. Ecol. Econ. 2006, 59, 142–156. [Google Scholar] [CrossRef]
- Heeren, N.; Hellweg, S. Tracking construction material over space and time: Prospective and geo-referenced modeling of building stocks and construction material flows. J. Ind. Ecol. 2018, 23, 253–267. Available online: https://onlinelibrary.wiley.com/doi/abs/10.1111/jiec.12739 (accessed on 14 August 2018). [CrossRef]
- Hu, M.; van der Voet, E.; Huppes, G. Dynamic material flow analysis for strategic construction and demolition waste management in Beijing. J. Ind. Ecol. 2010, 14, 440–456. [Google Scholar] [CrossRef]
- Hu, M.; Pauliuk, S.; Wang, T.; Huppes, G.; Van Der Voet, E.; Müller, D.B. Iron and steel in Chinese residential buildings: A dynamic analysis. Resour. Conserv. Recycl. 2010, 54, 591–600. [Google Scholar] [CrossRef]
- Ostermeyer, Y.; Nägeli, C.; Heeren, N.; Wallbaum, H. Building inventory and refurbishment scenario data-base development for Switzerland. J. Ind. Ecol. 2018, 22, 629–642. [Google Scholar] [CrossRef]
- Mastrucci, A. Geospatial Characterization of Building Material Stocks for the Life Cycle Assessment of End-of-Life Scenarios at the Urban Scale. 2017. Available online: https://reader.elsevier.com/reader/sd/B16D0B11DD5FBEF27413C278F5B7914FBF20B6757DA19811A606206680970861716DDE205D56374E7F685C0DD969F0AF (accessed on 16 August 2018).
- Tanikawa, H.; Fishman, T.; Okuoka, K.; Sugimoto, K. The weight of society over time and space: A comprehensive account of the construction material stock of Japan, 1945–2010. J. Ind. Ecol. 2015, 19, 778–791. [Google Scholar] [CrossRef]
- Tanikawa, H.; Hashimoto, S. Urban stock over time: Spatial material stock analysis using 4d-GIS. Build. Res. Inf. 2009, 37, 483–502. [Google Scholar] [CrossRef]
- Miatto, A.; Schandl, H.; Forlin, L.; Ronzani, F.; Borin, P.; Giordano, A.; Tanikawa, H. A spatial analysis of material stock accumulation and demolition waste potential of buildings: A case study of Padua. Resour. Conserv. Recycl. 2019, 142, 245–256. [Google Scholar] [CrossRef]
- Reyna, J.L.; Chester, M.V. The growth of urban building stock: Unintended lock-in and embedded environmental effects. J. Ind. Ecol. 2015, 19, 524–537. [Google Scholar] [CrossRef]
- Mohajerani, A. Practical Recycling Applications of Crushed Waste Glass in Construction Materials: A Review|Elsevier Enhanced Reader. 2017. Available online: https://reader.elsevier.com/reader/sd/pii/S0950061817318068?token=8A1497C22D07923DF27BCAA3E6BA56A04D4C70E6AD243F9C36C41F5E95E6AE14E26595F045B14014955A9E0E8F8250FC (accessed on 4 March 2020).
- Vrancken, K.C.; Laethem, B. Recycling options for gypsum from construction and demolition waste. In Waste Materials in Construction; Woolley, G.R., Goumans, J.J.J.M., Wainwright, P.J., Eds.; Elsevier: Mol, Belgium, 2007; Volume 1, pp. 325–331. Available online: http://www.sciencedirect.com/science/article/pii/S0713274300800458 (accessed on 6 May 2020).
- Zhang, C.; Hu, M.; Dong, L.; Gebremariam, A.; Miranda-Xicotencatl, B.; Di Maio, F.; Tukker, A. Eco-efficiency assessment of technological innovations in high-grade concrete recycling. Resour. Conserv. Recycl. 2019, 149, 649–663. [Google Scholar] [CrossRef]
- Graedel, T.; Allwood, J.; Birat, J.-P.; Buchert, M.; Hagelüken, C.; Reck, B.K.; Sibley, S.F.; Sonnemann, G. What do we know about metal recycling rates? J. Ind. Ecol. 2011, 15, 355–366. [Google Scholar] [CrossRef]
- Kadaster. BAG Nederland. 2018. Available online: https://bagviewer.kadaster.nl/lvbag/bag-viewer/index.html (accessed on 9 April 2019).
- International Resource Panel. Recycling Rates of Metals. 2011. Available online: https://www.resourcepanel.org/reports/recycling-rates-metals (accessed on 1 November 2020).
- Baars, M. Personal Communication with Demolition Company about the Processing of Demolition Waste. Available online: https://www.wbdg.org/resources/construction-waste-management (accessed on 1 November 2020).
- Zhang, C.; Hu, M.; Yang, X.; Amati, A.; Tukker, A. Life cycle greenhouse gas emission and cost analysis of prefabricated concrete building façade elements. J. Ind. Ecol. 2020, 24, 1016–1030. Available online: https://onlinelibrary.wiley.com/doi/abs/10.1111/jiec.12991 (accessed on 5 March 2020). [CrossRef]
- Tam, V.W.; Tam, C. A review on the viable technology for construction waste recycling. Resour. Conserv. Recycl. 2006, 47, 209–221. [Google Scholar] [CrossRef]
- Hendriks, C.F.; Pietersen, H.S. Report 22: Sustainable Raw Materials: Construction and Demolition Waste—State-of-the-Art Report of RILEM Technical Committee 165-SRM; RILEM Publications: Paris, France, 2000; p. 224. [Google Scholar]
- Jiménez Rivero, A.; Sathre, R.; García Navarro, J. Life cycle energy and material flow implications of gyp-sum plasterboard recycling in the European Union. Resour. Conserv. Recycl. 2016, 108, 171–181. [Google Scholar] [CrossRef]
- Broadbent, C. Steel’s recyclability: Demonstrating the benefits of recycling steel to achieve a circular economy. Int. J. Life Cycle Assess. 2016, 21, 1658–1665. [Google Scholar] [CrossRef]
- Shamsudin, S.; Lajis, M.; Zhong, Z.W. Evolutionary in Solid State Recycling Techniques of Aluminium: A review. Procedia CIRP 2016, 40, 256–261. [Google Scholar] [CrossRef]
- Reck, B.K.; Graedel, T.E. Challenges in metal recycling. Science 2012, 337, 690–695. Available online: https://www.mmta.co.uk/wp-content/uploads/2015/01/Science-Challenges-in-Metal-Recycling-Graedel-and-Reck-2012.pdf (accessed on 2 January 2020). [CrossRef]
- Ellen McArthur Foundation. Circularity in the Built Environment. 2016. Available online: https://www.ellenmacarthurfoundation.org/assets/downloads/Built-Env-Co.Project.pdf (accessed on 1 November 2020).
- Kleijn, R.; van der Voet, E.; Kramer, G.J.; van Oers, L.; van der Giesen, C. Metal requirements of low-carbon power generation. Energy 2011, 36, 5640–5648. [Google Scholar] [CrossRef]


Publisher’s Note: MDPI stays neutral with regard to jurisdictional claims in published maps and institutional affiliations. |
© 2021 by the authors. Licensee MDPI, Basel, Switzerland. This article is an open access article distributed under the terms and conditions of the Creative Commons Attribution (CC BY) license (http://creativecommons.org/licenses/by/4.0/).