Abstract
Currently, one in eight people live in neighborhoods with social inequality and around one billion people live in precarious conditions. The significance of where and how to live and in what physical, spatial, social, and urban conditions has become very important for millions of families around the world because of mandatory confinement due to the COVID-19 pandemic. Today, many homes in poor condition do not meet the basic requirements for residential environments in the current framework. Theoretical models for the urban evaluation of this phenomenon are a necessary starting point for urban renewal and sustainability. This study aims to generate a model for evaluating homes in a situation of social inequality (hereinafter Vrs) with indicators on physical, spatial, environmental, and social aspects. The methodology used in this study evaluates housing, taking into consideration habitability factors (physical, spatial, and constructive characteristics), as well as the qualitative characteristics assessing the satisfaction of users with the adaptation and transformation of the housing and its surroundings. The application of 51 indicators distributed in four previous parameters was established for this study. This quantification identifies the deficiencies of the dwellings and sets the guidelines for the establishment of future rehabilitation policies for adapting the dwellings to current and emergency scenarios. The innovation of this study is the construction of a tool for social research surveys designed to include individual indicators from the dwellings’ users, to provide a more dependable representation of the problems found in Vrs. The results of this research identified the deficiencies of precarious housing and could be used for applying effective proposals for improvement of habitability and their surroundings in the future. Furthermore, the results showed that when all the indicators were considered, the level of lag reached would be similar to that of a real housing situation, further confirming the suitability of the methodology applied in this investigation.
1. Introduction
One in eight people worldwide live in socially disadvantaged neighborhoods. This means that, in total, there are about one billion people living in substandard conditions [1], a situation which is expected to worsen in the future.
Between 2000 and 2014, developed countries saw a visible improvement in the situation of these neighborhoods and the urban population living in such situations decreased from 39 to 30%.
The Social Lag Index is a weighted measure that summarizes four indicators of social deprivation (education, health, basic services, and spaces in the home) in a single index which aims to order the observation units according to social deprivation. Nowadays, social lag in housing continues to be a critical factor in the persistence of poverty [2]. In fact, 90% of urban growth occurs in developing countries where every year, urban areas gain 70 million new residents. Over the next two decades, the urban population of the two poorest regions in the world, South Asia and Africa, is expected to double, leading to an increase in the number of precarious settlements. In Africa, where 59% of the urban population lives in disadvantaged neighborhoods, the number of urban dwellers is expected to reach 1.2 billion by 2050 [1].
In Asia and the Pacific, this would affect around 28% of the population, despite successful efforts from Asian governments in recent years to improve the quality of life of the 172 million inhabitants of these neighborhoods [3,4]
In Latin America and the Caribbean, where regulations on Vrs improvement have long been in place, approximately 21% of the population still lives in these buildings, although this figure has dropped by 17% [5]. In Arab countries, these figures range from a minority to 67–94%, depending on the country.
In Europe, soaring housing costs in the richest major cities have led to an increase in the number of urban dwellers unable to afford rent. In fact, over 6% of the urban population in Western Europe lives in extremely precarious conditions [6]. At the same time, in the USA, housing precariousness can be observed among low-income inhabitants in rural settings [7].
One of the Millennium Development Goals for 2020 is to significantly improve the lives of at least 100 million slum-dwellers, ensuring access to basic housing and services for all by 2030.
Therefore, this study aims to create an evaluation model for socially disadvantaged homes, in order to analyze, evaluate, and propose improvements to ensure adequate housing habitability currently and in emergency scenarios. This could lead to the proposal of improvement solutions suiting the real needs of users. Following an in-depth study of the bibliography, the social parameters and indicators for housing satisfaction are identified and combined with other research indicators which could be generalized and replicated in other case studies. In addition, based on the results of this study, a data collection tool for social research on the occupants of the homes studied is designed to address the real needs of the users.
1.1. Socially Disadvantaged Homes
During the state of alarm caused by COVID-19, homes became a refuge from the pandemic, but they also became workspaces, places of leisure, games, etc. However, the lockdown experience has not been the same for everyone and has been greatly conditioned by the type of housing. The experiences of living in single-family or multi-family homes or in situations of social inequality are not comparable [8].
The importance of how and where to live and in what physical, spatial, social, and urban environment conditions has hugely increased for millions of families around the world following the compulsory lockdown enforced during the COVID-19 pandemic. Housing is one of the issues at the center of this battle, as social distancing and good hygiene practices cannot be guaranteed without suitable housing [9].
The social dimension and urban environment have been affected by overcrowded coexistence in Vrs. Increased stress levels were observed as the limited space available in the vast majority of these homes could not meet the needs of their inhabitants. This has also led to an increase in instances of violence against women, transmission of the disease due to having to live in close quarters, and psychological issues in children and adults stemming from the absence of well-lit green open spaces. This pandemic has highlighted the importance of social cohesion and urban development, and therefore the urban agenda should be placed at the center of public policies [10].
Worsening of quality of life and well-being in precarious housing during lockdown has prompted a search for urgent solutions, which have now been added to previous actions set out in international agendas, such as the Sustainable Development Goals for 2030.
For the sustainable development of cities, extensive research has been carried out by experts such as Mona Atia in Morocco [11], D. Rockwood [12] and Mª José Rúa [13] on the issue of action and rehabilitation processes in depressed urban environments experiencing social poverty. To carry out this task, the authorities and local communities in particular, play a key role in urban regeneration and planning human settlements, while the transformative power of urban policies and territorial planning tools for sustainable development is undeniable [14,15,16].
In Africa, programs have been set up in partnership with local communities to improve the population’s living conditions, prioritizing rainwater and sanitation facilities in public spaces [1] In Australia, the New Office of Urbanization developed the country’s first 2010–2030 urbanization policies to reduce urban poverty in unplanned settlements [17] In South America, governments are implementing programs for sustainable urban and rural development, such as the ICHP housing project and a water project [18].
In addition, according to the Diagnostic Study of the Right to Proper Housing in 2018 [19], in Mexico there are fourteen million homes in need of new construction or substantial improvement. This represents 45% of the overall housing stock, although, in rural areas, this figure can reach up to 97%.
At the urban level, socially disadvantaged areas are considered to be those occupied by groups of people in situations of marginalization and social exclusion, and the issues affecting them are rarely addressed in policies, especially in developing countries [20]. These settlements form as a result of internal migrations of population in search of better job opportunities brought about by the injection of foreign capital and the transition from agricultural to industrial and service economies [21]. Whereas habitability conditions should be tackled in order to improve living conditions in housing, ignoring social objectives and focusing on the development of cities could result in a negative cycle of imbalances within the structure of the city [12], to the detriment of the global objectives of achieving resilient cities.
Therefore, an urban study of social lag is important for policy formulation, especially as few studies have attempted in-depth examinations of this issue using real data in situ, as highlighted by Sebastián Galiania [22]. Different governments have selected a range of approaches for the improvement of the quality of life of the occupants of these neighborhoods. One example of this was the proposed relocation of these neighborhoods to other places in the 1970s, usually to cheaper land where homes could be rebuilt [23]. However, in the 1980s, programs emerged which were based on a series of policies for the improvement of urban infrastructure and services. The current situation is the direct result of these initiatives for improvement.
At present, theoretical models are a necessary starting point for assessing the habitability of homes on an international scale. However, attempts to implement this practice in real cases in a given physical and socioeconomic context could lead to different housing models, considered unsuitable for the case study [13].
An example of this can be found in the Right to Housing Plan, drawn up to relieve pressure on the housing situation in Barcelona. Taking into consideration access to urban resources and equipment services, this plan aimed to reverse inequality by improving habitability conditions in the housing and its surroundings [24]. Certain proposals presented aimed to expand the housing stock in order to reduce real estate speculation, while others focused on Spanish and European policies for urban regeneration and rehabilitation of these neighborhoods, restoring their importance within the city. However, since these neighborhoods were in central areas, the housing fell prey to speculators [25].
Given the worsening quality of housing, poverty, and unemployment conditions in the Netherlands and Great Britain, housing diversification plans have tended to recommend demolishing, selling, or updating these dwellings. In this case, the main objective was not just to improve housing but, more so, to improve the economies of cities to the advantage of urban areas in the regional housing market [26].
The habitability of housing, which inherently conditions the well-being of individuals and their environment, is essential for ensuring sustainable global development [27]. Habitability and quality of life are conditions determined by the psychosocial profile of individual families, and are seen as habits, behaviors, and ways of being consolidated over time. Quality of life in their homes is an influential factor in the way of life of its residents, covering specific characteristics to meet their needs, while also providing some degree of satisfaction.
As described above, although the issue of habitability is global, its intensity is determined by the particular economic and social characteristics of individual regions. This is the case in Mexico, where the situation has worsened, especially in city centers. At present, housing in Mexico is an urban problem stemming from the housing policies put in place to guarantee families access to this constitutional right [28]. Marginalized sectors of the population outside the economic structure of the industrial city and the lack of purchasing power have prevented the population from accessing decent housing. According to calculations made in recent years, one million homes in Mexico need retrofitting or adaptation. In addition, 220,000 new homes must be built every year in order to cope with population growth. Since the 1950s, the population of Mexico City has increased from 3.4 to 21.3 million inhabitants and the city is expected to be one of the top ten in the world population growth ranking for the year 2035, as seen in Figure 1 [29].
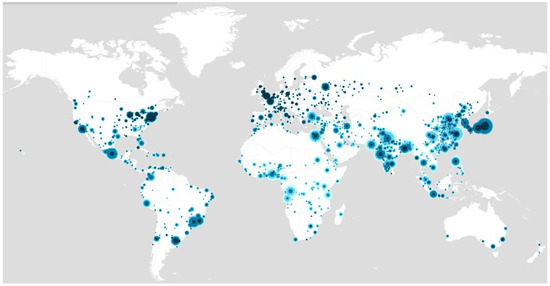
Figure 1.
World city populations 1950–2035. Dark Blue (current population), light blue (future population). © Colaboradores de OpenStreetMap.
1.2. Urban Sustainability Indicators
Given the large number of factors to be considered and correlated in the growth of cities, the assessment process for this situation is complex. It requires the use of indicators, which are tools that provide concise information through the description and analysis of complex situations [13]. The task of establishing a list of suitable indicators is challenging, as these are becoming increasingly important tools for drawing up policies on management performance in key problems for contemporary cities [30].
The indicators, i.e., parameters that provide information or a value derived from them, describe the status of a given phenomenon [31], summarize a situation, and are developed for specific objectives. When applied in cities, they make it possible to evaluate certain processes or aspects of a reality geared toward previously defined objectives, identifying improvements, changes, etc. [13,32].
Among the current wide range of indicators for different purposes, we find the BUES comprehensive evaluation model which uses multidisciplinary indicators on physical, urban, environmental, and social conditions to formulate policies on vulnerable housing [33]. Other indicators are used in the evaluation of the vulnerability of an urban environment to climate change [34,35] the energy reconditioning of social housing [36,37] and housing spaces and their construction materials [38]. Therefore, given the multiple scientific, political, and social fields involved, establishing a methodology to standardize the indicators is a complex task.
Most studies have reviewed indicators suited to the case study for existing sustainable development, ascertaining which indicators are most appropriate with the help of experts in the field [13,39].
These indicators, which are influenced by the scale and unique features of an urban study environment [40,41] are of importance in renewal policies. According to the studies by Marta Braulio et al. [42], these indicators vary from one region to another and must be suited to the specific conditions of the context of the study region if they are to be used as tools.
At present, these indicators are of importance in decision making on renewal policies in European countries. This is the case of the Sustainable Growth Operational Programs (2014–2020) for smart, sustainable, and inclusive growth and the 2018–2021 Housing Plan, which reinforce the Spanish Ministry of Development’s commitment to rehabilitation and energy efficiency. For example, in social housing, dating from 1939 to 1979 in Zaragoza (Spain), physical performance indicators were developed in collaboration with the local administration at the neighborhood and district levels. This made it possible to identify the buildings with the worst performance in energy efficiency, sound insulation, accessibility, etc., with a view to retrofitting [43].
In Barcelona, these indicators are geared toward the retrofitting of homes for energy savings [44]. This is also the case in Malaga, where Spanish and European policies for urban regeneration and rehabilitation of neighborhoods have been implemented, as seen in the case studies of the areas of Trinidad and Perchel between 2005 and 2012 [25]. The approval of the General Plan of Urban Planning for Malaga jeopardized the traditional neighborhoods, which were targeted by major speculative interests, prompting mass protests from city residents.
Other international regeneration plans for homes and neighborhoods, including that for the new Urban Habitat Agenda III (NAU) in Quito in Ecuador, address the issue of human settlements [45]. In Colombia, for instance, a subsidy was awarded for 100,000 homes [46] under the national development plan (2014–2018) aimed at the population in extreme poverty.
Despite all of these policies, the participation of administrations, and intervention programs for social housing, it has not yet been possible to halt the development of informal housing built by the population in extreme poverty. These studies clearly highlight why public policies should focus on solving the needs studied by an evaluation tool. Target users must be willing to embrace the improvement solutions if these are to succeed. If attention is paid only to the development of cities, but neglecting social objectives, the structure of these cities is subjected to a negative cycle of imbalances to the detriment of the global goals of achieving resilient cities. This research develops a tool which incorporates the indicators to be used, following an in-depth selection process from those internationally available and combined with those obtained from in situ fieldwork on Vrs.
2. Material and Methods
The evaluation methodology in this study focused on housing, taking into consideration habitability factors (physical, spatial, and constructive characteristics), as well as on the qualitative characteristics assessing user satisfaction regarding the adaptation and transformation of housing and its surroundings. The following five phases in the evaluation model meet the lower-level objectives established hierarchically in order to guarantee the main objective, as seen in Figure 2:
- ➢
- The first phase is based on a review of international, national, and local scientific studies on the use of indicators for detecting and analyzing dwellings in situations of social lag.
- ➢
- The second phase describes the study area and sample size in order to define appropriate indicators, based on the analysis in areas of social inequality.
- ➢
- In the third phase, the hierarchy matrix of indicators applicable to the Vrs is generated through fieldwork in the social context of the sample determined in the previous phase, with social, physical-spatial, and surrounding indicators from relevant international and national bibliographical and institutional sources [5,19,47,48,49]. The indicators of physical-spatial characteristics of the homes and the urban context of the neighborhood and social considerations of the users are all used as a starting point for the development of the data collection tool. Qgis software version 3.6.2 is used to display the results obtained by territory.
- ➢
- The fourth phase uses the database obtained to evaluate and quantify user satisfaction for the social, physical-spatial, and housing environmental indicators. This makes it possible to establish a habitability scale, as well as guidelines for rehabilitation and urban regeneration. For the purposes of comparing results, the level of social lag is represented in five strata (very low, low, medium, high, and very high), determined through statistical sampling using computer programs such as Statistical Package for the social Sciences SPSS (IBM) and statistics for excel XLSTAT.
- ➢
- Finally, in the fifth phase, these statistical data are used to formulate the evaluation model, containing all the indicators to be considered, including the results obtained from the research. The evaluation model is validated in a real case in a situation of social inequality in Mexico. Recommendations and actions are proposed for the reduction of social lag based on the results obtained.
The methodology is described in the subsections below.

Figure 2.
The process for developing a set of urban sustainability indicators. Source, author.
Figure 2.
The process for developing a set of urban sustainability indicators. Source, author.

2.1. Phase 1: Identifying Social, Physical-Spatial, and Urban Environment Indicators for Housing Satisfaction
In this phase of the methodology, the satisfaction parameters and indicators for housing are determined based on the social, physical, spatial, and inter-urban aspects. These are obtained from the analysis of bibliographical sources, from the ethnographic analysis carried out on the housing occupants, and from the research contrasting the previous points, for which a number of steps is necessary, see Figure 3.
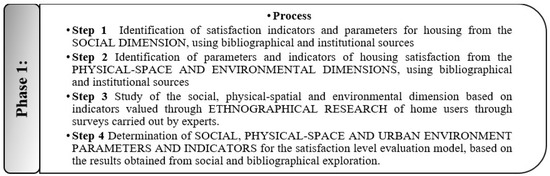
Figure 3.
Detailed steps of Phase 1 of the process in order to obtain a list of indicators for housing satisfaction. Source, author.
Similar studies selected in the analysis of indicators from other bibliographical sources have considered social, physical-spatial, and environmental aspects. For the social dimension, academic models have been used in the evaluation of residential habitats, notably the indicators for social diagnosis by Maite Muñoz [50], the quality of life in the home [47,51,52], the social lag indices of the National Council for Social Development Policy Evaluation [19] and its social measurement dimensions [53].
In addition, parameters and indicators of the social dimension have been identified using international institutional sources including: Sustainable development of communities: Indicators for city services and quality of life [48]; UN-HABITAT indicators [54]; indicators for social diagnosis [50]; the index of quality of life in housing by María Salas [55]; and study dimensions for precarious housing [5]. The social, physical, spatial, and urban environment indicators were all identified based on the studies and bibliographical models analyzed (see Appendix A. The frequency, the number of times in which the study models were repeated, and their link with the Vrs were established. An ethnographic analysis was carried out to identify the indicators best suited to the different case studies. A questionnaire was drawn up with the indicators identified, as well as their frequency and relation to the Vrs in all three aspects studied, i.e., physical-spatial, social, and urban environment (see Appendix B). Finally, any indicators considered to be important by over 50% of the sample were selected and included in the final survey tool to assess satisfaction in Vrs. In the same questionnaire, users were asked questions for each dimension about which aspect would improve their satisfaction and well-being in housing. Any results of this social exploration that exceeded 60% of the answers were included as new indicators for this tool to assess the level of social lag.
The indicators of the physical, spatial, and urban environment dimensions were rated following a trichotomic scale, that is, with “1”, “2”, and “3” responses representing highly deficient, deficient, and adequate levels, respectively. The assessment of the social dimension followed a dichotomous scale, with “yes” or “no” answers, justified in the analysis of other studies [5,47,48,50]. In this case, the aim was to detect the shortcomings of housing in order to include them as indicators; therefore, the response scale was not decisive, as shown in Table 1.

Table 1.
Questionnaire scheme of indicators applicable to Vrs.
Where n, n1, and ni, are the number of dwellings in the sample. R is the response of home users in the ethnographic analysis.
This phase of the methodology was completed with the social, physical-spatial, and urban environment parameters of the model evaluating the level of social lag, based on the results obtained from social research, satisfaction level, and adaptation of the existing bibliographical sources (Table 2).
Table 2.
Evaluation model: System of parameters and indicators for the evaluation of satisfaction in Vrs. Source, author.
The evaluation model obtained was composed of 51 indicators structured into four dimensions: social (11 indicators), physical (19 indicators), spatial (8 indicators), and urban environment (13 indicators). The key innovation of this phase of the methodology was the introduction of indicators proposed by technicians who knew the area under study and the home occupants themselves.
The numbering in the “indicator code” column corresponds to the numbering that appears in the general list from the study of the existing literature (see Appendix A) while “0” corresponds to the indicators proposed by the research. Indicators shaded in gray were obtained from social research.
2.2. Phase 2: Identification of the Scope of Study and Scale of the Study Sample
An area with a high Vrs index where major population growth is expected was selected in order to establish the scope of the study and scale of the sample. This step increases the global impact of the application of the Vrs evaluation model proposed. The level of social lag in the field of study, and the physical environment and surroundings, should be considered in order to base the study on logical processes and on-site data collection of the actual case study, outlining a specific area (Figure 4).
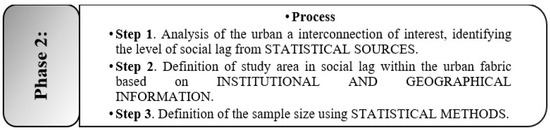
Figure 4.
Detailed steps of Phase 2: Determination of the scope of study and scale of the study sample. Source, author.
The use of qualitative mixed method, in this case, provides richer and more varied results thanks to more dynamic inquiries, physical-spatial, and social issues. This, in turn, ensures more reliable results from the data research, by integrating qualitative and quantitative data based on collection, analysis, and integration. According to Sampieri [56], one of the reasons for using mixed methods (qualitative and quantitative) is that the weaknesses of either method is counteracted, and their individual strengths are reinforced. Taking the aforementioned into consideration and following J. C. López Alvarenga [57], the following calculation formula was used to determine the sample size from the population size (Formula (1)):
Formula (1) is the sample calculation formula based on population as follows:
where n is the sample size, Z is the confidence level value, N is the population size, e is the margin of error, and P is the percentage of the population with the study characteristic. The result of n must have a level of confidence of 90% with an error of ± 10%, for the qualitative questions of the study based on surveys.
As this study aims to analyze dwellings within a specific area, with a finite population known to expert technicians, the sampling technique used was discretionary rather than probabilistic. The selection was determined by the physical and spatial characteristics of the housing studied and its occupants, allowing the habitability conditions and the perception of the immediate environment to be established. Study subjects were selected by the technicians after the relevant on-site examinations. It did not matter if the final sample was small, as long as the characteristics mentioned above were highly variable. The study sample was, then, determined and verified through application to the case study.
2.3. Phase 3: Analysis of the Housing Studied, Based on the Set of Physical-Spatial, Social, and Environmental Indicators
At this phase (Figure 5), the conditions of the dwellings under study (social, space, physical, and urban environment) were initially analyzed through in situ data collection.
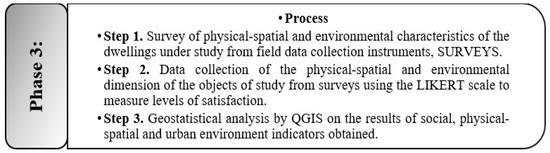
Figure 5.
Detailed steps of Phase 3: Analysis of the housing studied, based on the set of physical-spatial, social, and environmental indicators. Source, author.
The survey of physical-spatial and environmental characteristics of the dwellings was carried out using field data collection instruments (see Appendix C), i.e., files designed for this purpose containing the graphic information, construction elements, and materials and distribution of spaces of each dwelling.
At this phase, a survey model was also designed which included the system of parameters and indicators detailed in Phase 1 (Table 2) and allowed the level of satisfaction in the Vrs of the defined sample to be assessed (see Appendix D). The Likert psychometric scale (system of indicators used in questionnaires for research to evaluate the opinions and attitudes of a person, measuring the level of agreement or disagreement of the respondent) was chosen in order to obtain information which statistically showed a mean or average trend. This scale was considered to be suitable for measuring the degree of satisfaction of the users of the socially disadvantaged homes studied, establishing the validity and confidence of the results obtained for the spatial, physical and urban environment dimension. This follows the methodology used in another study [58] which recommended an evaluation system with five response categories, i.e., totally unnecessary, somewhat necessary, moderately necessary, necessary, and very necessary.
For the social dimension, the two response categories established were YES and NO. The results obtained were used to identify the indicators with the highest level of need among the population. Then, the group of indicators most often with the highest need was statistically analyzed for each dimension, which translated into the requirement to satisfy existing needs.
The results of individual sample units were synthesized in georeferenced graphics using the QGIS version 3.6.2 program (Figure 6).
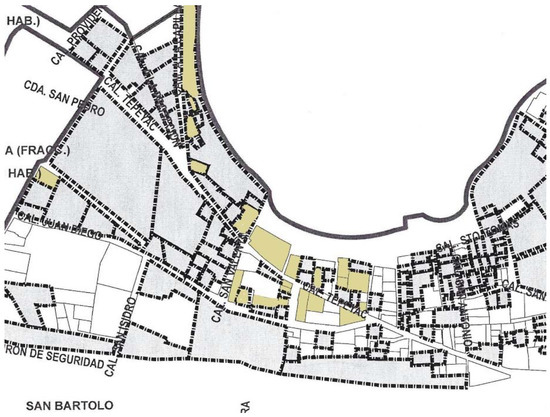
Figure 6.
Georeferenced maps of the sample. QGIS version 3.6.2. Source: author.
The indicators of the satisfaction evaluation system for the Vrs must be linked to the existing support policies of the study area. Although this relationship with existing policies is not binding, as regards the possible results obtained, it does suggest a correlation between the indicator and the aid model and recommends the most appropriate support policy, depending on the indicators most in need. This is important, as one of the biggest problems in the Vrs is the owners’ lack of knowledge of support programs for the improvement of their homes.
2.4. Phase 4: Evaluation and Quantification of the Level of Satisfaction in Housing in Social Lag
At this point, based on the information obtained from the previous phase, the attributes of the indicator system were mathematically weighted to quantify and evaluate the level of satisfaction in the Vrs. Once the users of the homes rated these and the level of satisfaction of the different dimensions was established through the Likert survey, the data obtained were treated statistically through a numerical stratification of values and satisfaction levels. The steps of Phase 4 are shown in Figure 7.
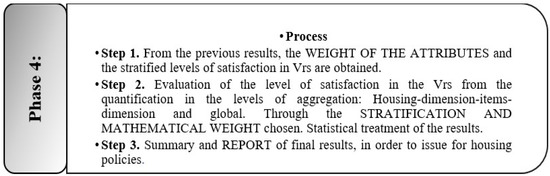
Figure 7.
Detailed steps of Phase 4: Evaluation and quantification of the level of satisfaction in housing in social lag. Source: author.
The weight of the attributes and the stratified levels of satisfaction were determined mathematically based on the results of the previous evaluation of the characteristics relating to the physical-spatial, social, and urban environment dimensions treated with the Likert scale method in socially disadvantaged housing.
To do so, the results obtained were homogenized to consider the attributes of the indicators. In this case, a value was assigned to the data generated by transforming and combining these attributes to create a set of results. Then, a weight was assigned to the indicators, from 0 to 1, with each of them contributing a value to individual components or dimensions. These results were assessed on a scale from 1 to 5 by the user, the occupant of the dwelling, who determined the level of needs to be satisfied in ascending order (see Appendix F). The level of need ranged from Number 1, determining the lowest level of need, considered unnecessary to Number 5, assigned to analyzed indicators which were considered very necessary. Each level of satisfaction was weighted based on a mathematical equation determined by experts in the field from the University of Seville. This mathematical technique uses absolute frequencies to determine an expected value that goes from 0 to 1, and therefore the previous satisfaction scale between 1 and 5 represented 100% of the total dimension.
Cronbach’s alpha method was used [59] to validate this psychometric scale tool (Likert scale), in order to measure the correlation between the items. It was assumed that they measured the same variable and were highly correlated, and the approximate result of 0.8–1 was considered to be highly acceptable based on the results of other studies by S. Welch [60], J.A. Gliem [61], Victor Corral-Verdugo et al. [62]. The software used was IBM Statistical Package for the Social Sciences (SPSS).
Formula (2) for Cronbach’s alpha procedure to obtain the results from the correlations between the items:
where S2 is the variance of the item or indicator, is the variance of the total values observed, and K is the number of questions or items.
Once the tool was validated, a data distribution normality test was carried out using XLSTAT software for the purpose of making comparisons, including data distribution (median, average, maximum, and minimum).
These methodologies aim to obtain a score of the valuations from the data collected in the field using the Likert scale surveys. These indicators must be weighted by assigning a specific value matching the importance of the characteristic being measured in order to quantify and evaluate the characteristics and dimensions of the sample units.
For this, the five levels of satisfaction initially measured on the Likert scale represented a quantitative ratio number, obtained through Formulas (3) and (4). Then, a specific value (between 0 and 1) was established, with 1 indicating a higher level of dissatisfaction. As Table 3 shows, the degree of satisfaction by dwelling (vertical reading) and by indicator (horizontal reading) could be obtained for all dwellings analyzed.
Table 3.
Summary of previous results of dimensions on evaluation of housing satisfaction in social lag and its symbols. 1, Unnecessary (very satisfied); 2, somewhat necessary (satisfied); 3, medium (moderately satisfied); 4, necessary (dissatisfied); 5, very necessary (completely dissatisfied).
This formula must be weighted by function (attributed to the user), as the weights and values were variable, guaranteeing that the data obtained from the in situ measurements depended directly on the results of the dwelling occupants, and not on the researcher, as recommended by J. L. P. Gómez [63].
Thus, help was sought from experts from the field of mathematics and statistics in the Faculty of Mathematics of the University of Seville [64] to create a weighting formula for a new approach to the weighting strategies known to date.
Formulas (3) and (4), weighting for the level of satisfaction in socially disadvantaged housing were as follows:
where Iv is the index for housing, n.c is the number of indicators in the column, L is the upper limit of the assessment, and v.o is the levels observed.
where Iv is the index by item, n.i is the number of indicators in the row, L is the upper limit of the valuation in the row, and v.o is the levels observed (refers to the sum of the levels in the row in this case).
The data for the values of the degree of satisfaction per item per dimension and per housing dimension were defined by applying these formulas. An average value was established for both dimensions, determining the value of the dimension studied (.
Considering the items for the set of dwellings studied, in order to calculate the degree of satisfaction for each of the dimensions, the results were treated and sorted in ascending order (from lowest to highest) on an Excel sheet in order to calculate the amplitude (A) of the statistical dataset (the amplitude calculates the difference between the highest and lowest value scores). This value was added to the minimum value and these data were considered the first level of satisfaction. Then, this procedure was repeated with the remaining values until the existing upper limit of the group, as shown in Table 4, was reached. Stratum 1 indicates maximum satisfaction while Stratum 5 represents the level of minimum satisfaction.
Table 4.
Degree of satisfaction sorted in ascending order and stratification by levels according to dimension.
The left hand table shows the number of dwellings and satisfaction data for housing and stratum. The right hand table shows the calculation of the amplitude and level of satisfaction by stratification and dimension.
Phase 4 of this investigation concluded by establishing the degree of satisfaction for each indicator in each dimension and global dimension.
2.5. Phase 5: Determination of the Indicators Applicable to Vrs. Establishment and Validation of the Model
Finally, the model was applied to a real case in order to validate this tool for the evaluation of housing in social inequality, as a strategy for urban renewal and regeneration (Figure 8).
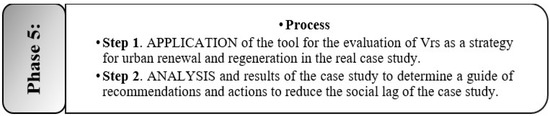
Figure 8.
Detailed steps of Phase 5. Determination of the indicators applicable to Vrs. Source, author.
This study focused on Mexico, where currently more than half of the housing stock needs improvement and almost 47% of homes are in situations of social inequality. Because it is also one of the cities with the highest population growth predictions, the model for assessing socially disadvantaged housing is expected to have a greater impact on a global scale.
The analysis of social lag in the Mexican Republic at the national, state, and local levels showed that Mexico City, Hidalgo, and Pachuca de Soto displayed the highest levels of social lag. The level of social lag for each of the thirty-two federal entities within Mexico is shown in Figure 9.
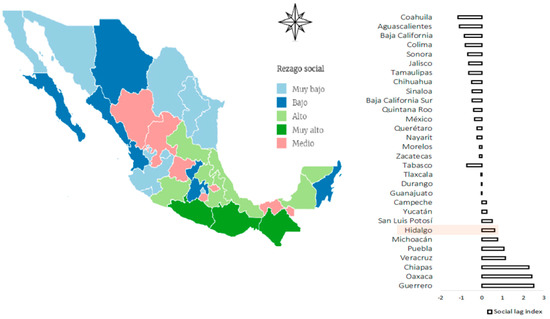
Figure 9.
Left: Social lag by federal entity in the Mexican Republic, in 5 levels of stratification, i.e., very low, low, medium, high, and very high; Right: social lag indices of the federal entities of the Mexican Republic. Red (Hidalgo). Source, author.
As can be seen in Figure 9, in terms of the level of social lag, the State of Hidalgo is seventh among the thirty-two states that make up the Mexican Republic. According to the National Institute of Statistics, Geography, and Informatics [49] it has one of the highest levels of social lag, despite a decrease in recent years. The municipal government is in charge of managing the state, made up of 84 municipalities including the capital city, Pachuca de Soto, which has areas of social inequality in the periphery and where an area has been outlined for the application of the study methodology. Of the 84 municipalities in the State of Hidalgo, 12. municipalities display a very low level of social lag, followed by 31 municipalities with a low level, 25 municipalities with a medium level, and 16 municipalities with a high level [49]. With almost 53 million poor people in the country, these levels are comparable to a European city like Barcelona.
The starting point for this research was the socially disadvantaged housing, which according to CONEVAL, was defined in areas based on the construction of a single index with 5 indicators, considering information on education, access to health services, quality of housing, basic services in housing, and household assets.
The study sample selected was the city of Pachuca, which has 277,325 inhabitants and is classed as an average city according to the national urban system. Currently, this is a physically fragmented city, with social disintegration due to migratory flows, and it absorbs the population of the federal capital. Pachuca is one of the territories most affected by the new socio-spatial dynamics, most notably the construction of extensive urban peripheries, hence, the interest in studying this geographical area. The study area within the city is an urban settlement with high levels of social inequality and eligible for subsidies. The Cruz del Cerrito neighborhood is one of the oldest in the urban peripheries of the City of Pachuca. It dates from approximately the 1950s, a time when Mexico was moving away from rural activity in favor of industrial activity in the city. An area of this population was outlined, considering the level of social lag, the physical environment, and surroundings, in order to carry out a study based on logical processes and data collection from the case study. A homogeneous sample with the same characteristics was selected from the field of study.
In order to ensure an accurate representation of this study, based on the previous formula (Formula (1)) the sample size (n) should be 21. With 21 dwellings, the level of confidence of the sample is 90% with an error of ±10%. Finally, 23 dwellings were selected for this case study, representing 80% of the population. The study sample was characterized as dwellings with deed-holding owners, since ownership is essential to ensuring eligibility for subsidies at local and national level.
Formula (1):
where Z is the confidence level value, in this case 90% = 1.65; N is the population size, in this case = 29; E is the margin of error, in this case 10%; and P is the percentage of the population with the applicable study characteristic, in this case 0.5 as constant.
The dwellings selected are domestic units occupied by one or several families, sometimes sharing a common access. These are small houses, built using precarious or recycled materials. Most are built of cement blocks covered with corrugated iron or fiber cement. The floors are also finished in cement, without any type of flooring and the metal windows are single glazed. Figure 10 shows the most representative housing examples within the study sample.
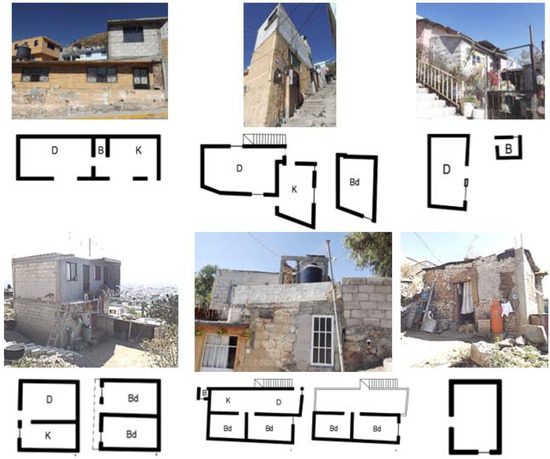
Figure 10.
Examples of case studies. K (Kitchen), B (Bathroom), D (dining room), Bd (Bedroom).
3. Results
The results obtained from the analysis and evaluation of the study sample in the different phases of the methodology above are described in this section.
The results on social, physical-spatial, and environmental indicators were based on the ethnographic analysis (see Appendix E).
Figure 11 shows the results of the social research on the spatial dimension, providing trichotomic data on the needs of the users of the 23 dwellings. These results highlight users’ needs for more space in their home, as many would like to have additional rooms for use as bedrooms. In addition, most of them would like more open space in their homes, which is very limited due to the spatial dimensions of the different areas in the dwellings.
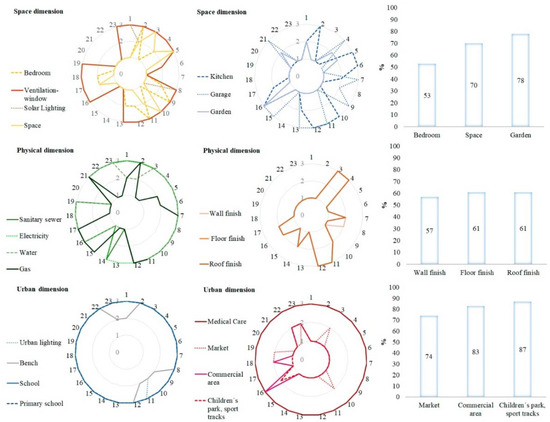
Figure 11.
Results of the response of the users of the 23 dwellings studied with spatial, physical, and urban dimensions based on seven preliminary indicators, considering whether they perceive these as adequate (3), deficient (2), or highly deficient (1).
For the physical dimension, determined by seven indicators (sanitary sewerage, electricity, water, gas, and wall, floor and roof finishes), users would improve the finishes on walls, floors, and roofs. It was observed that housing users perceived greater deficiencies in finishes in cases where recycled materials had been used as protection; 61% of housing users felt the need for wall and floor finishes and 57% for wall cladding.
The results of the urban dimension were determined by eight indicators (urban lighting, bench, school, primary school, medical care, market, commercial area, and children´s park). In this case, users would improve recreational areas (87%), commercial areas (83%), and markets (74%).
Finally, Table 5 shows the results of social dimension indicators based on social research and considered the most deficient of the indicators stated.
Table 5.
Indicators to incorporate for the evaluation of satisfaction in Vrs.
Other social, physical-spatial, and urban environment indicators from bibliographical sources were added to these indicators. In order to simplify these, those with a greater weight in the valuation of housing were identified. The purpose of this was to choose the indicators relevant to the objective of the investigation. Finally, a model for assessing satisfaction for socially disadvantaged housing was designed (see Table 1).
The results of the main housing deficiencies were obtained from the physical survey of physical-spatial characteristics of the dwellings studied, with the tool described above.
As regards urban services, only 78% of the dwellings had access to piped drinking water, while the rest had a water tank close to the house. In addition, 52% of the dwellings had access to a gas supply and the rest used wood or coal. Furthermore, only 74% of the dwellings had access to urban sanitation, while the remaining 26% had no access at all.
Regarding the physical conditions of the partition elements, 87% of the dwellings were built with cement blocks, but only 23% were finished off, while 8% incorporated recycled materials in their walls.
For the finishes of the dwelling floors, 26% had earth floors, 70% concrete, and 4% stone; 52% of the roofs were concrete, 39% sheet metal, and 11% recycled materials.
Next, we describe the results of evaluation and quantification of the level of satisfaction in socially disadvantaged housing.
The levels of housing-dimension aggregation were calculated, as were those on item dimension using the formulas from Phase 4 and the results obtained from the evaluation tool regarding the level of satisfaction in socially disadvantaged housing in the case study (see Appendix F).
The results of the evaluation of satisfaction of the different dimensions in the Vrs showed a dissatisfied (I) level of satisfaction for the spatial dimension, while the physical dimension and medium-sized urban environment were moderately satisfied (MS), and the social dimension was dissatisfied (I). The overall result was moderately satisfied (MS), as can be seen in Table 6a.
Table 6.
Result of the dissatisfaction value for the item-by-dimension segregation level.
The table shows the summary of results for the satisfaction evaluation of individual dimensions in the Vrs, as well as the weighted final value and the level of satisfaction in the two right hand columns.
The evaluation process was repeated using only indicators from bibliographical and institutional sources in order to compare the impact and contribution of this study to the methods traditionally used. The indicators obtained from the social research proposed in this study were excluded, and each dimension was evaluated again (Table 6b).
The comparison of results (Table 6) shows that the novelty of this study, as compared with earlier studies, is that it considers the particular situation of individual families. From the needs of the user in the first case, it is possible to observe a high level of social lag in social and spatial dimensions, while the level of satisfaction is moderately satisfied when considering only the state indicators. Despite the similar overall results, variations are observed among the data of the different dimensions. Thus, it is clear that social development programs at the federal, state, and municipal levels have carried out general analyses of the situation of socially disadvantaged housing, without delving further into the true needs of families, which can be identified following the methodology used in this research.
The importance of this study is that by including these new YES indicators, recommendations can be obtained to improve the satisfaction of the Vrs by study dimension. In turn, urban rehabilitation and regeneration policies designed are accepted by the user and alleviate the social lag (see Appendix G).
On the basis of the results, the programs defined are linked to the sample country and could meet the needs of the indicator guide, based on the results of the satisfaction assessment of Vrs.
Analysis of the programs of the sample country showed that these programs focus on the expansion and improvement of socially disadvantaged housing.
As these programs do not provide solutions for each indicator in deficit, it is necessary to follow procedures which sample users cannot carry out due to their lack of knowledge.
Furthermore, programs to improve the urban environment should clearly be carried out directly by the state or municipal government.
It was also observed that a person with the appropriate knowledge in this field was needed to explain to the users the necessary steps for achieving the objectives of housing improvement. The participation of other organizations and upper-secondary education was clearly needed with specialized social service actions to contribute to improving the conditions of habitability, health, and social integration and cohesion.
Thanks to the results obtained in all the phases of the methodology applied to the sample, it was possible to visualize the real physical and spatial conditions of the houses.
4. Conclusions and Discussion
One of the negative consequences for society worldwide, as a result of the current COVID-19 crisis, is that it has highlighted how its impact is greater in the more socially vulnerable and poorer neighborhoods of our cities. Overcrowding and increased stress during lockdowns, in spaces which are far from meeting the minimum habitability and hygiene conditions, have become a further concern to be added to the social dimension and the urban environment of these neighborhoods and the absence of public spaces or green areas for leisure. According to media reports, this has led to an increase in gender-based violence and has even affected mental health. This pandemic has emphasized the importance of social cohesion. Urban development and urban agendas should be at the center of public policies, taking into consideration the real needs of the user. Thus far, these have not been examined in similar studies, and therefore this research constitutes an innovation in the field of the creation and management of indicators for sustainable development of our cities. The quality of life and well-being in precarious housing has been greatly compromised by the lockdown situation during this global pandemic.
While international agendas have already warned of the need for urgent solutions within the 2030 sustainable development goals, it is now a pressing priority. This study provides a methodology which has proved its validity in a neighborhood in a precarious situation in Mexico, and which prior to the pandemic already had a high index (67%) of social vulnerability in housing. In fact, 67% of the almost 9.5 million Mexicans living in extreme poverty would represent 1.43 times more than the population of Madrid, Spain (6642.00 inhabitants).
Among endless potential solutions, this research has developed an alternative from observations of the needs and perceived deficits from the users of this type of housing. To the best of our knowledge, this has never before been taken into consideration with a response based on spatial needs and physical, social, and urban environments. This is combined with indicators identified through a painstaking analysis of national and international institutional and bibliographical sources linked to precarious housing. The ultimate goal is to provide the relevant guidelines for the reform of existing public policies with effective solutions to suit the real needs of the target users.
In this study, user satisfaction in socially disadvantaged housing was analyzed using indicators quantifying physical, spatial, environmental, and social aspects. Determining the shortcomings of this typology established a guide for urban rehabilitation and regeneration in the current situation and in emergency scenarios. The application of 51 indicators distributed in four previous parameters was established for this study.
The results of this study have identified the deficiencies of precarious housing in order to apply effective proposals to improve habitability and surroundings in the future.
One of the innovations of this study is the construction of a tool for social research surveys designed to include individual indicators from dwelling users, to provide a more dependable representation of the problems found in Vrs. One of the biggest contributions is social exploration based on the inclusion of the community, assessing the deficiencies in the characteristics of their own homes. Likewise, the evaluation of the level of satisfaction in socially disadvantaged housing, based on the evaluation by aggregation level, has allowed us to observe results both at the dimension level (spatial, physical, urban and social environments) and at the global level, as well as providing the satisfaction status of each dwelling by dimension.
This tool, built with the participation of a socially disadvantaged community and national-international global indicators, has the potential to analyze homes and user satisfaction anywhere. Likewise, the results of this study were compared with the results of the area studied by the CONEVAL evaluation commission of social development policies. In both cases, the results obtained indicated a degree of average satisfaction at the global level. At the same time, these results were compared with those which would be obtained if only the indicators specific to the local subsidies were applied. These results showed that, when all the indicators (bibliography, contributed by the technician and obtained from social research) were considered, the level of lag reached was similar to that of the real housing situation, further confirming the suitability of the methodology applied in this investigation.
However, a notable limitation of this study was the time needed to carry out the social research and the effort to explain the application of the surveys directly to the users, as continuous visits to the place of study were required.
The case study results highlighted the degree of dissatisfaction of socially disadvantaged housing for the different dimensions; the results showed a moderately dissatisfied value (high social lag) mainly in the spatial and physical dimension, followed by urban and social environments. These results are in keeping with the data obtained from the initial surveys where users reported green spaces as one of the most deficient aspects of their home environment, together with the relationship between spaces and their function within the dwelling.
This study concludes that the methodology, techniques, and procedures for evaluation, weighting, and valuation of indicators serve as an application guide for policies to rehabilitate precarious housing, both rural and urban.
This study serves as a basis for proposals for rehabilitation and improvement of social disadvantaged housing. It has considered a population that is living in and linked to the social fabric of a neighborhood, fully aware of their needs over time and with the same family development.
Socially lagging housing is a definition coined in housing policies in Mexico but also refers to precarious housing, which exists worldwide. The indicator guide can be applied anywhere in the world, not only in Mexico, based on the specific needs, customs, and culture of the place under study. There is a pressing need for policymakers to stop thinking collectively, that is, thinking that everyone requires the same solution either for political or financial convenience, as in the case of cities such as Malaga or Barcelona.
The study models reviewed in the state-of-the-art, authors, and procedures which have been widely referenced, are mostly weighted using multicriteria. This is based on the authors’ own experiences, and the procedures correspond to techniques by agreement. It should be noted that the result may be affected by the arbitrary assignment of the importance values to the study dimensions.
The evaluation of satisfaction in housing in social lag has been linked to the level of well-being and quality of life. These criteria are based on Abraham Maslow’s theory of motivation, presenting housing within the five levels to achieve self-realization. The state-of-the-art shows that some authors relate these three terms as if they were all the same, but satisfaction in this research refers specifically to habitability, to the housing envelope, and the relationship with its immediate environment, considering physical-spatial and social dimensions. While other studies analyze psychological aspects, which are valid of course, architecture itself deals with the psychological impact stemming from elements such as texture or color.
Author Contributions
Conceptualization, P.M.-M.; Data curation, P.M.-M.; Formal analysis, P.M.-M.; Funding acquisition, P.M.-M.; Investigation, P.M.-M. and O.M.-P.; Methodology, P.M.-M.; Resources, O.M.-P.; Software, O.M.-P.; Supervision, C.M.-G.; Writing–original draft, P.M.-M.; Writing-review & editing, C.M.-G. All authors performed the experiments. All authors analysed the data, and wrote, reviewed, and approved the final manuscript. All authors have read and agreed to the published version of the manuscript.
Funding
This work is part of the research project (reference no. 3719/0632) “Implementation of eco-efficient and urban health measures in the refurbishment of buildings and neighborhoods for the prescription of new products in the Construction Sector (Stage II)”, the University of Seville and was funded by MAPEI SPAIN, S.A; the paper was funded by UAT, support for publication costs, patents, and postdoctoral support of the Autonomy University of Tamaulipas, México; the study was funded by “Funding for the international mobility of a PhD student for the development of co-supervised thesis” (reference 2.2.3 (2018)).
Institutional Review Board Statement
The study was conducted according to the guidelines of the Declaration of Helsinki. All participants, were previously informed.
Informed Consent Statement
Informed consent was obtained from all subjects involved in the study.
Data Availability Statement
The data are not publicly available due to ethical reasons.
Acknowledgments
The authors would like to thank Jose Adán Espuna from the Autonomous University of Tamaulipas, Mexico, for his support in the research carried out.
Conflicts of Interest
The authors declare no conflict of interest.
Appendix A. Indicators Linked to Evaluation Methodologies of Previous Studies. Indicators of Social, Physical, Spatial and Urban Environment Dimension

Table A1.
Indicators of the social dimension.
Table A1.
Indicators of the social dimension.
| INDICATORS OF THE SOCIAL DIMENSION | Mod.1 | Mod.2 | Mod.3 | Mod.4 | Mod.5 | Mod.6 | Mod.7 | Mod.8 | Mod.9 | Mod.10 | Mod.11 | |
|---|---|---|---|---|---|---|---|---|---|---|---|---|
| 1 | Access to housing | |||||||||||
| 2 | Access to employment | |||||||||||
| 3 | Access to health service | |||||||||||
| 4 | Land tenure | |||||||||||
| 5 | Access to education | |||||||||||
| 6 | Pride of belonged to the neighbourhood | |||||||||||
| 7 | Outdoor activities | |||||||||||
| 8 | Access to public transport | |||||||||||
| 9 | Obtaining own achievements | |||||||||||
| 10 | Educational networks | |||||||||||
| 11 | Neighbourhood Organizations | |||||||||||
| 12 | Social movements | |||||||||||
| 13 | Religious | |||||||||||
| 14 | Professional organizations | |||||||||||
| 15 | Non-governmental organizations | |||||||||||
| 16 | Policies | |||||||||||
| 17 | Trade unions | |||||||||||
| 18 | Other | |||||||||||
| 19 | Language, culture, ethnicity | |||||||||||
| 20 | Internment | |||||||||||
| 21 | Special features | |||||||||||
| 22 | Other | |||||||||||
| 23 | Privacy | |||||||||||
| 24 | Rest areas | |||||||||||
| 25 | Family relationships | |||||||||||
| 26 | Separate animal-human environments | |||||||||||
| 27 | Hygiene | |||||||||||
| 28 | Security | |||||||||||
| 29 | Relationships with the community | |||||||||||
| 30 | Sense of community | |||||||||||
| 31 | Social cohesion | |||||||||||
| 32 | Efficiency of means of production | |||||||||||
| 33 | sustainable domestic life | |||||||||||
| 34 | respect for the sociocultural and ecological context | |||||||||||
| 35 | Social equity in the community and housing | |||||||||||
| 36 | Respect and conservation of customs | |||||||||||
| 37 | Planning of housing needs | |||||||||||
| 38 | Social Security | |||||||||||
| 39 | Support for agricultural production | |||||||||||
| 40 | Human well-being | |||||||||||
| 41 | Personal growth | |||||||||||
| 42 | Sense of affiliation | |||||||||||
| 43 | Sense of parting | |||||||||||
| 44 | Comfort | |||||||||||
| 45 | Aesthetic delight | |||||||||||
| 46 | Order | |||||||||||
| 47 | Tranquillity | |||||||||||
| 48 | Silence | |||||||||||
| 49 | Temperature | |||||||||||
| 50 | Light | |||||||||||
| 51 | Colour | |||||||||||
| 52 | Contrast | |||||||||||
| 53 | Identity | |||||||||||
| 54 | Status | |||||||||||
| 55 | Belonging | |||||||||||
| 56 | Uprooting | |||||||||||
| 57 | Spatial Provision | |||||||||||
| 58 | Communicability | |||||||||||
| 59 | Practicality | |||||||||||
| 60 | Effectiveness | |||||||||||
| 61 | Comfort | |||||||||||
| 62 | Amplitude | |||||||||||
| 63 | Dynamism | |||||||||||
| 64 | Adaptability | |||||||||||
| 65 | Displacement | |||||||||||
| 66 | ||||||||||||
| 69 | Interaction | |||||||||||
| 70 | Modulation | |||||||||||
| 71 | Neighbourhood Organization | |||||||||||
| 72 | Set perception | |||||||||||
| 73 | Social and community equipment | |||||||||||
| 74 | Perception of the city | |||||||||||
| 75 | Coexistence with the community | |||||||||||
| 76 | Illiterate population | |||||||||||
| 77 | Illiterate population that does not attend school | |||||||||||
| 78 | Population aged 15 to 29 with basic education | |||||||||||
| 79 | Population of 29 years or more with primary | |||||||||||
| 80 | Population without health services | |||||||||||
| 81 | Homes that do not have a refrigerator | |||||||||||
| 82 | Homes that do not have a washing machine | |||||||||||
| 83 | Average occupants per room | |||||||||||
| 84 | Unemployment | |||||||||||
| 85 | Young employees | |||||||||||
| 86 | Number of new patents / 100 thousand hab. | |||||||||||
| 87 | Poverty | |||||||||||
| 88 | Population with primary education / 100 thousand Ha | |||||||||||
| 89 | Fire / 100 thousand inhabitants | |||||||||||
| 90 | Deaths from disasters / 100,000 inhabitants | |||||||||||
| 91 | Number of emergency calls | |||||||||||
| 92 | Level of participation in municipal elections | |||||||||||
| 93 | % Of women elected in municipal positions | |||||||||||
| 94 | Index of convictions for corruption / 100 thousand hab. | |||||||||||
| 95 | % Of women employed by Gob. Municipal | |||||||||||
| 96 | Life expectancy rate | |||||||||||
| 97 | No. Of hospital beds / 100 Thousand Hab. | |||||||||||
| 98 | Mortality in children under 5 years / 100 born | |||||||||||
| 99 | Suicide rate / 100,000 inhabitants | |||||||||||
| 100 | Mental health professionals / 100Mil Hab. | |||||||||||
| 101 | M2 of open recreation space / person | |||||||||||
| 102 | M2 of closed recreation space / person | |||||||||||
| 103 | No. Of property crimes / 100Mil Hab. | |||||||||||
| 104 | Violent crimes / 100 Thousand Hab. | |||||||||||
| 105 | Emergency response time | |||||||||||
| 106 | % of poor people / 100 Thousand Hab. | |||||||||||
| 107 | No. of homes without legalization | |||||||||||
| 108 | You have green areas / 100 Thousand Hab. | |||||||||||
| 109 | No. Of jobs per home | |||||||||||
| 110 | Delivery and reception at the end of construction. | |||||||||||
| 111 | Delivery process and final adjustments. | |||||||||||
| 112 | Cost of energy, water and waste, cleaning | |||||||||||
| 113 | Rent and insurance cost | |||||||||||
| 114 | Initial cost of construction | |||||||||||
| 115 | Operating and maintenance costs | |||||||||||
| 116 | Amenities and amenities | |||||||||||
| 117 | Adaptability to changes due to rehabilitation | |||||||||||
| 118 | Tenure security level | |||||||||||
| 119 | % of regularized homes | |||||||||||
| 120 | % Of women and men who run a home | |||||||||||
| 121 | % of population able to read and write more than 15 | |||||||||||
| 122 | % of enrolment from primary to professional | |||||||||||
| 123 | Water price / 100 lts in Dlls in expensive season | |||||||||||
| 124 | Water consumption per day / hrs / inhabitant | |||||||||||
| 125 | Title of land, housing or both | |||||||||||
| 126 | Rental contract | |||||||||||
| 127 | Customary tenure | |||||||||||
| 128 | % Of men and women evicted the last. 10 years | |||||||||||
| 129 | % Of bosses and households who do not believe they are evicted | |||||||||||

The indicators are valued by four criteria: indicators linked to housing in social lag (Vrs), not representative, redundant and inaccurate. These are previously analyzed by their frequency and their relationship between them, to determine under the four criteria above the most appropriate to be part of the satisfaction assessment tool in Vrs.
Table A2.
Assessment for the selection of indicators.
Table A2.
Assessment for the selection of indicators.
| ASSESSMENT FOR THE SELECTION OF INDICATORS. | ||
|---|---|---|
| AVAILABILITY-RELIABILITY-QUALITY | COMPARISON FEATURE | |
| 1 | Linked to housing in social backwardness | Consistent, accessible, easily interpreted, applicable, feasible |
| 2 | Not representative | Not relevant for the research objectives. |
| 3 | Redundant | Repetitive data with others presented in the study models |
| 4 | Imprecise | There is no specific breakdown for your measurement |
| Indicator more frequently or that has a relationship with some other indicator | ||
Table A3.
Physical-space and urban environment indicators.
Table A3.
Physical-space and urban environment indicators.
| PHYSICAL-SPACE AND URBAN ENVIRONMENT INDICATORS. | Mod.1 | Mod.2 | Mod.3 | Mod.4 | Mod.5 | Mod.6 | Mod.7 | Mod.8 | Mod.9 | Mod.10 | Mod.11 | Mod.12 | Mod.13 | |
|---|---|---|---|---|---|---|---|---|---|---|---|---|---|---|
| Excreta disposal | ||||||||||||||
| 1 | Poet connected to sewer | |||||||||||||
| 2 | Poceta connected to septic tank | |||||||||||||
| 3 | Poceta offline | |||||||||||||
| 4 | Latrine | |||||||||||||
| 5 | It has no pot or well | |||||||||||||
| Rooms with shower | ||||||||||||||
| 6 | One to five | |||||||||||||
| Type of housing | ||||||||||||||
| 7 | Fifth or fifth house | |||||||||||||
| 8 | Home | |||||||||||||
| 9 | Ranch | |||||||||||||
| 10 | Refuge | |||||||||||||
| 11 | Other class | |||||||||||||
| Materials in walls | ||||||||||||||
| 12 | Block or brick | |||||||||||||
| 13 | unframed block or brick | |||||||||||||
| 14 | Sawn timber | |||||||||||||
| 15 | Adobe, tapia bahareque frisado | |||||||||||||
| 16 | Adobe, wall, barefrisk | |||||||||||||
| 17 | Palms, boards or similar | |||||||||||||
| 18 | Cement or concrete | |||||||||||||
| 19 | Flooring materials | |||||||||||||
| 20 | Marble, mosaic, granite | |||||||||||||
| Flooring materials | ||||||||||||||
| 21 | Marble, mosaic, granite | |||||||||||||
| 22 | Cement or concrete | |||||||||||||
| 23 | land | |||||||||||||
| 24 | Others | |||||||||||||
| Roofing Materials | ||||||||||||||
| 25 | Platabanda | |||||||||||||
| 26 | Roof tiles | |||||||||||||
| 27 | Asphalt sheet | |||||||||||||
| 28 | Metal sheet | |||||||||||||
| 29 | Palm, board or similar | |||||||||||||
| 30 | Other class | |||||||||||||
| Number of rooms | ||||||||||||||
| 31 | One to five | |||||||||||||
| 32 | Has | |||||||||||||
| 33 | Does not have | |||||||||||||
| Water supply | ||||||||||||||
| 34 | Aqueduct or pipe | |||||||||||||
| 35 | Public battery or pond | |||||||||||||
| 36 | Well with pipe or pump | |||||||||||||
| 37 | Well or protected spring | |||||||||||||
| 38 | Others | |||||||||||||
| 39 | Cooking fuel | |||||||||||||
| 40 | Gas | |||||||||||||
| 41 | Electricity | |||||||||||||
| 42 | Kerosene | |||||||||||||
| 43 | Firewood or carbon | |||||||||||||
| 44 | Infrastructure (From bad to very good. 5 levels) | |||||||||||||
| 45 | Allegation (From bad to very good. 5 levels) | |||||||||||||
| 46 | Overcrowding (From bad to very good. 5 levels) | |||||||||||||
| 47 | Community equipment (from bad to very good) | |||||||||||||
| 48 | Expansion space (from bad to very good) | |||||||||||||
| 49 | Overcrowding (5 levels) | |||||||||||||
| Space | ||||||||||||||
| 50 | Number of bedrooms | |||||||||||||
| 51 | housing surface | |||||||||||||
| 52 | Number of bathrooms | |||||||||||||
| 53 | parking drawers | |||||||||||||
| Shape | ||||||||||||||
| 54 | Ground surface | |||||||||||||
| 55 | Number of floors | |||||||||||||
| Overcrowding | ||||||||||||||
| 56 | Inhabitants / Bedrooms | |||||||||||||
| Service | ||||||||||||||
| 167 | Building Cleaning | |||||||||||||
| 168 | Building Security | |||||||||||||
| Operational management | ||||||||||||||
| 169 | Temperature | |||||||||||||
| 170 | ventilation | |||||||||||||
| 171 | Acoustics | |||||||||||||
| Physical systems | ||||||||||||||
| 172 | Illumination | |||||||||||||
| 173 | Air conditioner | |||||||||||||
| 174 | Durability | |||||||||||||
| Durable structures | ||||||||||||||
| 175 | Durable structure outside risk zone | |||||||||||||
| Access to safe water | ||||||||||||||
| 176 | % Housing with drinking water | |||||||||||||
| 177 | % Solid waste landfills | |||||||||||||
| 178 | % Closed solid waste | |||||||||||||
| 179 | % Solid waste landfill | |||||||||||||
| Home Connections | ||||||||||||||
| 180 | % Of homes connected to drinking water | |||||||||||||
| 181 | % Of homes connected to the sewer | |||||||||||||
| 182 | % Of homes connected to electricity | |||||||||||||
| 183 | % Of homes connected to the phone | |||||||||||||
| Risk areas | ||||||||||||||
| 184 | % of population subject to risk areas | |||||||||||||
| 185 | Transportation time in round trip minutes | |||||||||||||
| Access to drinking water | ||||||||||||||
| 186 | % Of people with connection to drinking water | |||||||||||||
| 187 | % of homes with a shared tap max 2 | |||||||||||||
| 188 | Access to water from other sources | |||||||||||||
| Access to basic sanitation | ||||||||||||||
| 189 | % Of population connected to the drainage service | |||||||||||||
| 190 | % Of population connected to a septic tank | |||||||||||||
| 191 | % Of connected to a latrine with connection | |||||||||||||
| 192 | % Of connected to a non-public latrine | |||||||||||||
| Housing durability | ||||||||||||||
| 193 | Construction quality in flooring materials | |||||||||||||
| 194 | Construction quality in wall materials | |||||||||||||
| 195 | Construction quality in roofing materials | |||||||||||||
| Enough area to live | ||||||||||||||
| 196 | % Of homes with at least 3 per room | |||||||||||||
| 197 | Quality and spaces in the house | |||||||||||||
| 198 | % of houses with dirt floor | |||||||||||||
| 199 | Average number of occupants per room | |||||||||||||
| 200 | Basic housing services | |||||||||||||
| 201 | Unexcused homes | |||||||||||||
| 202 | Housing without connection to drinking water | |||||||||||||
| 203 | Homes without connection to sanitary sewer | |||||||||||||
| 204 | Housing without connection to electricity | |||||||||||||
Appendix B. Data Collection Instrument for Social Exploration on Indicators. This Questionnaire Presents Existing Indicators Related to Socially Lagging Housing
Table A4.
Data collection instrument for social exploration on indicators.
Table A4.
Data collection instrument for social exploration on indicators.
| A series of characteristics that your home has or should have is presented as a list, mark with an X the degree of deficit that you find in the home that you and your family live in, or if the appearance is appropriate. In the second part, check the box with an X after reflecting your answer | |||
| SOCIAL COMPONENT TO EVALUATE BY HEAD OF FAMILY | |||
| NUMBER: | Informant Name: | ||
| BETWEEN STREETS: | |||
| COORDINATES: | Date: | ||
| TOPOGRAPHY: | |||
| INDICATORS | NEEDS FOR YOUR SATISFACTION | ||
| ASPECTS SATISFACTORY TO EVALUATE WITH RESPECT | SUITABLE | DEFICITARY VERY | DEFICITARY |
| SPACE DIMENSION | |||
| ROOMS / INHABITANTS RELATIONSHIP | |||
| WINDOW VENTILATION | |||
| SOLAR LIGHTING | |||
| RELATIONSHIP OF SPACES AND THEIR FUNCTION | |||
| KITCHEN SPACE | |||
| PARKING AREA | |||
| GARDEN AREA | |||
| PHYSICAL DIMENSION | |||
| ACCESS TO SANITARY DRAINAGE | |||
| ACCESS TO ELECTRICAL ENERGY | |||
| ACCESS TO DRINKING WATER BY CONNECTION | |||
| ACCESS TO A GAS INSTALLATION | |||
| FINISHES IN WALLS | |||
| FINISHES IN FLOORS | |||
| COVERED AS PROTECTION FOR INCLEMENCIES | |||
| URBAN ENVIRONMENT | |||
| ACCESS TO PUBLIC LIGHTING | |||
| BANQUETS | |||
| PRE-SCHOOL | |||
| PRIMARY SCHOOL | |||
| CLINIC | |||
| COMMERCIAL AREA | |||
| SPREADING (GAME AREAS, ETC COURTS) | |||
| ACCESS TO GREEN AREAS | |||
| ACCESS TO PUBLIC TRANSPORTATION | |||
| SOCIAL DIMENSION | EVALUATION OF SOCIAL CONDITIONS | ||
| YES | NO | ||
| HAS NEIGHBORHOOD PARTICIPATION | |||
| PARTICIPATE IN SOCIAL MOVEMENTS | |||
| PARTICIPATE IN CLEANING AND MAINTENANCE BRICKS | |||
| PARTICIPATE IN EDUCATIONAL NETWORKS OF ANY KIND | |||
| EASILY ACCESS TO TRANSPORT | |||
| HAVE A GOOD PERCEPTION OF THE COLONY (SECURITY) | |||
| YOUR CHILDREN GO TO SCHOOL IN THE COLONY | |||
| ACCOUNT WITH SOME NEAR HEALTH CENTER | |||
| YOU HAVE ACCESS TO GARDENS, COURTS, OR OTHER | |||
| FEEL ROOTED TO YOUR NEIGHBORHOOD (FOR THE TIME IT LEADS) | |||
| FEEL IDENTIFIED WITH YOUR NEIGHBORHOOD (PROUD) | |||
Appendix C. Instrument for Data Collection of Physical-Spatial and Urban Environment Characteristics for Sample Units
Table A5.
Instrument for data collection of physical-spatial and urban environment characteristics.
Table A5.
Instrument for data collection of physical-spatial and urban environment characteristics.
| HOUSING NUMBER | Regular Lot Irregular: | Photography Direction: Head of the family | ||||||
| SQUARE | Measures: Coordinates | |||||||
| Housing spaces and occupational structure | Physical, spatial and urban environment characteristics of housing | |||||||
 | Existed | FLOOR | WALLS | ROOF | DOOR/WINDOWS | |||
| Garage | ||||||||
| Yard | ||||||||
| Room | ||||||||
| Dining room | ||||||||
| Kitchen | ||||||||
| Bath. inside | ||||||||
| Shared bathroom | ||||||||
| Occupants / no. Bedrooms | ||||||||
| Cto. Round | ||||||||
| Serv patio | ||||||||
| Space for extension | ||||||||
| Infrastructure and urban environment | ||||||||
| Drain connection | ||||||||
| Drinking water connection | ||||||||
| Cooking fuel | ||||||||
| Distance to transport | ||||||||
| Observation | ||||||||
| Physical, spatial and urban environment characteristics: | ||||||||
| 1 Connection to municipal sanitary sewer network | 13 block walls seated with mortar | 25 Concrete Deck | ||||||
| 2 Sanitary sewer connection to septic tank | 14 stacked block or partition walls | 26 Laminate cover | ||||||
| 3 Use of latrine with drain connection | 15 Walls with any type of coating | 27 Wood and tile roof | ||||||
| 4 Use of latrine with septic tank | 16 adobe walls | 28 Mixed deck | ||||||
| 5 Connection to municipal drinking water network | 17 Stone walls seated with mortar | 29 Palm cover | ||||||
| 6 Access to drinking water by community well | 18 stacked stone walls | 30 Cover with recycling materials | ||||||
| 7 Access to drinking water by auto-tank distribution | 19 Wall of recycled material (laminate, wood | 31 It has a service patio | ||||||
| 8 Access to rainwater | 20 Mixed Composition Walls | 32 Urban transport distance | ||||||
| 9 Access to drinking water by cistern or public battery | 21 Ground floors | 33 Paved Roads | ||||||
| 10 Access to gas l.p for cooking | 22 cement floors | 34 Roads in dirt roads | ||||||
| 11 Access to firewood for cooking | 23 ceramic floors | |||||||
| 12 red partition walls seated with mortar | 24 floors with tile or stone | |||||||
Appendix D. Survey Instrument Used in the Model of Evaluation of Indicators for the Evaluation of Housing Satisfaction in Social Lag
Table A6.
Survey instrument used in the model of evaluation of indicators.
Table A6.
Survey instrument used in the model of evaluation of indicators.
| Please read carefully each aspect that you have or should have your home, marking with a line the most important box according to the need of you and your family |  | |||||
| INDICATORS TO EVALUATE | ||||||
| STREET: TEPEYAC | ||||||
| NUMBER: WITHOUT NUMBER HOUSING COUNT: 21 | ||||||
| BETWEEN STREETS: CALLEJON DE TEPEYAC AND SAN NICOLAS | ||||||
| COORDINATES: | ||||||
| TOPOGRAPHY: ACCIDENTED | ||||||
| INDICATORS | SATISFACTION FROM NEEDS | |||||
| INFORMATOR NAME: Sr. Antonio Garcia Reyes | Do you think it is necessary to increase the satisfaction of you and your family considering in your home? | |||||
| Indicator code | SATISFACTING ASPECTS TO EVALUATE REGARDING THE SPACE, PHYSICAL, URBAN AND SOCIAL ENVIRONMENT | Completely unnecessary | Little necessary | Medium necessary | Necessary | Very necessary |
| SPACE DIMENSION | ||||||
| 0 | Sun lighting inside the house | |||||
| 169 | Window ventilation inside the house | |||||
| 195 | Separate spaces between bedrooms and other housing | |||||
| 135 | Living space | |||||
| 0 | Dining space | |||||
| 145 | Pedestrian access to your home | |||||
| 45 | Space for extension | |||||
| 0 | Garden area in the house | |||||
| PHYSICAL DIMENSION | ||||||
| 1 | Sanitary drainage connection to municipal network | |||||
| 5 | Connection to municipal drinking water network | |||||
| 0 | Other means of drinking water supply | |||||
| 32 | Mains connection | |||||
| 103 | Access to gas for cooking | |||||
| 134 | Use of water and electricity saving systems system | |||||
| 0 | Use of water heater | |||||
| 0 | Drinking water container (Tinaco) | |||||
| 0 | Bathroom with shower | |||||
| 0 | Toilet with toilet | |||||
| 0 | Bathroom inside the house | |||||
| 0 | Kitchen sink | |||||
| 0 | Suitable doors. | |||||
| 0 | Suitable windows | |||||
| 0 | Laundry in service yard | |||||
| 0 | Wall coverings | |||||
| 0 | Floor coverings | |||||
| 0 | Roof Coatings | |||||
| 0 | Fourth extra bedroom | |||||
| URBAN ENVIRONMENT DIMENSION | ||||||
| 159 | Green areas in the neighbourhood | |||||
| 0 | Playground in the neighbourhood | |||||
| 151 | Area for sports in the neighbourhood | |||||
| 114 | Sidewalks | |||||
| 68 | Commercial area | |||||
| 60 | Paved roads | |||||
| 70 | church | |||||
| 67 | Basic Education School | |||||
| 0 | Community medical care | |||||
| 66 | Waste collection | |||||
| 65 | Guardhouse | |||||
| 64 | Street lighting | |||||
| 72 | Nearby transport | |||||
| SOCIAL DIMENSION | E S C A L A D I C O T O M I C A | |||||
| YES | NO | |||||
| 0 | Perceive Security in the colony | |||||
| 10 | Has access to educational networks children and adults | |||||
| 11 | neighbourhood organization and participation | |||||
| 3 | You have access to community health service | |||||
| 5 | Has access to basic education schools | |||||
| 101 | Has access to recreation and recreation spaces | |||||
| 8 | You have access to public transport | |||||
| 26 | It has separate animal-human environments | |||||
| 24 | You have rest in your home | |||||
| 83 | There are more than 2 occupants per room in your home | |||||
| 4 | Land tenure (Deed or in process) | |||||
Appendix E. Results on Social, Physical-Spatial and Environmental Indicators Based on Ethnographic Exploration Based on a Survey Aimed at the Inhabitants of the Study Housing
Table A7.
Results for housing tricotomic scale survey.
Table A7.
Results for housing tricotomic scale survey.
| INDICADORES DE DIMENSION ESPACIAL | RESULTS FOR HOUSING TRICOTOMIC SCALE SURVEY | ||||||||||||||||||||||||||||||||||||||||||||||||||||||||
| 1 | 2 | 3 | 4 | 5 | 6 | 7 | 8 | 9 | 10 | 11 | 12 | 13 | 14 | 15 | 16 | 17 | 18 | 19 | 20 | 21 | 22 | 23 | Homes under study | ||||||||||||||||||||||||||||||||||
| DIMENSION ESPACIAL | |||||||||||||||||||||||||||||||||||||||||||||||||||||||||
| BEDROOM | 1 | 3 | 1 | 2 | 3 | 1 | 1 | 2 | 3 | 1 | 3 | 2 | 2 | 1 | 1 | 1 | 2 | 2 | 1 | 1 | 1 | 1 | 1 | 1 | Very lacking | ||||||||||||||||||||||||||||||||
| VENTILATION/ WINDOWS | 3 | 3 | 3 | 3 | 3 | 2 | 1 | 3 | 3 | 3 | 3 | 3 | 3 | 1 | 1 | 3 | 3 | 3 | 3 | 1 | 1 | 1 | 3 | 2 | Deficient | ||||||||||||||||||||||||||||||||
| SOLAR LIGHTING | 3 | 2 | 3 | 2 | 3 | 2 | 1 | 3 | 1 | 3 | 3 | 3 | 3 | 1 | 1 | 3 | 3 | 3 | 3 | 1 | 1 | 1 | 3 | 3 | Suitable | ||||||||||||||||||||||||||||||||
| SPACE RELATIONSHIP-FUNCTION | 1 | 2 | 3 | 2 | 3 | 1 | 1 | 1 | 1 | 3 | 2 | 1 | 1 | 1 | 1 | 1 | 2 | 1 | 1 | 1 | 1 | 1 | 1 | ||||||||||||||||||||||||||||||||||
| KITCHEN | 2 | 3 | 1 | 1 | 3 | 3 | 2 | 1 | 1 | 3 | 3 | 3 | 2 | 1 | 1 | 3 | 2 | 1 | 1 | 1 | 1 | 1 | 1 | ||||||||||||||||||||||||||||||||||
| GARAGE | 2 | 3 | 1 | 3 | 1 | 1 | 3 | 2 | 3 | 1 | 3 | 3 | 3 | 1 | 3 | 3 | 1 | 1 | 1 | 1 | 3 | 1 | 1 | ||||||||||||||||||||||||||||||||||
| JARDEN | 2 | 1 | 1 | 2 | 2 | 1 | 1 | 1 | 1 | 1 | 1 | 1 | 1 | 1 | 1 | 3 | 1 | 1 | 1 | 1 | 2 | 1 | 1 | ||||||||||||||||||||||||||||||||||
| What aspects within your home regarding its structure, spaces and equipment would you consider that would improve the well-being of your family? | Indicators according to social exploration results | ||||||||||||||||||||||||||||||||||||||||||||||||||||||||
| 1 | Bathroom with shower and toilet bowl | 13 | Bathroom with shower and toilet | Bathroom with shower | |||||||||||||||||||||||||||||||||||||||||||||||||||||
| 2 | Watering can and toilet for the bathroom | 14 | Watering can and windows | Toilet with toilet | |||||||||||||||||||||||||||||||||||||||||||||||||||||
| 3 | Sink and a quarter more | 15 | Sink, toilet, windows and shower | Kitchen area with sink | |||||||||||||||||||||||||||||||||||||||||||||||||||||
| 4 | 16 | A quarter more | Suitable doors and windows | ||||||||||||||||||||||||||||||||||||||||||||||||||||||
| 5 | Watering can and toilet for the bathroom | 17 | A quarter more | ||||||||||||||||||||||||||||||||||||||||||||||||||||||
| 6 | A quarter more | 18 | Sink, toilet and shower | ||||||||||||||||||||||||||||||||||||||||||||||||||||||
| 7 | A quarter more | 19 | One more room, sink, toilet, doors and windows | ||||||||||||||||||||||||||||||||||||||||||||||||||||||
| 8 | Put glass on the windows, toilet and shower | 20 | sink, toilet and shower | ||||||||||||||||||||||||||||||||||||||||||||||||||||||
| 9 | Toilet with cup and watering can | 21 | Suitable windows and doors | ||||||||||||||||||||||||||||||||||||||||||||||||||||||
| 10 | Wider windows, toilet and shower | 22 | Sink, toilet and shower | ||||||||||||||||||||||||||||||||||||||||||||||||||||||
| 11 | A quarter more | 23 | Toilet, shower, laundry | ||||||||||||||||||||||||||||||||||||||||||||||||||||||
| 12 | Bathroom with shower and toilet | ||||||||||||||||||||||||||||||||||||||||||||||||||||||||
| PHYSICAL DIMENSION INDICATORS | RESULTS FOR HOUSING TRICOTOMIC SCALE SURVEY | ||||||||||||||||||||||||||||||||||||||||||||||||||||||||
| 1 | 2 | 3 | 4 | 5 | 6 | 7 | 8 | 9 | 10 | 11 | 12 | 13 | 14 | 15 | 16 | 17 | 18 | 19 | 20 | 21 | 22 | 23 | Homes under study | ||||||||||||||||||||||||||||||||||
| SANITARY DRAINAGE | 3 | 3 | 3 | 3 | 3 | 3 | 3 | 3 | 3 | 3 | 3 | 3 | 1 | 3 | 1 | 3 | 3 | 3 | 3 | 1 | 3 | 3 | 3 | 1 | Very lacking | ||||||||||||||||||||||||||||||||
| INST. ELECTRICAL | 3 | 3 | 3 | 3 | 3 | 3 | 3 | 3 | 3 | 3 | 3 | 3 | 3 | 3 | 1 | 3 | 3 | 3 | 3 | 1 | 3 | 3 | 3 | 2 | Deficient | ||||||||||||||||||||||||||||||||
| INST. OF WATER | 2 | 2 | 3 | 3 | 3 | 3 | 3 | 3 | 3 | 3 | 3 | 3 | 1 | 1 | 1 | 3 | 3 | 3 | 3 | 1 | 3 | 3 | 3 | 3 | Suitable | ||||||||||||||||||||||||||||||||
| INST. OF GAS | 2 | 3 | 1 | 1 | 2 | 2 | 3 | 3 | 3 | 3 | 3 | 3 | 1 | 1 | 3 | 3 | 3 | 1 | 1 | 1 | 3 | 1 | 1 | ||||||||||||||||||||||||||||||||||
| FINISHES IN WALLS | 1 | 1 | 3 | 3 | 1 | 1 | 2 | 2 | 1 | 2 | 3 | 3 | 1 | 2 | 1 | 2 | 2 | 1 | 1 | 1 | 1 | 1 | 1 | ||||||||||||||||||||||||||||||||||
| FINISHES IN FLOORS | 1 | 1 | 3 | 3 | 1 | 1 | 2 | 1 | 1 | 2 | 3 | 3 | 1 | 2 | 1 | 2 | 2 | 1 | 1 | 1 | 1 | 1 | 1 | ||||||||||||||||||||||||||||||||||
| FINISHES IN COVERS | 1 | 1 | 3 | 3 | 1 | 1 | 2 | 1 | 1 | 2 | 3 | 3 | 1 | 2 | 1 | 2 | 2 | 1 | 1 | 1 | 1 | 1 | 1 | ||||||||||||||||||||||||||||||||||
| What aspects within your home regarding its structure, spaces and equipment would you consider that would improve the well-being of your family? | Indicators according to social exploration results | ||||||||||||||||||||||||||||||||||||||||||||||||||||||||
| 1 | Flattened walls and paint, water heater | 13 Water heater | Water heater | ||||||||||||||||||||||||||||||||||||||||||||||||||||||
| 2 | Tile floor | 14 Water heater and water tank | Drinking water container | ||||||||||||||||||||||||||||||||||||||||||||||||||||||
| 3 | Water heater | 15 Concrete tile and slab floor | Water heater | ||||||||||||||||||||||||||||||||||||||||||||||||||||||
| 4 | Tinaco and water heater | 16 Water tank and water heater17 Water heater | Drinking water container | ||||||||||||||||||||||||||||||||||||||||||||||||||||||
| 5 | Flattened walls, water heater and water tank | 17 Water heater | |||||||||||||||||||||||||||||||||||||||||||||||||||||||
| 6 | Water heater and flattened walls | 18 Water heater and water tank | |||||||||||||||||||||||||||||||||||||||||||||||||||||||
| 7 | Water heater and water tank | 19 Flattened walls and floor tile, heater and water tank | |||||||||||||||||||||||||||||||||||||||||||||||||||||||
| 8 | Water heater and water tank | 20 concrete slab, water heater and water tank | |||||||||||||||||||||||||||||||||||||||||||||||||||||||
| 9 | Wall finishes | 21 Concrete slab, water heater and water tank | |||||||||||||||||||||||||||||||||||||||||||||||||||||||
| 10 | Tinaco and water heater | 22 Tinaco, water heater and flattened | |||||||||||||||||||||||||||||||||||||||||||||||||||||||
| 11 | Water heater | 23 Water tank and water heater | |||||||||||||||||||||||||||||||||||||||||||||||||||||||
| 12 | Flattened walls and paint, water heater | ||||||||||||||||||||||||||||||||||||||||||||||||||||||||
| URBAN DIMENSION INDICATORS | RESULTS FOR HOUSING TRICOTOMIC SCALE SURVEY | ||||||||||||||||||||||||||||||||||||||||||||||||||||||||
| 1 | 2 | 3 | 4 | 5 | 6 | 7 | 8 | 9 | 10 | 11 | 12 | 13 | 14 | 15 | 16 | 17 | 18 | 19 | 20 | 21 | 22 | 23 | Homes under study | ||||||||||||||||||||||||||||||||||
| STREET LIGHTING | 3 | 3 | 3 | 3 | 3 | 3 | 3 | 3 | 2 | 2 | 3 | 3 | 3 | 3 | 3 | 3 | 3 | 3 | 3 | 3 | 3 | 3 | 3 | 1 | Very lacking | ||||||||||||||||||||||||||||||||
| SIDEWALK | 2 | 3 | 3 | 3 | 3 | 3 | 3 | 3 | 2 | 2 | 2 | 3 | 3 | 3 | 3 | 3 | 3 | 3 | 3 | 3 | 3 | 3 | 2 | 2 | Deficient | ||||||||||||||||||||||||||||||||
| PRE-SCHOOL | 3 | 3 | 3 | 3 | 3 | 3 | 3 | 3 | 3 | 3 | 3 | 3 | 3 | 3 | 3 | 3 | 3 | 3 | 3 | 3 | 3 | 3 | 3 | 3 | Suitable | ||||||||||||||||||||||||||||||||
| PRIMARY SCHOOL | 3 | 3 | 3 | 3 | 3 | 3 | 3 | 3 | 3 | 3 | 3 | 3 | 3 | 3 | 3 | 3 | 3 | 3 | 3 | 3 | 3 | 3 | 3 | ||||||||||||||||||||||||||||||||||
| COMMUNITY MEDICAL CARE | 3 | 3 | 3 | 3 | 3 | 3 | 3 | 3 | 3 | 3 | 3 | 3 | 3 | 3 | 3 | 3 | 3 | 3 | 3 | 3 | 3 | 3 | 3 | ||||||||||||||||||||||||||||||||||
| MARKET | 1 | 1 | 2 | 1 | 1 | 1 | 1 | 1 | 1 | 2 | 1 | 1 | 1 | 1 | 1 | 3 | 1 | 2 | 2 | 1 | 1 | 1 | 2 | ||||||||||||||||||||||||||||||||||
| COMMERCIAL AREA | 1 | 1 | 1 | 1 | 1 | 1 | 1 | 1 | 1 | 1 | 1 | 1 | 1 | 1 | 1 | 3 | 1 | 2 | 1 | 1 | 1 | 2 | 2 | ||||||||||||||||||||||||||||||||||
| RECREATION (GAME AREAS) | 1 | 1 | 1 | 1 | 1 | 1 | 1 | 1 | 1 | 1 | 1 | 1 | 1 | 1 | 1 | 2 | 1 | 1 | 1 | 1 | 1 | 2 | 2 | ||||||||||||||||||||||||||||||||||
| What aspects of the neighbourhood do you think would improve the satisfaction and well-being of your family in terms of equipment? | Indicators according to social exploration results | ||||||||||||||||||||||||||||||||||||||||||||||||||||||||
| 1 | A market and green areas | 13 Green Areas | Green areas | ||||||||||||||||||||||||||||||||||||||||||||||||||||||
| 2 | Playground, green areas | 14 Market and green areas | Sports area | ||||||||||||||||||||||||||||||||||||||||||||||||||||||
| 3 | Green areas and sports fields | 15 sports fields and green areas | Playground for children | ||||||||||||||||||||||||||||||||||||||||||||||||||||||
| 4 | Green areas and sports fields | 16 children’s play areas and sports courts | green areas | ||||||||||||||||||||||||||||||||||||||||||||||||||||||
| 5 | Green areas and playgrounds | 17 green areas and playgrounds | |||||||||||||||||||||||||||||||||||||||||||||||||||||||
| 6 | Paint on garnishes, green areas | 18 sports fields and green areas | |||||||||||||||||||||||||||||||||||||||||||||||||||||||
| 7 | Sports courts and playgrounds | 19 Children’s play area and green areas | |||||||||||||||||||||||||||||||||||||||||||||||||||||||
| 8 | green areas | 20 Courts and green areas | |||||||||||||||||||||||||||||||||||||||||||||||||||||||
| 9 | Children’s games and sports courts | 21 Best conditions on sidewalks | |||||||||||||||||||||||||||||||||||||||||||||||||||||||
| 10 | Common parking and green areas | 22 sports fields and green areas | |||||||||||||||||||||||||||||||||||||||||||||||||||||||
| 11 | Sports courts and green areas | 23 Children’s play area and green areas | |||||||||||||||||||||||||||||||||||||||||||||||||||||||
| 12 | Security booth and green areas | ||||||||||||||||||||||||||||||||||||||||||||||||||||||||
| SOCIAL DIMENSION INDICATORS | RESULTS FOR HOUSING DICOTOMIC SCALE SURVEY | ||||||||||||||||||||||||||||||||||||||||||||||||||||||||
| 1 | 2 | 3 | 4 | 5 | 6 | 7 | 8 | 9 | 10 | 11 | 12 | 13 | 14 | 15 | 16 | 17 | 18 | 19 | 20 | 21 | 22 | 23 | Homes under study | ||||||||||||||||||||||||||||||||||
| PARTICIPATION IN SOCIAL MOVEMENTS | 1 | YES | |||||||||||||||||||||||||||||||||||||||||||||||||||||||
| PARTICIPATION IN COMMUNITY SUPPORT BRICKS | 2 | NO | |||||||||||||||||||||||||||||||||||||||||||||||||||||||
| ACCESS CHILDREN AND / OR ADULT EDUCATIONAL NETWORKS | |||||||||||||||||||||||||||||||||||||||||||||||||||||||||
| ACCESS TO PUBLIC TRANSPORTATION | |||||||||||||||||||||||||||||||||||||||||||||||||||||||||
| SECURITY, RELATIONS (PERCEPTION OF THE COLONY) | |||||||||||||||||||||||||||||||||||||||||||||||||||||||||
| YOUR CHILDREN GO TO SCHOOL IN THE COLONY | |||||||||||||||||||||||||||||||||||||||||||||||||||||||||
| ACCOUNT WITH SOME NEAR HEALTH CENTER | |||||||||||||||||||||||||||||||||||||||||||||||||||||||||
| YOU HAVE ACCESS TO GARDENS, COURTS, OR OTHER | |||||||||||||||||||||||||||||||||||||||||||||||||||||||||
| FEEL ROOTED TO YOUR NEIGHBORHOOD (FOR THE TIME IT LEADS) | |||||||||||||||||||||||||||||||||||||||||||||||||||||||||
| FEEL IT BELONGS TO THE NEIGHBORHOOD | |||||||||||||||||||||||||||||||||||||||||||||||||||||||||
| FEEL IDENTIFIED WITH YOUR NEIGHBORHOOD (PROUD) | |||||||||||||||||||||||||||||||||||||||||||||||||||||||||
| What aspects of the neighbourhood do you think would improve your family’s satisfaction and well-being in terms of equipment? | Indicators according to social exploration results | ||||||||||||||||||||||||||||||||||||||||||||||||||||||||
| 1 | That people participate in community tasks | Community participation | |||||||||||||||||||||||||||||||||||||||||||||||||||||||
| 2 | That transport be closer | ||||||||||||||||||||||||||||||||||||||||||||||||||||||||
| 3 | Best organization to do community work | Distance accessible transport | |||||||||||||||||||||||||||||||||||||||||||||||||||||||
| 4 | That people participate in community tasks | ||||||||||||||||||||||||||||||||||||||||||||||||||||||||
| 5 | That people participate in community tasks | ||||||||||||||||||||||||||||||||||||||||||||||||||||||||
| 6 | That people participate in community tasks | ||||||||||||||||||||||||||||||||||||||||||||||||||||||||
| 7 | That people participate in community tasks | ||||||||||||||||||||||||||||||||||||||||||||||||||||||||
| 8 | That people participate in community tasks | ||||||||||||||||||||||||||||||||||||||||||||||||||||||||
| 9 | That the transport was closer | ||||||||||||||||||||||||||||||||||||||||||||||||||||||||
| 10 | That the transport was closer | ||||||||||||||||||||||||||||||||||||||||||||||||||||||||
| 11 | That people participate in community tasks | ||||||||||||||||||||||||||||||||||||||||||||||||||||||||
| 12 | That the transport was closer | ||||||||||||||||||||||||||||||||||||||||||||||||||||||||
Appendix F. Results Obtained in the Application of the Survey Described in the Previous Points Consisting in the Issuance of Responses of the Heads of Household of the Dwelling under Study Based on the Indicators of the System of Evaluation of the Level of Satisfaction in Housing in Social Lag in Five Categories of Possible Answers (1: Unnecessary, 2: Little Necessary, 3: Moderately 4: Necessary and 5: Very Necessary). In the Case of Social Dimension, Two Categories of Possible Answers (Yes, No)
Table A8.
Results obtained in the application of the survey described in the previous points consisting in the issuance of responses of the heads of household of the dwelling under study based on the indicators of the system of evaluation of the level of satisfaction in Vrs.
Table A8.
Results obtained in the application of the survey described in the previous points consisting in the issuance of responses of the heads of household of the dwelling under study based on the indicators of the system of evaluation of the level of satisfaction in Vrs.
| DIMENSIONS AND INDICATORS | SPACE CHARACTERISTICS | |||||||||||||||||||||||
| 1 | 2 | 3 | 4 | 5 | 6 | 7 | 8 | 9 | 10 | 11 | 12 | 13 | 14 | 15 | 16 | 17 | 18 | 19 | 20 | 21 | 22 | 23 | ||
| Code | DIMENSION ESPACIAL | PREVIOUS RESULTS | ||||||||||||||||||||||
| 0 | Window ventilation inside the house | 3 | 3 | 3 | 4 | 2 | 4 | 5 | 3 | 2 | 2 | 2 | 1 | 1 | 5 | 5 | 2 | 2 | 1 | 3 | 5 | 5 | 5 | 3 |
| 169 | Sun lighting inside the house | 3 | 4 | 2 | 4 | 2 | 4 | 5 | 2 | 5 | 2 | 2 | 2 | 1 | 5 | 5 | 2 | 2 | 1 | 3 | 5 | 5 | 5 | 3 |
| 195 | Separate spaces between bedrooms and other housing | 5 | 4 | 2 | 4 | 1 | 5 | 5 | 5 | 5 | 2 | 4 | 5 | 5 | 5 | 5 | 5 | 4 | 5 | 5 | 5 | 5 | 5 | 5 |
| 135 | Living space | 5 | 4 | 2 | 5 | 5 | 5 | 5 | 3 | 4 | 5 | 4 | 5 | 5 | 5 | 5 | 2 | 5 | 4 | 4 | 2 | 2 | 5 | 5 |
| 0 | Dining space | 5 | 4 | 4 | 5 | 5 | 5 | 5 | 4 | 4 | 5 | 4 | 5 | 5 | 5 | 4 | 4 | 5 | 4 | 4 | 2 | 2 | 4 | 5 |
| 145 | Pedestrian access to your home | 1 | 4 | 4 | 4 | 3 | 5 | 4 | 4 | 5 | 5 | 4 | 1 | 4 | 5 | 5 | 4 | 5 | 5 | 5 | 5 | 5 | 5 | 4 |
| 45 | Space for extension | 1 | 1 | 1 | 1 | 1 | 1 | 1 | 3 | 1 | 1 | 3 | 4 | 1 | 1 | 1 | 1 | 1 | 3 | 4 | 4 | 4 | 5 | 2 |
| Garden area in the house | 4 | 5 | 5 | 4 | 5 | 5 | 5 | 5 | 5 | 5 | 5 | 5 | 5 | 5 | 5 | 3 | 5 | 5 | 5 | 5 | 4 | 5 | 5 | |
| PHYSICAL DIMENSION | ||||||||||||||||||||||||
| 1 | Sanitary drainage connection to municipal network | 1 | 1 | 1 | 1 | 1 | 1 | 1 | 1 | 1 | 1 | 1 | 1 | 5 | 1 | 5 | 1 | 1 | 1 | 1 | 5 | 1 | 1 | 1 |
| 5 | Connection to municipal drinking water network | 4 | 4 | 1 | 1 | 1 | 1 | 1 | 1 | 3 | 3 | 1 | 1 | 5 | 5 | 5 | 1 | 1 | 3 | 3 | 5 | 1 | 1 | 1 |
| 0 | Other means of drinking water supply | 5 | 5 | 1 | 1 | 1 | 1 | 1 | 1 | 1 | 1 | 1 | 1 | 5 | 5 | 5 | 1 | 1 | 1 | 1 | 5 | 1 | 1 | 1 |
| 32 | Mains connection | 1 | 1 | 1 | 1 | 1 | 1 | 1 | 1 | 1 | 1 | 1 | 1 | 3 | 1 | 5 | 1 | 1 | 1 | 1 | 5 | 3 | 1 | 1 |
| 103 | Access to gas for cooking | 4 | 1 | 5 | 5 | 4 | 4 | 3 | 5 | 1 | 5 | 1 | 2 | 5 | 5 | 3 | 3 | 3 | 5 | 5 | 5 | 1 | 5 | 5 |
| 134 | Use of water and electricity saving systems | 1 | 1 | 4 | 4 | 5 | 5 | 5 | 2 | 2 | 2 | 2 | 2 | 2 | 2 | 2 | 2 | 5 | 5 | 5 | 1 | 5 | 1 | 1 |
| Use of water heater | 5 | 5 | 5 | 5 | 5 | 5 | 5 | 5 | 5 | 5 | 5 | 5 | 5 | 5 | 5 | 5 | 5 | 5 | 5 | 5 | 5 | 5 | 5 | |
| Drinking water container (Tinaco) | 5 | 5 | 4 | 5 | 5 | 4 | 5 | 5 | 1 | 5 | 1 | 1 | 1 | 5 | 5 | 5 | 1 | 4 | 5 | 5 | 5 | 5 | 5 | |
| Bathroom with shower | 5 | 5 | 3 | 5 | 1 | 5 | 5 | 5 | 5 | 2 | 5 | 5 | 5 | 5 | 5 | 5 | 4 | 5 | 5 | 5 | 5 | 5 | 5 | |
| Toilet with toilet | 5 | 5 | 3 | 5 | 1 | 5 | 5 | 5 | 5 | 2 | 5 | 1 | 1 | 5 | 5 | 5 | 4 | 5 | 5 | 5 | 5 | 5 | 5 | |
| 0 | Bathroom inside the house | 1 | 1 | 5 | 2 | 5 | 5 | 5 | 5 | 5 | 5 | 1 | 3 | 5 | 5 | 5 | 5 | 5 | 3 | 1 | 1 | 1 | 1 | 5 |
| Kitchen sink | 4 | 1 | 5 | 5 | 3 | 2 | 5 | 5 | 5 | 2 | 3 | 1 | 4 | 5 | 5 | 3 | 4 | 5 | 5 | 5 | 5 | 5 | 5 | |
| Suitable doors. | 4 | 3 | 1 | 4 | 3 | 5 | 5 | 5 | 5 | 4 | 5 | 5 | 5 | 5 | 3 | 5 | 3 | 1 | 1 | 2 | 2 | 5 | ||
| Suitable windows | 1 | 2 | 4 | 1 | 5 | 5 | 5 | 5 | 4 | 4 | 1 | 4 | 5 | 5 | 5 | 3 | 5 | 2 | 5 | 3 | 3 | 5 | 5 | |
| 0 | Laundry in service yard | 1 | 1 | 1 | 1 | 4 | 5 | 5 | 4 | 3 | 3 | 1 | 4 | 5 | 5 | 5 | 4 | 4 | 1 | 1 | 1 | 1 | 5 | 5 |
| Wall coverings | 5 | 5 | 2 | 3 | 5 | 5 | 4 | 4 | 5 | 4 | 2 | 2 | 5 | 4 | 5 | 4 | 4 | 5 | 5 | 5 | 5 | 5 | 5 | |
| Floor coverings | 5 | 5 | 2 | 3 | 5 | 5 | 4 | 5 | 5 | 4 | 2 | 2 | 5 | 4 | 5 | 4 | 4 | 5 | 5 | 5 | 5 | 5 | 5 | |
| Roof Coatings | 5 | 5 | 2 | 3 | 5 | 5 | 4 | 5 | 5 | 4 | 2 | 2 | 5 | 4 | 5 | 4 | 4 | 5 | 5 | 5 | 5 | 5 | 5 | |
| 0 | Fourth extra bedroom | 5 | 4 | 5 | 4 | 3 | 5 | 5 | 5 | 3 | 5 | 3 | 5 | 5 | 5 | 5 | 5 | 5 | 4 | 5 | 5 | 5 | 5 | 5 |
| URBAN ENVIRONMENT DIMENSION | ||||||||||||||||||||||||
| 159 | Green areas in the neighbourhood | 5 | 5 | 5 | 5 | 5 | 5 | 5 | 5 | 5 | 5 | 5 | 5 | 5 | 5 | 5 | 2 | 5 | 5 | 5 | 5 | 5 | 4 | 4 |
| 0 | Playground in the neighbourhood | 5 | 5 | 5 | 5 | 5 | 5 | 5 | 5 | 5 | 5 | 5 | 5 | 5 | 5 | 5 | 4 | 5 | 5 | 5 | 5 | 5 | 5 | 5 |
| 151 | Area for sports in the neighbourhood | 5 | 5 | 5 | 5 | 5 | 5 | 5 | 5 | 5 | 5 | 5 | 5 | 5 | 5 | 5 | 5 | 5 | 5 | 5 | 5 | 5 | 5 | 5 |
| 114 | Sidewalks | 1 | 1 | 1 | 1 | 1 | 1 | 1 | 1 | 4 | 2 | 1 | 1 | 2 | 1 | 1 | 1 | 1 | 1 | 2 | 1 | 1 | 1 | 1 |
| 68 | Commercial area | 5 | 5 | 5 | 5 | 5 | 5 | 5 | 5 | 5 | 5 | 5 | 5 | 5 | 5 | 5 | 2 | 5 | 4 | 5 | 5 | 5 | 4 | 4 |
| 60 | Paved roads | 1 | 1 | 1 | 1 | 1 | 1 | 1 | 1 | 1 | 1 | 1 | 4 | 5 | 5 | 5 | 1 | 1 | 1 | 1 | 1 | 1 | 1 | 5 |
| 70 | church | 1 | 1 | 1 | 1 | 1 | 1 | 1 | 1 | 1 | 1 | 1 | 1 | 1 | 1 | 1 | 1 | 1 | 1 | 1 | 1 | 1 | 1 | 1 |
| 67 | Basic Education School | 1 | 1 | 1 | 1 | 1 | 1 | 1 | 1 | 2 | 1 | 1 | 1 | 2 | 1 | 2 | 1 | 1 | 1 | 1 | 1 | 1 | 1 | 1 |
| 0 | Community medical care | 1 | 1 | 1 | 1 | 1 | 1 | 1 | 2 | 1 | 1 | 1 | 2 | 1 | 2 | 1 | 1 | 1 | 1 | 1 | 1 | 1 | 1 | |
| 66 | Waste collection | 3 | 3 | 3 | 3 | 3 | 3 | 3 | 3 | 3 | 3 | 3 | 4 | 4 | 4 | 4 | 4 | 3 | 3 | 3 | 3 | 3 | 3 | 4 |
| 65 | Guardhouse | 2 | 2 | 2 | 2 | 2 | 2 | 2 | 2 | 5 | 2 | 2 | 4 | 4 | 4 | 4 | 2 | 2 | 2 | 2 | 2 | 2 | 2 | 2 |
| 64 | Street lighting | 1 | 1 | 1 | 1 | 2 | 2 | 2 | 3 | 3 | 4 | 1 | 1 | 1 | 2 | 2 | 1 | 1 | 1 | 2 | 1 | 3 | 1 | 1 |
| 72 | Nearby transport | 1 | 1 | 1 | 1 | 1 | 1 | 1 | 3 | 3 | 4 | 4 | 4 | 4 | 4 | 5 | 1 | 1 | 1 | 1 | 1 | 1 | 3 | 3 |
| SOCIAL DIMENSION | ||||||||||||||||||||||||
| 0 | Security, perception in the colony | Y | Y | Y | Y | Y | Y | Y | Y | No | Y | Y | Y | Y | Y | Y | Y | Y | Y | Y | Y | Y | Y | Y |
| 10 | Access to educational networks children and adults | No | No | No | No | No | No | No | No | No | No | No | No | No | No | No | No | No | No | No | No | No | No | No |
| 11 | Neighbourhood Organization and Participation | Y | Y | No | Y | No | Y | No | Y | No | No | Y | Y | No | Y | Y | Y | No | Y | No | No | Y | Y | Y |
| 3 | Access to community health service | Y | Y | Y | No | Y | Y | Y | Y | Y | Y | Y | Y | Y | Y | Y | Y | Y | Y | Y | Y | Y | Y | Y |
| 5 | Access to basic education schools | Y | Y | Y | No | Y | Y | Y | No | No | No | No | Y | Y | No | Y | No | Y | Y | Y | Y | No | Y | Y |
| 101 | Access to recreation and recreation spaces | No | No | No | No | No | No | No | No | No | No | No | No | No | No | No | No | No | No | No | No | No | No | No |
| 8 | Access to public transport | Y | Y | Y | Y | Y | Y | Y | Y | Y | Y | Y | No | No | No | No | Y | Y | No | No | No | Y | Y | No |
| 26 | Separate animal-human environments | Y | Y | No | No | No | No | No | No | Y | No | Y | No | No | No | No | No | No | Y | Y | Y | Y | Y | No |
| 24 | Rest in the house | No | Y | No | No | No | No | No | Y | No | Y | No | No | No | No | Y | No | Y | Y | Y | Y | No | No | |
| 83 | 2 or less occupants per room | Y | No | No | No | No | No | No | No | Y | Y | Y | No | No | No | Y | Y | Y | Y | No | No | Y | No | No |
| 4 | Land tenure | Y | Y | Y | Y | Y | Y | Y | Y | Y | Y | Y | Y | Y | Y | Y | Y | Y | Y | Y | Y | Y | Y | Y |
Appendix G. Proposal on Recommendations to Improve Housing Satisfaction in Social lag by Study Dimensions. The Actions to be Taken as a Proposal on Recommendations to the Solutions of the Results Obtained on Very High Dissatisfaction and Needs of Socially Lagging Housing Are Shown, the Dimensions and Indicators Marked in an Orange Box that Require Priority Action Are Shown
Table A9.
Proposal on recommendations to improve housing satisfaction in social lag by study dimensions.
Table A9.
Proposal on recommendations to improve housing satisfaction in social lag by study dimensions.
| DIMENSION | PARAMETER | INDICATORS WITH HIGH NEED AND VERY LOW SATISFACTION | LINE OF ACTION | MEASURES SOLUTION | ORGANISM |
|---|---|---|---|---|---|
| SOCIAL | Cohesion Social | Security, perception in the colony Access to educational networks children and adults Neighbourhood Organization and Participation | Encourage the cultural and educational activity of the community among young children and adults | Educational networks based on actions of government agencies, with active participation of the community through an agency | State, municipal, DIF Civil organization, Secretary |
| Access to the resources urban | Access to community health service Access to basic education schools Access to recreation and recreation spaces Access to public transport | Rehabilitation of green areas under the land use regulation in areas intended for it | Under the regulation of parks and gardens of the State of Hidalgo, regulation of municipal land use and with community participation with prior information on procedures to rehabilitate green areas and gardens | Ministry of Public Works municipal, civil organization community secretary environment and resources natural | |
| Housing | Human Animals Separate Environments Rest in the house More than 2 occupants per room | Enabling housing in social lag | Characterization of housing, project and budget, enabling measures with sustainable materials, easy execution, durable and low maintenance costs | Universities, application of material research sustainable. SEDATU_FONAHPO. Housing state commission. | |
| Legal | Land trend | ||||
| PHYSICAL | Infrastructure | Sanitary drainage connection to municipal network Connection to municipal drinking water network Other means of drinking water supply Mains connection | |||
| Mobility and Facilities | Access to gas for cooking Use of water and electricity saving systems Use of water heater Drinking water container (Tinaco) Bathroom with shower Toilet with toilet Bathroom inside the house Kitchen sink Suitable door Suitable windows Laundry in service yard | Enabling adequate indoor bathroom spaces in socially lagging homes, as well as adequate equipment for basic toilet and kitchen needs. Rehabilitation in openings for doors and windows appropriate to their function. | Within the characterization of the house, analysis of the facilities and basic equipment of the homes under study, identify the deficiencies and project solutions, make a budget with the condition of having them more efficient equipment and materials in saving water and energy | SEDATU (Development Secretariat agricultural, territorial and urban) by medium of its support dispersing agencies for rehabilitation in areas in FOHAPO social lag (Fund national of populous rooms) conavi (national commission of housing) State commissions and municipal housing. | |
| Mobility and Facilities | Wall covering Coating in floors Roof Coatings Fourth extra bedroom | Characterization, projection and budget of the dimensions of the deficiencies in high need | Refurbishment of coverings in walls, floors and roofs with sustainable materials and low maintenance costs | SEDA TU, FONHAPO, CONAVI, state and municipal commission of living place. | |
| SPACIAL | INDOOR | Sun lighting inside the house Window ventilation inside the housing Separate spaces between bedrooms and other housing Living space Dining space | Enabling spaces in homes with this priority need based on projects and budget | Enabling spaces with adequate horizontal circulation in order to have a better function for the tailoring of its inhabitants | SEDATU, FONHAPO, CONAVI, state and municipal commission of living place |
| OUTDOOR | Pedestrian access to your home Spaces for expansion Garden area in the house | Refurbishment of access to homes and gardens | Refurbishment actions with community action from the civil organization and municipality | Government Public Works Secretary Municipal for access and gardens with civil organization | |
| URBAN ENVIRONMET | Equipment | Green areas in the neighbourhood Playground is in the neighbourhood Area for sports in the neighbourhood Area for sports in the neighbourhood Sidewalks Commercial area Paved City Churches Elementary school Community medical care | Enabling existing spaces for these purposes under the land use regulation, project of spaces for sport. | Refurbishment of green areas from civil organization and actions with the secretary of public works and gardens of the municipality. | Municipal Public Works Secretariat, community civil organization, secretary of the environment and natural resources. |
| Services | Waste collection Guardhouse Street lighting Nearby transport | ||||
References
- UN-Habitat. Slum Almanac 2015–2016. Tracking Improvement in the Lives of Slum Dwellers; UN-Habitat: Nairobi, Kenya, 2017. [Google Scholar]
- United Nations. 12 March 2019. Millennium Development Goals. Available online: https://www.un.org/millenniumgoals/environ.shtml (accessed on 15 February 2021).
- World Bank. Urban Poverty, World Bank Urban Papers; World Bank: Washington, DC, USA, 2008. [Google Scholar]
- UN-Habitat. Slums and Cities Prosperity Index; CPI: 2014. Available online: https://unhabitat.org/programme/city-prosperity-initiative (accessed on 15 February 2021).
- UN-Habitat. Conferencia Hábitat III. La Nueva Agenda Urbana; Naciones Unidas: Quito, Ecuador, 2016. [Google Scholar]
- Ball, M. Housing provision in 21st century Europe. Habitat Int. 2016, 54, 182–188. [Google Scholar] [CrossRef]
- Talukdar, D. Cost of being a slum dweller in Nairobi: Living under dismal conditions but still paying a housing rent premium. World Dev. 2018, 109, 42–56. [Google Scholar] [CrossRef]
- Shamsuddin, S. Resilience resistance: The challenges and implications of urban resilience implementation. Cities 2020, 103, 102763. [Google Scholar] [CrossRef] [PubMed]
- ONU HABITAT. El plan estratégico 2020–2023. 9 May 2020. Available online: https://unhabitat.org/sites/default/files/2019/12/strategic_plan_esp_web.pdf (accessed on 1 March 2021).
- Scott, M.; Parkinson, A.; Waldron, R.; Redmond, D. Planning for historic urban environments under austerity conditions: Insights from post-crash Ireland. Cities 2020, 103, 102788. [Google Scholar] [CrossRef] [PubMed]
- Atia, M. Refusing a “City without Slums”: Moroccan slum dwellers’ nonmovements and the art of presence. Cities 2019, in press. [Google Scholar] [CrossRef]
- Rastegar, M.; Hatami, H.; Mirjafari, R. Role of social capital in improving the quality of life and social justice in Mashhad, Iran. Sustain. Cities Soc. 2017, 34, 109–113. [Google Scholar] [CrossRef]
- Ruá M., J.; Huedo, P.-F. A simplified model to assess vulnerable areas for urban regeneration. Sustain. Cities Soc. 2019, 46, 101–144. [Google Scholar] [CrossRef]
- Barrios, A.; González, E.; Mariñas, J.; Molina, M. (Re) Programa (Re) Habitation + (Re) Generation +(Re) Programming. In The Recycling and the Sustainable Management of the Andalusian Housing Stock. Management of Habitable Surrondings from the Criteria of Active Aging, Gender and Urban Habitability; University of Seville: Sevilla, Spain, 2015. [Google Scholar]
- Serrano-Jimenez, A.; Barrios-Padura, A.; Molina-Huelva, M. Towards a feasible strategy in Mediterranean building renovation through a multidisciplinary approach. Sustain. Cities Soc. 2017, 32, 532–546. [Google Scholar] [CrossRef]
- Luxán García De Diego, M.; Sánchez-Guevara Sánchez, C.; Román López, E.; Barbero Barrera, M.; Gómez Muñoz, G. Re-Habilitación Exprés para Hogares Vunerables. Soluciones de Bajo Coste; Fundación gasNatural fenosa: Barcelona, Spain, 2017. [Google Scholar]
- UNICEF. A Snapshot of Water and Sanitation in the Pacific; UNICEF: New York, NY, USA, 2013. Available online: https://www.unicef.org/eap/reports/snapshot-water-and-sanitation-pacific (accessed on 1 March 2021).
- United Nations. HABITAD III: Jamaica National Report 2014. In Proceedings of the Third United Nations Conference on Housing and Sustainable Urban Development, Quito, Ecuador, 17–20 October 2016. [Google Scholar]
- CONEVAL. May de 2019. Consejo de Nacional de Evaluación de las Políticas de Desarrollo Social. Available online: https://www.coneval.org.mx (accessed on 26 February 2021).
- Kanwal Zahra, A.A. Marginality and social exclusion in Punjab, Pakistan: A threat to urban sustainability. Sustain. Cities Soc. 2018, 37, 203–212. [Google Scholar] [CrossRef]
- Rockwood, D. Tran Duc Quang.Urban immigrant worker housing research and design for Da Nang, Viet Nam. Susteinable Cities Soc. 2016, 26, 108–118. [Google Scholar] [CrossRef]
- Galiania, S.; Gertlerb, P.; Undurrag, R.; Cooper, R.; Martínez, S.; Ross, A. Shelter from the storm: Upgrading housing infrastructure in Latin American slums. J. Urban Econ. 2017, 98, 187–213. [Google Scholar] [CrossRef]
- Jaitman, L. Evaluation of Slum Upgranding Programs: A Literature Review; International Development Bank: Washington, DC, USA, 2015. [Google Scholar]
- Estrada Casarín, C.; Obregón Davis, S. El Rezago Habitacional: Alternativas Desde lo Local; ITESO: Jalisco, Mexico, 2017. [Google Scholar]
- Hernández Aja, A.; Matesanz Parellada, Á.; García Madruga, C.; Rodríguez Suárez, I. Análisis de las Políticas Estatales y Europeas de Regeneración Urbana y Rehabilitación de Barrios. Ciudad. Territ. Estud. Territ. 2012, 46, 182–183. [Google Scholar]
- Kleinhans, R. Social implications of housing diversification in urban renewal: A review of recent literature. J. Hous. Built Environ. 2004, 4, 367–390. [Google Scholar] [CrossRef]
- Saldaña-Márquez, H.; Gómez Soberón, J.; Arredondo-Rea, P.; Gámez-Gacía, R.; Corral-Higuera, D. Sustainable social housing: The comparison of the Mexican funding program for housing solutions and building sustainability rating systems. Buinding Environ. 2018, 133, 103–313. [Google Scholar] [CrossRef]
- Abramo, P. The com-fused city: Market and production of the urban structure in the great Latin American cities. Eure 2012, 38, 35–69. [Google Scholar]
- Smith, D. World City Populations. 19 March 2019. Available online: http://luminocity3d.org/WorldCity/#2/34.5/17.2 (accessed on 6 February 2021).
- Higueras, E.; Macias, M.; Rivas, P. Sustainable Buidling Conference. SB10mad. Metodología para la Evaluación de la Sostenibilidad en Nuevas Planificaciones Urbanas; Selección de criterios e indicadores: Madrid, Spain, 2010; Available online: https://vapaavuori.net/2010/09/22/sustainable-building-2010-conference-espoo/ (accessed on 6 February 2021).
- OECD. 1993. Available online: http://enrin.grida.no/htmls/armenia/ (accessed on 1 March 2021).
- Verma, P.; Raghubanshi, A. Urban sustainability indicators: Challenges and opportunities. Ecol. Indic. 2018, 93, 282–291. [Google Scholar] [CrossRef]
- Mercader-Moyano, P.; Morat, O.; Serrano, J. Urban and social vulnerability assessment in the built environment: An interdisciplinary index-methodology towards feasible planning and policy-making under a crisis context. Sustain. Cities Soc. 2021, 73, 103082. [Google Scholar] [CrossRef]
- Tapia, C.A. Profiling urban vulnerabilities to climate change: An indicator-based vul- nerability assessment for European cities. Ecol. Indic. 2017, 78, 142–155. [Google Scholar] [CrossRef]
- Tyler, S.N. Indicators of urban climate resilience: A contextual approach. Environ. Sci. Policy. Environ. Sci. Policy 2016, 66, 420–426. [Google Scholar] [CrossRef]
- López-Mesa, B. Nuevos enfoques en la rehabilitación energética de la vivienda hacia la convergencia europea. In La vivienda social en Zaragoza.1939–1979; Prensas de la Universidad Zaragoza: Zaragoza, Spain, 2018. [Google Scholar]
- Luxan, M. Re-Habilitación Exprés para Hogares Vulnerables. Soluciones de Bajo Coste; Fundación Gas Natural fenosa: Madrid, Spain, 2018. [Google Scholar]
- Le, L.H.; Da, A.D.; Dang, H.Q. Building up a System of Indicators to Measure Social Housing Quality in Vietnam. Procedia Eng. 2016, 142, 116–123. [Google Scholar] [CrossRef]
- Mohammed Amenn, R.M. Urban sustainability assessment framework development: The ranking and wighting of sustainability indicators using analytic hierarchy process. Sustain. Cities Soc. 2019, 44, 359–366. [Google Scholar]
- Lynch, A.J.; Mosbajh, S. MImproving local measures of sustainability: A study of built environment indicators in the United States. Cities 2017, 60, 301–313. [Google Scholar] [CrossRef]
- Graw, V. Mapping marginality hotspots: Geographical targeting for poverty reduction. SSRN J. 2012. [Google Scholar] [CrossRef]
- Braulio-Gonzalo, M.; Bovea, M.; Rua, M. Sustainability on the urban scale: Proposal of a structure of indicators for the Spanich context. Environ. Impact Assess. Rev. 2015, 53, 16–30. [Google Scholar] [CrossRef]
- Monzón, M.; López-Mesa, B. Buildings performance indicators to prioritise multi-family housing renovations. Sustain. Cities Soc. 2018, 38, 109–122. [Google Scholar] [CrossRef]
- Generalitat de Cataluña. Estrategias Para el Desarrollo Sostenible de Cataluña-Mobilidad; Departamento de Medio Ambiente: Barcelona, Spain, 2009. [Google Scholar]
- Naciones Unidas. Nueva Agenda Urbana de Hábitat III. Quito, Ecuador. 2016. Available online: http://habitat3.org/wp-content/uploads/NUA-Spanish.pdf (accessed on 10 February 2021).
- Cabrera Chaparro, A. Suelo Urbano en Bogotá: Vivienda para Población de Bajo Ingreso; Universidad Politécnica de Valencia: Valencia, Spain, 2015; Available online: https://riunet.upv.es/handle/10251/60452 (accessed on 10 February 2021).
- Hernández, G.S.V. Vivienda y Calidad de vida. Medición del Hábitat Social en el México Occidental; Revista Bitácora Urbano Territorial. 2014. Available online: https://revistas.unal.edu.co/index.php/bitacora/article/view/31463/pdf_31. (accessed on 10 February 2021).
- ISO 37120:2015. Sustainable Development of Communities—Indicators for City Services and Quality of Life; ISO: Geneva, Switzerland, 2015. [Google Scholar]
- INEGI. Datos del INEGI (Instituto Nacional de Estadística, Geografía e Informática) Empleados por CONEVAL para el Corte Intercensal; CONEVAL: México City, Mexico, 2018. [Google Scholar]
- Mrtin Muñoz, M. Manual de Indicadores para el Diagnóstico Social; Colegios Oficiales de Diplomados en TRabajo Social y Asistentes Sociales de la Comunidad Autónoma Vasca: Madrid, Spain, 1996. [Google Scholar]
- Mellace, F. Tecnología en la Vivienda Rural: Tucamán, Argentina. II Seminario y Taller Iberoamericano Sobre Vivienda Rural y Calidad de Vivienda en los Asentamientos Rurales; Universidad Autónoma de San Luis Potosí: San Luis Potosí, Mexico, 2000; pp. 308–316. [Google Scholar]
- Sánchez Quintana, C.; Jiménez Rosa, E. La vivienda rural. Su complejidad y estudio desde diversas disciplinas. Rev. Luna Azul 2010, 30, 174–196. [Google Scholar]
- Consejo Nacional de Evaluación de la Política de Desarrollo Social. Estudio Diagnóstico del Derecho a la Vivienda Digna y Decorosa; Consejo Nacional de Evaluación de la Política de Desarrollo Social: Mexico City, México, 2018. [Google Scholar]
- UN-Habitat. State of the World´s Cities 2012/2013; Routledge: New York, NY, USA, 2013. [Google Scholar]
- Salas-Bourgoin, M. Propuesta de índice de calidad de vida en la vivienda. Cuad. Cendes 2012, 29, 57–78. [Google Scholar]
- Hernández Sampieri, R.F. Metodología de la Investigación; McGraw-Hill: México City, Mexico, 2006; Volume 3. [Google Scholar]
- López Alvarenga, J.B. How to estimate the sample size of a study. Rev. Mex. 2010, 54, 375–379. [Google Scholar]
- Maldonado Luna, S. Manual práctico para el diseño de la Escala Likert. Trillas 2007, 2. [Google Scholar] [CrossRef]
- Cronbach, L. Coefficient alpha and the internal structure of tests. Pshychometrika 1951, 16, 297–334. [Google Scholar] [CrossRef]
- Welch, S.; Comer, J. Quantitative Methods for Public Administration: Techniques and Applications; Houghton Mifflin Harcourt: Charles, IL, USA, 1988. [Google Scholar]
- Gliem, J.; Gliem, R. Calculating, interpreting, and reporting Cronbach´s alpha reliability coefficient for Likert-type scales. In Proceedings of the Midwest Research-to-Practice conference in Adult, Continuing, and Community Education, Columbus, OH, USA, 2003; Available online: https://scholarworks.iupui.edu/bitstream/handle/1805/344/gliem+&+gliem.pdf?sequence=1 (accessed on 10 February 2021).
- Corral-Verdugo, V.; Barrón, M.; Tapia-Fonllem, A.C. Housing habitability, stress and family violence. Psyecology 2011, 2, 3–14. [Google Scholar] [CrossRef]
- Gómez, J. Estrategias de ponderación de la respuesta en encuestas de satisfacción de usuarios de servicios. Metodol. Encuestas 2002, 4, 175–193. [Google Scholar]
- Muñoz Pichardo, J.M. Propuesta de Ponderación para el Nivel de Satisfacción en la Vivienda en Rezago Social. Grupo de Estadística de la Facultad de Matemáticas de la Universidad de Sevilla. 2018. Available online: https://www.coneval.org.mx/SalaPrensa/Comunicadosprensa/Documents/Indice-de-rezago-social-2010.pdf (accessed on 10 February 2021).


Publisher’s Note: MDPI stays neutral with regard to jurisdictional claims in published maps and institutional affiliations. |
© 2021 by the authors. Licensee MDPI, Basel, Switzerland. This article is an open access article distributed under the terms and conditions of the Creative Commons Attribution (CC BY) license (https://creativecommons.org/licenses/by/4.0/).