Review

Review of Transit Data Sources: Potentials, Challenges and Complementarity

1
Institute of Information Systems, Leuphana Universität Lüneburg, 21335 Lüneburg, Germany
2
Institute of Information Systems, Universität Hamburg, 20146 Hamburg, Germany
*
Author to whom correspondence should be addressed.
Sustainability 2021, 13(20), 11450; https://doi.org/10.3390/su132011450
Submission received: 4 July 2021 / Revised: 1 August 2021 / Accepted: 9 August 2021 / Published: 16 October 2021
(This article belongs to the Section Sustainable Transportation)

Abstract

:
Public transport has become one of the major transport options, especially when it comes to reducing motorized individual transport and achieving sustainability while reducing emissions, noise and so on. The use of public transport data has evolved and rapidly improved over the past decades. Indeed, the availability of data from different sources, coupled with advances in analytical and predictive approaches, has contributed to increased attention being paid to the exploitation of available data to improve public transport service. In this paper, we review the current state of the art of public transport data sources. More precisely, we summarize and analyze the potential and challenges of the main data sources. In addition, we show the complementary aspects of these data sources and how to merge them to broaden their contributions and face their challenges. This is complemented by an information management framework to enhance the use of data sources. Specifically, we seek to bridge the gap between traditional data sources and recent ones, present a unified overview of them and show how they can all leverage recent advances in data-driven methods and how they can help achieve a balance between transit service and passenger behavior.

1. Introduction

Public transport provides an essential service whose relevance is increasingly recognized. Indeed, it helps to reduce road congestion, air pollution and energy as well as oil consumption. However, managing the public daily commute network is a difficult task, particularly today with rapid urbanization and the associated population increases, especially in developing countries. Therefore, public transportation systems need to adopt appropriate tools and take advantage of the available data to address these challenges. Indeed, it is shown in several studies (e.g., [1,2,3,4]) that the acquisition of reliable information and data is crucial for the proper functioning of public transport information systems.
We note, first, that, in general, a public transport (or transit) system is comprised of supply (presented through transit service) and demand (reflecting passenger behavior). The ultimate goal is then to achieve a balance in which transit services meet the needs of passengers, using the available information.
On the one hand, classic data sources on transit service, which are generally provided by agencies, are based on transit schedules, stations and route information. However, these static data are not informative in terms of disruptions (e.g., delays, interruptions) as they are based entirely on schedules, which are expectations rather than observations of services. Moreover, we note that the actual observation of schedules which may or may not be published reveals that a schedule does not specify certain details, as is the case, e.g., when it is said that a bus or train runs every ten minutes, etc. Rather than using schedules, public transit services may also run on demand and other options may apply as well. On the other hand, traditional manual approaches to collect information on passenger demand and behavior, such as household surveys, have shown limitations to cope with the current challenges alone ([5]). Therefore, in recent years, big data has emerged as an area to allow new perspectives on improving public transportation systems. That is, the availability of these data, coupled with advanced approaches to data analysis, has paved the way for the use of massive data sets in public transport. As a result, it is widely accepted today that the application of big data to public transport problems will offer new perspectives which were previously inaccessible by traditional transport data and analysis approaches. Therefore, the public transport community is increasingly emphasizing the importance of developing commonly collected data sources on public transport, as well as more powerful analytical tools. However, the massive increase in data availability poses many growing challenges in handling transit data, including their validation, in order to fully benefit from their potential.
We notice that interest in the use of big data in public transport began to emerge a long time ago before the phrase ‘big data’ was even used. As an example we note the occasional need to heuristically calculate shortest paths in public transport networks and related data sources due to the size and time requirements; see, e.g., [6]. Major references on big-data use started around 2013. As an example, one of the first meetings displaying interest in this topic was the 93rd Annual Meeting of the US Transportation Research Board (TRB) in early 2014. (See https://www.nationalacademies.org/trb/transportation-research-board and http://www.trb.org/AnnualMeeting2014/annualmeeting2014.aspx; other more recent meetings include https://transitdata2020.ca/ and http://www.caspt.org/ as accessed on 13 June 2021). Thus, in recent years, many studies on the use of big data in public transport have been published. Before delving into the various studied issues, it should be noted that several reviews on big data in public transport have recently been published, which we summarize below.
First, Ref. [7], which appears to be the most comprehensive and up-to-date public transport big data review, aims to categorize research on this topic, with respect to its applications, into three areas, namely passenger behavior analysis, operation optimization and policy making. We also describe the main data sources and divide them according to the technologies they come from, either traditional data collection technologies or advanced ones. Ref. [8] highlights the main sources of big data in public transport, in conjunction with certain applications. The authors classify the included papers depending on their application, namely service (performance), user behavior, travel demand, management, resilience and safety. Regarding the data sources, only the frequency (percentage of papers using each data source) is given, that is, the paper does not provide a summary of literature of the data sources. Ref. [9] presents another application-based categorization of the papers. The proposed categories are travel pattern analysis, public transport modeling and performance assessment. Other articles focus on specific case studies. For example, Ref. [10] aim to review research progress in China from 2000 to 2015.
Other papers focus on reviewing the broader field of transport. For instance, Ref. [11] aim to survey the use of big data analytics to build intelligent transport systems. Specifically, the authors divide the different data sources into smart cards, the global positioning system (GPS), videos, sensors, connected vehicles and passive collection (e.g., social media) data sources. The authors also review some of the main applications and adopted analytical approaches. Moreover, Ref. [12] are interested in the application of big data in social transportation. The term social transportation refers to ‘social’ data which are often derived from real-time social and physical data. The authors propose a design which links and corresponds to analytical approaches, the sources and the applications of the contained information. In other words, they aim to provide for each application the necessary sources, as well as the information contained therein and the analytical approach needed for processing the data. Ref. [13] specifies the potential opportunities that big data present for the optimization of public transport services. Quite a few resources can be found at the National Academies of Sciences, Engineering and Medicine (USA). In most cases related to our study the focus is on managing data from emerging transportation technologies to support decision making. Recent examples include [14,15].
We then notice that these reviews rather aim to show different applications of big data in public transport than to focus on the data sources themselves. For those interested in data sources, the various data challenges are not extensive. Papers with interest on reviewing data sources are tailored to a specific type of data and are referenced in the corresponding sections. Regarding applications, due to the variety of big data applications in public transport, the reviews described are also not exhaustive in this regard. For example, a number of the applications highlighted in [16] are not mentioned in these reviews. A possible framework focusing on a three-layer information management framework could focus on the information, related information systems, as well as necessary infrastructure; see Section 5 using earlier ideas from [17].
In this paper, we instead focus on the different opportunities and challenges in each type of data, as well as their integration. More in practice, we aim to summarize and provide insights on the main applications and opportunities of different data, to highlight their challenges and how to fusion them. To the best of our knowledge, this is the first paper to review public transport data sources in this way and to include recent related papers and reviews.
More precisely, we are interested in the main data sources which are automated vehicle location (AVL), automated fare collection (AFC) and automated passenger counting (APC) systems. These data are endogenous as they can be accessed directly by the agencies, if the needed technologies are available. In addition, we are interested in exogenous sources, such as weather, traffic, social media, smartphone and surveys which also contain valuable information. Based on a comprehensive discussion of the various types of data sources and related literature, we suggest an information management framework, as it can be used to streamline future work in this area.
The rest of the paper is organized as follows: In the next section, we explore endogenous data sources. Section 3 is dedicated to exogenous data sources. In Section 4, we attempt to put the different sources into perspective with a specific focus on data-driven implications. This is followed by the framework presentation. Section 6 is devoted to a conclusion and summarizing discussion of the current state of the art.
To ease the reading, the Table at the end of the paper provides abbreviations as they are used in this manuscript.

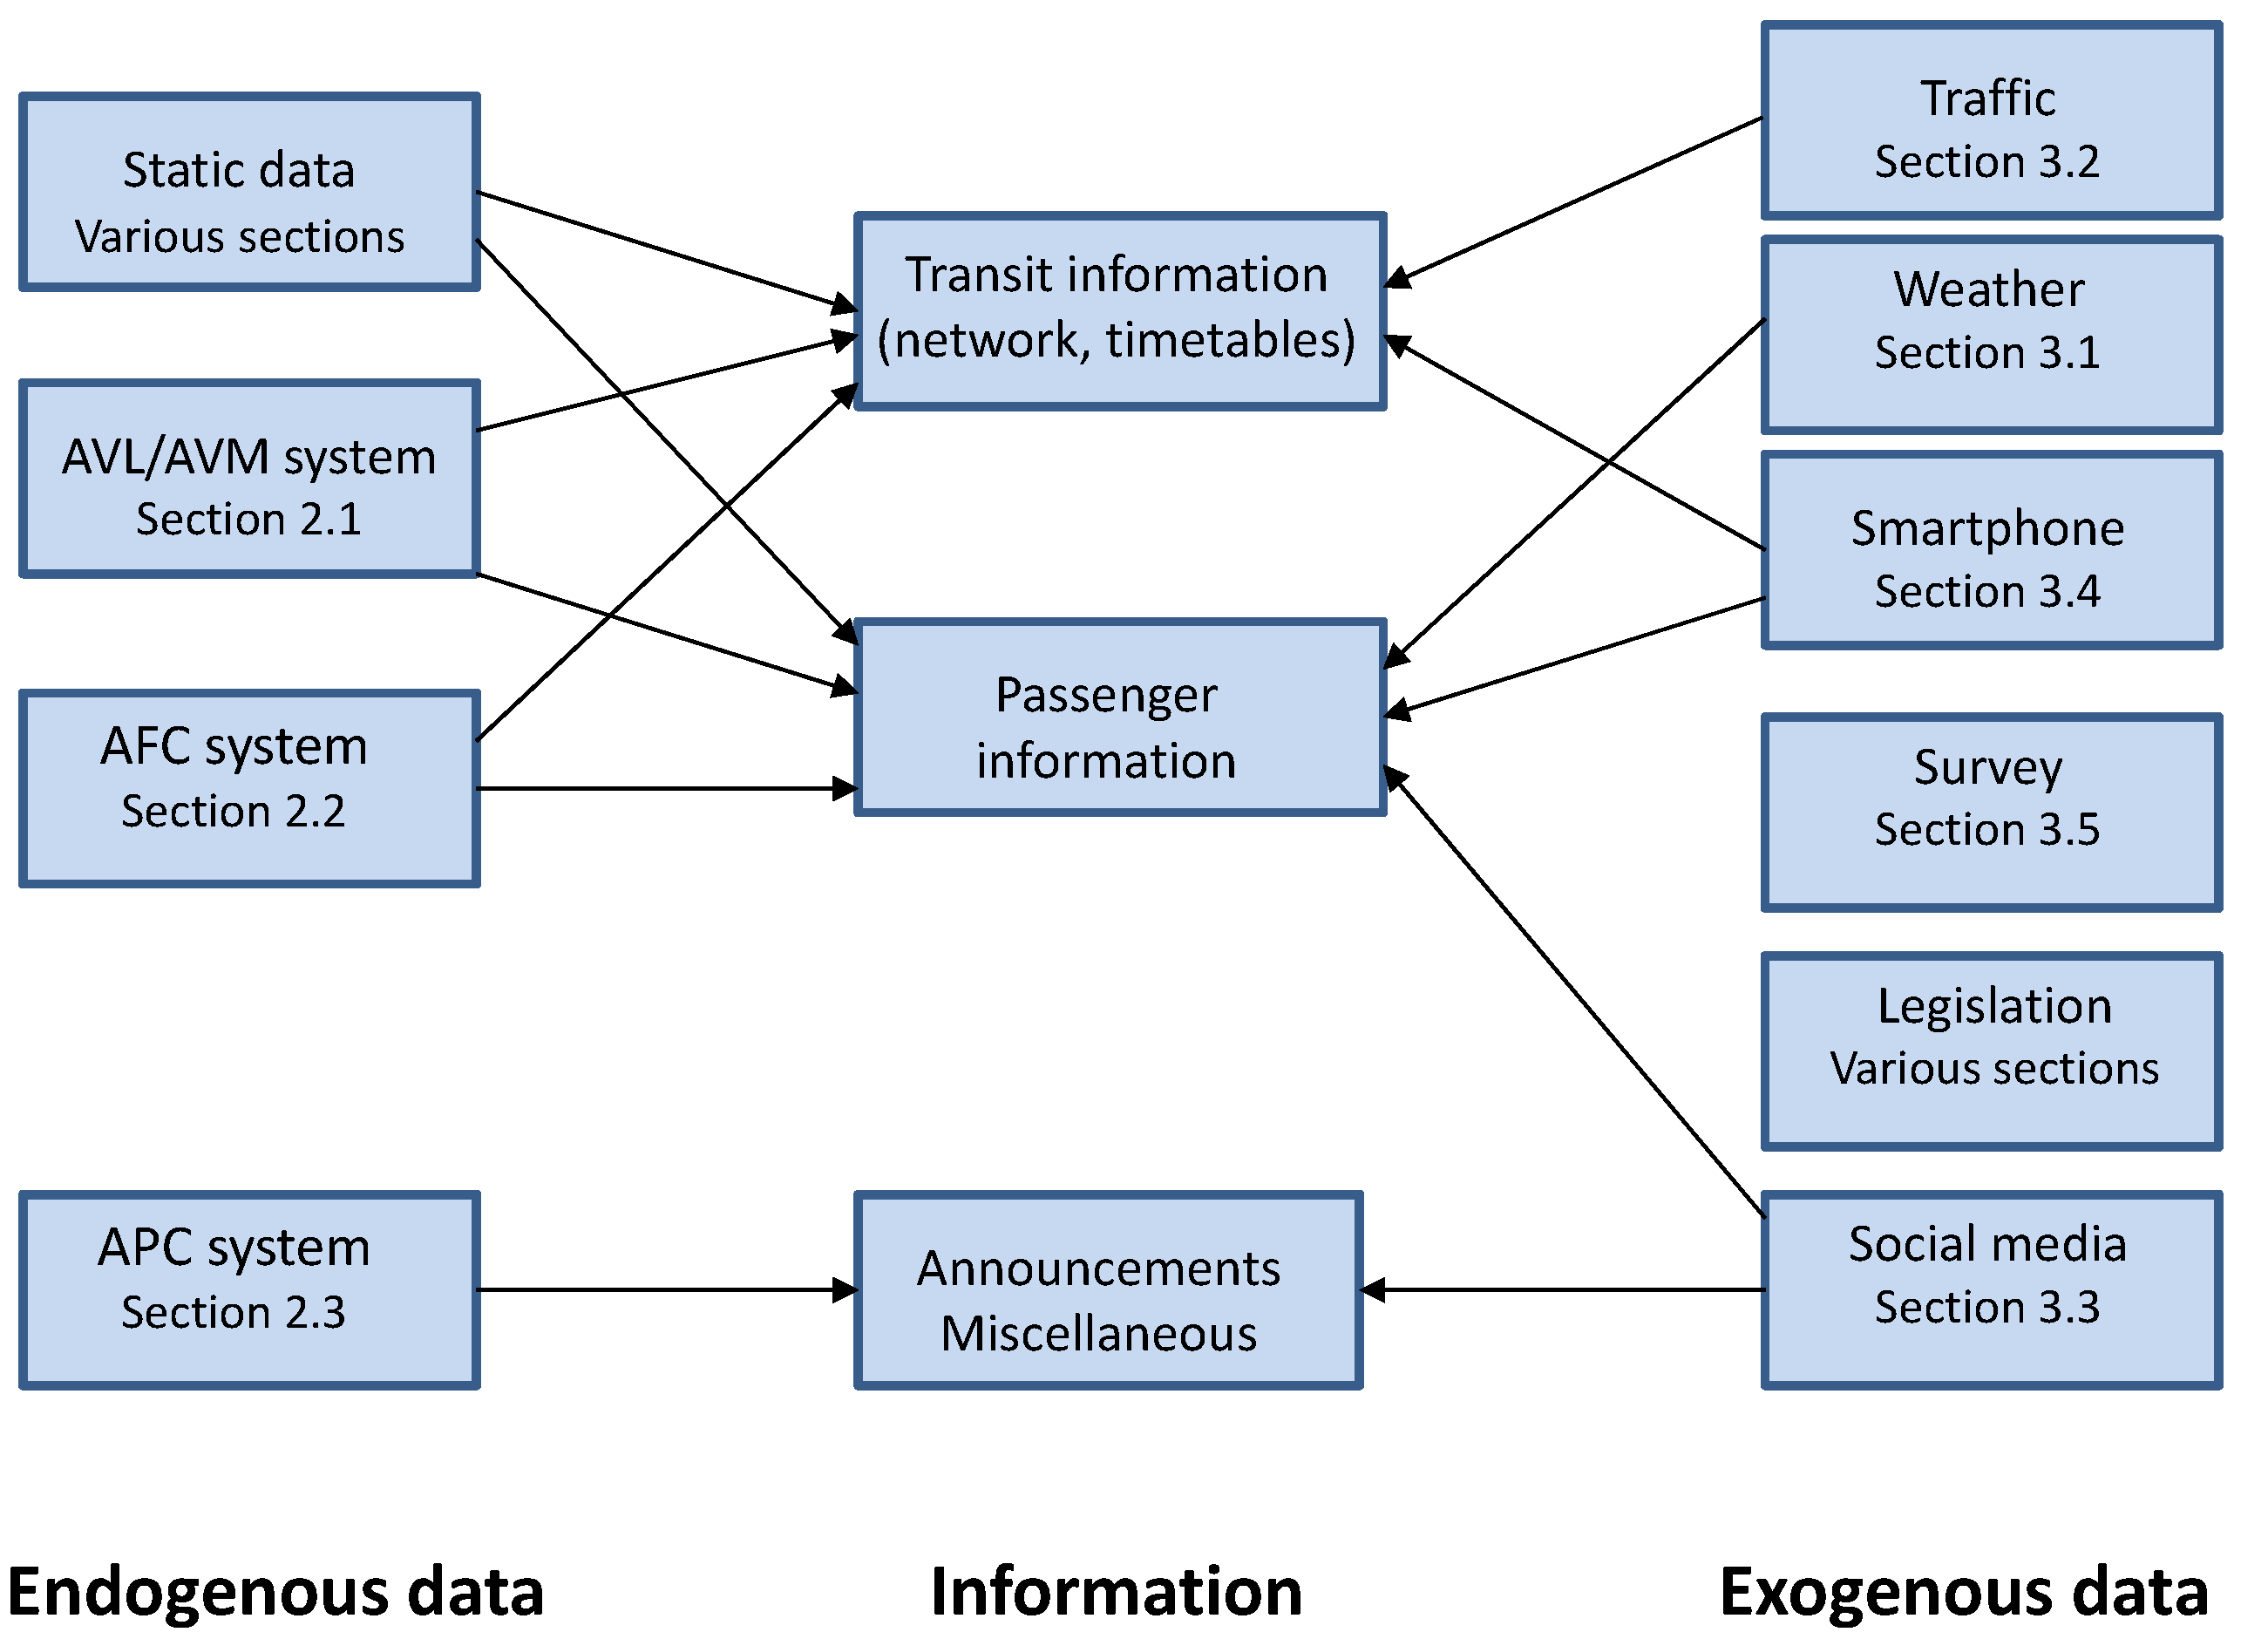
2. Endogenous Data Sources

In this section, we provide an overview on possibly relevant internal data for various stakeholders, as well as information systems in public transport. A crucial condition for general usage is that these data sources are openly accessible, correct, consistent and updated on a regular basis in order to ensure the functionality and reliable use and related output of respective information systems. The purpose of these data may be interlinked with supporting operations, knowledge about the public transport system, as well as legal issues, among others. Data may come as static as well as dynamic data, where the focus in the sequel will be on the latter. Note that the term dynamic data mostly refers to data changing dynamically, i.e., over time.
Our primary interest refers to AVL, AFC and APC as represented in the next few subsections. Beyond that, additional endogenous data may be utilized, as e.g., indicated in [18], who investigate the use of data on link flow, destination count and/or average travel distance. A case study is provided for the London Piccadilly underground line (United Kingdom).

2.1. Automatic Vehicle Location

AVL systems are computerized vehicle tracking systems that work by measuring the position of each vehicle in real time and relaying that information back to a central location. AVL systems collect the location of vehicles generally by broadcasting the values of the sensors at a very short periodicity (most often between 10 and 30 s depending on radio capability). For doing so, many technologies could be used for AVL (sometimes also called automatic vehicle monitoring—AVM). Examples of such technologies are GPS, signpost and odometer interpolation, ground-based radio and dead reckoning. For more information about the technological aspects, which led to the introduction of AVL, the interested reader is referred to [19]. In fact, their detailed description is beyond the scope of this paper. We should mention that some technologies, which have been important for a while, have a diminishing importance today. We note here that GPS currently seems the most used technology in the western hemisphere ([20]). The GPS system works through a network of orbiting satellites that transmit signals to the ground. Special receivers on each vehicle read the available signals to determine their position [21]. Then, the geographic location (often measured by latitude and longitude), along with the date, time and other operational data, are distributed to various stakeholders, e.g., transport companies or even a transit agency. Note that in most papers, nowadays, as compared to the 1990s, we do no longer find a distinction between differential GPS (DGPS) and GPS (as a United States-based system). Formally, DGPS was introduced to achieve an improved location accuracy by not only using satellites but also ground-based reference stations. More recent developments include further satellite-based systems, notably including Glonass (a Russian system), Galileo (a European global navigation satellite system (GNSS)) and BeiDou (a Chinese system). A few references focusing on various transportation-related issues regarding these systems include [22,23,24,25,26].
The main purpose of adopting AVL systems is to allow agencies to remotely track the location of their vehicle fleet, e.g., using the internet. In fact, these data are a potentially rich source of information on actual fleet operations and are commonly used, particularly for the evaluation of transit services. In the following, we summarize available applications.
First, we note that the importance of introducing real-time AVL has long been recognized. For instance, about a quarter-century ago, Ref. [27] illustrate how AVL could be integrated with static data and discuss fundamental aspects of passenger information systems integrating it. Furthermore, Ref. [28] illustrate the importance of tracking bus locations to enable real-time control of the timed transfer. Additionally, AVL is a necessary feature to maintain reliability. Ref. [29] presents a methodology to measure reliability via AVL. Ref.[30] emphasize that AVL, along with other data sources, could overcome on-board surveys that were the traditional way of assessing transit services. Over the last decade, more and more research in this area has been appearing. In [31], an approach is proposed that leverages data from an AVL system to improve transit on-time performance. Ref. [32] presents a methodology for identifying bus stops that do not meet performance standards for on-time performance and factors that cause under-performance. A more advanced approach is proposed in [33] for the same purpose, which aims to characterize bus stops for routes in which reliability is insufficient along with their causes to provide preventive strategies. This work has been extended in both [34] and [35], in which the concept of punctuality is introduced instead of reliability. The main difference, according to the authors, is that the former additionally takes into account the arrival time of passengers. In particular, in [35], the authors propose a web platform to support transit managers evaluating their service. In [36], the authors adopt another approach for delay analysis which aims to detect the stops most vulnerable to delays in order to propose delay reduction interventions.
Ref. [37] propose an approach that leverages the bus vehicle location to improve the reliability of bus services by prioritizing their signals. Their approach consists of the use of connected vehicle technologies and the implementation and an adaptive optimization model of signal synchronization. The authors of [38] are also interested in the optimization of transit based on AVL data.
Regarding the validation of the AVL data, this issue could be addressed by improving and investing in the underlying technology (e.g., GPS) and extracting the most accurate information from it. Ref. [39] consider the problem of reconstructing vehicle trajectories from sparse sequences of GPS points. For more information on validating AVL from a technological perspective, the interested reader is referred to [40].
Other AVL validation solutions could also be effective. For example, in [41], Google researchers aim to match observations of the trajectories of transit vehicles with the routes they serve, in order to detect travel changes using a scoring method. The issue of AVL data validation could be studied more generically by detecting anomalies for the sensor data (e.g., [42]).
In Table 1, we summarize the current work on the AVL. More precisely, we highlight for the main papers above the aspect of application, the adopted methodology as well as their potential which reflects the main contributions and findings. In Table 1, the papers are sorted in chronological order to give an insight into the evolution or work for the data source. Moreover, some aspects not highlighted above (e.g., the methodology adopted in each paper) are given.
At the end of this section, we notice that the AVL is a widely adopted data source that allows to track and improve the transit service. However, in general, it is not primarily aimed at analyzing passenger behavior. That is, even if AVL data could have an impact on passengers (e.g., they could change their travel decisions if they are informed of delays), the ability of AVL systems to directly and individually extract passenger behavior is limited. Additionally, AVL data could be improved by adopting other data sources. Furthermore, in some cases vehicle positions are not available and other types of data could be adopted to replace them (beyond a weak radio network connection in rural areas, this could even happen if tunnels are equipped with WLAN technology).

2.2. Automatic Fare Collection

First of all, we note that the smart card technology is the core technology for AFC implementation. It has been adopted in significantly high numbers for transit systems since 1990 ([43]). The referred paper highlights some advantages of using this technology over traditional payment options. In particular, one of its main benefits is that it presents a rich source of data (beyond benefits one may also consider behavioral issues arising, e.g., if cash is diminishing or discarded). Indeed, when a passenger taps on the card at a station, their information is recorded in the AFC system. In other words, AFC provides information on passengers paying with a smart card or other forms of electronic tickets. We should mention that a more recent review on this is available [44], though without attempting to put themselves into perspective regarding [43].
On the one hand, with regard to the technology associated with these data, we note that the last years have seen considerable progress in the design and capabilities of fare payment, media and equipment and that this progress is continuing rapidly. In [45], the authors review and assess emerging trends and developments related to fare payment and collection technology (magnetic stripe and smart card technologies). A more recent overview of current technologies for AFC with their comparison can be found in [46] and a recent review of the fare evasion literature is provided in [47]. The claim that surveys or questionnaires may be overcome by related data issues is supported by [48] regarding fare evasion estimation for a case of Lyon, France, using fare collection data, fare inspection data and counting data.
On the other hand, when it comes to data, which is our main focus here, we note that acquiring travel information from smart card data is a growing trend. It becomes clear that a large part of the work on public transport data sources includes this type of data. Indeed, many researchers aim to obtain information at a very low cost and smart card data fulfills this need as it provides valuable information for the analysis of both the demand and the transit service. In fact, by analyzing the literature, we notice that AFC is mainly tailored to study the behavior of passengers and the characteristics of public transport demand. However, it could also be useful for other purposes, including the analysis and assessment of transit services, as emphasized in [43]. The referenced paper summarizes the different applications of AFC data on the strategic, tactical and operational level. As a matter of fact, AFC data could provide information on passenger demand and a behavioral passenger analysis at the strategic level, while it could provide information on the evaluation of transit service at the tactical and operational level. One of the most important applications relates to spatio-temporal data and implied mobility patterns of passengers. Given data security issues, it may be difficult to measure both the long-term mobility and stability of transit riders’ travel patterns. To accomplish this, e.g., Ref. [49] investigate a metric for measuring the similarity of smart card data over time (providing evidence for distinguishing regularity and infrequency over a time period of five years for smart card data of Beijing). Furthermore, parts of the recent survey of [50] largely focus on smart card data use.
First, with respect to passenger behavior and demand for public transport, we note that they have traditionally been estimated by surveys. However, surveys could be unreliable and people-biased. Further, it is more difficult to combine them with other exogenous data sources (e.g., weather, traffic; at least most references with questionnaires in public transport do not provide information on weather data or make that attempt to provide related information about the time when the survey was conducted leaving the lessons learned somewhat restricted - some exceptions are mentioned below), unless the appropriate processing tools are adopted (Section 3.5). Indeed, it has been pointed out in many papers that smart card data goes beyond traditional survey approaches by providing more complete and comprehensive information for public transport (e.g., [51]). Despite the existence of survey data that attempt to provide detailed and complete information (e.g., Hamburger Verkehrsverbund (HVV)), they have to be updated frequently and they are resource-consuming. Smart card, as an alternative, makes it possible to deduce information on the various passengers (most often via their card numbers). Appending this by means of the mystery shopping concept is mentioned in [52]. Mystery shopping is a marketing method intended to measure the quality of the service and to gather other related information. Note that various transport companies provide an annual customer satisfaction report; see, e.g., Ref. [53] for the HVV in the city of Hamburg, Germany or [54,55] for the city of Qingdao, China. This may even be available without the existence of smart card data or such data being used.
Regarding the literature on this topic, Ref. [56] use smart card data to measure the extent to which public transport users change their behavior over time. We note that different methods have been adopted to process AFC for the aforementioned reason. For instance, Ref. [57] propose a stochastic methodology that analyzes travel behaviors using real-time smart card data from an AFC system that reflects the characteristics of transit users. Another approach for grouping passengers according to their temporal habits is presented in [58]. In [59], a methodology is developed to relate disaggregated AFC trip data to published timetables for the purpose of studying passenger incidence behavior. In [60], an index is set to quantify the range of preferences of users who always choose to take the same route.
In general, the analysis could be carried out for different modes of transport (both rail and bus). However, some of the work could be tailored to a specific mode. In [61], the authors analyze transit demand in order to propose customized bus services. Ref. [62] focuses on the detection of home location and travel purpose for cardholder subway passengers. We should note in passing that other modes of transportation allow even more comprehensive analyses (especially in the sharing economy; see, e.g., Ref. [63] for bike sharing).
In particular, many papers use AFC data to derive the origin-destination (O-D) matrix. Such a matrix aims to build models of travel demand and to quantify transport demand between geographic regions of a city, which are also used in the analysis of travel behavior. Here again, AFC data represents a useful alternative to household and on-board passenger surveys as illustrated, for instance, in [64]. In fact, the authors argue that household surveys can significantly underestimate demand and that AFC data needs to be complemented. In addition, Ref. [65] carry out a comparison with a large O-D survey in the city of Santiago, Chile. The authors aim to validate the results of the survey and they identify certain errors by combining AFC and AVL data. Refs. [66,67] present two different methodologies for estimating the destination of passenger journeys from AFC data.
In the event that the boarding location is available (e.g., in combination with AVL data), this information can be distributed spatially over a network. We note that this is among the advantages of AFC beyond surveys as illustrated, for example, in [51], which aims to understand the spatio-temporal dynamics of passenger travel behavior in the context of a public transport network. Ref. [68] propose a trip-chaining method which uses AFC and AVL data (provided in the General Transit Feed Specification (GTFS); see [69]) to infer the most likely trajectory of individual passengers in transit. The same problem is also addressed in [70]. In [71], a method is proposed to model mini-activities within the framework of the generated trips, by mixing the trip history and the recommendations of the trip planner.
Second, with respect to transit service, smart card systems can be used to calculate specific performance indicators on a transit network, like schedule adherence (it can be estimated by comparing the boarding times given by the AFC at given stops with the route schedule). An example of a paper using these data to assess service reliability can be found in [72].
More generally, we note that there is a strong connection between the different applications described above. In fact, the O-D matrix relies on the passenger behavior, which depends on the transit service. Hence, some studies are interested in investigating these different issues simultaneously. For example, Ref. [73], using AFC data, identify and process observations of travelers’ route choices between the same O-Ds under different travel environment conditions. Moreover, in [74], smart card transactions are used to gain insight into the trade-offs between travel time, transfers, waiting time and congestion in the choice of public transport routes, based on revealed preference data. In general, we can state that AFC data can be used to infer trip purposes and to reveal travel patterns in an urban area. As an example among many others, in [75], a case study demonstrates the process of trip purpose inference based on smart card data for a case study in the United States. Case studies for Nanjing (China) metro allow us to recognize congestion areas, as well as commuting characteristics of residents [76]. In a separate analysis, this also leads to a characterization of the jobs–housing ratio for various districts of the city [77]. Similarly, one may also detect areas of specific home and work places. A case study for London (United Kingdom) is given in [78]. Beyond classical methodology, current developments in data science and data mining allow more in-depth investigation and analysis. For instance, dynamic time warping can be used for comparing different classes of time series data. A case considering an application for Gatineau (Canada) is provided in [79]. The most recent and also most interesting study relates to a case for Taipei (Taiwan), provided in [80]. The authors utilize data from the local AFC smart card system EasyCard for obtaining spatio-temporal station-to-station metro trip patterns. Study results for a time period in 2019 are compared to the modified magnitudes of passenger travel within the same time period of the very early stage of the recent coronavirus pandemic, indicating implied spatial and temporal heterogeneity. A major benefit of this study is that all data used are freely available as open data.
In particular, one of those issues depending on both passenger behavior and transit service is the waiting time. AFC could also be used to estimate passenger waiting times as in [81]. Moreover, Ref. [82] record the trips using AFC data and then aim to identify factors affecting passenger waiting times. Another work which aims at analyzing both travel demand and public transport service is [83]. The authors propose to cluster smart card data from passenger-oriented (travel demand) and station-oriented (transit service) perspectives.
Another important issue in public transport is how to deal with disturbances and disruptions [84,85]. AFC is also used in studying this problem and, in particular, the impact of the pandemic. In fact, smart card data could help understanding the impact of COVID-19 and mitigate its impact, as illustrated, for instance, in [80,86,87].
We note that AFC could also be adopted to estimate AVL data. The aim of [88] is to develop an approach that uses AFC data to estimate passenger boarding information and, hence, vehicle location. On the other hand, there are persistent issues regarding the use of smart cards for public transport.
First, the problem with AFC systems is that there is a lack of standard. In fact, the TRB is calling for the establishment of a standard format for card data so that each agency stores data in the same way ([89]). The problem of lack of standardization is also emphasized in the World Bank reports (e.g., [90] for the case of Poland). Therefore, a number of authors are interested in this issue. For instance, Ref. [91] propose a common conceptual framework based on currently available technical standards and implementation procedures, which can be generally applied to share smart card data between different transit agencies. Second, data privacy and security is an issue that needs to be addressed. In Section 4.3.3, we delve into this issue. Third, the validation of AFC data is still an issue that could be further explored. In fact, although it is more trustworthy than traditional surveys ([92]), the data are not free from errors. In fact, as pointed out in [93], it might frequently underestimate the number of passengers due to potential scammers not purchasing tickets or having invalid ones. In addition, smart card data are criticized for not providing accurate knowledge of passenger volumes and not being able to track both the origin and destination of passengers (for fare systems in certain regions and countries). Thereby some works have been proposed in this regard. For instance, Ref. [94] focus on AFC cleaning and claim to be able to identify abnormal passenger behavior by tracking and comparing the frequency of occurrence of passenger cards, which reflects an AFC system error. However, to do this, the authors also underline the need to enrich these data with other sources in order to have a better analysis. Therefore, APC is considered to be a more representative data source, as highlighted, for example in [2] and is the subject of the next section.
In Table 2 we summarize, as in Section 2.1, the work on the AFC data source. In Table 2, we additionally have put the column “Data” which highlights the previously mentioned data source associated with each paper (if no other data source is involved in the study, the sign “-” is displayed in the column).

2.3. Automatic Passenger Counting

APC works with a device installed on transit vehicles that counts the number of passengers, most often boarding and alighting at each stop. These data, along with location and time information, can provide useful information. APC data have an advantage over AFC data as they are ticket-independent, though they are also automatic. In fact, the importance of this data source is recognized in a number of studies. One of the earliest documents that highlighted APC’s opportunities and challenges to 2008 is [96]. Ref. [97] also finds that by using vehicles equipped with APC, agencies could improve their performance. In most cases, these data are combined with AVL to improve transit service. [98] extend their previous work in [28] and find that control strategies could be improved by combining passenger tracking and counting technologies (i.e., APC and AVL). Below, we underline influential work published after [96].
First, Ref. [99] propose a method combining AVL and APC to estimate the mean and variance of transit vehicle delays caused by signalized intersections. Second, we note that the use of these data is more challenging than AFC and AVL. That is, unlike both of them, which often consist of structured data, APC is noisy in many cases and hence extracting useful information is not straightforward. Thus, a number of papers have been proposed for this purpose. Indeed, it is crucial to ensure an accurate passenger count as inaccurate data in this regard can obstruct other information.
Before addressing the challenges, we note that there are a number of counting techniques that aim to calculate, for example, the number of passengers boarding and alighting at each station or the number of passengers in a vehicle at a specific time. With regard to the first case, it can sometimes be difficult to differentiate between passengers alighting from the inbound trip and passengers boarding to the outbound trip. Such data are important for determining the number of passengers at each station. Another problem with respect to the O-D estimation problem is to distinguish between inherited (from a previous trip) and left behind (to a new trip) passengers. In general, these issues depend on each case study. For instance, the method proposed in [100], which exploits weighing systems, is not practical in that case, but it is useful to control braking in rail systems, which is the purpose of their paper.
Another issue is to match APC data with AVL, especially for buses that do not have a specific stop location (one bus may stop at a slightly different area of the station if its position is occupied by another vehicle). Ref. [101] aim to provide a framework for solving the problem of APC data correspondence with the bus stop. The authors are also interested in data validation and anomaly resolution. They divide APC data anomalies into operation in service and technical problems. The former concerns service problems (e.g., unforeseen breakdowns, interrupted journeys) while the latter could correspond, for example, to non-logical values (e.g., imbalances between boarding and alighting on an entire journey), which means that a technical problem has been encountered.
As the proposed methods need to be validated, benchmark data are very useful. Ref. [102] claims to present the first large-scale benchmark public data set for video-based approaches to passenger counting. This data set contains recorded depth videos acquired with a specific camera containing the red, green and blue (RGB) color combination and depth sensors. (The data set is available in https://github.com/shijieS/people-counting-dataset (accessed on 13 June 2021)). Additionally, the paper presents a method for real-time counting people in crowded scenes and evaluates the performance on the proposed data set. Other papers focus on improving people counting in a generic way and on proposing technologies for this purpose (e.g., [103]).
The methods highlighted above aim to exactly compute the passenger volumes. Other works intend to estimate them using machine learning (ML) and statistical methods. Regarding the former, Ref. [104] present a passenger counting system that combines a conventional neural network detection model and a spatio-temporal context model to address the counting problem in low-resolution scenes and with a varying illumination. Regarding the latter, in [105], the average passenger boarding and alighting time at stops (in addition to the bus dwell time) are explained using descriptive statistics. Other estimation and modeling approaches could also be used in this regard. For example, Ref. [106] use a mesoscopic assignment model for short-term predictions of transit on-board loads by considering predictive information about vehicle crowding.
Regarding statistical approaches, we note that statistical tests are also suitable for validating APC data. Ref. [107] adopt a revised and extended t-test to validate APC systems. We also note that the validation of the APC data could be performed simultaneously with the AVL data. Ref. [108] adopts a performance assurance methodology to identify unreliable archived AVL-APC data.
In Table 3, as in Section 2.2, we summarize the work on the APC.
At the end of this section, we note that APC systems, despite their great advantages, do not enable obtaining information about the different passengers (e.g., senior vs. student) as in AFC. On the other hand, in addition to these internal data (AVL, AFC, APC), other external sources could provide a valuable source of data. In Section 3, we are interested in this type of data.

3. Exogenous Data Sources

In this section, we are interested in exogenous data sources, which are: weather, traffic, social media, smartphone and survey data.
While academic research often utilizes restricted field study data, more or less official data are available if one searches for them. Beyond statistics accessible through GTFS, also other sources are available on various levels. While many of them are commercially available (see, e.g., https://de.statista.com/statistik/kategorien/kategorie/16/themen/2368/branche/oeffentlicher-personennahverkehr/ as an example for Germany; accessed on 13 June 2021), others are freely obtainable (see, e.g., https://www.destatis.de/EN/Themes/Economic-Sectors-Enterprises/Transport/Passenger-Transport/_node.html as an example for Germany; accessed on 13 June 2021), also public transport service providers themselves provide these data, often for free or a nominal fee.

3.1. Weather

First, weather is another source of data that, while important, has not received much or the appropriate interest in recent reviews. In fact, it is widely recognized that adverse weather conditions have an impact on both the demand and the service of transit. As regards the former, passenger behavior could be affected by adverse weather conditions. For the latter, they can change the frequency of the service, or in the case of extreme events they can cause its cancellation. (Agencies could have a specific plan as, e.g., in New York: http://www.mta.info/press-release/mta-headquarters/mta-issues-update-preparations-tropical-storm-isaias (accessed on 13 June 2021)).
From a transportation agency’s perspective, weather conditions are seen as exogenous factors that must be monitored to react when needed. For this reason, it is of utmost importance for agencies to take advantage of the available technology, which has been developed in recent years, to extract weather conditions in real time. Indeed, real-time weather information is valuable in many fields and is beneficial to both individuals and businesses. Thereby, many application program interfaces (APIs) have been proposed. An API is a set of instructions that allows software programs to interact with each other ([109]) and they are used in this context to extract meteorological information in real time. Moreover, many technology companies are investing in developing technologies or algorithms to detect even the smallest climate change. In addition, a number of web scrappers have been developed in many languages. An instance of such languages is Python. A practical example can be found in https://medium.com/@dd93/collecting-weather-data-to-boost-data-science-models-with-selenium-390d9db88210 (accessed on 13 June 2021). Weather APIs could provide detailed information on different weather elements including temperature, precipitation, humidity, wind, to name a few. For a list of some of the most popular APIs, we refer to: https://medium.com/rakuten-rapidapi/if-youre-looking-to-build-an-application-using-weather-data-then-you-ve-come-to-the-right-place-ae2115f2c61f and https://openweathermap.org/ (accessed on 13 June 2021).
From an academic perspective, there are a number of papers which have adopted weather data for public transport purposes. More precisely, in many papers the aim is to analyze the impact of weather on public transport and then come up with ideas to avoid or mitigate its impact. For example, Ref. [110] study the impact of weather conditions on transit ridership using time-based and station-based models. The authors claim that their proposed models could help reducing the impact of adverse weather conditions.
It is noticeable that, although affirmed in some papers (e.g., [110,111]) that weather disturbances have a negative impact on transit ridership, such an impact varies for the different modes and the initiatives of the transport associations and agencies towards their use under adverse weather conditions. For instance, Refs. [112,113] both suggest that the subway is less vulnerable to inclement weather and can replace other travel modes in this case. However, prevention measures are needed so that the subway system can cope with the threat of heavy rains. Regarding buses, Ref. [111] also claim that the installation of bus shelters can reduce this impact. For a survey on disturbances in public transport including weather-based ones see [84].
We can conclude that the impact of weather depends on each zone, each city and its public transit service. Moreover, it depends on the meteorological nature of the region and the weather disturbances. Indeed, it is shown, for example in [114], that precipitation-related events contribute more to fluctuations in ridership than temperature-related events. In [115], regression models are developed that aim to understand the impact of weather factors on daily bus transit ridership and find that some of these factors are significant while others are not. Weather impact also depends on the nature of the population and economic activities, such as work and schooling. According to [116], weather conditions have a significant impact on students’ commute mode choices. The difference also depends on the purpose of the trip (e.g., leisure, shopping and personal business) as stated, for instance, in [117].
More generally, we note that these data could be analyzed within the entire urban transport system. One of the main breakdowns of the impact of weather conditions on transport concerns the choice of travel mode. This problem is mainly related to public transport as it affects the demand for public transport and the behavior of passengers. In other words, weather conditions lead passengers to switch from private modes to public transport and vice versa. Examples of such work could be found in [118,119]. Additionally, Ref. [120] are interested in analyzing passenger behavior from an emotional perspective.
Other data sources could also be adopted and coupled with weather data to estimate their impact. The traditional way of doing so is through surveys. For instance, Ref. [119] analyze the impacts of weather and seasonality on commute mode choice using a survey in which the passengers indicate their preferences. A survey is also carried out in [112] to achieve the results described above. Ref. [121] reports on the collection of smart card data for public transit and weather records from Shenzhen, China. The data make it possible to establish an association between the use of public transport and weather conditions on an hourly basis and for each metro station, with certain limits. The integration of smart card and weather data has also been proposed in [122]. Regarding AVL, Ref. [123] use it to study the effect of weather conditions on the reliability of the travel time of road and rail transport, using a case study of the Melbourne tram network.
In Table 4, we summarize the work on the weather data source as in the previous sections. From all these sources, as indicated above, it becomes clear that weather conditions can be differentiated into various dimensions without being able to draw a unique conclusion. Especially the transport mode, different framework conditions due to the infrastructure (e.g., bus stations with or without shelter, public transport vehicles with or without air conditioning), customer type (e.g., blue-collar versus white-collar workers, students, elderly, handicapped, tourists) and behavior, the type of weather-based events (e.g., temperature, snow, rain and extreme events, such as storms), location and time can lead to very different outcomes. A clear-cut mode choice by customers under certain circumstances cannot be deduced in general but relates to the mix of these dimensions. For instance, the implied change of mode from passengers under certain circumstances is not always beneficial to the different stakeholders.

3.2. Traffic

Traffic is another exogenous data source impacting public transport. First, we note that the inclusion of traffic data in the design of public transit services started a while ago (e.g., [124]). However, in that paper, the objective was to model the traffic of a transit fleet (for the metro line). Such an application is no longer of interest with current technological advances regarding endogenous data sources. Today, interest has shifted to modeling and estimating external traffic information.
From a technological side, traffic data in general exploits data collected from fixed sensors placed in the road, such as circuit cameras, video recognition cameras, infrared sensors and radio frequency identification (RFID) sensors, but also floating car data (see below), etc. For a better understanding, we should note that RFID tags can be classified into two categories as being passive and active. This distinction depends on whether an internal power source is used to power the devices and to perform the broadcasting or data exchange. Similarly, as done for the weather data, we note that a number of APIs have been developed to extract traffic data. Examples of such APIs could be found in https://towardsdatascience.com/visualizing-real-time-traffic-patterns-using-here-traffic-api-5f61528d563 and https://towardsdatascience.com/scraping-live-traffic-data-in-3-lines-of-code-step-by-step-9b2cc7ddf31f (accessed on 13 June 2021).
From an academic perspective, many initiatives have been proposed in recent years to advance research in this field. The main application of these data in public transport is the estimation of arrival times of buses. Indeed, it is well known that traffic is one of the main causes of bus delays and some papers aim to improve the estimate of arrival times based on traffic. For instance, Ref. [125] study the problem of estimating travel times on public transport buses with real-time traffic information. Google researchers are also interested in this topic, as their recent work ([126]) shows.
However, regarding these data, in many cases it is not straightforward to extract the necessary information. For instance, a challenging issue in traffic data is to distinguish an incident from a traffic congestion situation. Therefore, many approaches have been proposed to estimate traffic data in different case studies and a number of papers have been proposed in recent years to achieve this goal. By analyzing them, we note that today ML is one of the most-adopted approaches to estimate traffic, as there is a growing interest in leveraging big data sources and technologies to improve traffic estimation. For example, Ref. [127] propose a deep learning-based approach for traffic flow prediction. Other approaches, rather than ML, could be used. In [128], a spatio-temporal approach is proposed to detect traffic jams and incidents in real time by analysing GPS tracks belonging to moving vehicles. This is closely related to the idea of using timestamped geo-localization and speed data directly collected from moving vehicles, as it is known from floating car data (FCD), i.e., this aims at the provision of real-time traffic information services (see, e.g., [129]). Additionally, Ref. [130] propose a hybridization of deep learning and a spatio-temporal approach which, according to the authors, provide a more accurate prediction.
One of the problems for traffic data is privacy. Ref. [131] focuses on the development of privacy mechanisms that would satisfy both privacy protection and data needs for urban traffic modeling applications using mobile sensors.
Conversely, the use of buses has an impact on traffic and it is important that its services help reduce traffic (by replacing taxis and cars). In [132], the aim is to assess the impact of bus operations on traffic congestion in Melbourne. The results indicate that Melbourne’s bus network is helping to reduce the number of heavily congested road links.
In Table 5, we summarize the work on the traffic data source as in the previous sections.
At the end, we note that other available data, mainly social media, could also be used to estimate traffic. This could be found in [127,133], which use deep learning with a different design. In the next section, we give some insights into the use of social media in public transport.

3.3. Social Media

Social media data (e.g., Twitter and Facebook) consist of a collection of social interactions of a huge number of people. It is a valuable resource for public transport analysis. Recently, several attempts have been made to implement social media analysis in the field of public transport. In recent years, social media has shown promise in providing useful information about public transport. Ref. [134] shows some potentials of using social media data to model traveler behavior and examine many opportunities and challenges in this regard; some of the issues included in the paper are mobility, trip planning, location prediction and privacy. In the following, we explore additional issues and other papers not included in this review.
First, social media can be used in public transport by deploying sentiment analysis to reveal public opinions regarding transit agencies. Ref. [135] propose a framework to evaluate the opinion of transit users on the quality of transit service using Twitter data. Another issue is to extract specific information, which captures public attention and has an impact on transit, such as accidents (which are traffic-related). As an example, Ref. [136] adopt social media data to detect traffic accidents using a deep learning approach. Ref. [137] evaluate how a social media platform is used in a case study to provide and share transportation information and respond to inquiries. In [138], the authors analyze travel behavior by modeling the relationship between characteristics of business clusters and check-in activities.
In addition, social media could also be useful for exploiting other data besides traffic (which is highlighted above). For example concerning APC, Ref. [139] illustrate the existence of a moderate positive correlation between the flow of passengers and the rate of publications on social networks. In other words, social media could be adopted to exploit passenger count data.
However, social media data are very difficult to process compared to other data sources. Thereby, there are still several major challenges in handling social media data, which are unstructured, noisy, gigantic and contain a variety of information. We note that the authors, who are interested in using social media data, adopt advanced approaches, such as ML or hybridization of different methods, as can be seen in Table 6, which summarizes the work on this data source.
At the end of this section, we note that the GTFS real-time specification [140], which is managed by agencies, could include alerts in the ‘service alerts’-type of information. However, to the best of our knowledge, such an initiative has not yet been explored.

3.4. Smartphone

The smartphone is a technology that offers a recent way to track the individuals’ travel data, which could help in particular to track the mobility and passenger behaviors in transit systems.
From a technological perspective, as underlined in [7], we emphasize that GPS, Wi-Fi, accelerometers and Bluetooth are among the key ingredients of this data source. In [141], a random forest is adopted, which is a ML model, to leverage Wi-Fi and Bluetooth data in order to predict transport mode choices.
Regarding the applications, some are highlighted in [7]. There are also other applications available. For instance, Ref. [142] design a mobile crowd-sourcing approach to collect shared bus data, in order to optimize their routes. Another related approach, namely crowd-sensing, is used in [143]. The proposed approach consists of using the different mobile data to recommend the best cellular operator for each user.
In general, smartphone data could be an alternative to endogenous data sources (e.g., AVL and AFC) as it could enable the option of ‘tracking and tracing’ passengers ([144]), especially in cases where there are no GPS data available (which is the case in many developing countries, e.g., because of missing infrastructure). Moreover, as for AFC, it could enable estimating the waiting times ([145]). However, one of the issues, which appears with such an emerging data usage as in social media, is privacy ([146]). This is an issue that could be studied more broadly in the internet of things (IoT) domain as in [147]. One approach to preserve privacy is by encrypting the data. Such an approach is included in [148], which is tailored to recommendation services.
We note that the study of the use of smartphones could be carried out in the field of transport in general, as these are common opportunities and challenges among different transport modes. For example, Ref. [149] insists on the natural promise of the use of smartphones in a travel behavior study (in our case, the behavior of passengers in transit). In addition, they could be used to inform passengers of relevant changes in transit service in the best way as discussed in [150].
These data could also be integrated with other data. For example, Ref. [151] aim to aggregate human activities deduced from mobile phone positioning and social media data, in order to analyze their impact on urban functions using a hidden Markov model-based approach. They can also be used to validate other data sources. For example, concerning AVL data, in [152], a real-time positioning method, which employs crowd-sourced positioning data obtained from smartphone GPS, is developed with the aim of improving vehicle-positioning accuracy. The aim to integrate AVL and smartphone data to estimate the O-D matrix can also be found in [153]. In all these cases, a disclaimer regarding data security seems necessary; see also Section 4.3.3.
The studies considered on this data source are summarized in Table 7.
In addition, we note that [155] develop a framework for automated downloading and storage of GTFS data. They publish a curated collection of 25 cities’ public transport networks. The proposed framework contains some interesting features (e.g., spatial and temporary filtering and technical validation). Other examples of extensively using GTFS data include [156,157]. Ref. [158] propose ideas for data analysis regarding the issue of eliminating bus stops and generating a revised bus network under some assumptions while maintaining certain levels of service and consistency, respectively.

3.5. Survey

Survey data are collected from a sample of a targeted audience that took a survey. As pointed out earlier (mainly in Section 2.2), surveys are the traditional approach to obtain information on the demand for public transport. This becomes visible, in addition to the papers referred to above, in the outcomes of conferences and workshops devoted to the use of surveys in transport, such as [5,159], which are also interested in big data sources highlighted above. We should note that our criticism on surveys does not hold for practical settings but for the way many of them are conducted and reported in academia. Moreover, in many cases survey data are also openly available from public transport service providers; see, e.g., Section 5.2.
However, the survey adoption is still in use and could be combined with other data sources. Indeed, due to the variety of factors that influence passenger behavior and the fact that some of these factors (e.g., socio-demographic information) could not be fully represented mathematically and automatically, surveys are still of interest today. Transit accessibility is an example of an application, as some social and behavioral aspects still require further analysis. A survey to deal with this issue is adopted in [160]. Moreover, Ref. [161] like many others, using a survey explores the potential of shifting from cars to public transport.
In particular, we note that surveys are main ingredients of the census data which are widely used in different studies including public transport. Census data are useful open data which help to include the socio-demographic factors in the analysis. In [162], the equity of transit accessibility of different cohorts is studied. The authors highlight the inequities using census data. In [86], census data, acquired through a survey, are adopted along with other data (e.g., GTFS) to examine the impact of COVID-19 on ridership based on socio-economic disparities. To do this, the authors examine the relationships between the impact of ridership and the explanatory socio-economic factors. The combination of census and GTFS data is also adopted in [156] to try to measure the gap between supply and demand (which is highlighted in the introduction).
Another reason for the persistence of surveys is that many agencies do not want to change their habits. However, to cope with the actual challenges, surveys must evolve and take advantage of the existence of new data sources and current developments in technology. As an example, Ref. [52] propose to adopt survey data for a primary study of mystery shopping in public transport and the authors stress the importance of incorporating other data and approaches to enhance the study. In fact, in the previous sections, we separately outlined several problems within these data, which correspond to the issues of reliability (i.e., surveys are people-biased), incorporation and consistency (except a few cases). Additionally, they are resource consuming and need to be regularly updated. As previously stated, these problems could be solved primarily by using other data or supplementing surveys with them. In particular, we observe that the issue of reliability is well studied and often the solutions proposed involve the incorporation of other data to validate survey results. Ref. [163] use smart card data to validate and correct a survey based on a computer-assisted telephone interview. Also [164] combine related data, with the purpose of “understanding” urban mobility. Regarding APC, Ref. [165] present a methodology that can combine APC data with on-board O-D survey data to mutually validate their accuracy. The concept of GPS-surveys, which consist of supporting survey practitioners and researchers with GPS data ([166]), is gaining more attention today, for example in determining the purpose of the trip ([167]). Such an approach is a form of merging between surveys and AVL data.
Other connected issues for survey data are the response rate and the sampling approach ([5]). Indeed, in general, surveys should have a high response rate and a representative sample of the population concerned. However, response rates using traditional tools (i.e., postal, face-to-face and telephone media) are declining. Therefore, the idea of investing enormous efforts in obtaining random samples has been questioned. As a result, new survey technologies are emerging. Indeed, web, GPS devices and smartphones are also used as they are generally less costly. In addition, there is a growing interest in mixed-mode surveys these days. Moreover, gamification is another concept raising in popularity for increasing response rates. In [168], the potential of gamification is explored to potentially make surveys more attractive and engaging. A teaser beyond already mentioned works can be found in [169]. The transport association in Hamburg, Germany, used a modified version of the famous game ´Scotland Yard’ called ´Fang den Fox’ to let people learn about the public transport system. The aforementioned works on the survey data are summarized in Table 8.
On the other hand, big data sources could also benefit from surveys. In [8], it is stressed that they need to be supplemented or validated using conventional travel surveys and [170] focus in particular on travel behavior and provide insights that combine both household travel surveys (named small data) and big data.

4. Data-Driven Implications

In the previous sections, we separately highlighted several data issues that are crucial for data-driven decision making. The aim of this section is to further explore these data issues and provide a data-oriented unified view of the data sources, in combination with possible options for their data-driven implications. In other words, we highlight the main data issues that need to be addressed for the effective and efficient use of data sources while highlighting their potentials, challenges and merging issues with respect to each type of data. More specifically, we underline several issues with regard to the acquisition of data sources, their integration, their processing and their exploitation.
From a more technical perspective, we might need to specify some detailed issues, such as data formats. Examples include the following, without going too much into detail: Text files which use commas for delimiting are called comma-separated values (CSV) file. Each line of a CSV file with one or more consecutive fields is a data record. As an example, the attempts of many companies to visualize their efforts in being in time are made public; see, e.g., the Zurich (Switzerland) data available as CSV files under various webpages including https://data.stadt-zuerich.ch/dataset/vbz_fahrzeiten_ogd_2019 (accessed on 13 June 2021). Extensible markup language (XML) is a markup language defining a set of rules for encoding documents in a format being both human- and machine-readable. JavaScript object notation (JSON) is an open standard file and data interchange format that uses human-readable text to store and transmit data objects consisting of attribute–value pairs and arrays. Common data environment (CDE) is an agreed source of information for collecting, managing and disseminating information containers through a managed process especially in context of digital twins.

4.1. Acquisition

The first data issue is their acquisition. In this section, we look at the main data requirements and issues that need to be considered in acquiring, maintaining and updating relevant information from data sources.

4.1.1. Infrastructure

Regarding data acquisition, we note that some of the data sources, such as weather and traffic, could be openly available and exploitable using the available APIs. As previously stated, while these data can help to partially replace internal data sources, increasing data acquisition capacity will improve the data handling process and addressing various data challenges. In particular, the information extraction regarding the location of vehicles and the number of passengers (AVL and APC) requires appropriate infrastructure (e.g., GPS). For other data sources, interesting options regarding data acquisition relates to available infrastructure allowing the use of smart cards, etc. Mobile phones of customers may be seen as an important infrastructure, as pointed out above. They may be applied, for instance, to produce heat maps. A heat map is a data visualization technique, showing the magnitude of a phenomenon like passenger density in public transport means; see, e.g., [171]. Technically, this may be achieved in different ways including the GPS-based components or, as mentioned, e.g., in [172], by using the related MAC addresses of the mobile phones. Still, data security needs to be kept in mind observing legal constraints. As indicated above, Ref. [102] utilize a large-scale data set for video-based approaches to passenger counting.
Therefore, we can conclude from this part that investment in infrastructure is necessary for data-driven decision making. However, the capacity of the infrastructure varies depending on the budget and the expertise of the agencies. Agencies must then set their priorities to secure the data necessary for a satisfactory transit service.

4.1.2. Storage

Another issue with respect to the budget is data storage. In fact, a challenging issue for agencies is to find a way to efficiently and cost-effectively store the data. Such an issue is rather complicated. As a matter of fact, for real-time traffic data (e.g., AVL) from large developing cities, growth in data storage capacity is behind data growth, as transportation systems need to produce a huge amount of real-time data from the various sensors.
One option that could be exploited is cloud computing. Cloud computing technologies help agencies manage large amounts of storage. In the literature, work on this topic can be considered more broadly in the urban transport system as studied, for example, in [173]. We refer to [174] for a review of several developments in cloud computing. Another option is to use the open data tools available, such as GTFS, which could be a very useful way to manage the storage budget. Although agency involvement is required to provide these data and invest in the underlying technology, research continues to facilitate the use of these tools (e.g., [126]).

4.1.3. Digital Twin

At the end of this part, we note that to improve data acquisition and collection, it is crucial to take advantage of recent developments in data acquisition technologies. The digital twin is an example of an emerging concept that could provide a comprehensive view of the different kinds of necessary information. A digital twin consists of a digital representation of a physical process, person, place, system, or device. It is one of the most promising enabling technologies for digital transformation and it also allows for the merging of different data sources. In particular, the concept can be associated with smart cities, as illustrated in [175], due to the importance of having an increasingly large and accurate building information model to maintain their sustainability. In particular, Ref. [176] are interested in proposing a digital model transformation of rail station buildings. However, despite the fact that practitioners stress the importance of incorporating this concept to improve urban mobility (an example can be found in this post: https://blog.ptvgroup.com/en/city-and-mobility/digital-twins-urban-mobility/ (accessed on 13 June 2021)), no research has focused on leveraging data sources to our knowledge. Examples of information categories that can be exploited concern vehicles (e.g., AVL), passengers (AFC or smartphones), their integration (APC) and traffic.

4.2. Integration

The aim of this part is to underline the main integration aspects involved when merging different data sources. Indeed, it is not enough to obtain and acquire separate data, which could be heterogeneous and inconsistent, from different sources. This is why, today, data integration is one of the main challenging issues when merging data from different sources. In fact, the data are in different forms and in order to be able to combine them, it is necessary to adopt the needed pre-processing tools. In this part, we focus on three issues, namely standardization, validation and matching.

4.2.1. Standardization

First, to avoid an additional computational task for data pre-processing, standardization is a functional requirement that should attract more attention in order to get integrated data. Note that the problem of standardization can arise when it comes to a specific data source as its presentation differs according to agencies (e.g., AFC). Some ideas for dealing with this problem are outlined above (e.g., in Section 2.2). For standardizing different data, a currently growing trend is to exploit and extend the available data formats, such as GTFS and NeTEx (see below). The adoption of these tools is an emerging trend that is evolving quickly and the concept of open data is increasingly embraced by agencies. Nevertheless, currently, these common formats lack simple methods to incorporate other non-standard data to improve analysis. Another issue in this regard is to standardize the various data that are frequently provided from statistical services or public transport agencies, which must take this issue into account when publishing their data. Extending the earlier elaboration, examples can be found in https://www.vdv.de/vdv-statistik-2019.pdfx and https://ec.europa.eu/transport/facts-fundings/statistics/pocketbook-2020_en (accessed on 13 June 2021). We refer to [177] as an example of work in this regard which could be enhanced further.
To go into detail, GTFS can be seen as a de facto standard regarding the definition of a common format for public transportation schedules and associated geographic information ([69]). One may distinguish between static and dynamic data and, regarding the first, a feed is composed of a zipped series of text files. Specific entities of a public transport system make up separate text files, including trips, routes, stops and schedule data, among others. Ever since 2006, this has been developed and is still continuously improved and extended. Google Maps [178] provides a route planner supporting its users to find possible connections based on specified O-D pairs. Public transport is among the usable modes. The system uses data provided by a wealth of public transport providers who make their data available through GTFS.
NeTEx is a technical standard of the European Committee for Standardization (CEN) for exchanging public transport schedules and related data [179]. It is divided into several parts, describing specific functional subsets allowing proper passenger information. Starting with the public transport network topology, we find scheduled timetables, fare information, as well as more general passenger information. Work in progress includes a part on technical specifications. The standard is intended to be a general purpose XML format allowing an efficient exchange of transport data among distributed systems. In that respect it bears quite a few of the German VDV core application data and concepts; see, e.g., [180,181]. A core interest is the interoperability of passenger information systems and related data with the aim to obtain seamless passenger information bridging different modes, regions etc. Various systems and projects have been developed over time including, e.g., the German/European DELFI system (“Durchgängige elektronische Fahrgastinformation”, seamless electronic passenger information; https://www.delfi.de/ (accessed on 13 June 2021)) and many others (see, e.g., [27,177,182]).

4.2.2. Validation

Data validation has an attractive potential regarding the integration of different data sources. Indeed, by integrating data sources that provide similar information (e.g., AFC, smartphones and surveys), their mutual information could be validated. In the previous sections, several examples, which provide effective results, are presented. For example, in [65], the authors aim to validate the results of a survey and they identify certain errors by combining AFC and AVL data. [66] present a methodology for estimating the destination of passenger journeys from AFC data. Concerning AVL data, we have shown in Section 2.1 how to improve vehicles positioning accuracy using smartphone GPS ([152]). Ref. [183] gives insights on the validation of both AVL and AFC data.
The need for data validation is due to the fact that the massive increase in data availability poses many growing challenges with transit data, including their validation, in order to make the most of them. Indeed, different data could be adopted to extract the same information and then used depending on the capacities of the transit agencies, or combined to obtain more reliable information. As a specific example for future research we point towards ML-based (compare, e.g., Section 4.3.2) detection of infrastructure failure. For instance, an erroneous APC system on a bus may be encountered using smart card data and an AFC system.

4.2.3. Matching

In this part, we look at another problem that arises when integrating different data sources on linked information, namely data matching. This could happen, for example, when combining APC bus data with static stop data, as the buses could stop in an area slightly different from their estimated or intended stop. A working example attempting to resolve this problem can be found in [101]. Another issue is to match APC and AVL data as the former could be noisy and unstructured. In Section 2.3, some options on how to deal with this issue are shown.

4.3. Processing

After attaining the data and integrating them, the next step is to process them. In this part, we are interested in the processing of data through their analysis in addition to the issue of privacy which is related to both storing and processing data.

4.3.1. Data Analytics

Over the past decades, approaches to data analysis (or data analytics) have considerably evolved. Thus, research on the analysis of public transport data sources should continually benefit from the rapid development of data analysis approaches, especially big data techniques. Indeed, as the amount of public transport data continues to grow, the research and appropriate use of big data is imperative for researchers to make the most of these newly available information and techniques. In the previous sections, we have highlighted in the summary tables several data analytics approaches that could be used for data-driven analysis. Nevertheless, the used methods should be continuously updated and leverage the advances, especially in the fields of optimization and ML.

4.3.2. Machine Learning

In particular, as noted earlier, ML is gaining a lot of attention today for dealing with big data, as traditional statistical and analytical methods often fail to process large-scale, unstructured and noisy data. While ML approaches are applicable to different kinds of data, they are particularly suited for social media, traffic and APC data which are mostly unstructured and noisy data. Over the past decades, countless ML techniques have been proposed to deal with different types and structures of data. However, an important issue in this regard is the choice of a suitable approach for each problem and case study. For example, Ref. [184] compared a number of ML techniques and found that random forest is the best for their case study. In particular, there are approaches which can be suitable for pattern recognition problems (e.g., [185]) and that are applicable, for instance, to APC data. Another issue is feature engineering, which consists of the extraction of the most relevant feature issues and in which neural networks are the most adopted ones today (e.g., [186]). For feature engineering, it is also useful to include best practices, such as feature selection and model selection [187]. Moreover, it is important to integrate the different data sources, which enable us to extract the different relevant features, as shown on several occasions in the previous sections. In this context, it is necessary to differentiate between the problems which tolerate static predictions and those which require real-time information, such as [188].
More practically, to use these advances, several frameworks are available such as Hadoop MapReduce or Spark. Some papers focus on using these frameworks to improve transportation management and operations. We refer to [7] for insights on this topic. A more recent paper that exploits TensorFlow (a recent and well-adopted deep learning framework) to process large-scale traffic data can be found in [189].
A major issue, once appropriate data availability is ensured, relates to prediction and forecasting. This can be demand-oriented, load-oriented, travel time-oriented, delay-oriented, etc. Examples of machine learning approaches including neural networks, etc., include [190] for O-D matrix estimation, Refs. [191,192] for the prediction of bus travel times and speeds. APC data together with an appropriate mobile application can be used to crowd-source seat availability on buses; see, e.g., [193].
Delays of transit services are a major concern for the agencies due to their impact on passengers, who could be sensitive to their unexpected waiting time during their trips [84]. Therefore, several studies are proposed for an ameliorated analysis and prediction of delays with the aim to avoid their cause and to provide a better on-time performance of the service. The advantage of developing accurate delay prediction systems is twofold. First, in the short term, it enables riders to be informed in real time about delays and then update their plans. Second, in the long term, an accurate prediction could enhance the reliability and accessibility of public transit by determining the main factors that cause delays and then updating the schedule based on that information. Ref. [194] integrates the weather variability when predicting bus arrival times using APC data. The problem with AVL data is that it is usually not yet openly available for the majority of transit data. In [126], the authors integrate (predicted) traffic data as a replacement of GTFS where they are unavailable. In [195], the authors investigate the effects of vehicle delays on passenger waiting time together with the effects of transfer status, boarding location, time of day and rider travel frequency. Used data includes AFC and AVL data while a trip-chaining algorithm is used to infer the trajectories for all passengers; a case study in the United States is reported. We can conclude that the integration or merging of data sources is crucial for an enhanced evaluation of delay reasons.

4.3.3. Privacy and Security

Data privacy and security is an essential issue that has to be taken into consideration when storing and processing data sources, especially AFC and smartphones. For AFC, data privacy and security is an issue that needs to be addressed. Although the belief that privacy should not be a major concern with such data, as it often does not include personal information, it is shown, for example in [196], that users can be frequently identified. The authors propose a privacy allocation mechanism to better address the data sanitation issue (which aims to make data unrecoverable). We can see that the issues of privacy and security are interconnected and there are a number of applications that aim to address both (e.g., [197]). For smartphone data, one idea to preserve privacy is by encrypting the data. Such an approach is included in [148], which is tailored to recommendation services. The advent of blockchain may be among solutions once properly defined as functionality requirements; see, e.g., [198] for a related discussion regarding identity management in public transport.

4.4. Exploitation

After processing the data and getting the needed information, it is crucial to transform it in a manner that is beneficial to the transit service and to the passengers. This also relates to data and business understanding. In general, many of the cited papers above outline the practical contribution of their approaches. We also note that passenger information can be judged from different perspectives including visualization and service optimization; see, e.g., [2,27,199]. Below, we highlight how the information can be exploited through visualization or by optimizing the service.

4.4.1. Visualization

The visualization of data is already considered, e.g., as part of the previous sections; see, e.g., Table 2. Often it is also a matter of comprehension ([17]). Ref. [157] highlights some of the potentials and challenges in processing data for individual visualization methods. In fact, the visualization of AFC data can help identifying passenger flow characteristics and evaluating their travel time reliability as investigated, for example, in [72] for the case of the Shanghai Metro. Moreover, the chances for a proper visualization can be further illustrated by merging different types of data. For example, Ref. [51] combine AFC data with AVL data to reconstruct travel trajectories of bus passengers at the bus stop level. To do so, AVL data often has to be published in the GTFS format, which is now the most common format to standardize these data. In that paper, the authors’ ultimate goal is in particular to visually unveil the spatio–temporal travel behavior dynamics of the passengers. Ref. [200] develop a tool named PubtraVis making use of the GTFS data that carries schedule information to measure and display the public transit system operation in different perspectives through six visualization modules: mobility, speed, flow, density, headway and analysis. The user can observe the information on vehicles (e.g., speed) statistically, temporarily and geographically. Moreover, Ref. [138] adopt a visualization approach to leverage social media (Twitter) data in order to identify business clusters. To our knowledge, there is no extensive work that is interested in the visualization of the other sources. Nevertheless, traffic data are studied in a broader manner and several visualization approaches are proposed. For example, Ref. [201] propose an approach that aims to visualize the evolution of traffic congestion in large-size cities. Thereby, a prospective project worth to be studied is to integrate external traffic information along with other data (e.g., weather) into the visualization mechanism to have a complete and user-friendly platform containing all the information needed and available. The above-mentioned concepts of digital twin and heat maps (see, e.g., Section 4.1.3) can equally well be incorporated here.

4.4.2. Service Optimization

In the previous sections, especially in Section 2.1 and Section 2.2, we have shown several examples on how these data can be used to measure the reliability and punctuality of the service, even taking into consideration passenger behavior. This information could often be exploited by sharing it in real time. In other words, if the passengers are informed about delays within a reasonable time, they could update their schedule and opt for alternatives. A selective literature review of the passenger benefits of real-time transit information can be found in [202]. Moreover, data sources could be used to dynamically optimize and adapt the transit service. As presented before, examples of work that leverage these data for this purpose could be found in [37,57]. Moreover, Ref. [203] are interested in both the analysis and optimization of transport line services. Additionally, ML has become an emerging trend in optimization problems. An idea to improve the service in this regard could be found in [204].

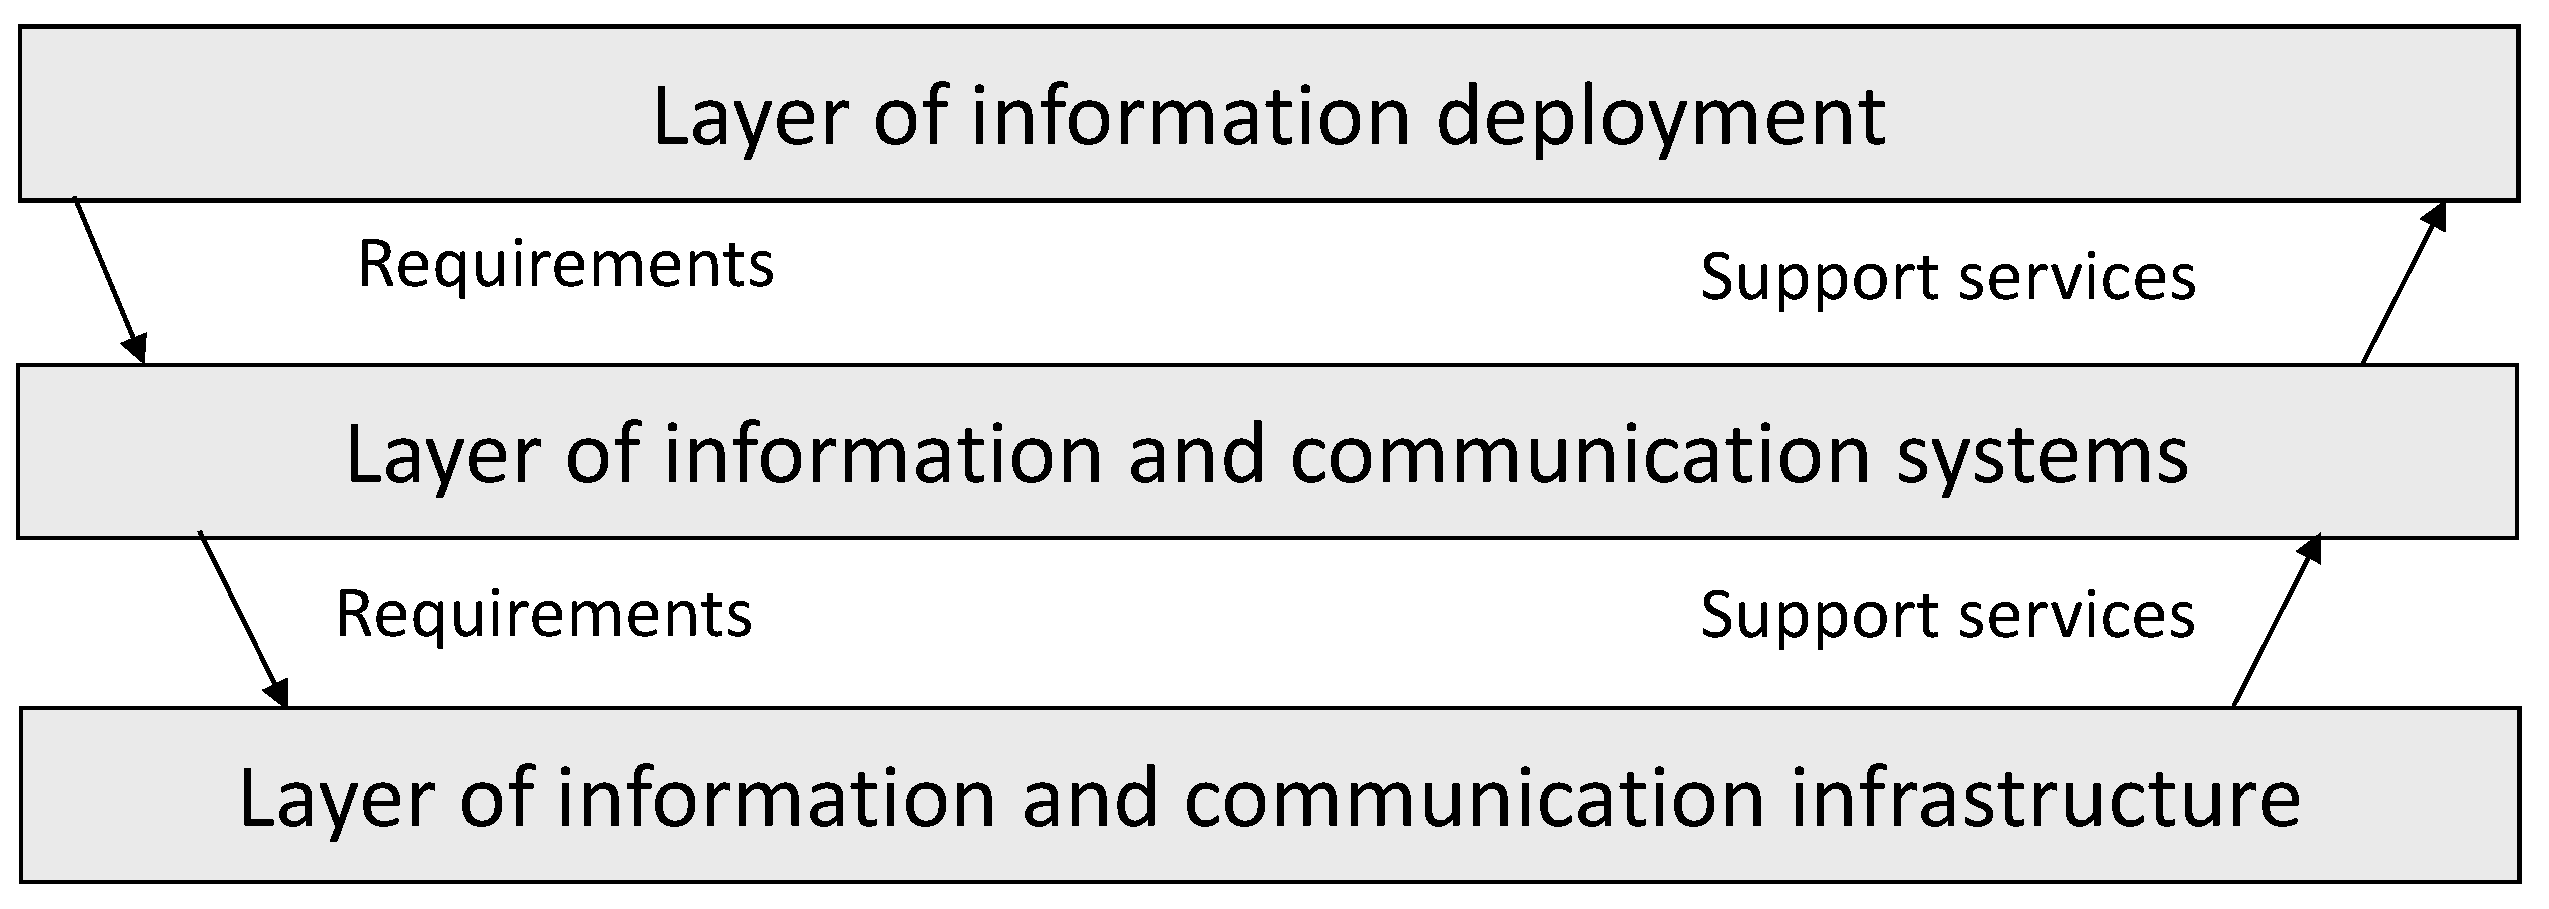
5. An Information Management Framework

Information management (IM) is the purpose-oriented provision, processing and distribution of the resource information for decision support, as well as the provision of respective infrastructure [17]. (The adoption of this definition in public transport is already exemplified, e.g., in [27]).
IM is understood, among others, to be an instrument for making information distribution operable. In that respect, it becomes an enabler for efficient innovation management including digital transformation and digital innovation. However, with recent advances in information and communication technologies (IT) and big data, we observe a lack of putting data into perspective in the sense of this definition. Therefore, we focus on the different opportunities and challenges in the wealth of available data. Above, we have summarized and provided insights into the main focus and opportunities of different data to highlight their challenges and how to fusion them. In this section, we propose a unified framework for possible data usage in this area. From a methodological standpoint, our proceeding which leads into the framework may be characterized as being a narrative argument balance.
Next, we describe the framework. After that some examples for applications and use cases are provided.

5.1. Three-Layer Model

A possible foundation for developing the intended framework may be found in a basic three-layer model from IM; see, e.g., [17,205]. The framework is depicted in Figure 1. The basic, but often neglected issue is that not only the available data are explored, but that the definition of appropriate functionality requirements is privileged. These requirements set the pace for the needed data and information (information deployment, respectively). To gain access to these data, the requirements may be propagated towards other levels of the framework envisaging information systems and infrastructure. Based on those, services are provided to support fulfilling the requirements.
To exemplify the initial steps of our framework development, we emphasize the distinction of static and dynamic data in an IM specification differentiating internal and external IM, depending on who is to be addressed by means of the different types of data and information; see Figure 2. We also distinguish static and dynamic data where the latter refers to continuous changes in a dynamic way up to real-time data (see also the above distinction between static GTFS Data and GTFS Realtime, i.e., the feed specification allowing public transportation companies to provide real-time updates about their fleets, schedules, etc.).
Beyond the above classification criteria, we characterize different parties (stakeholders) which are involved in public transport, namely transit operators (including transport associations asking for data regarding the share of revenues and subsidies, if at all), policy makers and passengers. Differentiation in a different dimension refers to individual versus collective information. Again, in Figure 2 one may think of functionality requirements defined upfront before propagating these requirements through the different layers to obtain appropriate support. An overview of the above categories of available data is provided in Figure 3, emphasizing the specific sections where they can be found in this paper (with most important connections given by arrows).

5.2. Use Cases

In this section, we sketch a small fraction of available use cases. The reader may apply the options available through [69,140] by him or herself.
A use case for measuring daily walking to public transport based on data from Montreal, Canada, can be found in [206]. An earlier reference utilizing the potential of GTFS data is [207]. The paper analyzes networks and connectivity indicators for Auckland (New Zealand), Vancouver (Canada) and Portland (Oregon/USA).
Use cases may incorporate the appropriate use of available exogenous data, e.g., regarding sports events (e.g., [208]) or cruise ship arrivals (e.g., [209]). For the latter, very detailed questionnaire data from public transport companies are available (e.g., satisfaction surveys made by local public transit authorities in Hamburg (Germany) and Qingdao (China); [53,54,55]). Furthermore, the data-driven prediction of delays, occupancy rates of public transport means, or usage rates of public transport for special user groups (like students) may be formulated as functionality requirements to allow for appropriate support.
Note that AFC data represent a useful alternative to household and on-board passenger surveys as illustrated, e.g., in [64]. In particular, the authors show that household surveys may significantly underestimate the demand. In addition, Ref. [65] carry out a comparison with a large O-D survey in the city of Santiago (Chile). The authors aim to validate the results of the survey and they identify certain errors by combining AFC and AVL data. Nevertheless, household surveys can still help to change the infrastructure, e.g., in building new public transport lines. In [210], we find details regarding the building of a new subway line in Sidney (Australia). Ref. [66] present a methodology for estimating the destination of passenger journeys from AFC data.

6. Conclusions and Perspectives

Interest in public transport data sources is growing rapidly these days as more agencies and researchers see the potential for new insights. We have shown that data are readily available at our fingertips. We conducted an unprecedented review of data sources, which includes the most frequently used sources of these days. After dividing them into various types of data sources, we summarized the main chances, challenges and associated data-driven methods. In terms of challenges, transit data most often needs to be processed to derive meaningful information. When it comes to potentials, each data source has specific applications and could provide information not captured from other sources. Indeed, each could provide unique information concerning or influencing either passenger behavior or the transit service or both. For the methods, the research looked at different approaches, most of which adopted conventional or advanced data analysis methods. Moreover, we underlined the complementary nature of these data sources, either they are endogenous or exogenous, advanced or conventional. Indeed, by fusing different data sources, the information on one data source can be validated by another and new knowledge can be mutually derived or even speculated upon. Additionally, we presented a unified view of the data sources in which we show how to acquire, integrate, process and exploit the data sources.
To better position our paper with respect to recent reviews, we first note that, as indicated in the introduction, most of them are interested in big data sources. Our paper incorporates also other approaches (e.g., surveys) and shows how they can support big data sources. Indeed, it is suggested in this paper that analyses derived from emerging big data approaches could still be complemented or validated using conventional approaches. Second, we note that data sources can be categorized in different manners. That is, we can see that the proposed division in [7], into traditional data collecting technologies and advanced data collecting technologies, could be indirectly incorporated into our paper. For instance, APC could incorporate the technological advances in bio-metric face recognition (again with the utmost important hint regarding data security issues). Moreover, real-time GTFS data mainly adopt AVL data. Recent advances in GTFS, which aim to define a common format for transit data, attempt to incorporate data from social media and smartphone data. Some ideas are discussed, for example, in the 2020 MobilityData (https://mobilitydata.org/ (accessed on 13 June 2021)) European Public Transit Training.
We can see that there is a significant overlap between these data sources. Indeed, different data can be adopted to extract the same information and then used depending on the capacities of the transit agencies, or combined to obtain more reliable information. In addition, some of them are more associated, in terms of application, with others. For example, smartphone data can often provide similar passenger information produced by smart cards. We can observe from this review that the smart card is today the most adopted data source. However, smartphone data usage is growing rapidly and could present an alternative, if the corresponding challenges (e.g., privacy) are resolved.
At the end, we highlight some other data issues worth to be studied further. First, although data are crucial ingredients of information systems, it is necessary to define the appropriate functionality requirements in order to take advantage of them. These requirements pave the way for information deployment by agencies and could be designed according to their specifications. Very often support and studies are based on new technology and infrastructure being available. However, we claim that the functionality requirements should come first (see [3,17]), an issue that may be seen as a most important cue or outcome of this paper while it still needs further elaboration. Second, for an in-depth analysis of public transport data, it is important to include the notion of multi-modality in public transport ([211]), as passenger decision making could be influenced by the availability of several modes of transport, including cars and bicycles. In fact, transit data sources only record a part of the urban mobility system and it is important to consider the impact of other transport modes, including emerging ones (e.g., bike sharing; see, e.g., [63]). As shown in Section 3, exogenous sources could be analyzed in a similar manner but the issue needs further study. This will pave the way to another division of data sources, from the perspective of urban transport authorities, in which endogenous data sources relate to data sources concerning transit and exogenous relate to other modes of transport. The ultimate goal is to design a unified framework that integrates the different data sources, both inside and outside the realm of public transport. Once the different data sources are merged into a unified information system, it is possible to obtain a broader view of passengers and services, which makes it possible to achieve the balance between supply and demand outlined in the introduction. In summary, this is the first paper, to the best of our knowledge, to review public transport data sources in this way leading towards a framework like the one presented. (Although many papers provide conceptual ideas in this respect, the knowledge about this seems to be limited).
Further elaboration of the framework is part of future research. A final issue worth further research, given resolved issues, e.g., of privacy, may classify and utilize collective and individual information in a more comprehensive way.

Author Contributions

Conceptualization, L.G., M.S. and S.V.; methodology, L.G. and S.V.; validation, L.G., M.S., S.V. and L.X.; investigation, L.G., M.S. and S.V.; resources, S.V. and L.X.; writing—original draft preparation, L.G., M.S. and S.V.; writing—review and editing, L.G., M.S., S.V. and L.X.; supervision, S.V. and L.X.; funding acquisition, M.S., S.V. and L.X. All authors have read and agreed to the published version of the manuscript.

Funding

Liping Ge is supported by the Deutsche Forschungsgemeinschaft (DFG fund LX 156/2-1). Malek Sarhani is supported by the Alexander von Humboldt Foundation.

Conflicts of Interest

The authors declare no conflict of interest.

Abbreviations

The following abbreviations are used in this manuscript:
AFCAutomatic fare collection
APCAutomatic passenger counting
APIApplication programming interface
AVLAutomatic vehicle location
AVMAutomatic vehicle monitoring
CENComité Européen de Normalisation (European committee for standardization)
DGPSDifferential global positioning system
FCDFloating car data
GNSSGlobal navigation satellite system
GPSGlobal positioning system
GTFSGeneral transit feed specification
HVVHamburger Verkehrsverbund (Hamburg transport association)
IoTInternet of things
IMInformation management
ITInformation and communication technologies
MACMedia access control
MLMachine learning
NeTExNetwork timetable exchange
O-DOrigin-destination
RFIDRadio frequency identification
TRBTransportation Research Board
VDVVerband Deutscher Verkehrsunternehmen
(Association of German transport companies)
XMLExtensible markup language

References

  1. Kaplan, S.; Monteiro, M.M.; Anderson, M.K.; Nielsen, O.A.; Santos, E.M.D. The role of information systems in non-routine transit use of university students: Evidence from Brazil and Denmark. Transp. Res. Part A Policy Pract. 2017, 95, 34–48. [Google Scholar] [CrossRef]
  2. Jevinger, Å.; Persson, J.A. Exploring the potential of using real-time traveler data in public transport disturbance management. Public Transp. 2019, 11, 413–441. [Google Scholar] [CrossRef] [Green Version]
  3. Daduna, J.R.; Voß, S. (Eds.) Informationsmanagement im Verkehr; Physica: Heidelberg, Germany, 2000. [Google Scholar] [CrossRef]
  4. Schneidereit, G.; Daduna, J.R.; Voß, S. Informationsdistribution über Netzdienste am Beispiel des Öffentlichen Personenverkehrs. VDI-Berichte 1998, 1372, 217–236. [Google Scholar]
  5. Armoogum, J.; Ellison, A.B.; Kalter, M.J.O. Workshop Synthesis: Representativeness in surveys: Challenges and solutions. Transp. Res. Procedia 2018, 32, 224–228. [Google Scholar] [CrossRef]
  6. Hahne, F. Kürzeste und Schnellste Wege in Digitalen Straßenkarten. Ph.D. Thesis, University Hildesheim, Hildesheim, Germany, 2001. [Google Scholar]
  7. Lu, K.; Liu, J.; Zhou, X.; Han, B. A Review of Big Data Applications in Urban Transit Systems. IEEE Trans. Intell. Transp. Syst. 2020, 1–18. [Google Scholar] [CrossRef]
  8. Welch, T.F.; Widita, A. Big data in public transportation: A review of sources and methods. Transp. Rev. 2019, 39, 795–818. [Google Scholar] [CrossRef]
  9. Zannat, K.E.; Choudhury, C.F. Emerging Big Data Sources for Public Transport Planning: A Systematic Review on Current State of Art and Future Research Directions. J. Indian Inst. Sci. 2019, 99, 601–619. [Google Scholar] [CrossRef] [Green Version]
  10. Hao, J.; Zhu, J.; Zhong, R. The rise of big data on urban studies and planning practices in China: Review and open research issues. J. Urban Manag. 2015, 4, 92–124. [Google Scholar] [CrossRef] [Green Version]
  11. Zhu, L.; Yu, F.R.; Wang, Y.; Ning, B.; Tang, T. Big Data Analytics in Intelligent Transportation Systems: A Survey. IEEE Trans. Intell. Transp. Syst. 2019, 20, 383–398. [Google Scholar] [CrossRef]
  12. Zheng, X.; Chen, W.; Wang, P.; Shen, D.; Chen, S.; Wang, X.; Zhang, Q.; Yang, L. Big data for social transportation. IEEE Trans. Intell. Transp. Syst. 2015, 17, 620–630. [Google Scholar] [CrossRef]
  13. Iliopoulou, C.; Kepaptsoglou, K. Combining ITS and optimization in public transportation planning: State of the art and future research paths. Eur. Transp. Res. Rev. 2019, 11, 27. [Google Scholar] [CrossRef]
  14. National Academies of Sciences, Engineering, and Medicine. Managing Data from Emerging Transportation Technologies to Support Decision-Making; The National Academies Press: Washington, DC, USA, 2020. [Google Scholar] [CrossRef]
  15. National Academies of Sciences, Engineering, and Medicine. Analyst Toolbox: Analysis and Approaches for Reporting, Communicating, and Examining Transit Data; The National Academies Press: Washington, DC, USA, 2021. [Google Scholar] [CrossRef]
  16. Lawson, C.T.; Tomchik, P.; Muro, A.; Krans, E. Translation software: An alternative to transit data standards. Transp. Res. Interdiscip. Perspect. 2019, 2, 100028. [Google Scholar] [CrossRef]
  17. Voß, S.; Gutenschwager, K. Informationsmanagement; Springer: Berlin, Germany, 2001. [Google Scholar] [CrossRef] [Green Version]
  18. Ait-Ali, A.; Eliasson, J. The value of additional data for public transport origin–destination matrix estimation. Public Trans. 2021. Oine Available. [Google Scholar] [CrossRef]
  19. Lobo, A.X. A review of automatic vehicle location technology and its real-time applications. Transp. Rev. 1998, 18, 165–191. [Google Scholar] [CrossRef]
  20. Cevallos, F. Transit Service Reliability: Analyzing Automatic Vehicle Location (AVL) Data for On-Time Performance and to Identify Conditions Leading to Service Degradation; Technical Report; University of South Florida: Tampa, FL, USA, 2016. [Google Scholar] [CrossRef]
  21. Mintsis, G.; Basbas, S.; Papaioannou, P.; Taxiltaris, C.; Tziavos, I.N. Applications of GPS technology in the land transportation system. Eur. J. Oper. Res. 2004, 152, 399–409. [Google Scholar] [CrossRef]
  22. Numrich, J.; Ruja, S.; Voß, S. Global Navigation Satellite System based tolling: State-of-the-art. Netnomics 2012, 13, 93–123. [Google Scholar] [CrossRef]
  23. Putera, R.; Santoso, A.; Sondang, I.; Pratama, O.; Nandhito, G.; Suyanti, E. Efficiency of public transportation using global navigation satellite system. Int. J. GEOMATE 2017, 13, 26–30. [Google Scholar] [CrossRef]
  24. Daduna, J.R. Evolution of Public Transport in Rural Areas – New Technologies and Digitization. Lect. Notes Comput. Sci. 2020, 12202, 82–99. [Google Scholar] [CrossRef]
  25. Liu, Y.; Zhang, N.; Liu, L.; Qin, Y.; Gao, Y.; Weng, Y.; Liu, J. Application and Prospect of BeiDou Navigation Satellite System in the Transportation Industry. Aerosp. China 2020, 21, 50–57. [Google Scholar] [CrossRef]
  26. Varisteas, G.; Frank, R.; Robinet, F. RoboBus: A Diverse and Cross-Border Public Transport Dataset. In Proceedings of the 2021 IEEE International Conference on Pervasive Computing and Communications Workshops and Other Affiliated Events (PerCom Workshops), Kassel, Germany, 22–26 March 2021; pp. 269–274. [Google Scholar] [CrossRef]
  27. Daduna, J.R.; Voß, S. Efficient technologies for passenger information systems in public mass transit. In Proceedings of the first INFORMS Conference on Information Systems and Technology, INFORMS, Washington, DC, USA, 5–8 May 1996; pp. 386–391. [Google Scholar]
  28. Dessouky, M.; Hall, R.; Nowroozi, A.; Mourikas, K. Bus dispatching at timed transfer transit stations using bus tracking technology. Transp. Res. Part C Emerg. Technol. 1999, 7, 187–208. [Google Scholar] [CrossRef]
  29. Camus, R.; Longo, G.; Macorini, C. Estimation of transit reliability level-of-service based on automatic vehicle location data. Transp. Res. Rec. 2005, 1927, 277–286. [Google Scholar] [CrossRef]
  30. Chapleau, R.; Trépanier, M.; Chu, K.K. The ultimate survey for transit planning: Complete information with smart card data and GIS. In Proceedings of the 8th International Conference on Survey Methods in Transport: Workshop B1 Paper, Annecy, France, 25–31 May 2008; pp. 25–31. [Google Scholar]
  31. Cevallos, F.; Wang, X.; Chen, Z.; Gan, A. Using AVL data to improve transit on-time performance. J. Public Transp. 2011, 14, 21–40. [Google Scholar] [CrossRef] [Green Version]
  32. Mandelzys, M.; Hellinga, B. Identifying causes of performance issues in bus schedule adherence with automatic vehicle location and passenger count data. Transp. Res. Rec. J. Transp. Res. Board 2010, 2143, 9–15. [Google Scholar] [CrossRef]
  33. Barabino, B.; Di Francesco, M.; Mozzoni, S. An offline framework for the diagnosis of time reliability by automatic vehicle location data. IEEE Trans. Intell. Transp. Syst. 2016, 18, 583–594. [Google Scholar] [CrossRef]
  34. Barabino, B.; Di Francesco, M.; Mozzoni, S. Rethinking bus punctuality by integrating Automatic Vehicle Location data and passenger patterns. Transp. Res. Part A Policy Pract. 2015, 75, 84–95. [Google Scholar] [CrossRef]
  35. Barabino, B.; Lai, C.; Casari, C.; Demontis, R.; Mozzoni, S. Rethinking Transit Time Reliability by Integrating Automated Vehicle Location Data, Passenger Patterns, and Web Tools. IEEE Trans. Intell. Transp. Syst. 2017, 18, 756–766. [Google Scholar] [CrossRef]
  36. Wessel, N.; Allen, J.; Farber, S. Constructing a Routable Retrospective Transit Timetable from a Real-time Vehicle Location Feed and GTFS. J. Transp. Geogr. 2017, 62, 92–97. [Google Scholar] [CrossRef]
  37. Zeng, X.; Zhang, Y.; Jiao, J.; Yin, K. Route-Based Transit Signal Priority Using Connected Vehicle Technology to Promote Bus Schedule Adherence. IEEE Trans. Intell. Transp. Syst. 2020, 22, 1174–1184. [Google Scholar] [CrossRef]
  38. Fournier, S.M.; Hülse, E.O.; Pinheiro, É.V. A*-guided heuristic for a multi-objective bus passenger trip planning problem. Public Trans. 2019. [Google Scholar] [CrossRef]
  39. Hunter, T.; Abbeel, P.; Bayen, A. The Path Inference Filter: Model-Based Low-Latency Map Matching of Probe Vehicle Data. IEEE Trans. Intell. Transp. Syst. 2014, 15, 507–529. [Google Scholar] [CrossRef] [Green Version]
  40. Zhu, N.; Marais, J.; Betaille, D.; Berbineau, M. GNSS Position Integrity in Urban Environments: A Review of Literature. IEEE Trans. Intell. Transp. Syst. 2018, 19, 2762–2778. [Google Scholar] [CrossRef] [Green Version]
  41. Osang, G.; Cook, J.; Fabrikant, A.; Gruteser, M. LiveTraVeL: Real-time matching of transit vehicle trajectories to transit routes at scale. In Proceedings of the IEEE Intelligent Transportation Systems Conference (ITSC), Auckland, New Zealand, 27–30 October 2019; pp. 2244–2251. [Google Scholar] [CrossRef]
  42. Islam, R.U.; Hossain, M.S.; Andersson, K. A novel anomaly detection algorithm for sensor data under uncertainty. Soft Comput. 2016, 22, 1623–1639. [Google Scholar] [CrossRef] [Green Version]
  43. Pelletier, M.-P.; Trépanier, M.; Morency, C. Smart card data use in public transit: A literature review. Transp. Res. Part C Emerg. Technol. 2011, 19, 557–568. [Google Scholar] [CrossRef]
  44. Li, T.; Sun, D.; Jing, P.; Yang, K. Smart Card Data Mining of Public Transport Destination: A Literature Review. Information 2018, 9, 18. [Google Scholar] [CrossRef] [Green Version]
  45. Fleishman, D.; Shaw, N.; Joshi, A.; Freeze, R.; Oram, R. Fare Policies, Structures, and Technologies; Number Project A-1 FY’92; The National Academies Press: Washington, DC, USA, 1996. [Google Scholar]
  46. Olivková, I. Comparison and evaluation of fare collection technologies in the public transport. Procedia Eng. 2017, 178, 515–525. [Google Scholar] [CrossRef]
  47. Barabino, B.; Lai, C.; Olivo, A. Fare evasion in public transport systems: A review of the literature. Public Transp. 2020, 12, 27–88. [Google Scholar] [CrossRef]
  48. Egu, O.; Bonnel, P. Can we estimate accurately fare evasion without a survey? Results from a data comparison approach in Lyon using fare collection data, fare inspection data and counting data. Public Transp. 2021. [Google Scholar] [CrossRef]
  49. Cui, Z.; Long, Y. Perspectives on stability and mobility of transit passenger’s travel behaviour through smart card data. IET Intell. Transp. Syst. 2019, 13, 1761–1769. [Google Scholar] [CrossRef] [Green Version]
  50. Mulley, C.; Nelson, J.; Ison, S. (Eds.) The Routledge Handbook of Public Transport; Routledge: London, UK, 2021. [Google Scholar] [CrossRef]
  51. Tao, S.; Rohde, D.; Corcoran, J. Examining the spatial–temporal dynamics of bus passenger travel behaviour using smart card data and the flow-comap. J. Transp. Geogr. 2014, 41, 21–36. [Google Scholar] [CrossRef]
  52. Voß, S.; Mejia, G.; Voß, A. Mystery Shopping in Public Transport: The Case of Bus Station Design. Lect. Notes Comput. Sci. 2020, 12423, 527–542. [Google Scholar] [CrossRef]
  53. HVV. Hamburger Verkehrsverbund, HVV-Qualitätsbericht 2017. 2017. (In German). Available online: https://www.hvv.de/resource/blob/22478/1122dfd0c06dc3a249b3cdbf5898bcb9/hvv_qualitaetsbericht_2017.pdf (accessed on 15 April 2021).
  54. Qdbus. Qingdao Bus: Customer Satisfaction and Loyalty Evaluation Report. 2014. Available online: http://gzw.qingdao.gov.cn/n28356025/n30142503/140813145100327435.html (accessed on 15 April 2021).
  55. Dailyqd. Survey on passenger satisfaction of Qingdao Metro. Qingdao Daily 2019. Available online: http://www.shiminjia.com/news/detail/MDAwMDAwMDAwMKOyyqO808GM (accessed on 15 April 2021).
  56. Espinoza, C.; Munizaga, M.; Bustos, B.; Trépanier, M. Assessing the public transport travel behavior consistency from smart card data. Transp. Res. Procedia 2018, 32, 44–53. [Google Scholar] [CrossRef]
  57. Cheon, S.H.; Lee, C.; Shin, S. Data-driven stochastic transit assignment modeling using an automatic fare collection system. Transp. Res. Part C Emerg. Technol. 2019, 98, 239–254. [Google Scholar] [CrossRef]
  58. Briand, A.-S.; Côme, E.; Trépanier, M.; Oukhellou, L. Analyzing year-to-year changes in public transport passenger behaviour using smart card data. Transp. Res. Part C Emerg. Technol. 2017, 79, 274–289. [Google Scholar] [CrossRef]
  59. Frumin, M.; Zhao, J. Analyzing Passenger Incidence Behavior in Heterogeneous Transit Services Using Smartcard Data and Schedule-Based Assignment. Transp. Res. Rec. J. Transp. Res. Board 2012, 2274, 52–60. [Google Scholar] [CrossRef] [Green Version]
  60. Kim, J.; Corcoran, J.; Papamanolis, M. Route choice stickiness of public transport passengers: Measuring habitual bus ridership behaviour using smart card data. Transp. Res. Part C Emerg. Technol. 2017, 83, 146–164. [Google Scholar] [CrossRef]
  61. Qiu, G.; Song, R.; He, S.; Xu, W.; Jiang, M. Clustering passenger trip data for the potential passenger investigation and line design of customized commuter bus. IEEE Trans. Intell. Transp. Syst. 2018, 20, 3351–3360. [Google Scholar] [CrossRef]
  62. Zou, Q.; Yao, X.; Zhao, P.; Wei, H.; Ren, H. Detecting home location and trip purposes for cardholders by mining smart card transaction data in Beijing subway. Transportation 2018, 45, 919–944. [Google Scholar] [CrossRef]
  63. Kon, F.; Ferreira, E.C.; de Souza, H.A.; Duarte, F.; Santi, P.; Ratti, C. Abstracting mobility flows from bike-sharing systems. Public Transp. 2021. [Google Scholar] [CrossRef]
  64. Egu, O.; Bonnel, P. How comparable are origin-destination matrices estimated from automatic fare collection, origin-destination surveys and household travel survey? An empirical investigation in Lyon. Transp. Res. Part A Policy Pract. 2020, 138, 267–282. [Google Scholar] [CrossRef]
  65. Munizaga, M.; Devillaine, F.; Navarrete, C.; Silva, D. Validating travel behavior estimated from smartcard data. Transp. Res. Part C Emerg. Technol. 2014, 44, 70–79. [Google Scholar] [CrossRef]
  66. Nunes, A.A.; Dias, T.G.; e Cunha, J.F. Passenger Journey Destination Estimation From Automated Fare Collection System Data Using Spatial Validation. IEEE Trans. Intell. Transp. Syst. 2016, 17, 133–142. [Google Scholar] [CrossRef]
  67. Kang, M.J.; Ataeian, S.; Amiripour, S.M.M. A procedure for public transit OD matrix generation using smart card transaction data. Public Transp. 2020, 13, 81–100. [Google Scholar] [CrossRef]
  68. Kumar, P.; Khani, A.; He, Q. A robust method for estimating transit passenger trajectories using automated data. Transp. Res. Part C Emerg. Technol. 2018, 95, 731–747. [Google Scholar] [CrossRef]
  69. Google. GTFS Static Overview. 2021. Available online: https://developers.google.com/transit/gtfs (accessed on 13 June 2021).
  70. Assemi, B.; Alsger, A.; Moghaddam, M.; Hickman, M.; Mesbah, M. Improving alighting stop inference accuracy in the trip chaining method using neural networks. Public Transp. 2019, 12, 89–121. [Google Scholar] [CrossRef]
  71. Chidlovskii, B. Mining Smart Card Data for Travellers’ Mini Activities. IEEE Trans. Intell. Transp. Syst. 2018, 19, 3676–3685. [Google Scholar] [CrossRef]
  72. Sun, Y.; Shi, J.; Schonfeld, P.M. Identifying passenger flow characteristics and evaluating travel time reliability by visualizing AFC data: A case study of Shanghai Metro. Public Transp. 2016, 8, 341–363. [Google Scholar] [CrossRef]
  73. Wu, L.; Kang, J.E.; Chung, Y.; Nikolaev, A. Inferring origin-Destination demand and user preferences in a multi-modal travel environment using automated fare collection data. Omega 2021, 101, 102260. [Google Scholar] [CrossRef]
  74. Yap, M.; Cats, O.; van Arem, B. Crowding valuation in urban tram and bus transportation based on smart card data. Transp. A: Transp. Sci. 2018, 16, 23–42. [Google Scholar] [CrossRef] [Green Version]
  75. Lee, A.G.; Hickman, M. Trip purpose inference using automated fare collection data. Public Transp. 2014, 6, 1–20. [Google Scholar] [CrossRef]
  76. Yu, W.; Bai, H.; Chen, J.; Yan, X. Analysis of Space-Time Variation of Passenger Flow and Commuting Characteristics of Residents Using Smart Card Data of Nanjing Metro. Sustainability 2019, 11, 4989. [Google Scholar] [CrossRef] [Green Version]
  77. Zheng, M.; Liu, F.; Guo, X.; Lei, X. Assessing the Distribution of Commuting Trips and Jobs-Housing Balance Using Smart Card Data: A Case Study of Nanjing, China. Sustainability 2019, 11, 5346. [Google Scholar] [CrossRef] [Green Version]
  78. Aslam, N.S.; Cheng, T.; Cheshire, J. A high-precision heuristic model to detect home and work locations from smart card data. Geo-Spat. Inf. Sci. 2019, 22, 1–11. [Google Scholar] [CrossRef]
  79. He, L.; Trepanier, M.; Agard, B. Space–time classification of public transit smart card users’ activity locations from smart card data. Public Transp. 2021. [Google Scholar] [CrossRef]
  80. Mützel, C.M.; Scheiner, J. Investigating spatio-temporal mobility patterns and changes in metro usage under the impact of COVID-19 using Taipei Metro smart card data. Public Transp. 2021. [Google Scholar] [CrossRef]
  81. Ingvardson, J.B.; Nielsen, O.A.; Raveau, S.; Nielsen, B.F. Passenger arrival and waiting time distributions dependent on train service frequency and station characteristics: A smart card data analysis. Transp. Res. Part C Emerg. Technol. 2018, 90, 292–306. [Google Scholar] [CrossRef] [Green Version]
  82. Tavassoli, A.; Mesbah, M.; Shobeirinejad, A. Modelling passenger waiting time using large-scale automatic fare collection data: An Australian case study. Transp. Res. Part F Traffic Psychol. Behav. 2018, 58, 500–510. [Google Scholar] [CrossRef]
  83. Mohamed, K.E.M.; Côme, E.; Oukhellou, L.; Verleysen, M. Clustering smart card data for urban mobility analysis. IEEE Trans. Intell. Trans. Syst. 2016, 18, 712–728. [Google Scholar] [CrossRef]
  84. Ge, L.; Voß, S.; Xie, L. Robustness and Disturbances in Public Transport; Technical Report; Institute of Information Systems, Leuphana University of Lüneburg and Institute of Information Systems (IWI), University of Hamburg: Hamburg, Germany, 2020. [Google Scholar]
  85. Dekker, M.M.; van Lieshout, R.N.; Ball, R.C.; Bouman, P.C.; Dekker, S.C.; Dijkstra, H.A.; Goverde, R.M.P.; Huisman, D.; Panja, D.; Schaafsma, A.A.M.; et al. A next step in disruption management: Combining operations research and complexity science. Public Transp. 2021. [Google Scholar] [CrossRef]
  86. Hu, S.; Chen, P. Who left riding transit? Examining socioeconomic disparities in the impact of COVID-19 on ridership. Transp. Res. Part D Transp. Environ. 2021, 90, 102654. [Google Scholar] [CrossRef]
  87. Hamidi, S.; Hamidi, I. Subway Ridership, Crowding, or Population Density: Determinants of COVID-19 Infection Rates in New York City. Am. J. Prev. Med. 2021. [Google Scholar] [CrossRef]
  88. Chen, Z.; Fan, W. Extracting bus transit boarding stop information using smart card transaction data. J. Mod. Transp. 2018, 26, 209–219. [Google Scholar] [CrossRef] [Green Version]
  89. TRB. Smartcard Interoperability Issues for the Transit Industry; The National Academies Press: Washington, DC, USA, 2006. [Google Scholar] [CrossRef]
  90. Monsalve, M.C.; Wolanski, M.P.; Burden, M.; Krukowski, P.J.; Czapski, R.; Michnowska, M.; Wang, W.G. Public Transport Automatic Fare Collection Interoperability Assessing Options for Poland; Technical Report; The World Bank: Washington, DC, USA, 2016. [Google Scholar]
  91. Covic, F.; Voß, S. Interoperable smart card data management in public mass transit. Public Transp. 2019, 11, 523–548. [Google Scholar] [CrossRef]
  92. Bagchi, M.; White, P. The potential of public transport smart card data. Transp. Policy 2005, 12, 464–474. [Google Scholar] [CrossRef]
  93. Chandesris, M.; Nazem, M. Workshop Synthesis: Smart card data, new methods and applications for public transport. Transp. Res. Procedia 2018, 32, 16–23. [Google Scholar] [CrossRef]
  94. Yu, W.; Bai, H.; Chen, J.; Yan, X. Anomaly Detection of Passenger OD on Nanjing Metro Based on Smart Card Big Data. IEEE Access 2019, 7, 138624–138636. [Google Scholar] [CrossRef]
  95. Tavassoli, A.; Mesbah, M.; Hickman, M. Application of smart card data in validating a large-scale multi-modal transit assignment model. Public Transp. 2018, 10, 1–21. [Google Scholar] [CrossRef]
  96. TRB. Passenger Counting Systems; The National Academies Press: Washington, DC, USA, 2008. [Google Scholar] [CrossRef]
  97. TRB. Using Archived AVL-APC Data to Improve Transit Performance and Management; The National Academies Press: Washington, DC, USA, 2006. [Google Scholar] [CrossRef]
  98. Dessouky, M.; Hall, R.; Zhang, L.; Singh, A. Real-time control of buses for schedule coordination at a terminal. Transp. Res. Part A Policy Pract. 2003, 37, 145–164. [Google Scholar] [CrossRef]
  99. Hellinga, B.; Yang, F.; Hart-Bishop, J. Estimating signalized intersection delays to transit vehicles: Using archived data from automatic vehicle location and passenger counting system. Transp. Res. Rec. J. Transp. Res. Board 2011, 2259, 158–167. [Google Scholar] [CrossRef]
  100. Nielsen, B.F.; Frølich, L.; Nielsen, O.A.; Filges, D. Estimating passenger numbers in trains using existing weighing capabilities. Transp. A Transp. Sci. 2013, 10, 502–517. [Google Scholar] [CrossRef]
  101. Barabino, B.; Di Francesco, M.; Mozzoni, S. An Offline Framework for Handling Automatic Passenger Counting Raw Data. IEEE Trans. Intell. Transp. Syst. 2014, 15, 2443–2456. [Google Scholar] [CrossRef]
  102. Sun, S.; Akhtar, N.; Song, H.; Zhang, C.; Li, J.; Mian, A. Benchmark Data and Method for Real-Time People Counting in Cluttered Scenes Using Depth Sensors. IEEE Trans. Intell. Transp. Syst. 2019, 20, 3599–3612. [Google Scholar] [CrossRef]
  103. Kocak, Y.P.; Sevgen, S. Detecting and counting people using real-time directional algorithms implemented by compute unified device architecture. Neurocomputing 2017, 248, 105–111. [Google Scholar] [CrossRef]
  104. Liu, G.; Yin, Z.; Jia, Y.; Xie, Y. Passenger flow estimation based on convolutional neural network in public transportation system. Knowl.-Based Syst. 2017, 123, 102–115. [Google Scholar] [CrossRef]
  105. Rajbhandari, R.; Chien, S.I.; Daniel, J.R. Estimation of Bus Dwell Times with Automatic Passenger Counter Information. Transp. Res. Rec. J. Transp. Res. Board 2003, 1841, 120–127. [Google Scholar] [CrossRef]
  106. Nuzzolo, A.; Crisalli, U.; Comi, A.; Rosati, L. A mesoscopic transit assignment model including real-time predictive information on crowding. J. Intell. Transp. Syst. 2016, 20, 316–333. [Google Scholar] [CrossRef]
  107. Siebert, M.; Ellenberger, D. Validation of automatic passenger counting: Introducing the t-test-induced equivalence test. Transportation 2020, 47, 3031–3045. [Google Scholar] [CrossRef] [Green Version]
  108. Saavedra, M.; Hellinga, B.; Casello, J. Automated Quality Assurance Methodology for Archived Transit Data from Automatic Vehicle Location and Passenger Counting Systems. Transp. Res. Rec. J. Transp. Res. Board 2011, 2256, 130–141. [Google Scholar] [CrossRef]
  109. TRB. Open Data: Challenges and Opportunities for Transit Agencies; The National Academies Press: Washington, DC, USA, 2015. [Google Scholar] [CrossRef]
  110. Singhal, A.; Kamga, C.; Yazici, A. Impact of weather on urban transit ridership. Transp. Res. Part A Policy Pract. 2014, 69, 379–391. [Google Scholar] [CrossRef]
  111. Miao, Q.; Welch, E.W.; Sriraj, P. Extreme weather, public transport ridership and moderating effect of bus stop shelters. J. Transp. Geogr. 2019, 74, 125–133. [Google Scholar] [CrossRef]
  112. Wu, J.; Liao, H. Weather, travel mode choice, and impacts on subway ridership in Beijing. Transp. Res. Part A Policy Pract. 2020, 135, 264–279. [Google Scholar] [CrossRef]
  113. Zhao, J.; Wang, J.; Xing, Z.; Luan, X.; Jiang, Y. Weather and cycling: Mining big data to have an in-depth understanding of the association of weather variability with cycling on an off-road trail and an on-road bike lane. Transp. Res. Part A Policy Pract. 2018, 111, 119–135. [Google Scholar] [CrossRef]
  114. Li, J.; Li, X.; Chen, D.; Godding, L. Assessment of metro ridership fluctuation caused by weather conditions in Asian context: Using archived weather and ridership data in Nanjing. J. Transp. Geogr. 2018, 66, 356–368. [Google Scholar] [CrossRef]
  115. Kashfi, S.A.; Bunker, J.M.; Yigitcanlar, T. Modelling and analysing effects of complex seasonality and weather on an area’s daily transit ridership rate. J. Transp. Geogr. 2016, 54, 310–324. [Google Scholar] [CrossRef]
  116. Ma, L.; Xiong, H.; Wang, Z.; Xie, K. Impact of weather conditions on middle school students’ commute mode choices: Empirical findings from Beijing, China. Transp. Res. Part D Transp. Environ. 2019, 68, 39–51. [Google Scholar] [CrossRef]
  117. Arana, P.; Cabezudo, S.; Peñalba, M. Influence of weather conditions on transit ridership: A statistical study using data from Smartcards. Transp. Res. Part A Policy Pract. 2014, 59, 1–12. [Google Scholar] [CrossRef]
  118. Liu, C.; Susilo, Y.O.; Karlström, A. The influence of weather characteristics variability on individual’s travel mode choice in different seasons and regions in Sweden. Transp. Policy 2015, 41, 147–158. [Google Scholar] [CrossRef]
  119. Hyland, M.; Frei, C.; Frei, A.; Mahmassani, H.S. Riders on the storm: Exploring weather and seasonality effects on commute mode choice in Chicago. Travel Behav. Soc. 2018, 13, 44–60. [Google Scholar] [CrossRef]
  120. Böcker, L.; Dijst, M.; Faber, J. Weather, transport mode choices and emotional travel experiences. Transp. Res. Part A Policy Pract. 2016, 94, 360–373. [Google Scholar] [CrossRef]
  121. Zhou, M.; Wang, D.; Li, Q.; Yue, Y.; Tu, W.; Cao, R. Impacts of weather on public transport ridership: Results from mining data from different sources. Transp. Res. Part C Emerg. Technol. 2017, 75, 17–29. [Google Scholar] [CrossRef] [Green Version]
  122. Wei, M.; Liu, Y.; Sigler, T.; Liu, X.; Corcoran, J. The influence of weather conditions on adult transit ridership in the sub-tropics. Transp. Res. Part A Policy Pract. 2019, 125, 106–118. [Google Scholar] [CrossRef]
  123. Mesbah, M.; Lin, J.; Currie, G. “Weather” transit is reliable? Using AVL data to explore tram performance in Melbourne, Australia. J. Traffic Transp. Eng. 2015, 2, 125–135. [Google Scholar] [CrossRef] [Green Version]
  124. Breusegem, V.V.; Campion, G.; Bastin, G. Traffic modeling and state feedback control for metro lines. IEEE Trans. Autom. Control 1991, 36, 770–784. [Google Scholar] [CrossRef] [Green Version]
  125. Ma, J.; Chan, J.; Ristanoski, G.; Rajasegarar, S.; Leckie, C. Bus travel time prediction with real-time traffic information. Transp. Res. Part C Emerg. Technol. 2019, 105, 536–549. [Google Scholar] [CrossRef]
  126. Barnes, R.; Buthpitiya, S.; Cook, J.; Fabrikant, A.; Tomkins, A.; Xu, F. BusTr: Predicting Bus Travel Times from Real-Time Traffic. In Proceedings of the 26th ACM SIGKDD International Conference on Knowledge Discovery & Data Mining, Virtual Event, 6–10 July 2020. [Google Scholar] [CrossRef]
  127. Lv, Y.; Duan, Y.; Kang, W.; Li, Z.; Wang, F.Y. Traffic Flow Prediction With Big Data: A Deep Learning Approach. IEEE Trans. Intell. Transp. Syst. 2014, 16, 865–873. [Google Scholar] [CrossRef]
  128. D’Andrea, E.; Marcelloni, F. Detection of traffic congestion and incidents from GPS trace analysis. Expert Syst. Appl. 2017, 73, 43–56. [Google Scholar] [CrossRef]
  129. Rehrl, K.; Henneberger, S.; Leitinger, S.; Wagner, A.; Wimmer, M. Towards a National Floating Car Data Platform for Austria. In Proceedings of the 25th ITS World Congress, Copenhagen, Denmark, 17–21 September 2018. [Google Scholar]
  130. Zhou, F.; Li, L.; Zhang, K.; Trajcevski, G. Urban flow prediction with spatial–temporal neural ODEs. Transp. Res. Part C Emerg. Technol. 2021, 124, 102912. [Google Scholar] [CrossRef]
  131. Sun, Z.; Zan, B.; Ban, X.J.; Gruteser, M. Privacy protection method for fine-grained urban traffic modeling using mobile sensors. Transp. Res. Part B Methodol. 2013, 56, 50–69. [Google Scholar] [CrossRef]
  132. Nguyen-Phuoc, D.Q.; Currie, G.; Gruyter, C.D.; Kim, I.; Young, W. Modelling the net traffic congestion impact of bus operations in Melbourne. Transp. Res. Part A Policy Pract. 2018, 117, 1–12. [Google Scholar] [CrossRef]
  133. Chen, Y.; Lv, Y.; Wang, X.; Li, L.; Wang, F.Y. Detecting Traffic Information From Social Media Texts With Deep Learning Approaches. IEEE Trans. Intell. Transp. Syst. 2019, 20, 3049–3058. [Google Scholar] [CrossRef]
  134. Rashidi, T.H.; Abbasi, A.; Maghrebi, M.; Hasan, S.; Waller, T.S. Exploring the capacity of social media data for modelling travel behaviour: Opportunities and challenges. Transp. Res. Part C Emerg. Technol. 2017, 75, 197–211. [Google Scholar] [CrossRef]
  135. Haghighi, N.N.; Liu, X.C.; Wei, R.; Li, W.; Shao, H. Using Twitter data for transit performance assessment: A framework for evaluating transit riders opinions about quality of service. Public Transp. 2018, 10, 363–377. [Google Scholar] [CrossRef]
  136. Zhang, Z.; He, Q.; Gao, J.; Ni, M. A deep learning approach for detecting traffic accidents from social media data. Transp. Res. Part C Emerg. Technol. 2018, 86, 580–596. [Google Scholar] [CrossRef] [Green Version]
  137. Cottrill, C.; Gault, P.; Yeboah, G.; Nelson, J.D.; Anable, J.; Budd, T. Tweeting Transit: An examination of social media strategies for transport information management during a large event. Transp. Res. Part C Emerg. Technol. 2017, 77, 421–432. [Google Scholar] [CrossRef]
  138. Huang, A.; Gallegos, L.; Lerman, K. Travel analytics: Understanding how destination choice and business clusters are connected based on social media data. Transp. Res. Part C Emerg. Technol. 2017, 77, 245–256. [Google Scholar] [CrossRef]
  139. Ni, M.; He, Q.; Gao, J. Forecasting the Subway Passenger Flow Under Event Occurrences with Social Media. IEEE Trans. Intell. Transp. Syst. 2016, 18, 1623–1632. [Google Scholar] [CrossRef]
  140. Google. GTFS Realtime Reference. 2021. Available online: https://developers.google.com/transit/gtfs-realtime/reference/ (accessed on 13 June 2021).
  141. Bjerre-Nielsen, A.; Minor, K.; Sapieżyński, P.; Lehmann, S.; Lassen, D.D. Inferring transportation mode from smartphone sensors: Evaluating the potential of Wi-Fi and Bluetooth. PLoS ONE 2020, 15, e0234003. [Google Scholar] [CrossRef]
  142. Kong, X.; Xia, F.; Li, J.; Hou, M.; Li, M.; Xiang, Y. A Shared Bus Profiling Scheme for Smart Cities Based on Heterogeneous Mobile Crowdsourced Data. IEEE Trans. Ind. Inform. 2020, 16, 1436–1444. [Google Scholar] [CrossRef]
  143. Kong, L.; Wu, Z.; Chen, G.; Qiu, M.; Mumtaz, S.; Rodrigues, J.J.P.C. Crowdsensing-Based Cross-Operator Switch in Rail Transit Systems. IEEE Trans. Commun. 2020, 68, 7938–7947. [Google Scholar] [CrossRef]
  144. Harrison, G.; Grant-Muller, S.M.; Hodgson, F.C. New and emerging data forms in transportation planning and policy: Opportunities and challenges for “Track and Trace” data. Transp. Res. Part C Emerg. Technol. 2020, 117, 102672. [Google Scholar] [CrossRef]
  145. Berggren, U.; Brundell-Freij, K.; Svensson, H.; Wretstrand, A. Effects from usage of pre-trip information and passenger scheduling strategies on waiting times in public transport: An empirical survey based on a dedicated smartphone application. Public Transp. 2019. [Google Scholar] [CrossRef] [Green Version]
  146. Rowe, F. Contact tracing apps and values dilemmas: A privacy paradox in a neo-liberal world. Int. J. Inf. Manag. 2020, 55, 102178. [Google Scholar] [CrossRef] [PubMed]
  147. Wang, K.; Qi, X.; Shu, L.; Deng, D.; Rodrigues, J.J. Toward trustworthy crowdsourcing in the social internet of things. IEEE Wirel. Commun. 2016, 23, 30–36. [Google Scholar] [CrossRef]
  148. Shu, J.; Jia, X.; Yang, K.; Wang, H. Privacy-Preserving Task Recommendation Services for Crowdsourcing. IEEE Trans. Serv. Comput. 2021, 14, 235–247. [Google Scholar] [CrossRef]
  149. Gadziński, J. Perspectives of the use of smartphones in travel behaviour studies: Findings from a literature review and a pilot study. Transp. Res. Part C Emerg. Technol. 2018, 88, 74–86. [Google Scholar] [CrossRef]
  150. Gündling, F.; Hopp, F.; Weihe, K. Efficient monitoring of public transport journeys. Public Transp. 2020, 12, 631–645. [Google Scholar] [CrossRef]
  151. Tu, W.; Cao, J.; Yue, Y.; Shaw, S.L.; Zhou, M.; Wang, Z.; Chang, X.; Xu, Y.; Li, Q. Coupling mobile phone and social media data: A new approach to understanding urban functions and diurnal patterns. Int. J. Geogr. Inf. Sci. 2017, 31, 2331–2358. [Google Scholar] [CrossRef]
  152. Mukheja, P.; K, M.K.; Velaga, N.R.; Sharmila, R. Smartphone-based crowdsourcing for position estimation of public transport vehicles. IET Intell. Transp. Syst. 2017, 11, 588–595. [Google Scholar] [CrossRef]
  153. Wang, Z.; Wang, S.; Lian, H. A route-planning method for long-distance commuter express bus service based on OD estimation from mobile phone location data: The case of the Changping Corridor in Beijing. Public Transp. 2020, 13, 101–125. [Google Scholar] [CrossRef]
  154. Lee, W.K.; Sohn, S.Y.; Heo, J. Utilizing mobile phone-based floating population data to measure the spatial accessibility to public transit. Appl. Geogr. 2018, 92, 123–130. [Google Scholar] [CrossRef]
  155. Kujala, R.; Weckström, C.; Darst, R.K.; Mladenović, M.N.; Saramäki, J. A collection of public transport network data sets for 25 cities. Sci. Data 2018, 5, 180089. [Google Scholar] [CrossRef] [Green Version]
  156. Kaeoruean, K.; Phithakkitnukoon, S.; Demissie, M.G.; Kattan, L.; Ratti, C. Analysis of demand–supply gaps in public transit systems based on census and GTFS data: A case study of Calgary, Canada. Public Transp. 2020, 12, 483–516. [Google Scholar] [CrossRef]
  157. Lock, O.; Bednarz, T.; Pettit, C. The visual analytics of big, open public transport data – a framework and pipeline for monitoring system performance in Greater Sydney. Big Earth Data 2021, 5, 134–159. [Google Scholar] [CrossRef]
  158. Sahu, P.K.; Mehran, B.; Mahapatra, S.P.; Sharma, S. Spatial data analysis approach for network-wide consolidation of bus stop locations. Public Transp. 2021. [Google Scholar] [CrossRef]
  159. Bonnel, P.; Munizaga, M.A. Transport survey methods-in the era of big data facing new and old challenges. Transp. Res. Procedia 2018, 32, 1–15. [Google Scholar] [CrossRef]
  160. Saghapour, T.; Moridpour, S.; Thompson, R.G. Public transport accessibility in metropolitan areas: A new approach incorporating population density. J. Transp. Geogr. 2016, 54, 273–285. [Google Scholar] [CrossRef]
  161. Urbanek, A. Potential of modal shift from private cars to public transport: A survey on the commuters’ attitudes and willingness to switch—A case study of Silesia Province, Poland. Res. Transp. Econ. 2021, 85, 101008. [Google Scholar] [CrossRef]
  162. Ermagun, A.; Tilahun, N. Equity of transit accessibility across Chicago. Transp. Res. Part D Transp. Environ. 2020, 86, 102461. [Google Scholar] [CrossRef]
  163. Chapleau, R.; Gaudette, P.; Spurr, T. Strict and Deep Comparison of Revealed Transit Trip Structure between Computer-Assisted Telephone Interview Household Travel Survey and Smart Cards. Transp. Res. Rec. J. Transp. Res. Board 2018, 2672, 13–22. [Google Scholar] [CrossRef]
  164. Poonawala, H.; Kolar, V.; Blandin, S.; Wynter, L.; Sahu, S. Singapore in motion: Insights on public transport service level through farecard and mobile data analytics. In Proceedings of the 22nd ACM SIGKDD International Conference on Knowledge Discovery and Data Mining; Association for Computing Machinery: New York, NY, USA, 2016; pp. 589–598. [Google Scholar] [CrossRef]
  165. Ji, Y.; Mishalani, R.G.; McCord, M.R. Transit passenger origin–destination flow estimation: Efficiently combining onboard survey and large automatic passenger count datasets. Transp. Res. Part C Emerg. Technol. 2015, 58, 178–192. [Google Scholar] [CrossRef]
  166. Wolf, J.; Guensler, R.; Bachman, W. Elimination of the Travel Diary: Experiment to Derive Trip Purpose from Global Positioning System Travel Data. Transp. Res. Rec. J. Transp. Res. Board 2001, 1768, 125–134. [Google Scholar] [CrossRef] [Green Version]
  167. Vij, A.; Shankari, K. When is big data big enough? Implications of using GPS-based surveys for travel demand analysis. Transp. Res. Part C Emerg. Technol. 2015, 56, 446–462. [Google Scholar] [CrossRef] [Green Version]
  168. Verzosa, N.; Greaves, S.; Ellison, R.; Ellison, A.; Davis, M. Eliciting preferences for ‘gamified’ travel surveys: A best-worst approach. Transp. Res. Procedia 2018, 32, 211–223. [Google Scholar] [CrossRef]
  169. Toprak, C.; Platt, J.; Ho, H.Y.; Mueller, F. Cart-Load-o-Fun: Designing Digital Games for Trams. In CHI ’13 Extended Abstracts on Human Factors in Computing Systems; Association for Computing Machinery: New York, NY, USA, 2013; pp. 2877–2878. [Google Scholar] [CrossRef]
  170. Chen, C.; Ma, J.; Susilo, Y.; Liu, Y.; Wang, M. The promises of big data and small data for travel behavior (aka human mobility) analysis. Transp. Res. Part C Emerg. Technol. 2016, 68, 285–299. [Google Scholar] [CrossRef] [PubMed] [Green Version]
  171. Eriksson Kuitu, J. Visualizing Public Transport with Heat-Maps: Comparing the Scalability of SVG and Canvas for Heat-Maps. Bachelor’s Thesis, Mid Sweden University, Östersund, Sweden, 2020. [Google Scholar]
  172. Dong, H.; Wang, Y. Bus passenger flow and running status analyzation system based on MAC address. In Proceedings of the International Conference on Transportation and Development 2018, Pittsburg, PA, USA, 15–18 July 2018; pp. 208–217. [Google Scholar] [CrossRef]
  173. Li, Z.; Chen, C.; Wang, K. Cloud Computing for Agent-Based Urban Transportation Systems. IEEE Intell. Syst. 2011, 26, 73–79. [Google Scholar] [CrossRef]
  174. Heilig, L.; Voß, S. A Scientometric Analysis of Cloud Computing Literature. IEEE Trans. Cloud Comput. 2014, 2, 266–278. [Google Scholar] [CrossRef]
  175. White, G.; Zink, A.; Codecá, L.; Clarke, S. A digital twin smart city for citizen feedback. Cities 2021, 110, 103064. [Google Scholar] [CrossRef]
  176. Kaewunruen, S.; Xu, N. Digital Twin for Sustainability Evaluation of Railway Station Buildings. Front. Built Environ. 2018, 4, 77. [Google Scholar] [CrossRef] [Green Version]
  177. Tibaut, A.; Kaučič, B.; Rebolj, D. A standardised approach for sustainable interoperability between public transport passenger information systems. Comput. Ind. 2012, 63, 788–798. [Google Scholar] [CrossRef]
  178. Google. Google Maps. 2021. Available online: https://www.google.com/maps/ (accessed on 31 July 2021).
  179. NeTEx. Network Timetable Exchange. 2021. Available online: http://netex-cen.eu/ (accessed on 31 July 2021).
  180. Scholz, G. IT-Systeme für Verkehrsunternehmen; dpunkt: Heidelberg, Germany, 2012. [Google Scholar]
  181. VDV. Soll-Daten-Schnittstellen: Europäische Norm NeTEx (CEN). 2021. (In German). Available online: https://www.vdv.de/netex.aspx (accessed on 31 July 2021).
  182. Jongo, P.L.N.; Meyer, M.; Steinmetz, R. Overview of Mobile Passenger Information Systems in Public Transportation; KOM-TR-2010-02, Technical Report; KOM, TU Darmstadt: Darmstadt, Germany, 2010. [Google Scholar]
  183. Liu, Y.; Weng, X.; Wan, J.; Yue, X.; Song, H.; Vasilakos, A.V. Exploring Data Validity in Transportation Systems for Smart Cities. IEEE Commun. Mag. 2017, 55, 26–33. [Google Scholar] [CrossRef]
  184. Hagenauer, J.; Helbich, M. A comparative study of machine learning classifiers for modeling travel mode choice. Expert Syst. Appl. 2017, 78, 273–282. [Google Scholar] [CrossRef]
  185. Cui, L.; Su, D.; Zhou, Y.; Zhang, L.; Wu, Y.; Chen, S. Edge Learning for Surveillance Video Uploading Sharing in Public Transport Systems. IEEE Trans. Intell. Transp. Syst. 2021, 22, 2274–2285. [Google Scholar] [CrossRef]
  186. Liu, Y.; Lyu, C.; Liu, X.; Liu, Z. Automatic Feature Engineering for Bus Passenger Flow Prediction Based on Modular Convolutional Neural Network. IEEE Trans. Intell. Transp. Syst. 2021, 22, 2349–2358. [Google Scholar] [CrossRef]
  187. Jahangiri, A.; Rakha, H.A. Applying Machine Learning Techniques to Transportation Mode Recognition Using Mobile Phone Sensor Data. IEEE Trans. Intell. Transp. Syst. 2015, 16, 2406–2417. [Google Scholar] [CrossRef]
  188. Elhamod, M.; Levine, M.D. Automated Real-Time Detection of Potentially Suspicious Behavior in Public Transport Areas. IEEE Trans. Intell. Transp. Syst. 2013, 14, 688–699. [Google Scholar] [CrossRef]
  189. Chen, X.; Chen, Y.; Saunier, N.; Sun, L. Scalable low-rank tensor learning for spatiotemporal traffic data imputation. Transp. Res. Part C Emerg. Technol. 2021, 129, 103226. [Google Scholar] [CrossRef]
  190. Zúñiga, F.; Muñoz, J.C.; Giesen, R. Estimation and prediction of dynamic matrix travel on a public transport corridor using historical data and real-time information. Public Transp. 2021, 13, 59–80. [Google Scholar] [CrossRef]
  191. Nimpanomprasert, T.; Xie, L.; Kliewer, N. Comparing Two Hybrid Neural Network Models to Predict Real-World Bus Travel Time; Technical Report; Institute of Information Systems, Leuphana University of Lüneburg: Lüneburg, Germany, 2021. [Google Scholar]
  192. Julio, N.; Giesen, R.; Lizana, P. Real-time prediction of bus travel speeds using traffic shockwaves and machine learning algorithms. Res. Transp. Econ. 2016, 59, 250–257. [Google Scholar] [CrossRef]
  193. Steinfeld, A.; Zimmerman, J.; Tomasic, A.; Yoo, D.; Aziz, R.D. Mobile Transit Information from Universal Design and Crowdsourcing. Transp. Res. Rec. 2011, 2217, 95–102. [Google Scholar] [CrossRef]
  194. Chen, M.; Liu, X.; Xia, J.; Chien, S.I. A dynamic bus-arrival time prediction model based on APC data. Comput.-Aided Civ. Infrastruct. Eng. 2004, 19, 364–376. [Google Scholar] [CrossRef]
  195. Webb, A.; Kumar, P.; Khani, A. Estimation of passenger waiting time using automatically collected transit data. Public Transp. 2020, 12, 299–311. [Google Scholar] [CrossRef]
  196. Li, Y.; Yang, D.; Hu, X. A differential privacy-based privacy-preserving data publishing algorithm for transit smart card data. Transp. Res. Part C Emerg. Technol. 2020, 115, 102634. [Google Scholar] [CrossRef]
  197. Sarkar, C.; Treurniet, J.J.; Narayana, S.; Prasad, R.V.; de Boer, W. SEAT: Secure Energy-Efficient Automated Public Transport Ticketing System. IEEE Trans. Green Commun. Netw. 2018, 2, 222–233. [Google Scholar] [CrossRef]
  198. Stockburger, L.; Kokosioulis, G.; Mukkamala, A.; Mukkamala, R.R.; Avital, M. Blockchain-enabled decentralized identify management: The case of self-sovereign identity in public transportation. Blockchain Res. Appl. 2021, 100014. [Google Scholar] [CrossRef]
  199. Corsar, D.; Edwards, P.; Nelson, J.; Baillie, C.; Papangelis, K.; Velaga, N. Linking open data and the crowd for real-time passenger information. J. Web Semant. 2017, 43, 18–24. [Google Scholar] [CrossRef] [Green Version]
  200. Prommaharaj, P.; Phithakkitnukoon, S.; Demissie, M.G.; Kattan, L.; Ratti, C. Visualizing public transit system operation with GTFS data: A case study of Calgary, Canada. Heliyon 2020, 6, e03729. [Google Scholar] [CrossRef]
  201. Cheng, T.; Tanaksaranond, G.; Brunsdon, C.; Haworth, J. Exploratory visualisation of congestion evolutions on urban transport networks. Transp. Res. Part C Emerg. Technol. 2013, 36, 296–306. [Google Scholar] [CrossRef] [Green Version]
  202. Brakewood, C.; Watkins, K. A literature review of the passenger benefits of real-time transit information. Transp. Rev. 2019, 39, 327–356. [Google Scholar] [CrossRef]
  203. Lin, H.; Tang, C. Analysis and optimization of urban public transport lines based on multiobjective adaptive particle swarm optimization. IEEE Trans. Intell. Transp. Syst. 2021, 1–13. [Google Scholar] [CrossRef]
  204. Lyu, C.; Wu, X.; Liu, Y.; Liu, Z. A Partial-Fréchet-Distance-Based Framework for Bus Route Identification. IEEE Trans. Intell. Transp. Syst. 2021, 1–6. [Google Scholar] [CrossRef]
  205. Wollnik, M. Ein Referenzmodell des Informationsmanagements. Inf. Manag. 1988, 3, 34–43. [Google Scholar]
  206. Grisé, E.; Wasfi, R.; Ross, N.A.; El-Geneidy, A. Evaluating methods for measuring daily walking to public transport: Balancing accuracy and data availability. J. Transp. Health 2019, 15, 100638. [Google Scholar] [CrossRef]
  207. Hadas, Y. Assessing public transport systems connectivity based on Google Transit data. J. Transp. Geogr. 2013, 33, 105–116. [Google Scholar] [CrossRef]
  208. Pereira, F.C.; Rodrigues, F.; Ben-Akiva, M. Using Data From the Web to Predict Public Transport Arrivals Under Special Events Scenarios. J. Intell. Transp. Syst. 2015, 19, 273–288. [Google Scholar] [CrossRef]
  209. Yu, J.; Voß, S.; Cammin, P. Cruise Passenger-Oriented Evaluation System for the Public Transport of Hinterland Destinations; Technical Report; Institute of Information Systems, University of Hamburg: Hamburg, Germany, 2021. [Google Scholar]
  210. Hensher, D.A.; Rose, J.M.; Collins, A.T. Identifying commuter preferences for existing modes and a proposed Metro in Sydney, Australia with special reference to crowding. Public Transp. 2011, 3, 109–147. [Google Scholar] [CrossRef]
  211. Redmond, M.; Campbell, A.M.; Ehmke, J.F. Data-driven planning of reliable itineraries in multi-modal transit networks. Public Transp. 2019, 12, 171–205. [Google Scholar] [CrossRef]
Figure 1. The framework based on the IM three-layer model.
Sustainability 13 11450 g001
Figure 2. Internal vs. external information management within the framework.
Sustainability 13 11450 g002
Figure 3. Internal vs. external information management.
Sustainability 13 11450 g003
Table 1. Studies on the AVL data source.
Ref.AspectMethodologyPotential
[29]ReliabilityQualitative approachesIntroduction of a new index (measure)
[32]System performanceCausal inferenceA large number of stops do not meet performance measures
[31]On-time performanceA Gaussian probabilistic approach- Update bus timetables
- Maximize on-time performance
[39]Location estimation- Expectation-maximization
- Probabilistic map matching
Reconstruct vehicle trajectories from sparse sequences of GPS points
[34]Data punctuality- Control dashboards
- Empirical measures
Match processed AVL data with passenger patterns
[33]Time reliability- Control dashboards
- Data analytics
- Characterize bus stops for routes where reliability is insufficient
- Identify the causes
- Provide preventive strategies
[35]Time reliability and punctualityInformation retrieval- Handle anomalies in AVL raw data
- Connect the measurements of regularity and punctuality to passenger patterns
- Propose a web platform to support transit
[41]Travel changesA scoring method- Match observations of the trajectories of transit vehicles with the routes they serve
- Detect travel changes
[37]Bus schedule adherence- Connected vehicle technologies
- Adaptive optimization model
- Optimize signal synchronization
- Improve the reliability of the bus service by prioritizing public transport signals
Table 2. Studies on the AFC data source.
Ref.AspectMethodologyPotentialData
[59]Passenger incidence behaviorSchedule-based assignmentEstimate causes of incidence headway-
[65]O-D matrixComparison with real dataValidate the results of the survey- AVL
- Survey
[51]O-D matrixVisualizationExamine the spatio–temporal behavioral dynamics of bus passenger travelsAVL
[72]ReliabilityVisualization- Identify characteristics of passenger flows
- Analyze travel time, reliability from users’ perspective
-
[58]Travel behaviorGaussian mixture model- Cluster passengers based on their temporal habits
- Extract patterns for each cluster
-
[60]Passengers’ habitual route choiceA stickiness conceptQuantify bus passengers’ route stickiness based on a stickiness index-
[56]Travel behavior- A probability matrix
- A spatio-temporal method
- Measure the consistency of public transport travel behavior
- The consistency is highly dependent on the metric
-
[95]Transit assignment modelValidation frameworkValidation and case studyGTFS, AFC, smart card
[62]Trip purpose and home location- A center-point based algorithm
- A rule-based approach
- Infer the home location for one-trip passengers
- Identify indicators in view of time, space and travel regularity
-
[68]O-D matrixA trip-chaining method- Inference of trips
- find the most likely trajectory
AVL
[71]O-D matrixA Markov chain Monte Carlo methodDetect travelers’ mini-activities-
[81]Waiting timeProbabilistic modeling- Estimate passenger waiting times
- Many passengers arrive in a timely manner
-
[61]Customized serviceDensity-based spatial clustering- Cluster bus passengers
- Recommend customized bus lines
-
[91]Interoperability- A holistic conceptual model
- Interviews
- Explore the requirements to enable a model application in an interoperable environment
- A four-step procedure for standardized data handling and management
Survey
[57]Travel behaviorStochastic transit assignment modelAssign trips to different users-
[86]RidershipA regression modelInfer the impact of COVID-19 on transit ridership-
[87]Infection rateSpatial lag modelsDetermine whether subway ridership has an impact on the infection rate-
Table 3. Studies on the APC data.
RefAspectMethodologyPotentialData
[98]Schedule coordination- Statistical forecasting
- Simulation
Balance the time saved for late-arriving transferAVL
[105]Dwell timeDescriptive analysisExplain the correlation between bus dwell time and passenger boarding and alighting-
[99]Signalized intersection delaysA quality assurance methodology- Identify and prioritize candidate measures for transit priority
- Include transit signal priorities
AVL
[108]Data quality assuranceA statistical testIdentify unreliable archived AVL-APC dataAVL
[100]Passenger countingModeling weight data- Estimate passenger numbers in trains
- The method provides more accurate passenger counts than the infrared equipment
-
[101]Data validationMatching bus stop and APCRemove anomalies (due to operation in service and technical problems)-
[106]On-board loads predictionA mesoscopic assignment model- Predict on-board passenger numbers in transit networks
- Capture effects of individual predicted information and on-board crowding
-
[104]Passenger counting- A conventional neural network detection model - A spatio-temporal context model- Detect passengers and track their moving head
- The technique is more accurate in low-resolution scenes and with varying illumination
-
[102]- Data generation
- Real-time counting
Computing a normalized height image- Provide large-scale benchmark public data sets for passenger counting
- Propose a method for real-time counting people in crowded scenes
-
[107]APC validationExtended t-testThe introduction of a new applicable testing approach-
Table 4. Studies on the weather data.
Ref.AspectMethodologyPotentialData
 [110]Transit ridershipCorrelation- Demonstrate the impact of adverse weather conditions
- Recommend policy measures to mitigate the ridership differences due to weather
-
[123]ReliabilityRegression analysis- Investigate the effect of weather conditions on the travel time reliability of on-road rail transit
- Only precipitation and temperature have a significant impact on the tram service
AVL
[117]- Data generation - Real-time countingLinear regression- Wind and rain could result in a decrease in the number of trips
- Temperature rise causes an increase in the number of trips
- The difference is less observable for smart card users
AFC
[115]Transit ridershipRegression models- Develop a daily ridership rate estimation model
- Understand the impact of weather factors on daily bus transit ridership
-
[121]Transit ridershipStatistical models- Examine the impact of the weather on hourly transit ridership
- Combine smart card data and meteorological observations
AFC
[114]Metro ridershipA moving average method and analyses of variance- Meteorological events generally decrease ridership
- The magnitude of the impact depends on the nature of the weather disturbances
-
[119]Metro ridership- A mixed-logit mode choice model - A survey- Analyzes the impacts of weather and seasonality on commute mode choice
- The impact of weather and seasonality on the commute mode choice vary across the population
Survey
[111]Bus ridershipDescriptive analysis- Weather disturbances have a negative impact on bus ridership
- Bus stop shelters can mitigate this impact
-
[116]Mode choiceMultinomial probit and multinomial logit models- Weather conditions have a significant impact on students commute mode choices
- Determine the main weather features that affects them
- Multinomial probit is suitable for the problem
-
[112]Subway ridershipRegression models- Subway is less vulnerable to inclement weather
- Prevention measures are needed to deal with heavy rains
Survey
Table 5. Studies on the traffic data source.
Ref.AspectMethodologyPotentialData
 [131]PrivacyKnowledge-based models- Protect privacy while satisfying the data needs of fine-grained urban traffic modeling
- Filtering approaches based on individual tracking probability and entropy are more effective than pure random sampling in improving the level of privacy
Phone
 [127]Traffic flow predictionDeep learning- Predict traffic flow
- Consider nonlinear spatial and temporal correlations from traffic data
Social media
[128]Traffic congestion and incidentsA spatio-temporal approachDetect real-time traffic jams and incidentsAVL
[132]Bus impact on trafficThe four-step model- Estimate the positive impact of buses on relieving congestion
- Investigate the negative impact of buses
- Bus network contributes to reducing the number of severely congested roads
Survey
[133]Information detectionDeep learningExtract relevant traffic information from a microblogging platformSocial media
[125]Time predictionA segment-based approach- Predict public transport bus travel time
- Separate bus routes into transit and dwelling segments
AVL
[126]Bus travel time prediction- Deep learning
- Feature selection
- Predict travel time based on contextual time and traffic time estimation
- Traffic estimation
-
[130]Traffic flow prediction- Deep learning - Continuous time dynamics- Model temporal and spatial dependencies and dynamics
- Investigate the factors that affect the city traffic
- Consider the balance of the prediction accuracy and computational efficiency
-
Table 6. Studies on the social media data source.
Ref.AspectMethodologyPotentialData
 [139]Flow prediction- Statistical analysis
- Optimization
- Examine social media activities and sense event occurrences
- A moderate positive correlation between passenger flow and the rates of social media posts
APC
[134]Travel behaviorA survey- Analyze a survey on the capacity of social media
- Discuss directions for behavioral travel demand modeling using social media
Survey
[137]Communication enforcement- Qualitative analysis
- Interviews
- Examine the coordination of social media practices at a large event
- Analyze Twitter data related to the communication of transport information
- The need to coordinate a consistent message across the information being shared on social media
Survey
[138]Travel analytics- Statistical analysis
- Visualization
- Study the relationship between characteristics of business clusters and check-in activities
- Understand the relationships among clusters embedded in a network.
-
[135]Quality of service- Sentiment analysis
- ML
- Extract and evaluate tweets on people’s opinion about quality of transit service
- The percentage of negative tweets depends on the weekdays
-
[136]Traffic accidentsDeep learning- Investigate a large amount of tweets
- Differentiate between accident-related and congestion-related tweets
- Analyze characteristics of the influential users and hashtags
-
Table 7. Studies on the smartphone data source.
Ref.AspectMethodologyPotentialData
[151]Travel behavior- Decision rules
- Hidden Markov model
- Estimate the activities at different locations
- The combination of smartphone and social media data enhance the understanding of urban functions
Social media
[152]Position estimationParticle filter algorithm- Calculate the vehicle-positioning information with better accuracy
- Support transport service managers to evaluate their service
AVL
[154]AccessibilitySpatial analysis models- Measure the spatial accessibility of public transit
- Mobile data can provide reliable results in evening hours
Social media
[141]Mode estimationML- Leverage Wi-Fi and Bluetooth data
- Predict transport mode choices
AVL
[142]Travel profiling- Mobile crowd-sourcing
- Evolutionary algorithm
- Recommend the best solution for each user
- Optimize the routes
-
[146]PrivacyContact tracing- Investigate the risks of using smartphone data
- Contact tracing apps contribute to self-disciplining in crisis
-
Table 8. Studies on the survey data source.
Ref.AspectMethodologyPotentialData
[167]Demand analytics- Simulation- Assess the implications of using GPS-based surveys for travel demand analysis
- Surveys need active interaction with study participants
AVL
[165]O-D matrix- Iterative proportional fitting
- On-board survey
- Estimate bus transit passenger route O-D flows
- Combines large APC data sets and on-board surveys
APC
[160]AccessibilityIntegrated surveys- Introduce an index to measure the transit accessibility
- The use of public transport is positively correlated with the index
-
[163]Survey validationComparison with AFC dataSmart card data enables to correct large sample household travel surveysAFC
[168]Surveys attractionGamification- Detect users preferences
- Young people are attracted to the gamification concept
-
[162]AccessibilityA generalized linear model- Measure the accessibility of different cohorts
- Inequities are found regarding the accessibility when examining the different cohorts
-
[161]Travel behaviorA survey- Study the potential of modal shift from private cars to public transport
- Psychological factors are the main reason for the unwillingness to switch
-
[86]Travel behavior- Time series
- Square regression
- Examine the relationships between the impact of ridership and the explanatory socio-economic factors
- Suggest how to respond to the decline associated with COVID-19
-
Publisher’s Note: MDPI stays neutral with regard to jurisdictional claims in published maps and institutional affiliations.

