Abstract
In this paper, we consider a two level dual channel green supply chain consisting of a retailer and a manufacturer with a separate sales channel for the manufacturer. The manufacturer uses green technology in its production and is required to produce in accordance with the cap and trade regulation. Using game theory, we compare cases where members decide to compete or cooperate with each other in terms of pricing and production. Our main contributions are studying the dual channel supply chain model where a manufacturer is regulated by the cap and trade system, using green production and also on their decision as to whether to compete or cooperate with a value-adding retailer. We also investigated the impact of green production on lowering the amount of carbon emissions produced. In the present study, supply chain members are advised to cooperate with each other in order to achieve the environmental benefits of the cap and trade system and, to avoid market failure, we further recommend that manufacturers should invest in green technologies for their production.
1. Introduction
Environmental concerns have now become a critical issue worldwide and green supply chain management plays a considerable role in alleviating these concerns. Because of various threats such as climate change, strict regulations have been applied. As the consumers’ awareness level grows regarding environmental threats, green products have become more and more popular. As a result, green production is becoming a necessity and provides a competitive advantage for those manufacturers who want to stay in the market. The number of enterprises that consider environmental factors in their strategic planning and manufacturing operation is continuously increasing [1]. There has been strong evidence provided by research and surveys of major companies on the importance of environmental issues. The one thing they have in common is that sustainable and green supply chain management plays an important role [2]. Of course, green production design requires some investment and therefore costs more than regular production, but for competitive reasons and government regulations, an investment in green production and design is somewhat inevitable. To enhance the return of investment in green supply chains, supply chain members should cooperate with one another. Such cooperation can lead to supplier integration and to the synchronization of production processes. Logistics technologies, the distribution of materials and transportation are key components for a coordinated supply chain. Coordinated entities in supply chains have the advantage in comparison with individual members.
A major climate change factor and environmental threat is carbon emissions. Regular forms of production create more carbon emission that green production. Various regulations have been adopted to decrease the carbon emission of manufacturers. Carbon tax, carbon trading or cap and trade and other mechanisms have been used to reduce the increasing amount of carbon emission. The cap and trade regulation is widely known and is now one of the most effective forms of regulation. Under this regulation, some free emission credits are allotted to each manufacturer. If the emission credits received are not sufficient, the manufacturer can buy emission credits from the market or other firms, or design green production methods to reduce their carbon emissions,. In this system, the amount of carbon emitted overall is controlled and remains the same [3]. Until recently, green production was not considered as a necessity and therefore enterprises did not feel an obligation to design green production methods. However, in recent years, the demand for green production has increased, so companies feel the need to move from traditional production and supply chains to green ones. This leads to green production providing a competitive advantage. Game theory is the main tool or studying competition, however, there have been few studies on the competition of green manufacturers using game theory [4]. Game theory can also be used to study cooperation between members. Green cooperation that combines green relations with cooperation, will impact long-term relationships between members in the future [5].
A selling mechanism that, in the long-term, can reduce carbon emission by requiring less transportation, is e-commerce = and online sales channels. This mechanism has been growing rapidly according to recent reports. Marketers believe that online business can aid traditional marketing activities. Manufacturers are opening their own online sales channels in addition to selling through retailers. This system is referred to as a dual channel supply chain [6]. According to previous research [7], in a dual channel supply chain, the manufacturer sometimes profits from the online sales channel, but it is always harmful to the retailer. Although, with e-commerce having developed rapidly, it is inevitable that supply chains will transform from single channels to dual channels, as we witness lot of companies opening online sales channels. We consider the dual channel supply chain with green production in this research. The topic studied in this research is scarcely discussed in the literature and this paper aims to provide new insights in this domain. In this study, we attempt to answer questions such as: What is the effect of green production and green product pricing on the whole Supply Chain system? Would the supply chain members choose to compete or cooperate?
The rest of the paper is structured as follows: the literature review is described in Section 2, and we also provide a summary of the literature in a review table. In Section 3, we define the problem and introduce the notations used and the assumptions of the model. Model solutions and discussion in cases of competition and cooperation are discussed in Section 4. We provide numerical analyses and managerial insights obtained from these analyses in Section 5. In Section 6, our conclusions and future research guidelines are provided.
2. Literature
There are different aspects of study in green supply chains. One aspect that still has a lot to offer is mathematical modeling and optimizations in the green supply chain [2]. Various fields of green supply chains have been studied, such as carbon emission, product recycling by reveres logistics and closed-loop supply chains, green products and product innovation, energy efficiency and so on. We focus on the research pertaining to green products and carbon emissions.
With regard to this area of study, many researchers have explored green supply chains in various fields. For example, Du et al. [8] considered a supply chain under cap and trade regulation. They applied the Stackelberg game. Later, they attempted to coordinate this supply chain through different contracts such as revenue sharing, wholesale price and quantity discount contracts. They studied a supply chain where the consumer preference is to lower carbon production [9]. Sheu [10] studied green tax government regulation and its impact in the supply chain and considered reverse suppliers and manufacturers and presented a three stage Nash bargaining game model to study the competition between supply chain members. Xu et al. [11] considered the effects of green tax and subsidies set by the government to regulate manufacturing. They applied a complete information static game model to study the manufacturer and customer relationship. Sikhar et al. [12] considered a manufacturer that produces green products. A revenue sharing contract is signed between the retailer and manufacturer in order to attract greener product consumers by the retailer. To study this supply chain, they used an evolutionary game. Ghosh and Shah (2012) used a two part tariff contract to coordinate a supply chain where the manufacturer produces green products. Savaskan and Van Wassenhove [13] studied the attempts to collect products for the reverse channel. They modeled the reverse channel design using game theory to study competition. They proposed a cost structure for these efforts. Swami and Shah [14] also used the same cost structure but for the cost associated with green investments. Other researchers have also tried this same cost structure for green costs [7,15]. Ghosh and Shah [16] used a cost sharing contract to coordinate the supply chain where the product demand of the consumer is green sensitive. Zhang et al. considered the production of green and non-green products simultaneously. They used cooperative pricing and the Shapley value method in their modeling [17,18]. Li et al. [7] modeled a dual channel supply chain in which the manufacturer also has an online sales channel for selling green products. They studied both single and dual sale channels and also attempted to coordinate the supply chain using a two-part tariff contract. Jaber et al. [19] studied the incentives for reducing carbon emission while applying coordination mechanisms in the supply chain. Zhang and Xu [20] studied the optimal production quantity of a manufacturer producing multi-items regulated by the cap and trade system. Liu et al. [21] considered carbon tax, cap and trade regulation and carbon capacity in studying the inventory and production in the remanufacturing of products. Barzinpour and Taki [22] studied transportation carbon emission and network design in a dual channel supply chain. Xu et al. [23] considered cap and trade regulation in a made-to-order supply chain while studying the optimal production and price of two substitutable products. They claimed that cap and trade does not necessarily prevent excessive carbon emission. Rahmani et al. [24] studied pricing policies for a dual-channel green supply chain under demand disruptions and solve the problem in both centralized and decentralized cases. Yu et al. [25] considered the advertising cooperation of a dual-channel low-carbon supply chain based on cost-sharing. Qian et al. [26] studied the channel coordination of a two-echelon sustainable supply chain with a fair-minded retailer under cap-and-trade regulation. Zhang et al. [27] studied carbon reduction decisions under progressive carbon tax regulations, and a new dual-channel supply chain network equilibrium model. Meng et al. [28] studied the pricing policies of a dual-channel green supply chain considering government subsidies and consumers’ dual preferences. Taleizadeh et al. [29,30,31,32,33] researched pricing, inventory and supply chains, which are related to some of the topics we investigate. We summarized the literature on green products in Table 1.

Table 1.
Summary of the papers in the Carbon Emission literature.
As shown in Table 1, previous studies regarding carbon emission in the supply chain concerns various forms of decision making in the supply chain such as in production and pricing and also concerns the coordination mechanisms between supply chain members. While Li et al. [7] studied the pricing of green products in a dual channel supply chain, they failed to consider the importance of carbon emissions in their research. Other researches have also failed to consider a green product manufacturer’s dual channel with regard to carbon emission regulations and control mechanisms. In this research, we not only study this topic, but also compare cases in which members decide to compete or cooperate with each other in terms of pricing and production. Our main contributions include studying the dual channel supply chain model where a manufacturer uses green production as regulated by the cap and trade system, and their decisions on whether to compete or cooperate with a value-adding retailer. The fact that previous research fails to study the impact of green production on lowering carbon emissions is another limit of the existing research. Our aim is to provide insight on the pressing issues mentioned above.
3. Problem Definition
We consider a dual supply chain that includes a producer and a retailer where the producer not only sells to the retailer but sells the product directly to the customer through its own online channel. The manufacturer produces green products and is limited to production under the cap and trade system. To enhance retail services, the retailer also adds value to the product by trying to sell to the end customer. They do so through methods such as bundling and packaging, qualitative preference based on level of purchase and by providing expert advice and offering professional consulting. All of these methods increase the utility of the product for the customer [40]. We assume that there is no effect on the manufacturer’s marginal cost in producing green products. To adopt green production, an investment cost is required of the manufacturer. This investment cost is referred to as the green cost, and consists of green innovation, purchasing green materials and designing reverse channels. The higher these investments, the higher the green rate of these products. Swami and Shah [14] first proposed green cost as a quadratic function of the green rate. So, the green cost for the manufacturer is , where k is the green cost coefficient. We assume that the demands of both the direct and retail channel are the linear functions of price and green rate. The customer demand in both channels is assumed to increase when the price is lower, and the green rate is higher. A schematic diagram of dual channel of supply chain of green products is depicted in Figure 1.
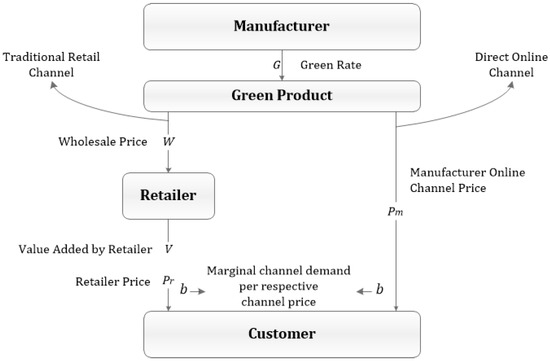
Figure 1.
Architecture of the dual channel supply chain model with green production.
Considering the added value of the product by the retailer, the final value of the product is [41]. The cost of the selling process of the retailer and the additional value is obtained by a quadratic function which correlates with value efficiency parameter (n) and the added value. This cost is calculated by [40].
Customers can change their channel based on their preference. The price difference between and can act as a factor that leads customers to the other channel. The demand for each channel can be formulated as Equations (1) and (2).
For both channels to be able to function simultaneously, we should have Pm > w, otherwise the retailer would also benefit from buying products via the online direct channel.
4. Model Solutions and Discussions
4.1. Stackelberg Game
In competition, the retailer and the manufacturer both maximize their own profit. Several previous studies [3,8,42], have used the Stackelberg game model (Leader-follower) to study a manufacturer in a green supply chain under cap and trade regulation. Because, in our model, the manufacturer also has an online sales channel, it is reasonable to assess that the manufacturer should be play the lead role in decision making. However, the cap and trade regulation could diminish the manufacturer’s bargaining power. That is why we also use a cooperative game model in the next section. The logistic diagram of competition between manufacturer and retailer is presented in Figure 2. As is shown in Figure 2, we also use the Stackelberg game model to model the competition between members in the supply chain. Here, the characteristics of different members and the competitive game between them are defined. The manufacturer is considered to be the leader and the bigger firm, while the retailer is smaller in comparison and is the follower to the manufacturer in the Stackelberg game. In the game, the direct sale and price are initially calculated by the manufacturer. Afterwards, the retailer, after being informed of the manufacturer’s decisions, attempts to optimize its own profit. By using the backward induction method, we generate the optimal decisions. In the first stage, the manufacturer assumes the retailer’s optimal response to their decision, so we are firstly required to optimize the retailer’s profit function.
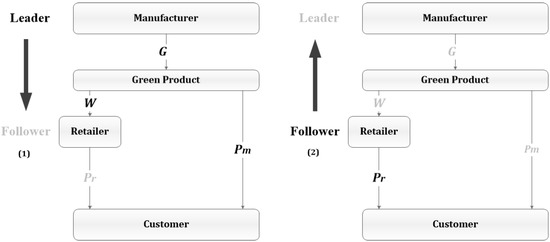
Figure 2.
Architecture of the model under competition.
The retailer’s profit is calculated by:
The profit of the manufacturer is:
The optimal decisions of the retailer can also be obtained using the retailer’s price and the value added by the retailer respectively, such that:
By substituting into we derive the retailer’s final price:
Since the optimal response of the retailer is known by the manufacturer, its expected profit is maximized to derive optimal prices. By substituting the retailer’s optimal decisions into the manufacturer’s profit function, we get:
The profit function is concave in its variables, so by setting the derivatives of the profit function as equal to zero we obtain:
The optimal decisions of the manufacturer are derived by considering the manufacturer’s direct channel price, the green rate of products set by the manufacturer and the wholesale price, which are, respectively:
By substituting the manufacturer’s optimal decisions into the retailer’s price function, we obtain the retailer’s optimal price.
4.2. Cooperative Game
If both the manufacturer and supplier collaborate, they will make joint decisions in pursuit of maximizing supply chain profits. The supply chain profit function under cooperation is:
The profit function is concave in the variables, so by setting the derivatives of the profit function as equal to zero we obtain:
The optimal decisions for both members under the cooperative game model are then derived by considering the retailer’s price, the manufacturer’s direct channel price, the green rate of products and the value added by the retailer, which are, respectively:
To obtain the optimal wholesale price we use the condition under which the cooperation between members can take place. If the profit gained by cooperation is less than the profit gained through the Stackelberg competition, then members do not have an incentive to enter the cooperative game. We define the following profit functions as the retailer’s and manufacturer’s profit in the Stackelberg and cooperative game respectively:
The profit of the retailer under the Stackelberg game is derived as the following:
Other profits are presented in Appendix A. The condition for the cooperative game is defined as and . Through the condition of the retailer, we can obtain the minimum value of the wholesale price.
where and through the condition of the manufacturer, we can obtain the maximum amount of wholesale price.
In the cooperative game, the manufacturer prefers the wholesale price to be closer to wmin and the supplier prefers it to be closer to wmax. The schematic diagram of cooperative game among the channel members is presented in Figure 3. Here, we enter into a bargaining problem. The problem can be solved using the Rubinstein bargaining method. This method has been used by previous researchers in cooperative pricing game models in supply chains [18]. We also used this bargaining method. Rubinstein proved that in such a situation where two members offer each other conditions until the other member accepts, the perfect equilibrium can be obtained by Equation (22).
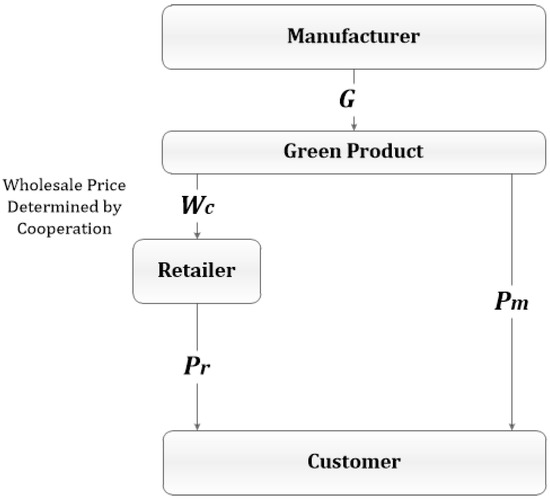
Figure 3.
Architecture of the model under cooperation.
and represent the degree of patience of the retailer and manufacturer that correlates with parameters such as market position, bargaining cost and risk preference.
Now, by using the above equation, we can find that the optimal wholesale price of the manufacturer satisfies:
Solving the above equation, we can obtain:
The expanded equation of the cooperative wholesale price is presented in Appendix A.
5. Computational Results and Analysis
In this section, we present a numerical example for the model, in which the problem parameters are obtained from an LED lighting manufacturer that uses green production that is regulated by the cap and trade system.
An easy method by which to minimize negative environmental impacts simply involves reducing overall energy consumption. A great method to achieve this is through the replacement of traditional light bulbs with LED lighting, which will enhance bulbs’ efficiency and lifespan while still providing high quality lighting. LED lights are considered to be one of the most effective energy-saving green products. Therefore, we analyze our model using the case of an LED light manufacturer. There are a lot of companies producing LED lights. Only a few of them have opened their own direct online channel. We use one of the manufacturers of energy saving lamps and LED lights that have an online store on their website. The following results are based on an analysis using one of the LED lights produced by this company.
Here, we further analyze the effect that each of the parameters have on the decision variables. Then, we attempt to infer managerial insight from each analysis. We assume that α = 30, ρ = 0.7, b = 2, β = 3, n = 0.2, k = 3, c = 1, e = 2, L = 100, t = 9, δ1 = 0.5, δ2 = 0.7. The dual channel supply chain is currently a popular concept, but dual channels are fairly modern and not all types of customers are comfortable buying from an online store. Therefore, the customers’ preference remains an advantage for the retailer. To consider this fact, we assume . However, this fact does not lead to the retailer acquiring greater bargaining power. A reason for the higher bargaining power of the manufacturer, other than their higher economy of scale and lower risk, is that the manufacturer sells products on their online channel in addition to selling through the retailer.
We try to analyze the impact of carbon prices, the green cost coefficient, customer’s preference in sales channels and bargaining powers on product prices, profits, wholesale price and the green rate of products. In doing so, we attempt to illustrate a comparison between decision variables of the retailer and manufacturer and their sales channels, and also the distinctions between the Stackelberg game model and the Cooperative game model. This comparison of competition and cooperation will guide us in understanding which model works best for industry leaders, governments and the environment.
Figure 4 demonstrates the impact of carbon price on prices and the comparison between Stackelberg game model and the Cooperative game model. We can see that the carbon price has a substantial effect on prices in all cases. The retailer’s price is higher than that of the manufacturer, but as the carbon price increases, the manufacturer’s price experiences a more rapid increase. It reaches a point where the competitive retail price is equal to the manufacturer’s price. As was expected, the retailer’s price is higher than the manufacturer’s price in both cases, because the retailer buys the products at a wholesale price.
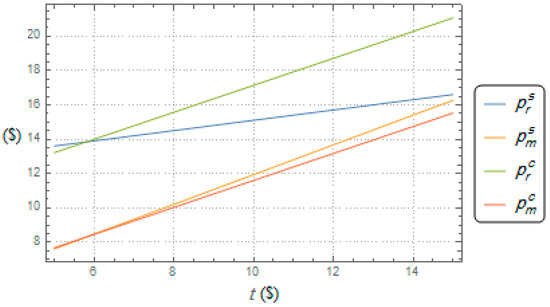
Figure 4.
Influence of carbon price on prices.
Therefore, we can understand that higher carbon prices under current conditions will lead to a higher product price.
By comparing the competition and cooperation models, it is evident that in both models the manufacturer’s price is lower than the retailer. However, the retailer’s price under competition and higher carbon prices increases at a slower rate than the other product prices.
From Figure 5, we can understand that as the cost coefficient of the green rate increases the price in both the direct channel and the retail channel tends to increase. Although, the green cost coefficient reaches a point at which the increasing rate of prices tends to flatten. The managerial insight we obtain here, is that once the production is set to be green, the higher green costs do not influence the prices significantly, and therefore it is beneficial to have greater levels of green production. By comparing the prices under competition and cooperation, we understand that the retailer is able to sell at higher prices under cooperation.
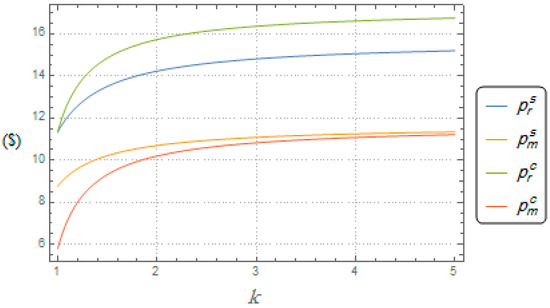
Figure 5.
Influence of green cost coefficient on prices.
Figure 6 illustrates that the carbon price increases the total profits, especially for the manufacturer. The reason is that even if the carbon price is high, the manufacturer can produce fewer products and trade their remaining entitled carbon emission to other companies. We can also see that both the retailer and manufacturer benefit from forms of cooperation in terms of profit, as they both have higher profits under cooperation than competition. Figure 7 illustrates the downward trend of profits in respect to the green cost coeficient, which is similar tocits effect on prices. When K reaches a certain point, the downward slope of the profits for both the retailer and manufacturer in both models of competition and cooperation decrease.
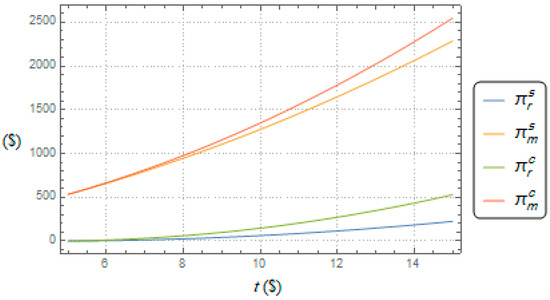
Figure 6.
Influence of carbon price on profits.
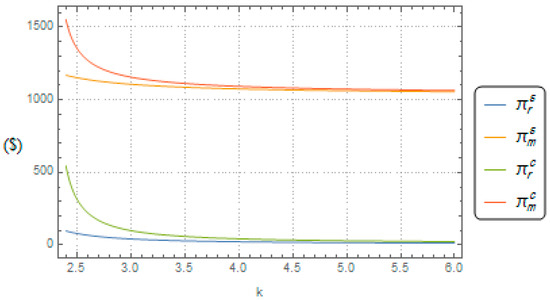
Figure 7.
Influence of green cost coefficient on profits.
In Figure 8, we find that customer preference for sale channels has a huge impact on prices. If a channel has a significant level of customer loyalty, it can have considerably lower prices and still make the same profit. Although for a dual channel supply chain, the situations of the far left and far right of the diagram are rarely the case. Customer preference is usually expressed where there is little variability in price, so it is somewhere in the middle. However, it goes without saying that if one channel can attract more customers, then in order for the other channel to still make a profit they have to increase their prices, which can cause them to lose even more customers. Therefore, marketing strategies can play a big role in price setting. The trends in Figure 9 can be analyzed in the same way. Each channel that attracts more customers is going to gain greater profit than the alternative channel.
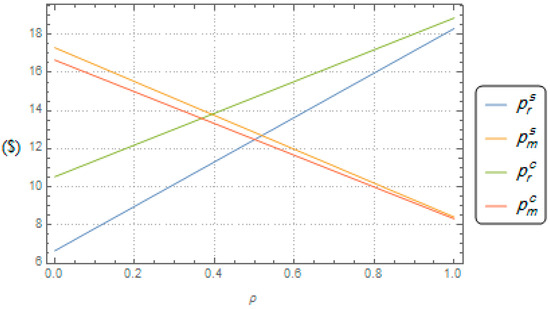
Figure 8.
Influence of rate of customer preference to retailer’s channel on prices.
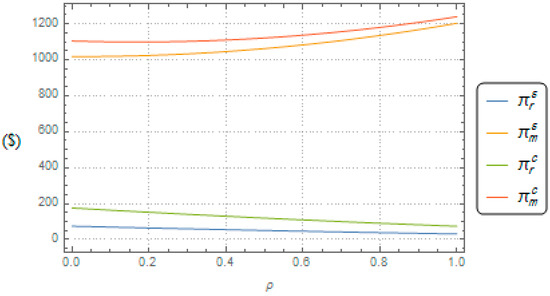
Figure 9.
Influence of rate of customer preference to retailer’s channel on prices.
Figure 10 illustrates the influence of the manufacturer and retailer patience degrees on the cooperative wholesale price. Patience degree is the parameter which correlates with bargaining power. In the cooperative game between the retailer and manufacturer, they decide on the wholesale price together by using their bargaining power, wherein the manufacturer aims to secure a higher price and the retailer aims to secure a lower price. Therefore, the highest wholesale price can be obtained in situations where the manufacturer has the highest possible level of bargaining power and retailer has the lowest level of bargaining power, and the lowest price is obtained via inverse dynamics.
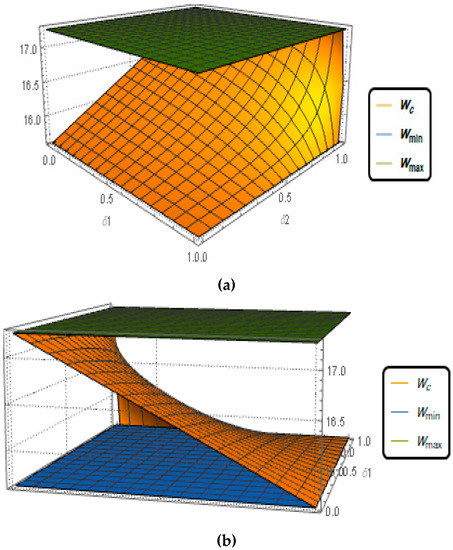
Figure 11 illustrates that green rate of products produced by the manufacturer declines with higher carbon prices. The reason behind this decline is the fact that using green technologies in production tend to reduce carbon emission. Scarcity leads to higher price in any product. High carbon price are also a sign of less available carbon emission allowed by the cap and trade regulation. Therefore, products are emitting more carbon, which means green rate of products are lower. By comparing the green rate under competition and cooperation, we can also understand that in feasible carbon prices where green rate is positive, cooperation leads to higher green rate. Therefore, for the sake of higher green rate in production it is beneficial that supply chain members cooperate with each other.
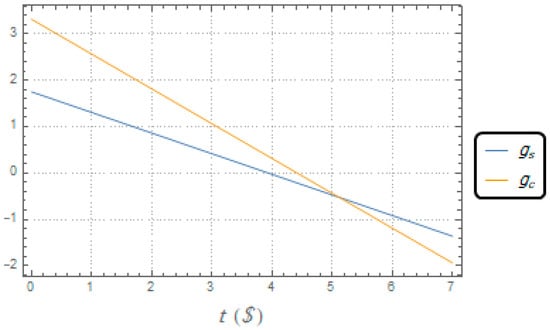
Figure 11.
Influence of carbon price green rate of products under competition and cooperation.
From the above results we obtain the following managerial insights:
We can see that both the retailer and manufacturer benefit from cooperation in terms of profit, as they both have higher profits under cooperation than competition. Cooperation also leads to a higher green rate. Therefore, to obtain a higher green rate in production, it is beneficial that for chain members to cooperate with each other. However, there is one limitation to our work from this perspective. The limit on the production of carbon emission by the cap and trade regulation on manufacturers causes them to lose some of their bargaining power in relation to the retailer. However, we did not formulate members’ patience degrees and hence their bargaining power as affected by the cap and trade regulation parameters. This can provide a potential research avenue for future studies.
By understanding that a higher carbon price leads to a higher product price gives we obtain important managerial insight. The carbon price is either set by government agencies or is determined in the free market between different manufacturers. Either way, the amount of carbon emissions needed for production, the limit set by the cap and trade regulation and the amount of safe carbon emission all affect the carbon price. Therefore, all of these parameters can affect the product price.
Initially, adopting green production is going to cost a lot and therefore product price will be higher, however, once the production transitions to green methods, the higher green costs will not significantly influence the price, therefore it is even beneficial to have a greener mode of production.
Higher emissions will lead to higher accumulated levels of carbon, which leads to higher carbon prices. This will lead to stricter rules on carbon emissions production. However, it evidently will not lead to a carbon cap increase, because the primary purpose of the carbon cap and trade system is to control the limit of cumulative carbon emissions. Therefore, carbon prices are not going to reduce through the implementation of more rigid rules. As we have seen in the analysis given in this section, higher carbon prices under current condition will lead to higher product prices. This particular increase in prices is not going to be a result of inflation that is caused by monetary policy or of low levels of supply and production. Instead, this price increase will be resultant of emission control regulations. The only way to combat this price increase is to lower the carbon emission of manufacturing and increasing the green rate of products. This will require technological advances in green production and supply chain management, and green investments.
Cap and trade regulation will work to limit the amount of carbon emission and therefore achieve its goals of a healthier environment and cleaner air. However, it may not be able to balance the supply and demand in the market in the long-term on its own, which could cause market failure. This can be averted if the manufacturers raise their green production and green technology investments to achieve a higher green rate in production and to produce less carbon emissions. The issue with investments, as mentioned above, is they are expensive at first and will lead to a decrease in profits and an increase in prices. However, this is only an issue at the onset, and after some initial investments, profits and prices will stabilize.
6. Conclusions
In this paper, we consider a two level dual channel green supply chain consisting of a retailer and a manufacturer, with a separate sales channel for the manufacturer. The manufacturer uses green technology in production and is obligated to produce under the cap and trade regulation. Using game theory, we compare cases in which members decide to compete or cooperate with each other in terms of pricing and production. We also investigated the impact of green production on lowering the amount of carbon emission.
After formulating the model and analyzing the computational results, we concluded that both the retailer and manufacturer benefit from cooperation in terms of profit, as they both have higher profits under cooperation than competition. Cooperation also leads to a higher green rate. Therefore, for the sake of a higher green rate in production, it is beneficial for supply chain members cooperate with each other.
After analyzing the impact of carbon price, we realized that stricter policies on carbon emissions will increase the carbon price, which can increase product prices. The only way to combat this price increase is to lower the carbon emission production in manufacturing and increasing the green rate of products, which requires technological advances in green production and in supply chain management. Green investment is the answer here. Cap and trade regulation will work to limit the generated amount of carbon emissions and will therefore achieve its aims of a healthier environment and cleaner air. However, it may not be able to balance supply and demand in the market in the long-term on its own, which could lead to market failure. This can be averted if manufacturers raise their green production and green technology investments. It would be expensive at first, decrease profits and increase prices. However, this would only be the case during the initial period, and after some initial investment, profits and prices would stabilize. Therefore, we suggest that there should be government incentives or subsidies providing for raising green production so as to reduce the risk of market failure.
There are also some limitations in our work. The limit on carbon emission production by the cap and trade regulation causes manufacturers to lose some of their bargaining power in relation to the retailer. However, we did not formulate members’ patience degrees and hence their bargaining power as affected by the cap and trade regulation parameters. This can be a research direction for future studies. Further analyses could be conducted in future incorporating the pressing issue of government incentives and subsidies for green production investments.
Author Contributions
Conceptualization, A.A.T.; Formal analysis, A.A.T. and M.S.; Investigation, M.S.; Methodology, A.A.T., M.S. and S.S.S.; Supervision, A.A.T. and S.S.S.; Validation, A.A.T. and S.S.S.; Writing—original draft, A.A.T.; Writing—review & editing, S.S.S. All authors have read and agreed to the published version of the manuscript.
Funding
This research received no external funding.
Institutional Review Board Statement
Not applicable.
Informed Consent Statement
Not applicable.
Data Availability Statement
Not applicable.
Conflicts of Interest
The authors declare no conflict of interest.
Abbreviations
| Parameters | |
| Retailer’s channel demand for the green product | |
| Manufacturer’s channel demand for the green product | |
| α | Initial demand of the green product in case of free charge |
| Rate of customer preference to retailer’s channel | |
| Rate of customer preference to the manufacturer’s channel | |
| b | Marginal demand of each channel per their price |
| β | Green investment effectiveness per unit of green product |
| c | The regular unit production cost ($) |
| L | Limit of Carbon Emission (Cap) |
| t | Carbon trading price ($) |
| e | Carbon emission per unit of green product |
| k | Green cost coefficient |
| n | Value efficiency parameter |
| subscript r | Retailer |
| subscript m | Manufacturer |
| subscript and superscript s | Stackelberg game (competition) |
| subscript and superscript c | Cooperative game (cooperation) |
| DecisionVariables | |
| Price of traditional retailing channel ($) | |
| Price of online channel ($) | |
| g | Green rate of products (The Abatement Level) |
| w | Wholesale price ($) |
| Value added by the retailer ($) |
Appendix A
The expanded profits of the retailer and manufacturer are derived under the Stackelberg and cooperative game.
Expanded equation of the cooperative wholesale price is presented below.
References
- Sarkis, J.; Zhu, Q.; Lai, K.-H. An organizational theoretic review of green supply chain management literature. Int. J. Prod. Econ. 2011, 130, 1–15. [Google Scholar] [CrossRef]
- Fahimnia, B.; Sarkis, J.; Davarzani, H. Green supply chain management: A review and bibliometric analysis. Int. J. Prod. Econ. 2015, 162, 101–114. [Google Scholar] [CrossRef]
- Xu, X.; He, P.; Xu, H.; Zhang, Q. Supply chain coordination with green technology under cap-and-trade regulation. Int. J. Prod. Econ. 2017, 183, 433–442. [Google Scholar] [CrossRef]
- Srivastava, S.K. Green supply-chain management: A state-of-the-art literature review. Int. J. Manag. Rev. 2007, 9, 53–80. [Google Scholar] [CrossRef]
- Gunasekaran, A.; Subramanian, N.; Rahman, S. Green supply chain collaboration and incentives: Current trends and future directions. Transp. Res. Part E Logist. Transp. Rev. 2015, 74, 1–10. [Google Scholar] [CrossRef]
- Dan, B.; Xu, G.; Liu, C. Pricing policies in a dual-channel supply chain with retail services. Int. J. Prod. Econ. 2012, 139, 312–320. [Google Scholar] [CrossRef]
- Li, B.; Zhu, M.; Jiang, Y.; Li, Z. Pricing policies of a competitive dual-channel green supply chain. J. Clean. Prod. 2016, 112, 2029–2042. [Google Scholar] [CrossRef]
- Du, S.; Ma, F.; Fu, Z.; Zhu, L.; Zhang, J. Game-theoretic analysis for an emission-dependent supply chain in a ‘cap-and-trade’ system. Ann. Oper. Res. 2011, 228, 135–149. [Google Scholar] [CrossRef]
- Du, S.; Zhu, J.; Jiao, H.; Ye, W. Game-theoretical analysis for supply chain with consumer preference to low carbon. Int. J. Prod. Res. 2014, 53, 3753–3768. [Google Scholar] [CrossRef]
- Sheu, J.-B. Bargaining framework for competitive green supply chains under governmental financial intervention. Transp. Res. Part E Logist. Transp. Rev. 2011, 47, 573–592. [Google Scholar] [CrossRef]
- Xu, A.; Hu, X.; Gao, S. Game Model between Enterprises and Consumers in Green Supply Chain of Home Appliance Industry. In Proceedings of the 2011 10th International Symposium on Distributed Computing and Applications to Business, Engineering and Science, Wuxi, China, 14–17 October 2011; pp. 96–99. [Google Scholar]
- Sikhar, B.; Gaurav, A.; Zhang, W.J.; Biswajit, M.; Tiwari, M.K. A decision framework for the analysis of green supply chain contracts: An evolutionary game approach. Expert Syst. Appl. 2012, 39, 2965–2976. [Google Scholar] [CrossRef]
- Savaskan, R.C.; Van Wassenhove, L.N. Reverse Channel Design: The Case of Competing Retailers. Manag. Sci. 2006, 52, 1–14. [Google Scholar] [CrossRef]
- Swami, S.; Shah, J. Channel coordination in green supply chain management. J. Oper. Res. Soc. 2013, 64, 336–351. [Google Scholar] [CrossRef]
- Ghosh, D.; Shah, J. A comparative analysis of greening policies across supply chain structures. Int. J. Prod. Econ. 2012, 135, 568–583. [Google Scholar] [CrossRef]
- Ghosh, D.; Shah, J. Supply chain analysis under green sensitive consumer demand and cost sharing contract. Int. J. Prod. Econ. 2015, 164, 319–329. [Google Scholar] [CrossRef]
- Zhang, C.-T.; Liu, L.-P. Research on coordination mechanism in three-level green supply chain under non-cooperative game. Appl. Math. Model. 2013, 37, 3369–3379. [Google Scholar] [CrossRef]
- Zhang, C.-T.; Wang, H.-X.; Ren, M. Research on pricing and coordination strategy of green supply chain under hybrid production mode. Comput. Ind. Eng. 2014, 72, 24–31. [Google Scholar] [CrossRef]
- Jaber, M.Y.; Glock, C.; El Saadany, A. Supply chain coordination with emissions reduction incentives. Int. J. Prod. Res. 2013, 51, 69–82. [Google Scholar] [CrossRef]
- Zhang, B.; Xu, L. Multi-item production planning with carbon cap and trade mechanism. Int. J. Prod. Econ. 2013, 144, 118–127. [Google Scholar] [CrossRef]
- Liu, B.; Holmbom, M.; Segerstedt, A.; Chen, W. Effects of carbon emission regulations on remanufacturing decisions with limited information of demand distribution. Int. J. Prod. Res. 2015, 53, 532–548. [Google Scholar] [CrossRef]
- Barzinpour, F.; Taki, P. A dual-channel network design model in a green supply chain considering pricing and transportation mode choice. J. Intell. Manuf. 2018, 29, 1465–1483. [Google Scholar] [CrossRef]
- Xu, X.; Zhang, W.; He, P.; Xu, X. Production and pricing problems in make-to-order supply chain with cap-and-trade regulation. Omega 2017, 66, 248–257. [Google Scholar] [CrossRef]
- Rahmani, K.; Yavari, M. Pricing policies for a dual-channel green supply chain under demand disruptions. Comput. Ind. Eng. 2019, 127, 493–510. [Google Scholar] [CrossRef]
- Yu, C.; Wang, C.; Zhang, S. Advertising cooperation of dual-channel low-carbon supply chain based on cost-sharing. Kybernetes 2019, 49, 1169–1195. [Google Scholar] [CrossRef]
- Qian, X.; Chan, F.T.; Zhang, J.; Yin, M.; Zhang, Q. Channel coordination of a two-echelon sustainable supply chain with a fair-minded retailer under cap-and-trade regulation. J. Clean. Prod. 2020, 244, 118715. [Google Scholar] [CrossRef]
- Zhang, G.; Cheng, P.; Sun, H.; Shi, Y.; Zhang, G.; Kadiane, A. Carbon reduction decisions under progressive carbon tax regulations: A new dual-channel supply chain network equilibrium model. Sustain. Prod. Consum. 2021, 27, 1077–1092. [Google Scholar] [CrossRef]
- Meng, Q.; Li, M.; Liu, W.; Li, Z.; Zhang, J. Pricing policies of dual-channel green supply chain: Considering government subsidies and consumers’ dual preferences. Sustain. Prod. Consum. 2021, 26, 1021–1030. [Google Scholar] [CrossRef]
- Taleizadeh, A.A.; Moshtagh, M.S.; Moon, I. Optimal decisions of price, quality, effort level and return policy in a three-level closed-loop supply chain based on different game theory approaches. Eur. J. Ind. Eng. 2017, 11, 486–525. [Google Scholar] [CrossRef]
- Taleizadeh, A.A.; Kalantary, S.S.; Cárdenas-Barrón, L.E. Pricing and Lot sizing for an EPQ Inventory Model with Re-work and Multiple Shipments. TOP 2016, 24, 143–155. [Google Scholar] [CrossRef]
- Taleizadeh, A.A.; Noori-Daryan, M. Pricing, Replenishments and Production Policies in a Supply Chain of Pharmaco-logical Product with Rework Process: A Game Theoretic Approach. Oper. Res. Int. J. 2016, 16, 89–115. [Google Scholar] [CrossRef]
- Taleizadeh, A.A.; Niaki, S.T.A.; Hosseini, V. Optimizing Multi Product Multi Constraints Bi-objective Newsboy Problem with discount by Hybrid Method of Goal Programming and Genetic Algorithm. Eng. Optim. 2009, 41, 437–457. [Google Scholar] [CrossRef]
- Taleizadeh, A.A.; Cárdenas-Barrón, L.E.; Biabani, J.; Nikousokhan, R. Multi products single machine EPQ model with immediate rework process. Int. J. Ind. Eng. Comput. 2012, 3, 93–102. [Google Scholar] [CrossRef]
- Sundarakani, B.; de Souza, R.; Goh, M.; Wagner, S.M.; Manikandan, S. Modeling carbon footprints across the sup-ply chain. Int. J. Prod. Econ. 2010, 128, 43–50. [Google Scholar] [CrossRef]
- Sim, S.; Jung, H. Green Investment Cost Optimization Model in the Supply Chain. Am. J. Oper. Res. 2013, 3, 454–462. [Google Scholar] [CrossRef][Green Version]
- Wang, X.J.; Choi, S.H. Impacts of carbon emission reduction mechanisms on uncertain make-to-order manufacturing. Int. J. Prod. Res. 2015, 54, 3311–3328. [Google Scholar] [CrossRef]
- Singham, D.I.; Cai, W.; White, J.A. Optimal carbon capture and storage contracts using historical CO2 emissions levels. Energy Syst. 2015, 6, 331–360. [Google Scholar] [CrossRef][Green Version]
- Bazan, E.; Jaber, M.Y.; Zanoni, S. Supply chain models with greenhouse gases emissions, energy usage and different coordination decisions. Appl. Math. Model. 2015, 39, 5131–5151. [Google Scholar] [CrossRef]
- Xu, X.; Xu, X.; He, P. Joint production and pricing decisions for multiple products with cap-and-trade and carbon tax regulations. J. Clean. Prod. 2016, 112, 4093–4106. [Google Scholar] [CrossRef]
- Liu, M.; Cao, E.; Salifou, C.K. Pricing strategies of a dual-channel supply chain with risk aversion. Transp. Res. Part E Logist. Transp. Rev. 2016, 90, 108–120. [Google Scholar] [CrossRef]
- Mukhopadhyay, S.K.; Yao, D.-Q.; Yue, X. Information sharing of value-adding retailer in a mixed channel hi-tech supply chain. J. Bus. Res. 2008, 61, 950–958. [Google Scholar] [CrossRef]
- Liu, H.; Kou, X.; Xu, G.; Qiu, X.; Liu, H. Which emission reduction mode is the best under the carbon cap-and-trade mechanism? J. Clean. Prod. 2021, 314, 128053. [Google Scholar] [CrossRef]


Publisher’s Note: MDPI stays neutral with regard to jurisdictional claims in published maps and institutional affiliations. |
© 2021 by the authors. Licensee MDPI, Basel, Switzerland. This article is an open access article distributed under the terms and conditions of the Creative Commons Attribution (CC BY) license (https://creativecommons.org/licenses/by/4.0/).