Review

Global Comfort Indices in Indoor Environments: A Survey

Department of Applied and Pure Sciences (DiSPeA), University of Urbino Carlo Bo, 61029 Urbino, Italy
Sustainability 2021, 13(22), 12784; https://doi.org/10.3390/su132212784
Submission received: 22 October 2021 / Revised: 11 November 2021 / Accepted: 15 November 2021 / Published: 19 November 2021
(This article belongs to the Section Energy Sustainability)

Abstract

:
The term “comfort” has a number of nuances and meanings according to the specific context. This study was aimed at providing a review of the influence (or “weight”) of the different factors that contribute to global comfort, commonly known as indoor environmental quality (IEQ). A dedicated section includes the methodologies and strategies for finding the most relevant studies on this topic. Resulting in 85 studies, this review outlines 27 studies containing 26 different weightings and 9 global comfort indices (GCIs) with a formula. After an overview of the main concepts, basic definitions, indices, methods and possible strategies for each type of comfort, the studies on the IEQ categories weights to reach a global comfort index are reviewed. A particular interest was paid to research with a focus on green buildings and smart homes. The core section includes global indoor environmental quality indices, besides a specific emphasis on indices found in recent literature to understand the best aspects that they all share. For each of these overall indices, some specific details are shown, such as the comfort categories, the general formula, and the methods employed. The last section reports IEQ elements percentage weighting summary, common aspects of GCIs, requisites for an indoor global comfort index (IGCI), and models adopted in comfort category weighting. Furthermore, current trends are described in the concluding remarks pointing to a better IGCI by considering additional aspects and eventually adopting artificial intelligence algorithms. This leads to the optimal control of any actuator, maximising energy savings.

1. Introduction

Comfort, as well as safety and energy saving, has always been one of the main aspects of the “home and building automation” field or of the wider “indoor environments” domain. The global comfort index (GCI) knowledge is relevant for many fundamental aspects including health, productivity, building renovation, comfort prediction, energy efficiency, and generally for understanding and acting on the improvable potential of an indoor environment. The concept of human comfort, i.e., indoor environmental quality (IEQ), is based on the indoor environment perception through the occupants’ senses. This is a particularly important aspect since it has been shown to affect the physical and mental status of the occupants (health and comfort). Researchers are placing more focus on the impact of indoor environmental quality on health, performance, and human comfort due to increased worries about socio-economic issues and the environmental sustainability of buildings [1]. Various overall comfort indices have been proposed by several studies adopting different methodologies. Therefore, a review is necessary in order to identify the best common aspects and the current direction in which they are headed. This review was aimed at identifying and analysing studies in order to:
  • Understand the comfort categories that have a major impact on the IEQ/overall/global comfort index.
  • Identify the main techniques that have been used.
  • Assess a possible future direction.
The goals can be reached through a four-step process. Step 1 implies identifying a methodology to be adopted in order to perform the research of the studies on this topic in the available literature (in Section 2). Step 2 is an overview of the main concepts concerning the core aspects of comfort and the identification of the most significant indices for every specific comfort category (in Section 3). Step 3 is the review of studies concerning the impact/contribution of different IEQ categories on global comfort; among these studies, those containing an explicit final formula for calculating an overall comfort index (in Section 4) are highlighted. Step 4 is a discussion about this review aimed at answering the pre-set targets (in Section 5). This last step will finally allow analysing and suggesting the best ways to manage an indoor global comfort index (IGCI) (in Section 6).
Comfort is defined as a specific condition of well-being. According to the sensorial perceptions of an individual in an environment, it is determined by the temperature, air humidity, noise level, and brightness detected within the environment. This definition highlights a distinction between thermal comfort, acoustic comfort, and visual comfort.
Environmental comfort is identified with the psychophysical well-being of people in an environment (home, office, museum, shopping centre, etc.); it is a feeling that depends on certain environmental conditions that are largely planned and therefore fall under the responsibility of the designer, for instance in the design, implementation, and management phases of a smart home or, more generally, of a smart/green building.
In addition to energy efficiency in green buildings, many researchers have also become more focused on user comfort, using thermal and visual comfort in addition to air quality as the parameters of most interest [2,3]. Furthermore, in accordance with the previous environmental comfort definition and considering the attention towards acoustically isolated buildings (especially in big cities and metropolises), acoustic comfort must be added. Therefore, it is possible to identify four core parameters that define a user’s comfort or IEQ:
  • Thermal comfort.
  • Indoor air comfort or indoor air quality (IAQ).
  • Acoustic comfort.
  • Visual comfort.
For each of these categories, the basics and main indices will be presented in Section 3 (IEQ Comfort Categories).
This article is not intended to provide a review of the indices corresponding to the specific comfort aspects or IEQ factors. Those comfort categories will be analysed only for a better comprehension of the global comfort indices. The focus of this review is specifically on these global indices and their IEQ comfort categories’ weighting.

2. Methods

This search was conducted through the Google Scholar database [4] by setting any date as the time interval. Most of the results were also drawn from other databases such as sciencedirect.com (accessed on 20 September 2021) [5], mdpi.com (accessed on 20 September 2021) [6], researchgate.net (accessed on 20 September 2021) [7], and others. Research was specifically focused on the following keywords:
“building” OR “buildings” OR “indoor environment” OR “indoor environments” AND
“thermal” OR “heating” AND
“IAQ” OR “indoor air quality” AND
“acoustic” OR “aural” AND
“visual” OR “lighting” OR “luminous” OR “luminosity” AND
“comfort index.”
Studies were also carried out with other similar words or synonyms, but this did not change the results number. According to these criteria, the found publications’ total number was 369. Figure 1 shows a growing research focus on this topic.
Global comfort indices considering two or more comfort categories are identified in the literature by other more specific names such as:
  • Overall comfort index.
  • Global comfort index.
  • Combined comfort index.
  • IEQ index.
Moreover, some indices do not explicitly refer to “comfort,” or they are referred to by other words such as “satisfaction” or “dissatisfaction.” Thus, other global indices can be found with other terms such as:
  • Overall index.
  • Global index.
  • Combined index.
  • Satisfaction index.
  • Dissatisfaction index.
Incorporating (one by one) these terms into the previous search, 85 effective results were found. Analysing the titles and abstracts of these studies, the articles selected for review were those:
  • with an “assessment,” “evaluation,” “judgment,” “rating,” “weight,” “influence,” “impact,” or generally a “correlation” between each IEQ category and the overall index
  • with an explicit formula of the global index including the IEQ categories.
Thanks to their references, other few articles of interest for the review were also found. In summary, 27 papers were reviewed:
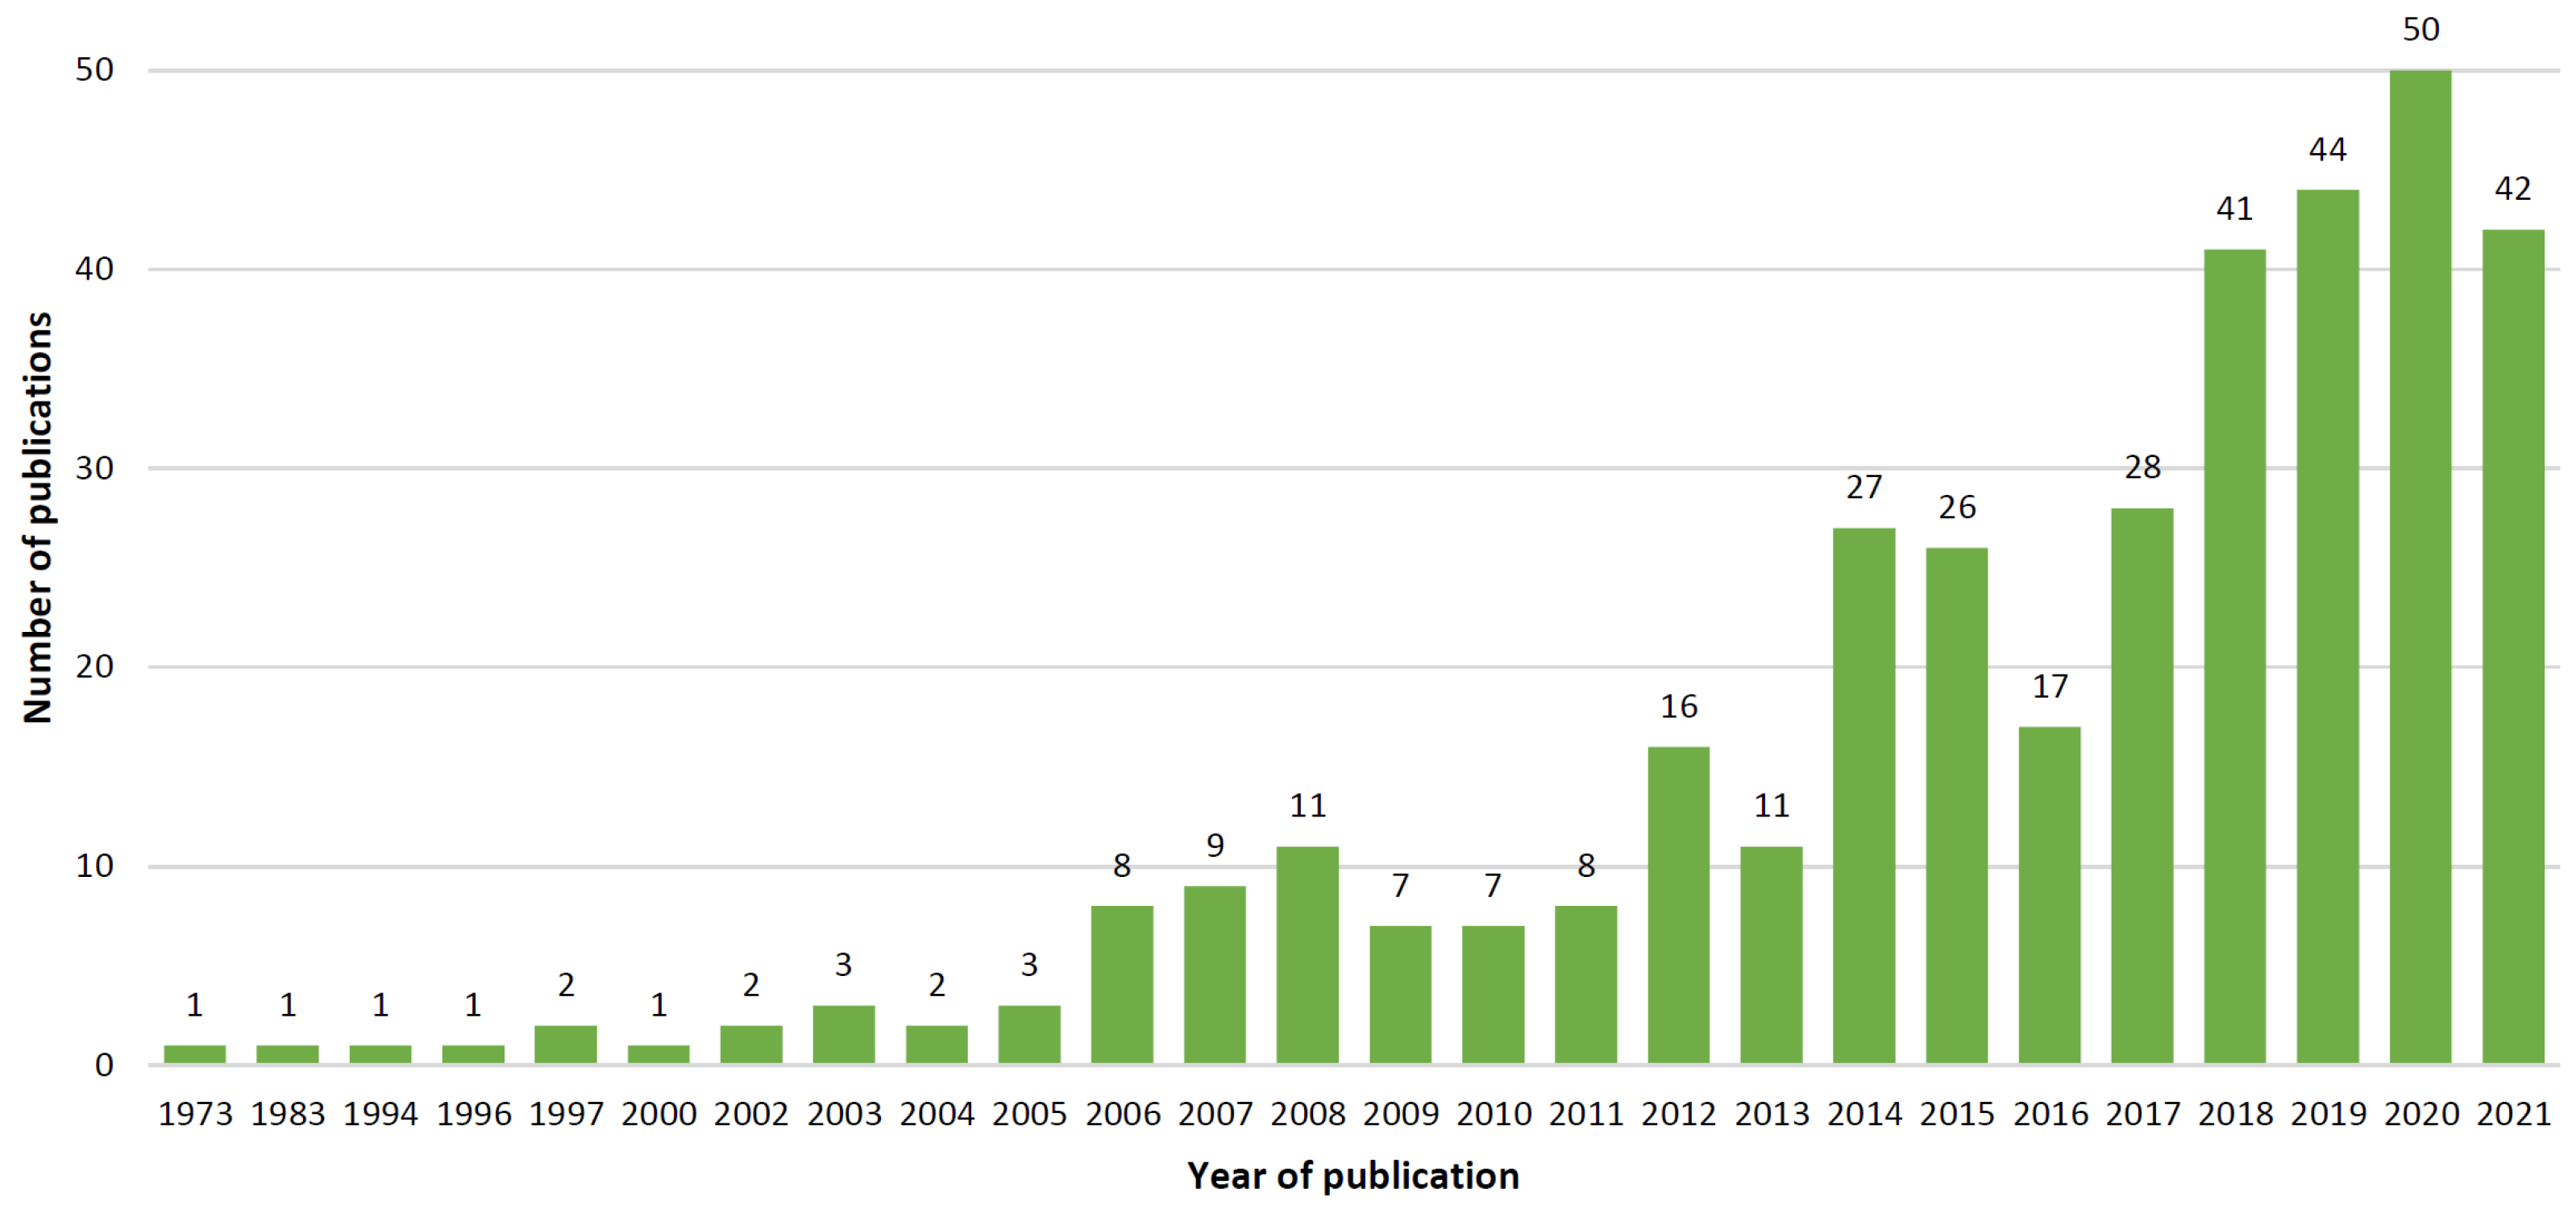
  • Twenty-five studies provided 26 different IEQ comfort categories weighting.
  • Ten papers provided nine GCIs/IEQ indices with an explicit formula.
The comfort categories that will be discussed in the next section are often identified in the literature by other labels like “IEQ categories,” “IEQ attributes,” “IEQ factors,” “IEQ aspects,” “IEQ elements,” “IEQ components,” and “IEQ items.” However, these always refer to the four categories: “thermal,” “IAQ,” “acoustic,” and “visual comfort.”

3. IEQ Comfort Categories

In this section, IEQ categories are presented to provide a better reading of the global comfort indices. Obviously, the most widely discussed comfort category is “thermal comfort.” This is because it presents many aspects and influencing elements, because it contains a number of subjective factors, and because for years it has been considered the unique (or the most important) comfort category. At the end of each category, the main indices, methods, or strategies are outlined.

3.1. Thermal Comfort

American Society of Heating Ventilation and Air-Conditioning Engineers (ASHRAE) defines thermal comfort as “that condition of mind that expresses satisfaction with the thermal environment and is assessed by subjective evaluation” [8]. In accordance with P. Ole Fanger’s studies and theories, thermal comfort in a building depends on the relationships between the subjective variables and environmental variables [9].
Recent studies about building comfort highlight that, besides such variables, the feeling of comfort is closely linked to the individual’s psychological, cultural, and social aspects; it is also linked to weather and his/her adaptation capacities. That is why it is not easy to quantify the state of well-being as it has to at least consider the age, gender, and health of people. This latest theory is known as the adaptive method and has been developed by researchers like G.S. Brager, R.J. de Dear, M.A. Humphreys, and J.F. Nicols [10,11,12]. Thermal comfort depends on:
  • Objective variables: air temperature, mean radiant temperature, operating temperature, relative humidity, and air speed.
  • Subjective variables: external parameters (activity being performed influencing the metabolism and clothing insulation), organic factors (age, gender, and specific physical characteristics), and psychological and cultural factors.
In this study, we limited our field of research to the description of objective variables (that is to say, environmental variables or physical parameters). The main variables that depend on both the internal and external climatic conditions of buildings and that affect thermal comfort are:
  • Air temperature.
  • Mean radiant temperature.
  • Operating temperature.
  • Relative humidity of indoor air.
  • Air speed.
Air temperature: the average temperature of the surrounding air against location and time. The ASHRAE 55 standard says that the spatial average takes into account a number of factors for different parts of the body (e.g., ankle, head, etc.) varying either for seated or standing occupants. Hence, the temporal average was calculated through three-minute intervals, with a minimum of 18 points with the same temporal distance. A dry-bulb thermometer was used to measure the temperature of the air. This is why it is called dry-bulb temperature. It is the most important factor in determining thermal comfort [8].
Mean radiant temperature: the average weighted temperature of the surfaces that mark the boundaries of the environment, including the effect of incident solar radiation. It affects exchanges by radiation. It is calculated as the average temperature of the walls inside the room, including the ceiling and floor.
Operating temperature is also defined as the average of air temperature and mean radiant temperature to precisely assess heat exchanges by convection and radiation with a single value.
Relative humidity of indoor air: RH is the ratio of the amount of water vapour in the air compared to the amount of water vapour that the air could hold at a specific temperature and pressure; therefore, it is measured in percentages. The range of recommended indoor humidity is 30–60% in air-conditioned buildings [13,14], but new standards, e.g., the adaptive model, allow both lower and higher humidity levels, according to other thermal comfort factors.
Air Speed: when air moves, the air temperature may not be affected, but there are thermal effects, and heat can be dissipated as follows through the surface of the epidermis:
  • Higher dissipation of heat as long as air temperature is not as high as the temperature of the epidermis.
  • Increased evaporation resulting in body cooling.
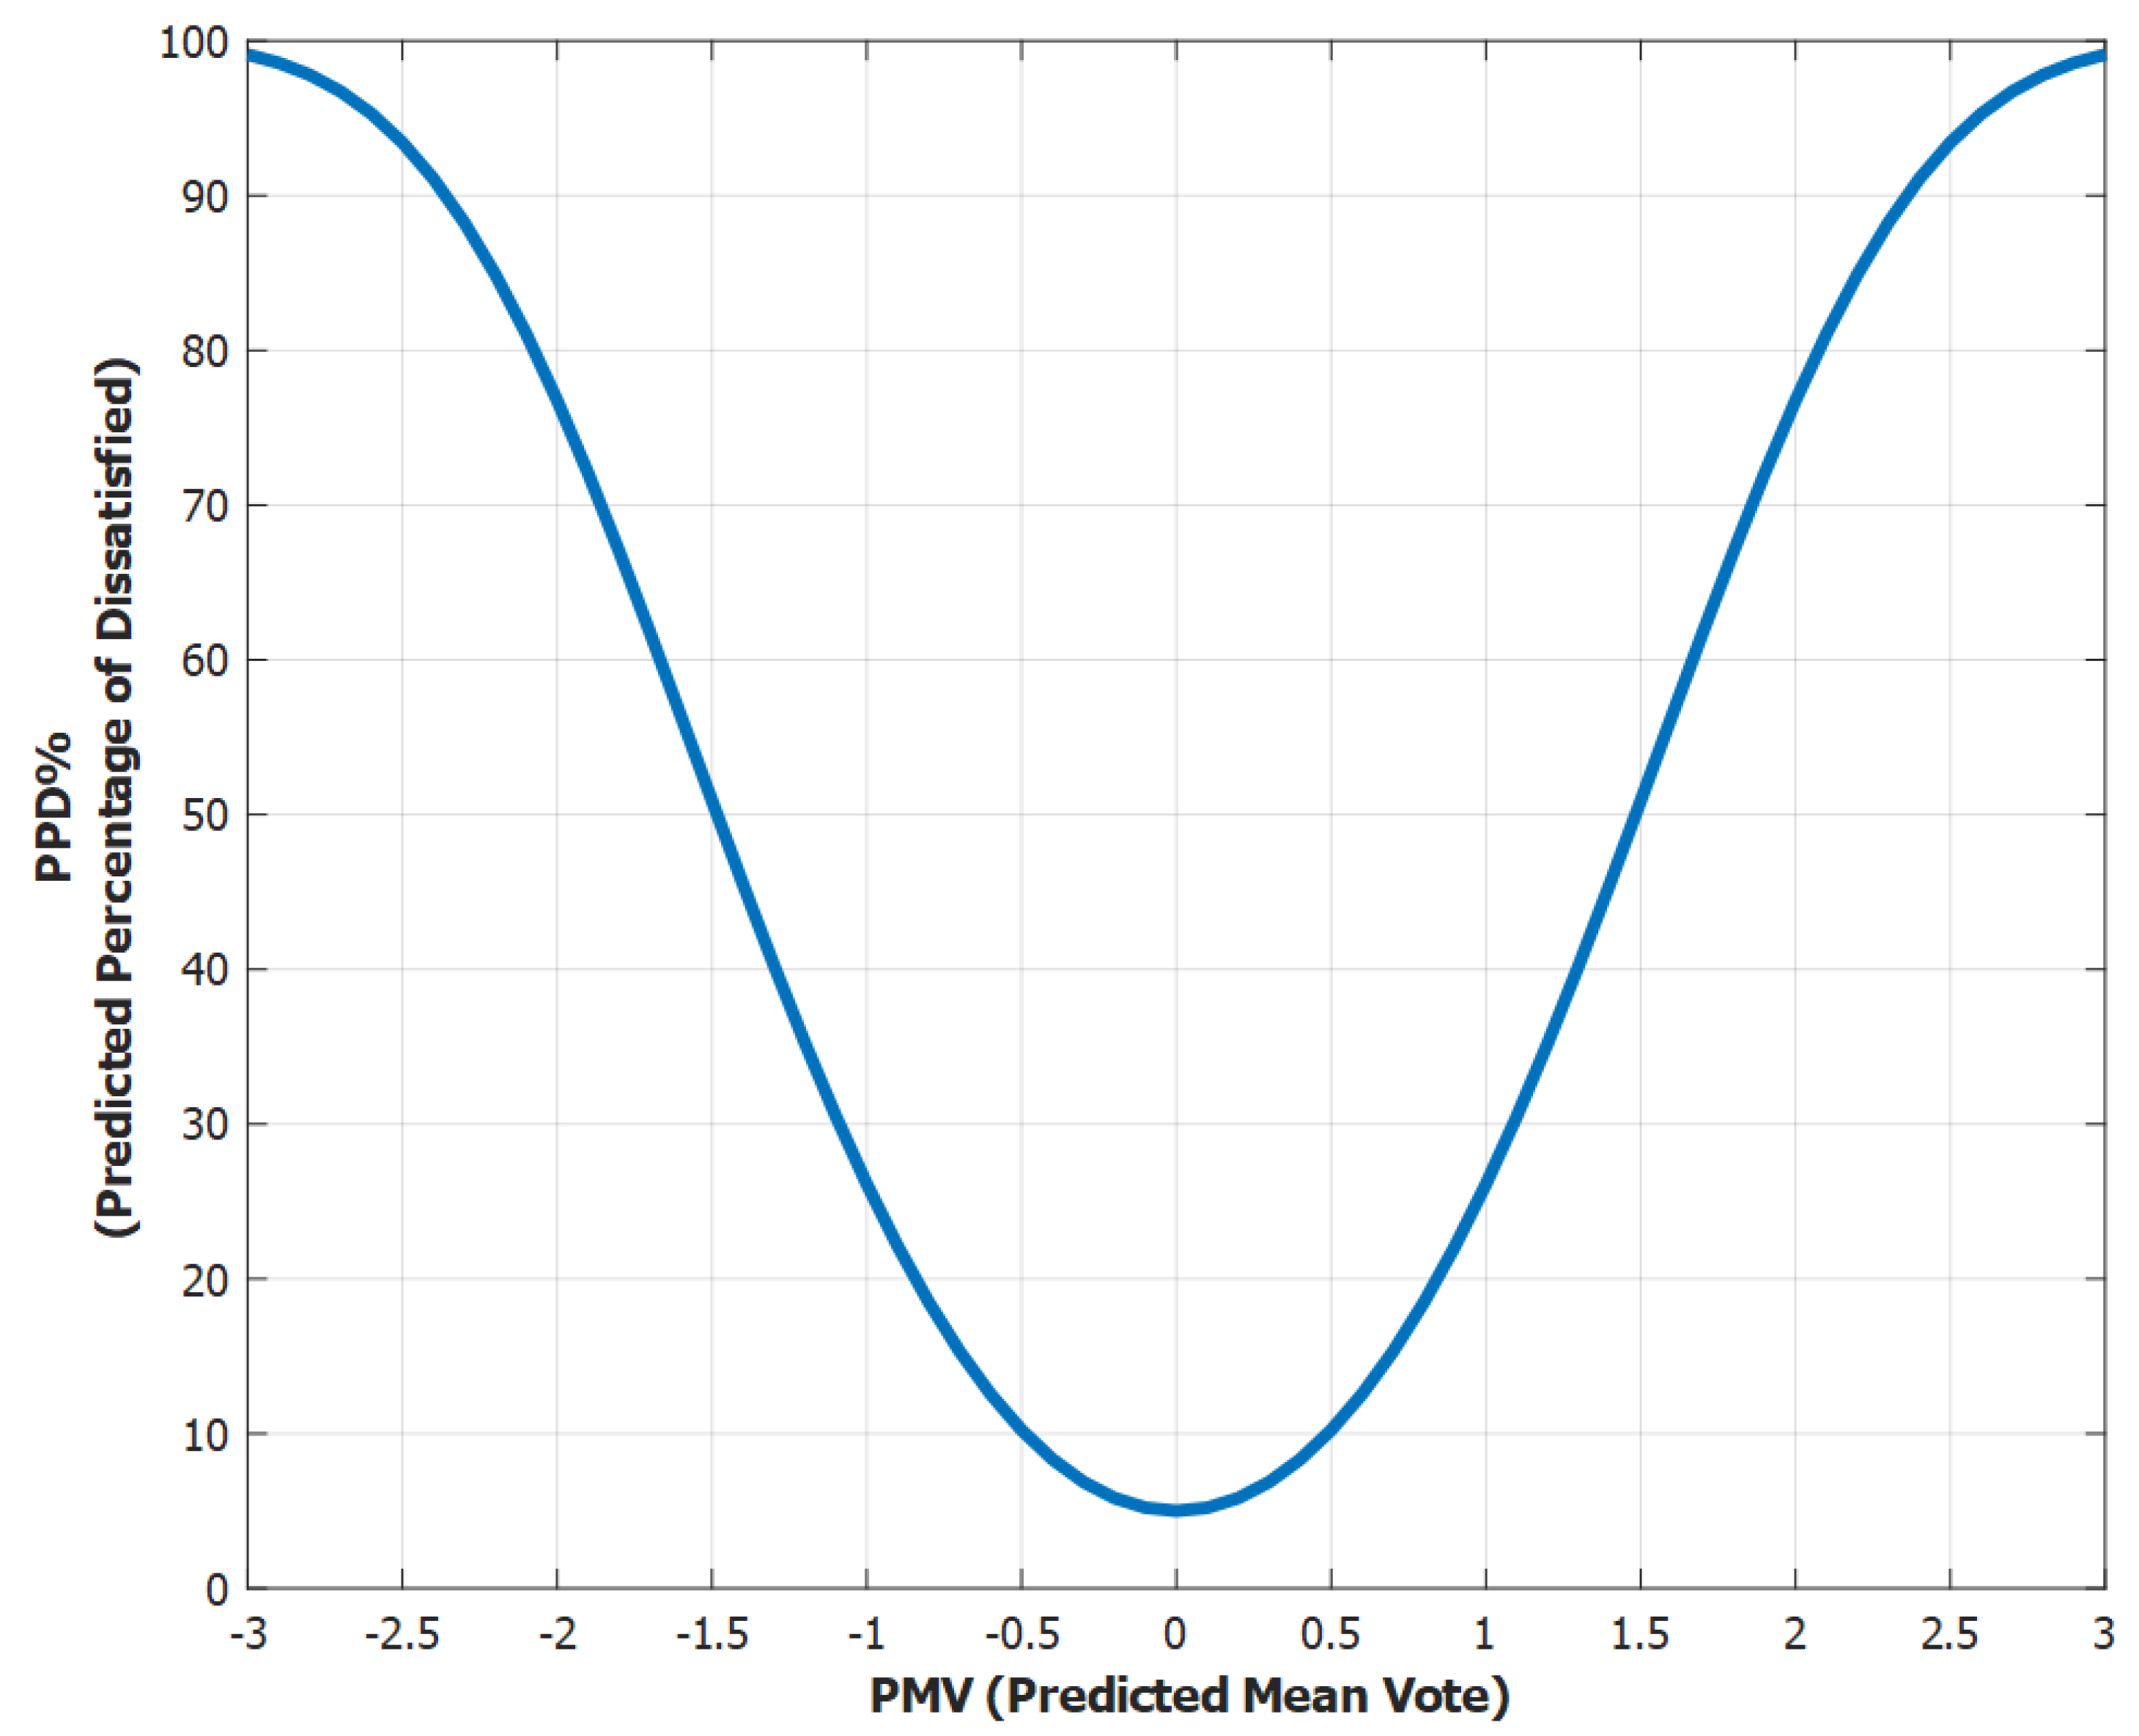
Air speed is the average to which a body is exposed with respect to location and time according to ANSI/ASHRAE Standard 55, with air temperature equating to the time average, and the surface area exposed to the air equating to the space average [8].

3.1.1. PMV and PPD

The predicted mean vote (PMV) and the predicted percentage of dissatisfied (PPD) are derived from the Fanger model. These two thermal comfort level indices come from the relationships between human body functions and the feeling of thermal comfort. They are also defined by the EN ISO 7730 standard [15].
The PMV is an index assessing the individual’s state of well-being by personal and environmental variables. Hence, it is a mathematical function whose result is a number on a scale from −3 (when it is too cold) to +3 (when it is too hot); zero represents the thermal comfort state. Table 1 shows different comfort conditions with the corresponding PMV values. Since it is an average index referring to a group of individuals, if the PMV = 0, it does not mean that the entire group has reached a well-being state.
Fanger described the comfort criteria that have been defined by theoretical, experimental, and statistical studies. To calculate PMV, once the air temperature (AT), mean radiant temperature (MRT), relative humidity (RH), air speed (AS), metabolic rate (MR), and clothing insulation (CI) data have been collected, Fanger’s equations are applied [9]. The first four variables (AT, MRT, RH, and AS) are environmental, while the final two (MR and CI) are physiological. Figure 2 shows the six variables required to calculate the PMV.
Therefore, PMV is a function of these six variables:
P M V = f ( A T , M R T , R H , A S , M R , C I )
The comfort zone is achieved if these parameters are merged to obtain a PMV of between −0.5 and +0.5 (ASHRAE 55 recommended limits) since thermal neutrality is represented by a PMV of 0 [8]. ISO 7730 [15] (EN 15251:2007 [16]) provides the formula for calculating PMV for a specified condition and expands that limit; it offers a number of different indoor environment ranges. The ISO standard defines the strict limit as −2 to +2, with old buildings ranging between −0.7 and +0.7, and new builds ranging between −0.5 and +0.5. In thermal comfort studies, the PMV is often compared with thermal sensation vote (TSV) [17,18]. Unlike PMV (which is derived from a mathematical formula), TSV is purely subjective, like the thermal comfort vote (TCV). The TSV is normally assigned the same seven-level scale ranging from −3 to +3, just as with the PMV (see Table 1), whereas the TCV is normally based on a four-level scale from −3 (very uncomfortable) to 0 (comfortable) [19].
The predicted percentage of dissatisfied (PPD) is an “index defining the quantitative prediction expressed as a percentage of thermally dissatisfied people determined from PMV” [8]. The percentage of dissatisfied persons is always linked to a specific environment.
The relationship between the PMV and PPD is:
P P D = 100 95 × e x p ( 0.03353 × P M V 2 0.2179 × P M V 2 )
Equation (2) is plotted in Figure 3.
The graph shows that the PPD (function of the calculated PMV) can vary from 5% to 100%. Depending on the occupant’s position in the building, the comfort values will be different. In general, in order to comply with the applicable standards, no point occupied in the area should have a PPD of higher than 20%. In accordance with the ISO 7730 standard [15], there are three recommended categories for buildings, while the fourth category is for values outside the criteria [20].
Table 2 shows the PMV/PPD percentage values as a function of the building category. Table 3 includes a short description [21] for each category.
In recent years, many researchers have questioned the validity of such an approach since it does not take a number of important factors into account, including the climatic, cultural, social, and contextual ones. They have introduced the adaptation concept, explaining how each individual’s context and thermal history can modify the occupant’s expectations and thermal preferences.

3.1.2. Adaptive Thermal Comfort Model

In the adaptive thermal comfort model, the building occupant is not simply viewed as a passive subject, as appeared in the static model (Fanger PMV), rather, he or she is an active agent interacting at all levels with the environment he/she is in. The adaptive comfort model suggests a correlation between the occupant’s comfort temperature (operative temperature) within a building and the external air temperature (prevailing mean outdoor temperature).
The ASHRAE-55 standard defines the prevailing mean outdoor temperatures as adaptive model input variables. They can be obtained by calculating the arithmetic average of the daily outdoor mean temperatures that must be acquired within a range of 7 and 30 consecutive days before the target day [8]. Therefore, the adaptive model introduces both control and response algorithms in order to both improve the occupant’s thermal comfort and reduce energy consumption.
Adaptive models of thermal comfort have been implemented into a number of standards like EN 15251 [16] and ISO 7730 [15]. Exact derivation methods and results can be slightly different compared to the ASHRAE 55 adaptive standard; however, they are equal from a material standpoint [22]. As an example, this is the correlation according to EN 15251 [16]:
O T = 0.33 × P M O T + 18.8 [ C ]
where OT is the optimal daily/hourly operating temperature and PMOT is the prevailing mean outdoor temperature. Unlike the Fanger model, the adaptive model considers a wider range of “comfortable” temperatures, with this allowing a more flexible integration of passive cooling technologies.

3.1.3. Bioclimatic Charts and Indices

According to the type of activity and relative clothing, bioclimatic analysis methods define the perimeter of the area of thermal well-being. This is to be understood as the combination of environmental and climatic factors in which the thermal feeling is judged as comfortable by over 80% of people.
The main charts are:
  • The Olgyay bioclimatic chart (1969) [23].
  • The psychrometric bioclimatic chart or the Givoni–Milne bioclimatic chart (1979) [24].
Olgyay collected the results of extensive research, tending to numerically determine the concept of well-being; in 1963, he was the first to place them in a single bioclimatic chart. Olgyay defined well-being as “the situation where no discomfort is felt.” The Givoni–Milne chart predicts the indoor thermal comfort conditions of a building in accordance with the outside climate. This takes account of the linear relationship between the temperature and vapour pressure of the outside air. The psychrometric chart overlaps the limits of both cooling and heating passive strategies.
Below is a list of the main bioclimatic indices [25]:
  • Indices based on a single element, e.g., temperature, wind, moisture, pressure, etc.
  • Indices based on temperature and moisture, e.g., the humidex index (heat index) [26,27], the humiture index [28], apparent temperature [27,29], the Thom index, the temperature humidity index (THI) [27,30], etc.
  • Indices based on temperature and wind speed values, e.g., the Steadman index [31], the wind chill index [32,33], etc.
  • Thermal comfort with more than one parameter (temperature, humidity, and wind speed), e.g., equivalent effective temperature (0TEE) and radiation (0TEER).
  • Other bioclimatic indices: total index bioclimatic stress, skin temperature as an index of comfort, tonicity coefficient Kt, weather summer touristic index, Fanger’s effort equation, and weather classes [25].
The high quantity of bioclimatic indices proves that researchers are striving to express any possible link between human body and climatic variations in one single formula. Nevertheless, it is evident that thermal comfort is affected by many parameters, including individual, social, physical, and geographical parameters [25]. Therefore, it is clear that a general planetary index for all these conditions does not exist. A single and acceptable formula cannot be defined for all types of conditions (climatic and geographical) to understand which thermal comfort level could suit certain health requirements.
In order to provide an overall picture, the main bioclimatic diagrams and indices were mentioned, but they are not further discussed in this article since they are more related to the climate and/or to the outdoor thermal comfort.

3.2. Indoor Air Comfort

For the purpose of quantifying indoor air comfort, reference is made to the indoor air quality (IAQ) parameter. To achieve a good IAQ, it is necessary to monitor certain levels of pollutant concentrations in order to provide adequate ventilation or air recirculation. IAQ defines the indoor (and surrounding) air quality of buildings and structures, taking into account the healthiness and comfort in relation to the occupants. IAQ can be affected by different contaminants like carbon monoxide/dioxide, radon, ozone, cigarette smoke, dust, total volatile organic compounds (TVOCs), chemical substances, or any other element that negatively impacts health.
The substances involved in the air quality assessment can be divided into three groups:
  • Physical pollutants: radon, artificial mineral fibres, and non-ionizing electromagnetic fields.
  • Biological pollutants: viruses and bacteria, fungi and moulds, pollens, mites, and bacilli.
  • Chemical pollutants: divided into organic pollutants (volatile organic compounds) and inorganic pollutants (including carbon monoxide and dioxide, sulphur dioxide, nitrogen dioxide, ozone, etc.).
IAQ has become popular due to the greater awareness of health problems caused by mildew and since it triggers asthma and allergies. IAQ measures indoor air as it affects the potential comfort and health of people. A range of physical disturbances can be caused by biological, physical, and chemical pollutants. On the contrary, the quality of the air can increase through the attentive selection of cleaning products and building materials, in addition to proper ventilation and specific air filters. The ideal condition is to have an IAQ that is greater than or equal to the outdoor air quality.
In order to achieve good indoor air quality, the main criteria is the minimum ventilation rate. The general requirements to achieve acceptable indoor air quality are similar for both residential and non-residential buildings in a number of standards (like EN16798-1: 2019). One or more of the following can be used as design parameters for indoor air quality:
  • Method using the perceived quality of the air.
  • Method using pollutant concentration criteria.
  • Method using previously defined ventilation air flow rates.
The designer has to choose between different categories of indoor air quality with each method and define which building category is to be used [22]. CO2 is a surrogate of human-emitted indoor pollutants. It can be easily measured and correlated to metabolism functions. Atypically high indoor CO2 levels can cause headaches, tiredness, and reduced performance. The levels of outdoor CO2 are around 400 ppm, and the acceptability threshold for indoor CO2 is 1000 ppm [34]. In most buildings, humans are the main source of indoor CO2. Its levels prove the adequacy of air ventilation with respect to the number of occupants and their metabolic rates. To avoid any issues, the CO2 concentration difference between the indoor and outdoor values must not exceed 600 ppm. The National Institute for Occupational Safety and Health (NIOSH) says that a low rate ventilation is associated with a CO2 concentration that exceeds 1000 ppm [35].
One of the best strategies in green buildings to obtain a good IAQ is the adequate use of heating, ventilation, and air conditioning (HVAC) systems. HVAC is one of the main indoor environmental comfort technologies. The use of HVAC systems allows a good compromise to be reached between IAQ and thermal comfort. These systems can be used in both domestic and business frameworks, and prices are still reasonable for installation, commissioning, operations, maintenance, and service.
In general, HVAC is an important part of smart homes, buildings, and the like, where the health and safety conditions are regulated in terms of humidity and temperature, exploiting the fresh air coming from the outside. Ventilation refers to the process of replacing/exchanging air in any space in order to provide high IAQ levels, including oxygen supply, temperature control, and the removal of moisture, smells, fumes, heat, airborne bacteria, dust, CO2, and other gases. Ventilation also removes unpleasant odours and excess moisture thanks to the fresh, outside air; it keeps the air circulation within buildings and prevents indoor air stagnation. The ventilation process includes both indoor air circulation and outdoor air exchange. It is also a decisive factor for having an acceptable IAQ. If necessary, buildings can be ventilated in various ways, including mechanical, forced, and natural methods [36].

3.3. Acoustic Comfort

In order to obtain a good acoustic comfort, it is necessary to analyse the main noise sources and design the solutions for proper acoustic isolation. Acoustic comfort can be defined as the condition where an individual is not disturbed by other sounds/noises and his/her hearing system is not damaged by strong noise exposure. In most buildings, poor acoustic comfort is the most common source of disturbance. This is why it is important to ensure the utmost acoustic comfort during the design and construction of the building and its performance in relation to noises from the outside and from the neighbouring flats.
When designing green buildings, it is necessary to consider the choice of materials, furniture, types of machinery, fixtures, coatings, etc. to ensure they do not cause noises within the building envelope and to guarantee acoustic well-being.
In a confined environment, it is possible to distinguish between outdoor sources and indoor sources.
Outdoor noise sources generally include car traffic and the possible presence of industrial manufacturing activities near the building. The noise produced by these sources propagates through the air and enters the building through its envelope.
Indoor noise sources can be found both in the environment in question and in other neighbouring environments. These sources are:
  • Installations (lifts, hoists, hydraulic installations, etc.).
  • Appliances.
  • Radio–television devices.
In this case, propagation occurs both through the air and the building’s solid parts. Regulations generally take account of the different acoustic disturbance sources. Noise is distinguished as:
  • Noise from walls and partitions between indoor units.
  • Noise from facades.
  • Noise from footsteps.
  • Noise from installations that work in constant and alternate modes.
The standard EN 12354-part 5 [37] includes the guidelines for noise evaluation during the design phase. A service system emanating high levels of noise can create problems for occupants, compromising building usage. An A-weighted equivalent sound pressure level can be used to measure noise, which has been normalised to take the sound absorption of the space into account [22].
The acoustic comfort assessment criterion is based on the noise level concept. Hence, the acoustic comfort index depends directly on noise/sound levels. The sound pressure level (measured in decibel (dB)) is the air pressure increase, on a logarithmic scale, against a still air situation. The “A-weighted” scale (dBA) is sometimes used to account for differences in how people respond to sound. A sound level of normal tolerability is defined to establish the purpose of the analysed environment and the activities performed there. This is a maximum noise threshold, which is considered as acceptable since it does not cause any discomfort. When this threshold is passed, well-being is lost. The noise source emission control is the fundamental strategy for noise pollution.
On average, in standard housing and, in general, in buildings, noise emissions are due to installations and car traffic. Such emissions can propagate mainly within the building itself, causing disturbance to occupants; in other cases, mainly at the outdoor level, they lead to quality degradation in the surrounding environment.
In terms of acoustic emissions, the most relevant installation categories are: air-conditioning systems, refrigerating equipment, air handlers, HVAC systems, furnaces and boilers, plumbing and drainage, lifts, hoists, escalators, etc. The aim is to reduce the noise emissions from the installations. The main reference strategies and technologies are:
  • Choosing either silent or components that can be acoustically insulated.
  • Installing the outdoor components in positions that are shielded from possible sensitive receivers that could be potentially disturbed (e.g., housing, schools, hospitals, etc.).
  • Soundproofing of technological areas.
As far as noisiness within a green building is concerned, the design process must include both technological and architectural solutions that can achieve the individual’s acoustic well-being.
Indices, implemented to improve acoustic comfort, especially in the field of smart/green buildings, concern:
  • Noise level: noise due to conversations, noise due to footsteps, noise coming from outside, noise of the ventilation system equipment, noise of the lighting equipment, noise of the office equipment, and noise of the furniture and doors.
  • Echo: echoes in the work environment, echoes in meeting rooms, echoes in conference halls, and echoes in the social areas.
  • Acoustic privacy: acoustic privacy in the work environment and meeting rooms [38].
Several studies have been proposed by researchers to quantify the perception of noise levels in indoor environments. The main design standards are [39]:
  • Noise criterion curves (NC).
  • Noise criterion balanced (NCB).
  • Noise rating (NR).
  • Preferred noise criterion (PNC).
  • Room criterion (RC).
  • Loudness and loudness level.
More details on noise ratings can be found in Bies, Hansen, and Howard [40]. One of the most widely adopted indices for assessing acoustic comfort in this field is the A-weighted continuous equivalent sound pressure level (LeqA), especially in office environments [41].

3.4. Visual Comfort

In order to achieve visual comfort, it is necessary to have the correct light quantity, during both daytime and nighttime, in order not to tire the eyes.
During daytime, a sufficient quantity of light must be able to enter. Therefore, the number of windows, the window size and spacing, the position of window shutters, the glass selection, etc. have to be right. During both nighttime and cloudy days, there has to be proper artificial light.
Today, artificial light design is highly advanced, allowing us to benefit from a wide range of light sources. Two important indicators for artificial light are:
  • Colour rendering: index measuring the light source capacity to return the real colour of the illuminated object.
  • Temperature: measured in Kelvin (K), whereas low values will produce yellow-oriented colours, while high values will produce blue-oriented colours.
European standard EN 12665 [42] defines visual comfort as “a subjective condition of visual well-being induced by the visual environment” [43] and depends on:
  • The physiology of the human eye.
  • The physical quantities describing the amount of light and its distribution in space.
  • The spectral emission of the light source.
Appropriate lighting has to be provided so that people can perform visual tasks efficiently and accurately. The level of visibility and comfort will depend on the type of work place, the activities carried out, and their duration (for instance, as specified in EN12464-1). Illuminance levels should be designed to incorporate daylight and electric light or a combination of both. For reasons of comfort and energy, the use of daylight is preferred in most cases. This will depend on factors like standard occupancy hours, autonomy (the portion of occupancy time in which there is enough daylight), location of the building (latitude), the number of daylight hours during the different seasons, etc. [22].
Studies on visual comfort are usually based on assessing a number of specific factors that highlight the dependence between the light environment and the occupants’ needs. These factors are:
  • The quantity of light.
  • The homogeneity of light.
  • The light quality in colour rendering.
  • The occupants’ glare risk prediction.
Even though the above factors may be interdependent, only one of them is usually considered. There are more and more indices and metrics being described in the literature today.
The quantity of light. A correct quantity of light results in good visibility and the proper performance of the occupants’ activities. When the light is either too weak or too strong, it can create various problems. Illuminance is the physical quantity necessary to calculate the quantity of light reaching a certain spot over a surface. Illuminance can be either used directly or integrated with other indices where it is one of the source inputs.
The main indices for assessing the quantity of light are: illuminance, the daylight factor, daylight autonomy, continuous daylight autonomy, spatial daylight autonomy, useful daylight illuminance, frequency of visual comfort, and intensity of visual discomfort [43].
The homogeneity of light. Homogeneity refers to the uniform propagation of light over a certain surface area. It avoids any possible optical stress caused by the need for the eye to switch from weakly to strongly lit areas. In this way, the risk of vision problems can be easily reduced. The “illuminance uniformity” is the main index to be used to calculate light distribution.
The light quality in colour rendering. The available literature often says that people prefer having natural light in their living and working areas [44]. This results in a number of benefits for the general well-being of the occupants and has an impact on many aspects such as physiological, perceptive, psychological, and also economic aspects [45,46].
The main indices for assessing the quality of light are: the CIE, the colour rendering index, the (general) colour quality scale, the flattery index, the colour preference index, the colour-discrimination index, the feeling of contrast index, and the colour rendering capacity [43].
The occupants’ glare risk prediction. Glare refers to light phenomena hindering the sight of the occupants in a luminous framework. This is caused by an excessive brightness level of either natural or artificial lighting. Glare can be generally defined as “luminance-produced feeling in a visual field, sufficiently higher than the luminance that requires the eyes adaptation; it causes problems, discomfort or loss in terms of visibility and visual performance” [47].
The main indices for assessing glare are: luminance, the luminance ratio, the British glare index, visual comfort probability, the CIE glare index, the discomfort glare index, new discomfort, the glare index, the unified glare rating, the discomfort glpre Probability, the simplification of the discomfort glare probability by Wienold et al., the simplification of discomfort by Hviid et al., the glare probability, the enhanced simplified discomfort glare probability, the predicted glare sensation vote, the J-index, and the comparison of glare sensation scales [43].
This abundant quantity of visual comfort indices is used to assess certain characteristics of luminous environments or the human eye’s perception of these environments. Building designers need help to figure out how new buildings should be designed to explicitly optimise the visual comfort for their occupants. Visual comfort factors should therefore be summarised with a multi-objective optimisation approach. Keeping this in mind, it is necessary to first detect then identify, improve, or develop reliable metrics [43].

4. IEQ Comfort Categories Weighting and Global Comfort Indices

In this section, all reviewed articles fulfilling the review requirements are shown. This part represents the review core, and it has been divided into two parts, in order to achieve the pre-set targets. The first part concerns the studies on “IEQ comfort categories weighting,” while the second part selects the studies proposing an explicit formula on a “global comfort index”.

4.1. IEQ Comfort Categories’ Weighting

All reviewed studies concerning IEQ comfort categories weighting are summarised in Table 4.
All “weights” were obtained from different data analysis techniques such as Pearson correlation, the analytic hierarchy process (AHP), multivariate linear/logistic regression, etc. Table 4 includes some annotations, namely:
  • In the “Marans and Yan, 1989” study [48], heating and draft coefficients were merged and considered in the thermal category.
  • In some studies, certain categories and/or parameters were not considered for this analysis. For example, the electromagnetic fields (EMF) category (in the “Chiang and Lai, 2002” study [51]) and the air velocity parameter (in the “Marino et al., 2012” study [60]) were removed.
  • In “Mui and Chan, 2005” [52], the coefficient for the visual category was found to be negative. Therefore, the percentage of dissatisfaction in visual comfort (PDVC) was removed from the model by the authors.
  • In the “Humphreys, 2005” study [53], warmth, air movement, and humidity coefficients were merged and considered in the thermal category.
  • In the “Lai and Yik” studies [54,58], air cleanliness and odour coefficients were merged and considered in the IAQ category.
  • In “Bluyssen et al., 2011” [59], the IAQ1 category was considered in the thermal category (as it contains temperature, air movement, and humid/dry air quality). The IAQ2 category was considered in the IAQ category (as it contains stuffy/fresh air quality).
  • In “Wei et al., 2020” [70], the average of the following green building schemes were considered: BREEAM, KLIMA, DGNB, ITACA, LiderA, LEED, and NABERS.
Figure 4 shows the four IEQ category importance degrees for each study. A higher number corresponds to a higher ranking i.e., rank 1 = lowest importance, and rank 4 = highest importance.

4.2. Global Comfort Indices

This section concerns some of the main comfort indices based on indoor environmental quality and is already covered in the available literature. These indices are global and, as such, are often made of sub-indices, relative to the different comfort categories and/or physical quantities. The studies selected for this revision include indices with an explicit final formula and that may allow evaluation of the assigned weight for each comfort category or physical quantity. The reviewed literature mainly deals with the following fields: air, environment, indoor, and building quality. The selected studies cover a temporal range of the last 20 years. Older studies are often focused on thermal comfort only; moreover, they rarely jointly cover all the different comfort aspects for indoor contexts. The selected indices are included in Table 5, as follows:
For each of these IEQ indices, the following details are presented:
  • Comfort elements and/or categories taken into consideration.
  • Formula to calculate the global index.
  • Any data, methods, techniques, and/or algorithms that have been used.

4.2.1. Total Environmental Quality Evaluation (TEQE)

TEQE [49,50] considers visual (lighting), acoustic, and thermal comfort and indoor air quality (IAQ) in office buildings. It is obtained through the following formula:
T E Q E = 3.44 × l i g h t i n g + 1.89 × a c o u s t i c s + 2.29 × t h e r m a l + 2.38 × I A Q
where the assigned weights were calculated from 50 expert inputs.
Finally, statistical analyses were performed using the Statistical Package for the Social Sciences (SPSS).

4.2.2. The Indoor Environmental Index Using the Analytic Hierarchy Process (IEI(AHP))

IEI(AHP) [51] takes into account thermal comfort (SThermalComfort), acoustic comfort (SAcoustics), visual comfort (SIllumination), indoor air quality (SIAQ), and electromagnetic fields (SEMF). It is obtained through the following formula:
I E I ( A H P ) = 0.203 × S A c o u s t i c s + 0.164 × S I l l u m i n a t i o n + + 0.208 × S T h e r m a l C o m f o r t + 0.290 × S I A Q + 0.135 × S E M F
The analytic hierarchy process (AHP) method is carried out to do the weighting.

4.2.3. The Indoor Environmental Index (IEI)

IEI [71] considers the indoor air quality aspect (with IAPI—indoor air pollution index) and the thermal comfort aspect (with IDI—indoor discomfort index) in office buildings.
IAPI is obtained by measuring the concentrations of formaldehyde (HCHO), total volatile organic compounds (TVOC), carbon monoxide (CO), carbon dioxide (CO2), particulate matter (PM10 and PM2.5), bacteria, and fungi, whereas IDI is obtained by measuring levels of temperature and relative humidity.
IEI is the arithmetic mean between the indoor air pollution index (IAPI) and the indoor discomfort index (IDI). It is obtained through the following formula:
I E I = I A P I + I D I 2
The used data comes from a study that measured the concentrations of the pollutants and simultaneously identified the symptoms of the office occupants, surveyed through questionnaires, along with the building characteristics, according to a standard protocol.

4.2.4. The Index of Overall Comfort (I)

This index I [53] considers thermal comfort (with satisfaction code for warmth, air movement, humidity—Sw, Sam, Sh), acoustic comfort (with satisfaction code for noise—Sn), visual comfort (with satisfaction code for lighting—Sl), and indoor air comfort (with satisfaction code for air quality—Saq). It is obtained through the following formula:
I = 1.24 + 0.39 × S w + 0.16 × S a m + 0.12 × S h + 0.05 × S l + 0.13 × S n + 0.36 × S a q
where this was achieved by the use of data from an environmental survey and multiple regression analyses.

4.2.5. Percentage of Dissatisfaction in Indoor Environmental Quality (PDIEQ)

PDIEQ [52] considers thermal comfort (percentage of dissatisfaction in thermal comfort —PDTC), acoustic comfort (percentage of dissatisfaction in aural comfort—PDAC), visual comfort (percentage of dissatisfaction in visual comfort—PDVC), and indoor air quality (percentage of dissatisfaction in indoor air quality—PDIAQ). It is obtained through the following formula:
P D I E Q = 0.42 × P D T C + 0.09 × P D I A Q + 0.28 × P D A C
where PDVC was removed from the model because the range of illuminance gave no significant contribution. In this research, an IEQ logger was developed to measure the physical parameters. In addition, a questionnaire was given to obtain the subjective responses of the occupants, and a multiple regression model was adopted.

4.2.6. Overall Satisfaction (S)

This index S [61] considers thermal comfort (satisfaction with the indoor thermal environment—ST), acoustic comfort (satisfaction with the acoustic environment—SA), visual comfort (satisfaction with the luminous environment—SL), indoor air quality (satisfaction with the indoor air quality—SIAQ). It is obtained through the following formula:
S = 0.075 + 0.316 × S T + 0.118 × S I A Q + 0.171 × S L + 0.224 × S A
In this study, the satisfaction of the occupants with the indoor environment was investigated through questionnaires and multivariate linear regression.

4.2.7. The Overall IEQ Index (IEQindex)

The IEQindex [39] considers thermal comfort (with the thermal comfort index—TCindex), acoustic comfort (with the acoustic comfort index—ACcindex), visual comfort (with the lighting index—Lindex), and indoor air quality (with the indoor air quality index—IAQindex). It is obtained through the following formula:
I E Q i n d e x = 0.30 × T C i n d e x + 0.36 × I A Q i n d e x + 0.16 × L i n d e x + 0.18 × A C c i n d e x
This study adopted the passive observational method (POM), which is a correlational method involving both field measurements and questionnaires.

4.2.8. Dwelling Environmental Quality Index (DEQI)

DEQI [72] considers thermal comfort (with temperature and relative humidity sub-indices—ST, SRH) and indoor air comfort (with carbon dioxide sub-index—SCO2). DEQI is the simple arithmetic mean of the three sub-indices s for temperature, relative humidity (RH), and CO2 concentrations as defined by the equation:
D E Q I = S T + S R H + S C O 2 3
Sub-indices are calculated by the following equation (based on the formula developed by Marino et al. [60]:
S i = 100 × f i , I + 70 × f i , I I + 35 × f i , I I I
where fi,N is an indicator measuring the persistence of the indoor environmental conditions that satisfy the requisites defining the N-th category of quality (please refer to Table 3).
The recommendations for energy and design calculations in the European Standard EN15251:2007 were used to give the ranges of values for the various categories [16]. Homes used as part of the ICE-WISH project were employed to provide the indoor environment data [73].

4.2.9. Combined Comfort Index (ICC)

ICC [69] considers thermal comfort (with predicted mean vote index—IPMV), acoustic comfort (with sound index—IS), and visual comfort (with visual comfort index—IVC). It is obtained through the following formula:
I C C = 0.35 × I P M V + 0.35 × I S + 0.3 × I V C
In this research, indices were mainly based on measurements, whereas index-weights were based on a questionnaire.

4.2.10. Other IEQ Studies

These indices concern studies in which there is an explicit final global index formula covering various comfort categories. However, other relevant research on different case studies concerning IEQ factors and/or their relationships were found for this review. For the sake of completeness, these pertinent studies are mentioned below: Chiang et al. (2001) [74], Frontczak and Wargocki (2011) [75], Kim and de Dear (2012) [76], Catalina and Iordache [77], Sakhare and Ralegaonkar [78], Nimlyat and Kandar (2015) [79], Gadotti and Albatici (2016) [80], Ricciardi and Buratti (2018) [81], Nimlyat (2018) [82], Yang and Moon (2019) [83], Piasecki (2019) [84], Rohde et al. (2020) [85], Piasecki et al. (2020) [86], and Tang et al. (2020) [87].

5. Discussion

Before reviewing, the basics and main indices of each comfort category were presented. For each of these IEQ elements, the main indices (or indicators) most commonly used in the green buildings rating systems are listed below, in spreading order [80].
  • Indicators for thermal comfort: operative temperature, humidity, PMV/PPD, thermal control, air velocity, room temperature, temperature differences between walls, room thermal capacity, Givoni comfort zone, and sunlight penetration ratio.
  • Indicators for indoor air comfort (IAQ): formaldehyde concentration, CO2 concentration, TVOC, low emitting materials, and air ventilation rate.
  • Indicators for acoustic comfort: noise level, sound insulation, and reverberation time.
  • Indicators for visual comfort: daylight factor, illuminance, sunlight availability, CRI, view out, lighting control, illuminance ratio, glare control, daylight uniformity, daylight illuminance, and Equivalent Melanopic Lux.
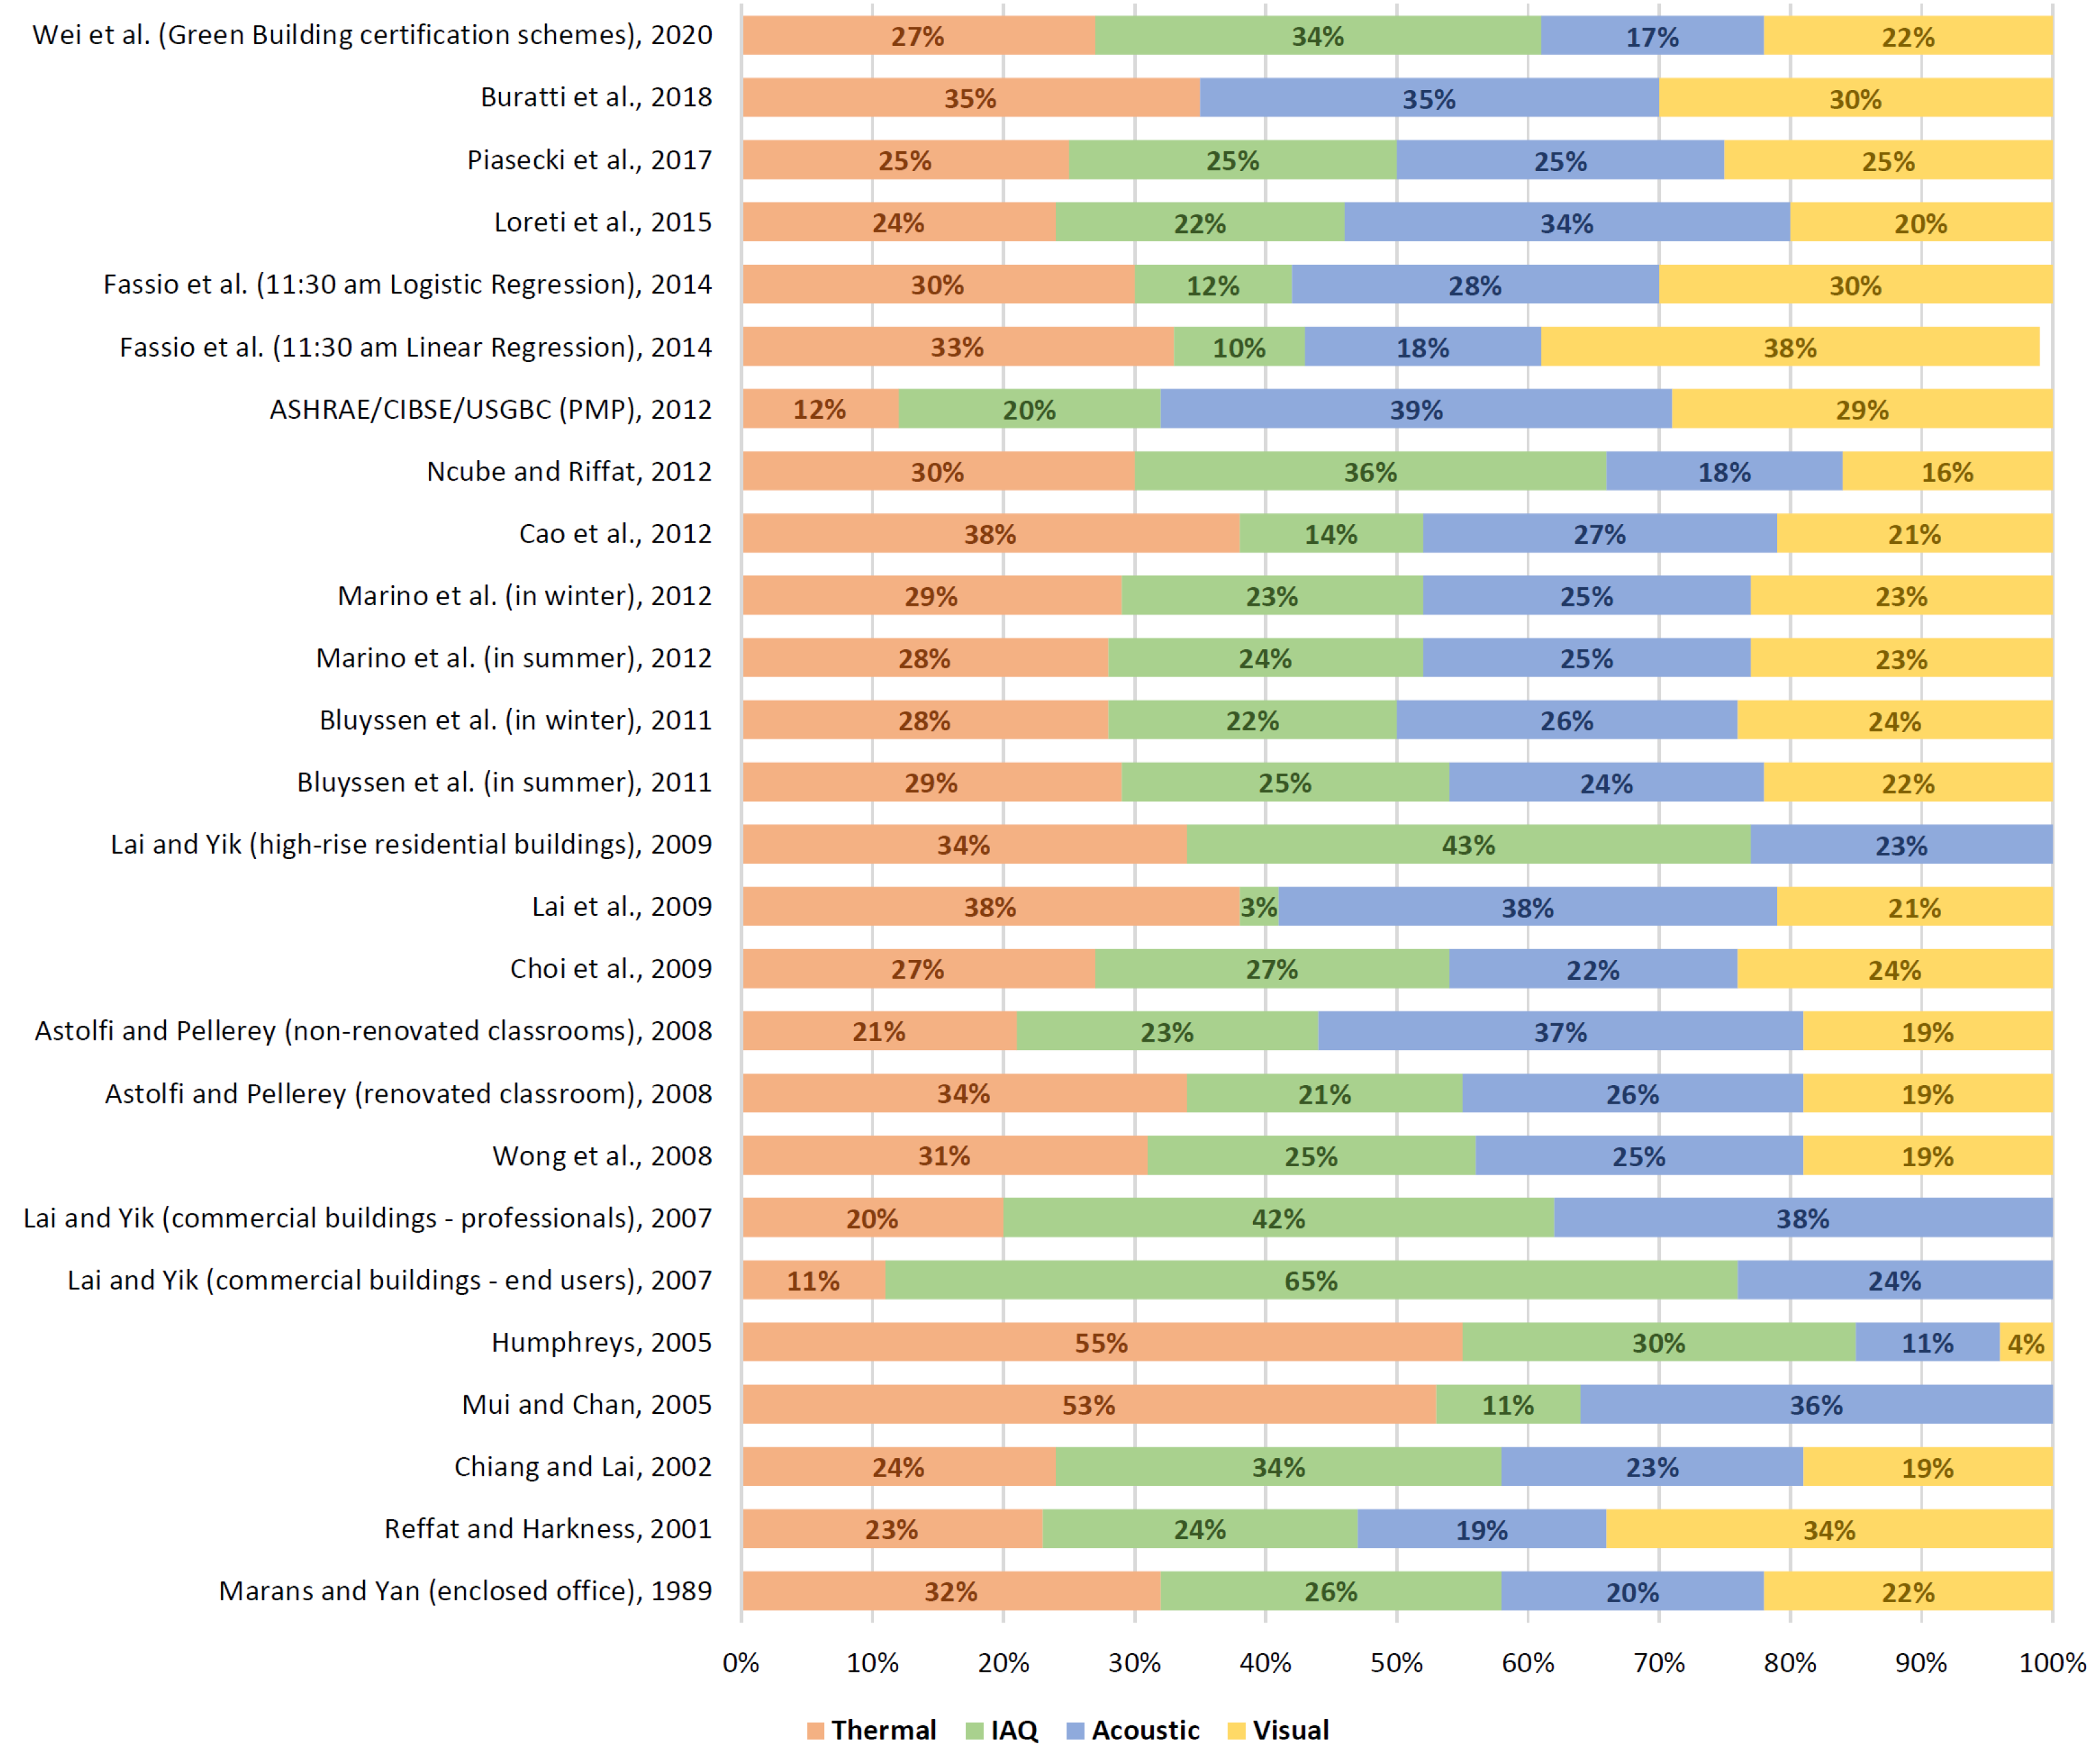
These indices refer to a specific IEQ category that provides a necessary overall picture to analyse and discuss global comfort indices. In order to discuss the importance of each specific IEQ category, all reviewed studies coefficients are approximate to two decimal points, reported on a percentage scale, and presented below. Figure 5 summarises the proposed weightings in the reviewed research studies. Two studies [71,72] are not in Figure 5 (such as in Table 4 and Figure 4), but they are in Table 5 because their corresponding formulas (see Formulas (6) and (11)) do not perform a “real” weighting but an arithmetic average.
Averaging over the analysed studies, the thermal category was considered as the most important and the visual category as the least important. The IAQ and acoustic categories have, on average, the same impact on global comfort. In detail, an average of all the analysed studies gives the following percentages:
  • 30% (thermal).
  • 26% (IAQ).
  • 26% (acoustic).
  • 23% (visual).
In green building schemes, IAQ category tends to have more weight than acoustic category (sometimes it is considered the most important or at least as important as the thermal category). Moreover, each category can considerably vary from case to case. More precisely between the analysed studies, the variation is as follows:
  • Thermal category from 11% to 55%.
  • IAQ category from 3% to 65%.
  • Acoustic category from 11% to 39%.
  • Visual category from 4% to 38%.
Generally speaking, it is difficult to establish the IEQ category impact on overall comfort for different reasons:
  • The non-independence between the variables of physical environmental factors (such as sound level, temperature, illuminance, etc.) do not only influence the corresponding comfort category but (although to a lesser degree) also the other categories [83].
  • The IEQ factors weightings change significantly based on the occupant’s expectation/satisfaction for that corresponding IEQ factor [76]. Thus, if, for instance, occupants are not satisfied with thermal comfort, this category becomes more relevant.
  • The IEQ category weighting depends on the type of building type (e.g., commercial building, residential building, educational building, etc.).
  • To determine various IEQ categories weightings, different models are adopted with different results.
  • In general, the IEQ (like the IEQ-productivity belief [88]) depends not only on the building characteristics. It also depends on attitudinal–behavioural factors, social-influence factors, and demographics (such as gender, age, and cultural differences).
However, by analysing the reviewed studies, it is possible to define some common aspects of these global comfort indices and models:
  • All mentioned indoor environmental quality indices consider different types of comfort. Nevertheless, the four most relevant comfort categories are the ones examined in this study (indoor air quality, thermal, acoustic and visual comfort).
  • In the majority of such global comfort indices, each sub-index (or comfort category) is assigned a “relevancy weight,” which are mainly weight-based indices. Several methods are used to assign these weights, but in any case, they are drawn from databases coming from surveys and/or expert input.
  • The various indices that comprise global comfort are often assessed in either a completely objective way (through sensors) or a completely subjective way (through surveys), so these two aspects are not often analysed together.
In accordance with the above, an indoor global comfort index (IGCI) gathering the best aspects should have the following requisites:
  • Considering only those indices that have a certain relevance with respect to the global one (i.e., thermal comfort, indoor air quality, acoustic comfort, visual comfort indices).
  • Assigning certain importance to each index (for instance, “weighted” attribution through the acquisition of subjective data, such as questionnaires/feedback by either experts or occupants).
  • Correlating subjective data to objective data.
  • Tracking the index value variation according to the occupants’ preferences and the measurable objective parameters (temperature, humidity, CO2 levels, illuminance, noise level, etc.);
  • Introducing an acceptability threshold for each index. In this way, even if only one of them falls below this threshold, the entire global comfort index must be heavily affected. The laws about this subject change and depend on the country where they are applied and on the use cases. This is why it is appropriate to let these choices be made freely.
This kind of global index has the following pros and cons.
Pros—managing a global comfort index in a building allows:
  • The quantification, in the most objective way possible, of the comfort aspects only of a certain building.
  • Aspects to be included and/or improvement of a model already proposed for anyone who might study this subject.
  • A parameter/objective reference to be obtained for the designer and/or builder, for the certifying authority and for the purchaser.
  • Implementation of artificial intelligence algorithms for the optimal control of any actuators (e.g., shutter position in windows, cooling/heating, dimming for lighting level, etc.) based on index value and occupant feedback.
  • Improvement of the occupants’ quality of life.
  • The majority of building types to be covered (e.g., green buildings, smart homes/smart buildings, educational buildings, offices, and other more specific cases).
Cons—this IGCI considers the more important aspects that create comfort, without other elements that might change the indoor environment quality perception. Some examples are:
  • Considering attitudinal–behavioural factors, social-influence factors, and demographics.
  • Considering external factors, such as climate, within the model.
  • The presence (or absence) of systems (such as safety/cleaning/gardening/entertainment systems).
  • Security and safety in general.
  • The use of specific building materials.
  • Others aspects: potable water, electromagnetic frequency levels, smart speakers, ergonomics, aesthetics, etc.
On the one hand, integrating such elements could contribute to a more complete indoor global comfort index; on the other, the risk is that more subjectivity might enter the evaluation, with the subsequent decrease of the index objectivity.
By analysing the reviewed papers, different techniques and models are used to obtain the weights (or correlation coefficients) of each comfort category. In general, the most commonly adopted models in all these studies covering IEQ factors are [65]:
  • A multivariate linear regression algorithm.
  • A multivariate logistic regression algorithm.
  • A multivariate linear regression algorithm based on dummy variables.
  • Alternative algorithms.
Finally, other recent comfort-related studies are using artificial intelligence algorithms. This promising approach focused on them will be discussed below.

Comfort Indices: Future Direction and Artificial Intelligence

Today, most global comfort indices can help quantify the comfort of a certain indoor environment or building in addition to being capable of predicting comfort levels for several reasons. The main one is to be able to automatically control different actuators for improving the building performance (especially in terms of energy efficiency). Artificial intelligence in comfort prediction has been employed in several studies. The main techniques that have been employed are based on machine learning (ML) and concern:
  • Artificial neural networks (ANN).
  • Decision trees (DT).
  • Support vector machines (SVM).
  • Bayes networks (BN).
  • General linear model (GLM).
In several studies, ANN is deployed to implement AI [89,90,91,92,93]. More specifically, some studies use models such as multilayer perceptron (MLP) [94,95] and neural network autoregression with exogenous input (NNARX) [96,97] to output indoor temperature and indoor relative humidity. Other studies, aimed at obtaining the predicted mean vote (PMV) and the thermal sensation vote (TSV) as outputs, apply models like the back-propagation neural network (BPNN) [98,99], the feed-forward neural network (FFNN) [100,101,102,103], the radial basis function networks (RBFN) [104], and random forests (RFs) [105,106]. However, these studies use artificial intelligence to predict quantities (or indices) often related to thermal comfort and rarely include the different IEQ aspects. Today, these algorithms must include as many comfort factors as possible (not only thermal comfort). The integration of Internet of Things (IoT) and wireless sensor networks (WSN) has led to the widespread use of artificial intelligence algorithms, which normally require large amounts of data for proper processing. From the aforementioned studies, it can be concluded that, in this field, artificial intelligence allows the implementation of increasingly better predictive models. The implementation of methods that exploit AI in the prediction of comfort levels is also essential for energy efficiency in buildings [107]. For instance, this allows the well-known building performance gap (BPG) to be reduced, i.e., the difference between the predicted and the actual performance of a building.

6. Conclusions

This study outlined a survey of global comfort indices in indoor environments, often called the “overall comfort index”, the “combined comfort index”, and the “IEQ index”, even without the term “comfort” or using other words such as “satisfaction” or “dissatisfaction.” Initially, this article presented an overview of the main concepts, factors, methodologies, and indices of the individual comfort categories (also known as IEQ “factors”, “aspects”, “elements”, etc.). This overview made it possible to examine and discuss the global comfort indices proposed in the literature. A number of these overall indices were presented. Among them, the one to be chosen is strictly related to the case study that most closely resembles the real situation to be examined. For example, the choice could be based on the:
  • Building type: TEQE, IEI, I, PDIEQ, IEQ index for office buildings and DEQI for dwelling or residential buildings.
  • Geographical location and/or climate: IEI(AHP) in Taiwan, PDIEQ in Hong Kong, S in Beijing and Shanghai, IEQindex in the UK, I in Europe, or ICC in temperate climates.
  • Ventilation system: IEQindex for mechanically ventilated buildings or PDIEQ for air-conditioned buildings.
  • Other factors: public/private buildings, new/existing buildings, etc.
In the “Discussion” section, pre-set targets were reached:
  • Understanding the comfort categories importance and their impact on the global IEQ index.
  • Identifying common aspects of GCIs, IGCI requisites (with pros and cons), main weighting techniques, models, strategies, and methodologies adopted in this field research.
  • Evaluating the possible future directions and AI algorithms.
EN15251 [16] was the first international standard to address indoor environmental parameters (acoustic comfort, lighting, air quality, and heat), and it provided a number of parameters to help design and assess energy performance in buildings. This standard was developed in 2007 to help implement the Energy Performance of Buildings Directive in Europe [22], and it has now been updated and incorporated into the new standard EN16798-1: 2019. In this review, the focus was intentionally set on the overall user comfort indices and their related components. For a better reading, the article also included an initial overview of these four aspects, the corresponding indices (or methodologies), and the various strategies to achieve the best comfort in indoor environments. Generally speaking, in smart and green buildings (especially in smart homes), life quality can also vary in accordance with the possible presence of other artificial systems, such as safety systems (e.g., alarms and/or video-surveillance), cleaning systems (e.g., robot vacuum cleaners), appliances (low noise and high energy efficiency), gardening systems (e.g., watering systems and/or lawnmower robots), TV/speakers, entertainment systems, etc. Moreover, for the same indoor environment, allowing occupants to change the environmental conditions tends to increase their satisfaction [108]. Possible future research could be done to further analyse these four fundamental comfort parameters, seeking and integrating new indices for the different comfort categories. This would allow a better IGCI to be obtained that might include as many aspects as possible while still maintaining a high level of objectivity. Another option would be to describe the strategies and techniques aimed at maintaining good global comfort levels in buildings, with maximum energy efficiency (e.g., integrating energy consumption analysis and using machine learning algorithms or AI in general). This would produce nearl-zero-energy buildings (nZEBs) and green buildings with maximum comfort.

Funding

This research received no external funding.

Institutional Review Board Statement

Not applicable.

Informed Consent Statement

Not applicable.

Data Availability Statement

No new data were created or analyzed in this study. Data sharing is not applicable to this article.

Conflicts of Interest

The author declare no conflict of interest.

References

  1. Hedge, A. Where are we in understanding the effects of where we are? Ergonomics 2000, 43, 1019–1029. [Google Scholar] [CrossRef]
  2. Ullah, I.; Kim, D. An improved optimization function for maximizing user comfort with minimum energy consumption in smart homes. Energies 2017, 10, 1818. [Google Scholar] [CrossRef] [Green Version]
  3. Dounis, A.I.; Caraiscos, C. Advanced control systems engineering for energy and comfort management in a building environment-A review. Renew. Sustain. Energy Rev. 2009, 13, 1246–1261. [Google Scholar] [CrossRef]
  4. Google Scholar. Available online: https://scholar.google.com/ (accessed on 20 September 2021).
  5. ScienceDirect.com|Science, Health and Medical Journals, Full Text Articles and Books. Available online: https://www.sciencedirect.com/ (accessed on 20 September 2021).
  6. MDPI—Publisher of Open Access Journals. Available online: https://www.mdpi.com/ (accessed on 20 September 2021).
  7. Home Feed | ResearchGate. Available online: https://www.researchgate.net/ (accessed on 20 September 2021).
  8. ASHRAE-55. Thermal Environmental Conditions for Human Occupancy. 2013. Available online: https://www.ashrae.org/technical-resources/bookstore/thermal-environmental-conditions-for-human-occupancy (accessed on 20 September 2021).
  9. Fanger, P.O. Thermal Comfort: Analysis and Applications in Environmental Engineering; McGraw-Hill: New York, NY, USA, 1972; Volume 3, p. 181. [Google Scholar] [CrossRef]
  10. Humphreys, M.A.; Nicol, J.F. Understanding the adaptive approach to thermal comfort. ASHRAE Trans. 1998, 104, 991–1004. [Google Scholar]
  11. de Dear, R.J.; Brager, G.S. Developing an adaptive model of thermal comfort and preference. ASHRAE Trans. 1998, 104, 145–167. [Google Scholar]
  12. Brager, G.S.; De Dear, R. A standard for natural ventilation. ASHRAE J. 2000, 42, 21–23, 25. [Google Scholar]
  13. Balaras, C.A.; Dascalaki, E.; Gaglia, A. HVAC and indoor thermal conditions in hospital operating rooms. Energy Build. 2007, 39, 454–470. [Google Scholar] [CrossRef]
  14. Wolkoff, P.; Kjærgaard, S.K. The dichotomy of relative humidity on indoor air quality. Environ. Int. 2007, 33, 850–857. [Google Scholar] [CrossRef]
  15. ISO—International Organization for Standardization. ISO 7730:2005, Ergonomics of the Thermal Environment—Analytical Determination and Interpretation of Thermal Comfort Using Calculation of the PMV and PPD Indices and Local Thermal Comfort Criteria. Available online: https://www.iso.org/standard/39155.html (accessed on 20 September 2021).
  16. Bruxelles: European Standardisation. EN 15251:2007. Indoor Environmental Input Parameters for Design and Assessment of Energy Performance of Buildings Addressing Indoor Air Quality, Thermal Environment, Lighting and Acoustics. 2007. Available online: https://www.rehva.eu/rehva-journal/chapter/indoor-environmental-input-parameters-for-the-design-and-assessment-of-energy-performance-of-buildings (accessed on 20 September 2021).
  17. Hamzah, B.; Gou, Z.; Mulyadi, R.; Amin, S. Thermal comfort analyses of secondary school students in the tropics. Buildings 2018, 8, 1–19. [Google Scholar] [CrossRef] [Green Version]
  18. Broday, E.E.; Moreto, J.A.; Xavier, A.A.d.P.; de Oliveira, R. The approximation between thermal sensation votes (TSV) and predicted mean vote (PMV): A comparative analysis. Int. J. Ind. Ergon. 2019, 69, 1–8. [Google Scholar] [CrossRef]
  19. Zhou, X.; Ouyang, Q.; Zhu, Y.; Feng, C.; Zhang, X. Experimental study of the influence of anticipated control on human thermal sensation and thermal comfort. Indoor Air 2014, 24, 171–177. [Google Scholar] [CrossRef]
  20. Andrea Ursini Casalena. Indici di Comfort Termico. 2009. Available online: https://www.mygreenbuildings.org/ (accessed on 9 April 2021).
  21. Petra Vladykova Bednarova. Overview of EN 15251: Part 1—Addressing Indoor Air Quality, Thermal Environment, Lighting and Acoustic. 2014. Available online: https://www.swegonairacademy.com/ (accessed on 9 April 2021).
  22. Olesen, B.W. Indoor Environmental Input Parameters for Design and Assessment of Energy Performance of Buildings Addressing Indoor Air Quality, Thermal Environment, Lighting and Acoustics. REHVA 2015, 52, 17–23. [Google Scholar]
  23. Olgyay, V. Design with Climate; Princeton University Press: Princeton, NJ, USA, 1969. [Google Scholar]
  24. Milne, M.; Givoni, B. Architectural design based on climate. In Energy Conservation through Building Design; McGraw-Hill: New York, NY, USA, 1979; pp. 96–113. [Google Scholar]
  25. Teodoreanu, E. Thermal Comfort Index. Present Environ. Sustain. Dev. 2016, 10, 105–118. [Google Scholar] [CrossRef] [Green Version]
  26. Masterson, J.; Richardson, F. Humidex, A Method of Quantifying Human Discomfort Due to Excessive Heat and Humidity; Atmospheric Environment Service: Downsview, ON, Canada, 1979; p. 45. [Google Scholar]
  27. Agostini, G.; Pinna, M.; Pinna, S.; Russo, F. Bioclimatologia Umana; UTET: Milan, Italy, 2005; p. 344. [Google Scholar]
  28. Winterling, G.A. Humiture—Revised and Adapted for the Summer Season in Jacksonville, Fla. Bull. Am. Meteorol. Soc. 1979, 60, 329–330. [Google Scholar]
  29. Steadman, R.G. The assessment of sultriness. Part II: Effects of wind, extra radiation and barometric pressure on apparent temperature. J. Appl. Meteorol. 1979, 18, 874–885. [Google Scholar] [CrossRef] [Green Version]
  30. Thom, E.C. The discomfort index. Weatherwise 1959, 12, 57–61. [Google Scholar] [CrossRef]
  31. Quayle, R.G.; Steadman, R.G. The Steadman wind chill: An improvement over present scales. Weather Forecast. 1998, 13, 1187–1193. [Google Scholar] [CrossRef]
  32. Besancenot, J.P. Premières Données sur les Stress Bioclimatiques Moyens en France. In Annales de Geographie; Armand Colin: Malakoff, France, 1974; pp. 497–530. [Google Scholar]
  33. Teodoreanu, E. Bioclimatologie Umană; Editura Academiei Române: Bucharest, Romania, 2002. [Google Scholar]
  34. Kilpatrick, K. Sick Classrooms Caused by Rising CO2 Levels. 2021. Available online: https://energyalliancegroup.org/sick-classrooms-require-energy-efficient-solutions-2 (accessed on 28 May 2021).
  35. The National Institute for Occupational Safety and Health (NIOSH). Indoor Environmental Quality. 2013. Available online: https://www.cdc.gov/niosh/topics/indoorenv/default.html (accessed on 20 September 2021).
  36. ASHRAE. Ventilation and Infiltration chapter. In Fundamentals Volume of the ASHRAE Handbook; American Society of Heating Refrigerating and Air-Conditioning: Atlanta, GA, USA, 2005. [Google Scholar]
  37. Bruxelles: European Standardisation. EN 12354-5:2009. Building Acoustics—Estimation of Acoustic Performance of Building from the Performance of Elements—Part 5: Sounds Levels due to the Service Equipment. 2009. Available online: https://standards.iteh.ai/catalog/standards/cen/d13c4f80-8a98-46e9-bd4d-032a746a1776/en-12354-5-2009 (accessed on 20 September 2021).
  38. Artan, D.; Ergen, E.; Tekce, I. Acoustical comfort in office buildings. In Proceedings of the Annual International Conference on Architecture and Civil Engineering. Global Science and Technology Forum, Singapore, 27–28 May 2019; pp. 145–149. [Google Scholar] [CrossRef]
  39. Ncube, M.; Riffat, S. Developing an indoor environment quality tool for assessment of mechanically ventilated office buildings in the UK—A preliminary study. Build. Environ. 2012, 53, 26–33. [Google Scholar] [CrossRef] [Green Version]
  40. Bies, D.A.; Hansen, C.H.; Howard, C.Q. Engineering Noise Control; CRC Press: Boca Raton, FL, USA, 2017. [Google Scholar]
  41. Wong, L.T.; Mui, K.W.; Hui, P.S. A multivariate-logistic model for acceptance of indoor environmental quality (IEQ) in offices. Build. Environ. 2008, 43, 1–6. [Google Scholar] [CrossRef]
  42. European Committee for Standardization. EN 12665. Light and Lighting—Basic Terms and Criteria for Specifying Lighting Requirements. 2011. Available online: https://standards.iteh.ai/catalog/standards/cen/43e4dbbf-7710-4b60-9872-ad27a25a4661/en-12665-2018 (accessed on 20 September 2021).
  43. Carlucci, S.; Causone, F.; De Rosa, F.; Pagliano, L. A review of indices for assessing visual comfort with a view to their use in optimization processes to support building integrated design. Renew. Sustain. Energy Rev. 2015, 47, 1016–1033. [Google Scholar] [CrossRef] [Green Version]
  44. Kim, W.; Kim, J. The Scope of the Glare Light Source of the Window with Non-uniform Luminance Distribution. Indoor Built Environ. 2011, 20, 54–64. [Google Scholar] [CrossRef]
  45. Cantin, F.; Dubois, M.C. Daylighting metrics based on illuminance, distribution, glare and directivity. Light. Res. Technol. 2011, 43, 291–307. [Google Scholar] [CrossRef]
  46. Sapia, C. Daylighting in buildings: Developments of sunlight addressing by optical fiber. Sol. Energy 2013, 89, 113–121. [Google Scholar] [CrossRef]
  47. IESNA. Lighting Handbook; Illuminating Engineering Society of North America: New York, NY, USA, 2000. [Google Scholar]
  48. Marans, R.W.; Yan, X.Y. Lighting quality and environmental satisfaction in open and enclosed offices. J. Archit. Plan. Res. 1989, 6, 118–131. [Google Scholar]
  49. Reffat, R.M.; Harkness, E.L. Environmental comfort criteria: Weighting and integration. J. Perform. Constr. Facil. 2001, 15, 104–108. [Google Scholar] [CrossRef]
  50. Reffat, R.M.; Harkness, E.L. Expert System for Environmental Quality Evaluation. J. Perform. Constr. Facil. 2001, 15, 109–114. [Google Scholar] [CrossRef]
  51. Chiang, C.M.; Lai, C.M. A study on the comprehensive indicator of indoor environment assessment for occupants’ health in Taiwan. Build. Environ. 2002, 37, 387–392. [Google Scholar] [CrossRef]
  52. Mui, K.W.; Chan, W.T. A new indoor environmental quality equation for air-conditioned buildings. Archit. Sci. Rev. 2005, 48, 41–46. [Google Scholar] [CrossRef]
  53. Humphreys, M.A. Quantifying occupant comfort: Are combined indices of the indoor environment practicable? Build. Res. Inf. 2005, 33, 317–325. [Google Scholar] [CrossRef]
  54. Lai, J.H.; Yik, F.W. Perceived importance of the quality of the indoor environment in commercial buildings. Indoor Built Environ. 2007, 16, 311–321. [Google Scholar] [CrossRef]
  55. Astolfi, A.; Pellerey, F. Subjective and objective assessment of acoustical and overall environmental quality in secondary school classrooms. J. Acoust. Soc. Am. 2008, 123, 163–173. [Google Scholar] [CrossRef] [PubMed] [Green Version]
  56. Choi, J.H.; Aziz, A.; Loftness, V. Decision support for improving occupant environmental satisfaction in office buildings: The relationship between sub-set of IEQ satisfaction and overall environmental satisfaction. In Proceedings of the 9th International Conference and Exhibition—Healthy Buildings 2009, HB 2009, Syracuse, NY, USA, 13–17 September 2009. [Google Scholar]
  57. Lai, A.C.; Mui, K.W.; Wong, L.T.; Law, L.Y. An evaluation model for indoor environmental quality (IEQ) acceptance in residential buildings. Energy Build. 2009, 41, 930–936. [Google Scholar] [CrossRef]
  58. Lai, J.H.K.; Yik, F.W.H. Perception of importance and performance of the indoor environmental quality of high-rise residential buildings. Build. Environ. 2009, 44, 352–360. [Google Scholar] [CrossRef]
  59. Bluyssen, P.M.; Aries, M.; van Dommelen, P. Comfort of workers in office buildings: The European HOPE project. Build. Environ. 2011, 46, 280–288. [Google Scholar] [CrossRef]
  60. Marino, C.; Nucara, A.; Pietrafesa, M. Proposal of comfort classification indexes suitable for both single environments and whole buildings. Build. Environ. 2012, 57, 58–67. [Google Scholar] [CrossRef]
  61. Cao, B.; Ouyang, Q.; Zhu, Y.; Huang, L.; Hu, H.; Deng, G. Development of a multivariate regression model for overall satisfaction in public buildings based on field studies in Beijing and Shanghai. Build. Environ. 2012, 47, 394–399. [Google Scholar] [CrossRef]
  62. Kim, H.; Haberl, J.S. Field-test of the new ASHRAE/CIBSE/USGBC performance measurement protocols for commercial buildings: Basic level. ASHRAE Trans. 2012, 118, 135–142. [Google Scholar]
  63. Heinzerling, D.; Schiavon, S.; Webster, T.; Arens, E. Indoor environmental quality assessment models: A literature review and a proposed weighting and classification scheme. Build. Environ. 2013, 70, 210–222. [Google Scholar] [CrossRef] [Green Version]
  64. Hunn, B.D.; Bochat, J. Measurement of commercial building performance. ASHRAE J. 2015, 57, 66–71. [Google Scholar]
  65. Fassio, F.; Fanchiotti, A.; de Lieto Vollaro, R. Linear, non-linear and alternative algorithms in the correlation of IEQ factors with global comfort: A case study. Sustainability 2014, 6, 8113–8127. [Google Scholar] [CrossRef] [Green Version]
  66. Loreti, L.; Barbaresi, L.; De Cesaris, S.; Garai, M. Overall indoor quality of a non-renewed secondary-school building. Energy Procedia 2015, 78, 3126–3131. [Google Scholar] [CrossRef] [Green Version]
  67. Piasecki, M.; Kostyrko, K.; Pykacz, S. Indoor environmental quality assessment: Part 1: Choice of the indoor environmental quality sub-component models. J. Build. Phys. 2017, 41, 264–289. [Google Scholar] [CrossRef]
  68. Piasecki, M.; Kostyrko, K.B. Indoor environmental quality assessment, part 2: Model reliability analysis. J. Build. Phys. 2018, 42, 288–315. [Google Scholar] [CrossRef]
  69. Buratti, C.; Belloni, E.; Merli, F.; Ricciardi, P. A new index combining thermal, acoustic, and visual comfort of moderate environments in temperate climates. Build. Environ. 2018, 139, 27–37. [Google Scholar] [CrossRef]
  70. Wei, W.; Wargocki, P.; Zirngibl, J.; Bendžalová, J.; Mandin, C. Review of parameters used to assess the quality of the indoor environment in Green Building certification schemes for offices and hotels. Energy Build. 2020, 209, 109683. [Google Scholar] [CrossRef]
  71. Moschandreas, D.J.; Sofuoglu, S.C. The indoor environmental index and its relationship with symptoms of office building occupants. J. Air Waste Manag. Assoc. 2004, 54, 1440–1451. [Google Scholar] [CrossRef] [PubMed] [Green Version]
  72. Laskari, M.; Karatasou, S.; Santamouris, M. A methodology for the determination of indoor environmental quality in residential buildings through the monitoring of fundamental environmental parameters: A proposed Dwelling Environmental Quality Index. Indoor Built Environ. 2017, 26, 813–827. [Google Scholar] [CrossRef] [Green Version]
  73. Eur Soc Hous. ICE-WISH. Demonstrating through Intelligent Control (Smart Metering, Wireless Technology, Cloud Computing, and User- Oriented Display Information), Energy and Water Wastage Reductions. 2016. Available online: https://cordis.europa.eu/project/id/270898 (accessed on 20 September 2021).
  74. Chiang, C.M.; Chou, P.C.; Lai, C.M.; Li, Y.Y. A methodology to assess the indoor environment in care centers for senior citizens. Build. Environ. 2001, 36, 561–568. [Google Scholar] [CrossRef]
  75. Frontczak, M.; Wargocki, P. Literature survey on how different factors influence human comfort in indoor environments. Build. Environ. 2011, 46, 922–937. [Google Scholar] [CrossRef]
  76. Kim, J.; de Dear, R. Nonlinear relationships between individual IEQ factors and overall workspace satisfaction. Build. Environ. 2012, 49, 33–40. [Google Scholar] [CrossRef] [Green Version]
  77. Catalina, T.; Iordache, V. IEQ assessment on schools in the design stage. Build. Environ. 2012, 49, 129–140. [Google Scholar] [CrossRef]
  78. Sakhare, V.V.; Ralegaonkar, R.V. Indoor environmental quality: Review of parameters and assessment models. Archit. Sci. Rev. 2014, 57, 147–154. [Google Scholar] [CrossRef]
  79. Nimlyat, P.S.; Kandar, M.Z. Appraisal of indoor environmental quality (IEQ) in healthcare facilities: A literature review. Sustain. Cities Soc. 2015, 17, 61–68. [Google Scholar] [CrossRef]
  80. Gadotti, A.; Albatici, R. A survey of evaluation methods used for holistic comfort assessment. In Proceedings of the 9th International Windsor Conference 2016: Making Comfort Relevant, Windsor, UK, 7–10 April 2016; pp. 994–1006. [Google Scholar]
  81. Ricciardi, P.; Buratti, C. Environmental quality of university classrooms: Subjective and objective evaluation of the thermal, acoustic, and lighting comfort conditions. Build. Environ. 2018, 127, 23–36. [Google Scholar] [CrossRef]
  82. Nimlyat, P.S. Indoor environmental quality performance and occupants’ satisfaction [IEQPOS] as assessment criteria for green healthcare building rating. Build. Environ. 2018, 144, 598–610. [Google Scholar] [CrossRef]
  83. Yang, W.; Moon, H.J. Combined effects of acoustic, thermal, and illumination conditions on the comfort of discrete senses and overall indoor environment. Build. Environ. 2019, 148, 623–633. [Google Scholar] [CrossRef]
  84. Piasecki, M. Practical implementation of the indoor environmental quality model for the assessment of nearly zero energy single-family building. Buildings 2019, 9, 214. [Google Scholar] [CrossRef] [Green Version]
  85. Rohde, L.; Steen Larsen, T.; Jensen, R.L.; Larsen, O.K.; Jønsson, K.T.; Loukou, E. Determining indoor environmental criteria weights through expert panels and surveys. Build. Res. Inf. 2020, 48, 415–428. [Google Scholar] [CrossRef]
  86. Piasecki, M.; Radziszewska-Zielina, E.; Czerski, P.; Fedorczak-Cisak, M.; Zielina, M.; Krzyściak, P.; Kwaśniewska-Sip, P.; Grześkowiak, W. Implementation of the Indoor Environmental Quality (IEQ) Model for the Assessment of a Retrofitted Historical Masonry Building. Energies 2020, 13, 6051. [Google Scholar] [CrossRef]
  87. Tang, H.; Ding, Y.; Singer, B. Interactions and comprehensive effect of indoor environmental quality factors on occupant satisfaction. Build. Environ. 2020, 167, 106462. [Google Scholar] [CrossRef]
  88. Chen, C.F.; Yilmaz, S.; Pisello, A.L.; De Simone, M.; Kim, A.; Hong, T.; Bandurski, K.; Bavaresco, M.V.; Liu, P.L.; Zhu, Y. The impacts of building characteristics, social psychological and cultural factors on indoor environment quality productivity belief. Build. Environ. 2020, 185, 107189. [Google Scholar] [CrossRef]
  89. Moon, J.W.; Kim, J.J. ANN-based thermal control models for residential buildings. Build. Environ. 2010, 45, 1612–1625. [Google Scholar] [CrossRef]
  90. Özbalta, T.G.; Sezer, A.; Yıldız, Y. Models for prediction of daily mean indoor temperature and relative humidity: Education building in Izmir, Turkey. Indoor Built Environ. 2012, 21, 772–781. [Google Scholar] [CrossRef] [Green Version]
  91. Moon, J.W.; Yoon, S.H.; Kim, S. Development of an artificial neural network model based thermal control logic for double skin envelopes in winter. Build. Environ. 2013, 61, 149–159. [Google Scholar] [CrossRef]
  92. Ashtiani, A.; Mirzaei, P.A.; Haghighat, F. Indoor thermal condition in urban heat island: Comparison of the artificial neural network and regression methods prediction. Energy Build. 2014, 76, 597–604. [Google Scholar] [CrossRef]
  93. Moon, J.W.; Jung, S.K. Algorithm for optimal application of the setback moment in the heating season using an artificial neural network model. Energy Build. 2016, 127, 859–869. [Google Scholar] [CrossRef]
  94. Mba, L.; Meukam, P.; Kemajou, A. Application of artificial neural network for predicting hourly indoor air temperature and relative humidity in modern building in humid region. Energy Build. 2016, 121, 32–42. [Google Scholar] [CrossRef]
  95. Moon, J.W. Integrated control of the cooling system and surface openings using the artificial neural networks. Appl. Therm. Eng. 2015, 78, 150–161. [Google Scholar] [CrossRef]
  96. Mustafaraj, G.; Chen, J.; Lowry, G. Thermal behaviour prediction utilizing artificial neural networks for an open office. Appl. Math. Model. 2010, 34, 3216–3230. [Google Scholar] [CrossRef]
  97. Mustafaraj, G.; Lowry, G.; Chen, J. Prediction of room temperature and relative humidity by autoregressive linear and nonlinear neural network models for an open office. Energy Build. 2011, 43, 1452–1460. [Google Scholar] [CrossRef]
  98. Atthajariyakul, S.; Leephakpreeda, T. Neural computing thermal comfort index for HVAC systems. Energy Convers. Manag. 2005, 46, 2553–2565. [Google Scholar] [CrossRef]
  99. Moon, J.W. Performance of ANN-based predictive and adaptive thermal-control methods for disturbances in and around residential buildings. Build. Environ. 2012, 48, 15–26. [Google Scholar] [CrossRef]
  100. Li, C.; Zhang, Q.; Mou, T. The study of neural network in the application of pmv index. In Proceedings of the 2010 International Conference on System Science, Engineering Design and Manufacturing Informatization, Yichang, China, 12–14 November 2010; Volume 1, pp. 289–292. [Google Scholar]
  101. Castilla, M.; Álvarez, J.D.; Ortega, M.G.; Arahal, M.R. Neural network and polynomial approximated thermal comfort models for HVAC systems. Build. Environ. 2013, 59, 107–115. [Google Scholar] [CrossRef]
  102. Buratti, C.; Vergoni, M.; Palladino, D. Thermal comfort evaluation within non-residential environments: Development of Artificial Neural Network by using the adaptive approach data. Energy Procedia 2015, 78, 2875–2880. [Google Scholar] [CrossRef] [Green Version]
  103. von Grabe, J. Potential of artificial neural networks to predict thermal sensation votes. Appl. Energy 2016, 161, 412–424. [Google Scholar] [CrossRef]
  104. Ruano, A.E.; Ferreira, P.M. Neural network based hvac predictive control. IFAC Proc. Vol. 2014, 47, 3617–3622. [Google Scholar] [CrossRef] [Green Version]
  105. Chaudhuri, T.; Zhai, D.; Soh, Y.C.; Li, H.; Xie, L. Random forest based thermal comfort prediction from gender-specific physiological parameters using wearable sensing technology. Energy Build. 2018, 166, 391–406. [Google Scholar] [CrossRef]
  106. Wang, Z.; Yu, H.; Luo, M.; Wang, Z.; Zhang, H.; Jiao, Y. Predicting older people’s thermal sensation in building environment through a machine learning approach: Modelling, interpretation, and application. Build. Environ. 2019, 161, 106231. [Google Scholar] [CrossRef] [Green Version]
  107. Sajjadian, S.M.; Jafari, M.; Siebers, P.O. An artificial intelligence method for comfort level prediction. In Smart Innovation, Systems and Technologies; Springer: Berlin/Heidelberg, Germany, 2019; Volume 131, pp. 169–177. [Google Scholar] [CrossRef]
  108. Parsons, K. Design of the indoor environment. In Design and Management of Sustainable Built Environments; Springer: London, UK, 2013; pp. 157–177. [Google Scholar] [CrossRef]
Figure 1. Publication number on the topic by year.
Sustainability 13 12784 g001
Figure 2. Six variables for PMV calculation.
Sustainability 13 12784 g002
Figure 3. The relationship between the PPD and the PMV.
Sustainability 13 12784 g003
Figure 4. Summary radar chart of IEQ category ranking studies.
Sustainability 13 12784 g004
Figure 5. Percentage weightings in the reviewed research studies.
Sustainability 13 12784 g005
Table 1. PMV values and comfort condition.
PMV IndexComfort Condition
+3Hot
+2Warm
+1Slightly warm
0Neutral (comfort)
−1Slightly cool
−2Cool
−3Cold
Table 2. Building category and corresponding PMV and PPD% values.
Category (of Building or Room)Predicted Mean Value (PMV)Predicted Percentage Dissatisfied (PPD)
I−0.2 < PMV < +0.2<6
II−0.2 < PMV < +0.2<10
III−0.7 < PMV < +0.7<15
VIPMV < −0.7 or PMV > +0.7>15
Table 3. Building category and short description.
CategoryDescription
IHigh level of expectation for spaces occupied by a very sensitive person.
IINormal level of expectation to be used in new buildings and renovations.
IIIAcceptable level of expectation to be used in existing buildings.
IVValues outside the criteria for the above categories to be used only for a limited part of the year.
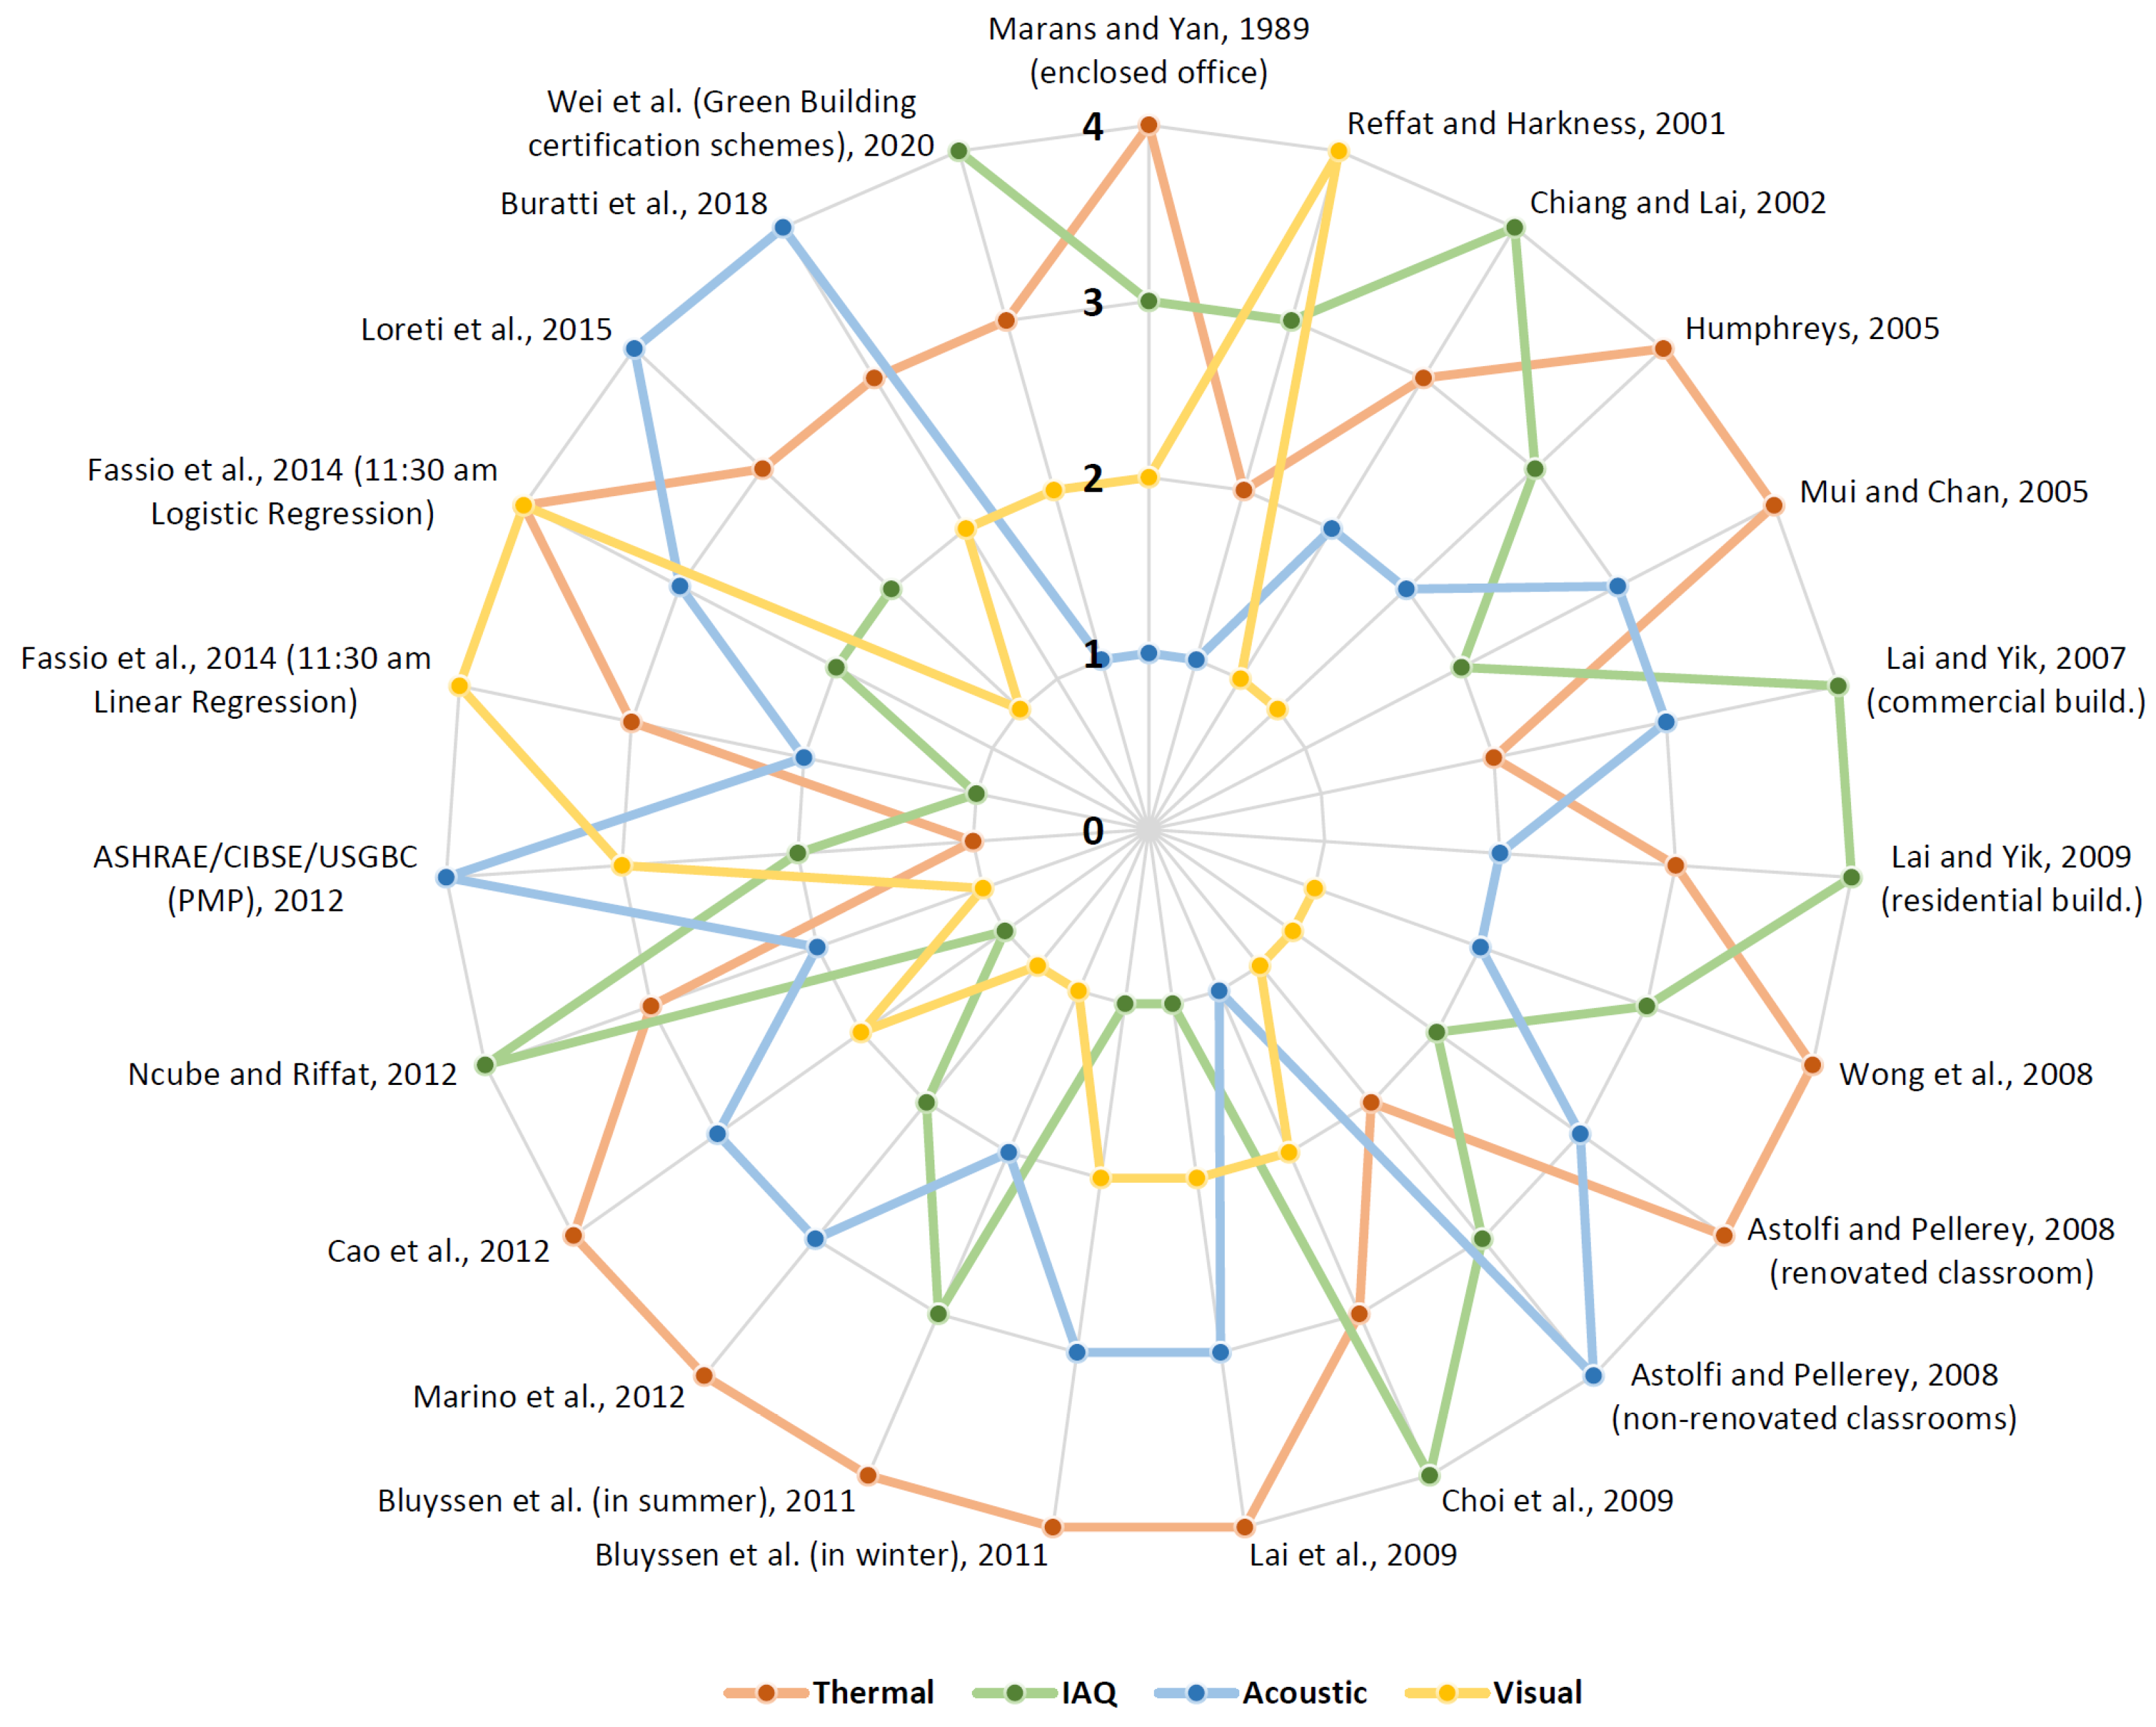
Table 4. IEQ comfort categories studies and corresponding weighting.
StudiesThermalIAQAcousticVisual
Marans and Yan, 1989 [48]
(enclosed office)
0.74
(0.50 + 0.24)
0.60.480.51
Reffat and Harkness, 2001 [49,50]2.293.381.893.44
Chiang and Lai, 2002 [51]0.2080.2900.2030.164
Mui and Chan, 2005 [52]0.420.090.28discarded
Humphreys, 2005 [53]0.67
(0.39 + 0.16 + 0.12)
0.360.130.05
Lai and Yik, 2007 [54]
(commercial buildings, end users)
0.11270.6531
(0.2318 + 0.4213)
0.2341
Lai and Yik, 2007 [54]
(commercial buildings, professionals)
0.20150.4233
(0.131 + 0.2923)
0.3752
Wong et al., 2008 [41]6.094.884.743.70
Astolfi and Pellerey, 2008 [55]
(renovated classroom)
0.500.320.390.29
Astolfi and Pellerey, 2008 [55]
(non-renovated classrooms)
0.280.310.500.25
Choi et al., 2009 [56]0.510.520.430.45
Lai et al., 2009 [57]22.051.60921.8611.77
Lai and Yik, 2009 [58]
(high-rise residential buildings)
0.33820.4313
(0.229 + 0.2023)
0.2305
Bluyssen et al., 2011 [59] (in summer)0.577
(IAQ1)
0.510
(IAQ2)
0.4820.450
Bluyssen et al., 2011 [59] (in winter)0.5290.4080.4910.441
Marino et al., 2012 [60] (in summer)0.1730.1500.1600.146
Marino et al., 2012 [60] (in winter)0.1890.1500.1600.146
Cao et al., 2012 [61]0.3160.1180.2240.171
Ncube and Riffat, 2012 [39]0.300.360.180.16
ASHRAE/CIBSE/USGBC performance measurement protocols (PMP), Kim and Haberl, 2012 [62]
Heinzerling et al., 2013 [63]
Hunn and Bochat, 2015 [64]
0.120.200.390.29
Fassio et al., 2014 [65]
(11:30 am—linear regression)
0.330.100.180.38
Fassio et al., 2014 [65]
(11:30 am—logistic regression)
0.300.120.280.30
Loreti et al., 2015 [66]0.210.190.300.17
Piasecki et al., 2017 [67,68]0.250.250.250.25
Buratti et al., 2018 [69]34.535.730.1
Wei et al., 2020 [70] (average of green building certification schemes)0.270.340.170.22
Table 5. IEQ indices, corresponding year, author(s), and publication journal.
IndexAuthor(s)YearPublished in
TEQE [49,50]Reffat and Harkness2001Journal of Performance of Constructed Facilities
IEI(AHP) [51]Chiang and Lai2002Building and Environment
IEI [71]Moschandreas and Sofuoglu2004Journal of the Air and Waste Management Association
I [53]Humphreys2005Building Research and Information
PDIEQ [52]Mui and Chan2005Architectural Science Review
S [61]Cao et al.2012Building and Environment
IEQindex [39]Ncube and Riffat2012Building and Environment
DEQI [72]Laskari et al.2017Indoor and Built Environment
ICC [69]Buratti et al.2018Building and Environment
Publisher’s Note: MDPI stays neutral with regard to jurisdictional claims in published maps and institutional affiliations.

