
Subtropical Broad-Leaved Urban Forests as the Foremost Dynamic and Complex Habitats for a Wide Range of Bird Species

 ,
,  , , , ,
Abstract
:1. Introduction
2. Materials and Methods
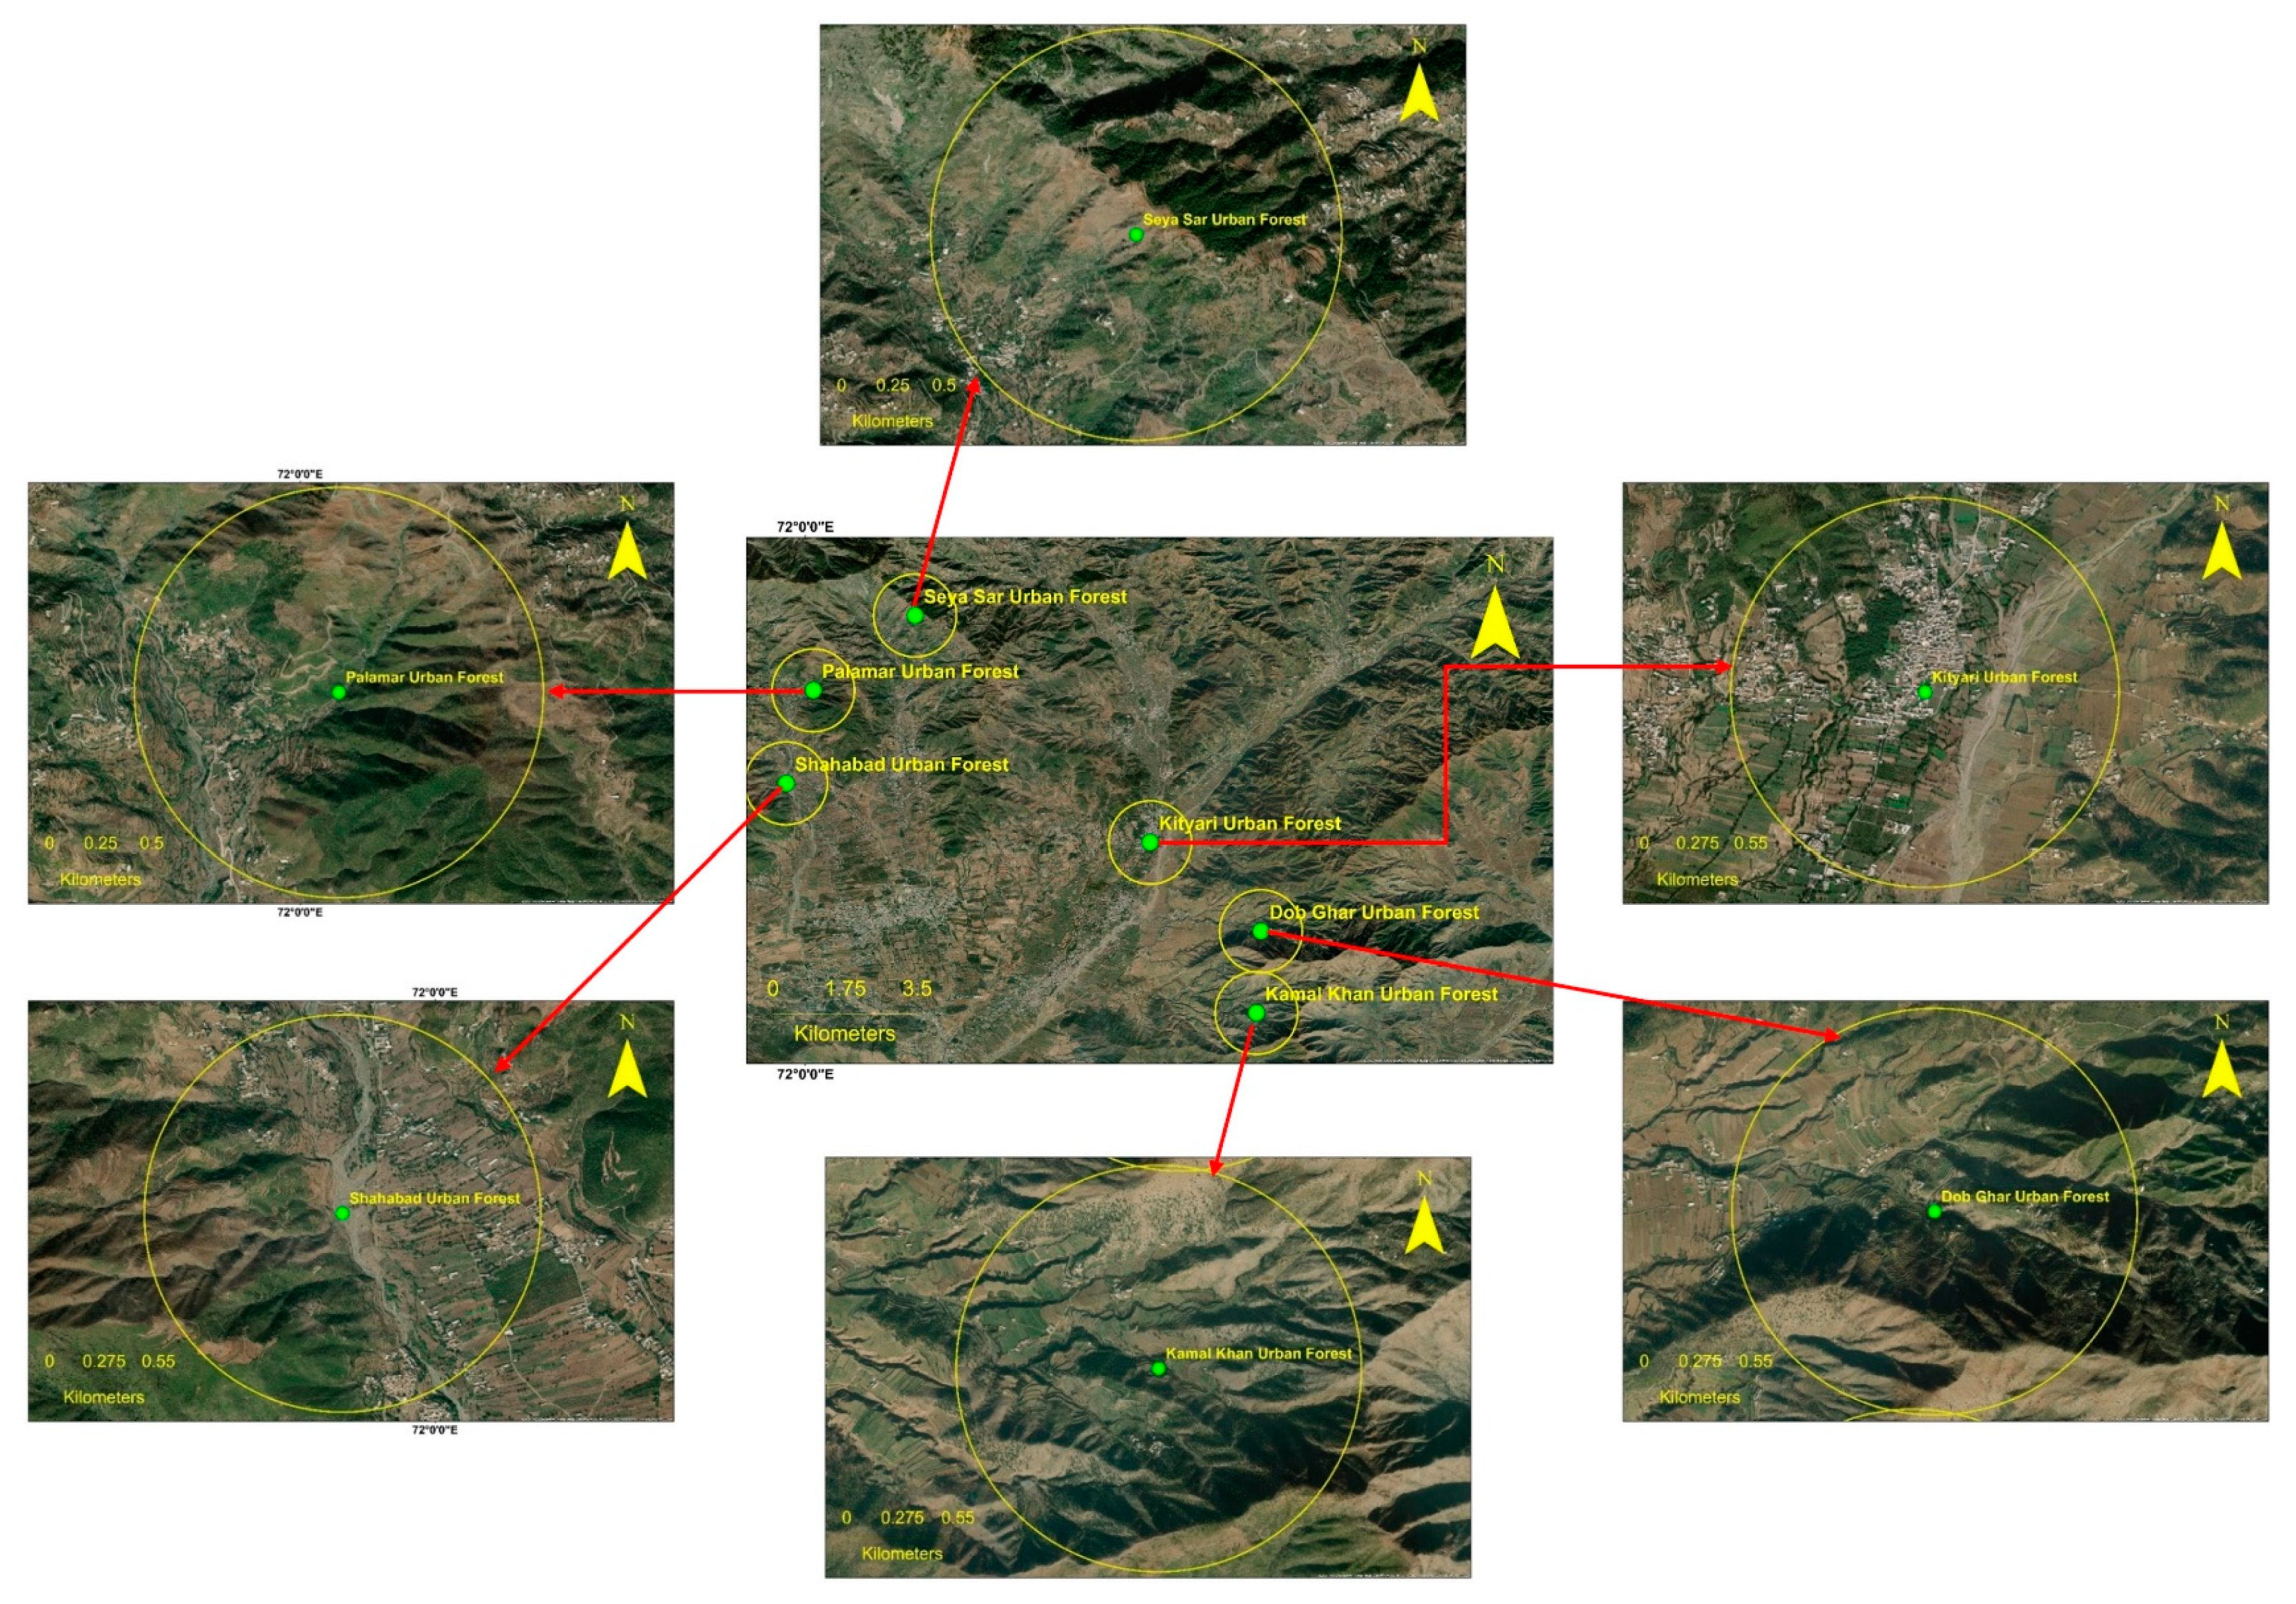
2.1. Study Area
2.2. Bird Survey
2.3. Data Analysis
2.3.1. Relative Species Abundance
2.3.2. Bird Relative Abundance among Six Coniferous Forests
2.3.3. Bird Density
2.4. Diversity Indices
2.4.1. Species Diversity Index
2.4.2. Species Richness Index
2.4.3. Species Evenness Index
2.5. Comparison of Bird Diversity Indices in Six Subtropical Broad-Leaved Urban Forest Habitats
2.6. Comparison of Foraging Guild Structure in Six Subtropical Broad-Leaved Urban Forest Habitats
3. Results
3.1. Bird Species Composition and Relative Abundance
3.2. Comparison of Bird Density in Six Subtropical Broa-Dleaved Urban Forest Habitats
3.2.1. Bird Density in Dob Ghar Subtropical Broad-Leaved Urban Forest
3.2.2. Bird Density in Shahabad Subtropical Broad-Leaved Urban Forest
3.2.3. Bird Density in Kityari Subtropical Broad-Leaved Urban Forest
3.2.4. Bird Density in Seya Sar Subtropical Broad-Leaved Urban Forest
3.2.5. Bird Density in Kamal Khan Subtropical Broad-Leaved Urban Forest
3.2.6. Bird Density in Palamar Subtropical Broad-Leaved Urban Forest
3.3. Comparison of Bird Diversity Indices in Six Subtropical Broad-Leaved Urban Forest Habitats
3.4. Comparison of Foraging Guilds of Avian Species in Six Subtropical Broad-Leaved Urban Forest Habitats
3.5. Correlation between Different Foraging Guilds and Bird Population in Six Subtropical Broad-Leaved Urban Forests
4. Discussion
5. Conclusions
Author Contributions
Funding
Institutional Review Board Statement
Informed Consent Statement
Acknowledgments
Conflicts of Interest
References
- Box, O.E.; Fujiwara, K. Asia, Ecosystems; Elsevier Inc.: Amsterdam, The Netherlands, 2013; pp. 261–291. [Google Scholar]
- FAO. Asia-Pacific Forestry Sector Outlook Study. Working Paper Series, Asia-Pacific Forestry towards 2010; Working Paper No: APFSOS/WP/11; Forestry Policy & Planning Division: Rome, Italy, 1997. [Google Scholar]
- Palomino, D.; Carrascal, L.M. Urban influence on birds at a regional scale: A case study with the avifauna of northern Madrid province. Landsc. Urban Plan. 2006, 77, 276–290. [Google Scholar] [CrossRef]
- Strohbach, M.; Lerman, S.B.; Warren, P.S. Are small greening areas enhancing bird diversity? Insights from community-driven greening projects in Boston. Landsc. Urban Plan. 2013, 114, 69–79. [Google Scholar] [CrossRef]
- Fontana, S.; Sattler, T.; Bontadina, F.; Moretti, M. How to manage the urban green to improve bird diversity and community structure. Landsc. Urban Plan. 2011, 101, 278–285. [Google Scholar] [CrossRef]
- Sher, H.; Al-yemeni, M.; Sher, H. Forest resource utilization assessment for economic development of rural community in northern parts of Pakistan. J. Med. Plant Res. 2010, 4, 1197–1208. [Google Scholar]
- Rajpar, M.N. Tropical Forest Area An Ideal Habitat for Wide Array of Wildlife Species. In Tropical Forest, New Edition; Sundarshana, P., Nageswara-Rao, M., Soneji, J.R., Eds.; InTech Open Access Publisher: Rijeka, Croatia, 2018; pp. 1–30. [Google Scholar]
- Ashton, P.; Zhu, H. The tropical-subtropical evergreen forest transition in East Asia: An exploration. Plant Divers. 2020, 42, 255–280. [Google Scholar] [CrossRef]
- Zhang, W.; Liang, C.; Liu, J.; Si, X.; Feng, G. Species richness, phylogenetic and functional structure of bird communities in Chinese university campuses are associated with divergent variables. Urban Ecosyst. 2018, 21, 1213–1225. [Google Scholar] [CrossRef]
- Liu, J.; Bai, H.; Ma, H.; Feng, G. Bird diversity in Chinese urban parks was more associated with natural factors than anthropogenic factors. Urban For. Urban Green. 2019, 43, 126358. [Google Scholar] [CrossRef]
- Lepczyk, C.A.; Warren, P.S. Urban Bird Ecology and Conservation; University of California Press: Berkeley, CA, USA, 2012. [Google Scholar]
- Mengesha, G.; Mamo, Y.; Bekele, A. A comparison of terrestrial bird community structure in undisturbed and disturbed areas of the Abijata Shalla lakes national park, Ethiopia. Int. J. Biodivers. Conserv. 2011, 3, 389–404. [Google Scholar]
- Liang, C.; Liu, J.; Pan, B.; Wang, N.; Yang, J.; Yang, G.; Feng, G. Precipitation is the dominant driver for bird species richness, phylogenetic and functional structure in university campuses in northern China. Avian Res. 2020, 11, 1–8. [Google Scholar] [CrossRef]
- Rija, A.A.; Mgelwa, A.S.; Modest, R.B.; Hassan, S.N. Composition and functional diversity in bird communities in a protected humid coastal savanna. Adv. Zool. 2015, 864219, 1–7. [Google Scholar] [CrossRef] [Green Version]
- Girma, Z.; Mamo, Y.; Mengesha, G.; Verma, A.; Asfaw, T. Seasonal abundance and habitat use of bird species in and around Wondo Genet Forest, south-central Ethiopia. Ecol. Evol. 2017, 7, 3397–3405. [Google Scholar] [CrossRef] [PubMed]
- Sokolov, V.; Ehrich, D.; Yoccoz, N.G.; Sokolov, A.; LeComte, N. Bird Communities of the Arctic Shrub Tundra of Yamal: Habitat Specialists and Generalists. PLoS ONE 2012, 7, e50335. [Google Scholar] [CrossRef] [PubMed] [Green Version]
- Martin, A.E.; Fahriq, L. Habitat specialist birds disperse farther and are more migratory than habitat generalist birds. Ecology 2018, 99, 2058–2066. [Google Scholar] [CrossRef] [PubMed]
- Lv, Z.; Yang, J.; Wielstra, B.; Wei, J.; Xu, F.; Si, Y. Prioritizing Green Spaces for Biodiversity Conservation in Beijing Based on Habitat Network Connectivity. Sustainability 2019, 11, 2042. [Google Scholar] [CrossRef] [Green Version]
- Machar, I.; Poprach, K.; Harmacek, J.; Fialova, J. Bird Diversity as a Support Decision Tool for Sustainable Management in Temperate Forested Floodplain Landscapes. Sustainability 2019, 11, 1527. [Google Scholar] [CrossRef] [Green Version]
- Mörtberg, U.; Pang, X.-L.; Treinys, R.; Trubins, R.; Mozgeris, G. Sustainability Assessment of Intensified Forestry—Forest Bioenergy versus Forest Biodiversity Targeting Forest Birds. Sustainability 2021, 13, 2789. [Google Scholar] [CrossRef]
- Ampoorter, E.; Barbaro, L.; Jactel, H.; Baeten, L.; Boberg, J.; Carnol, M.; Castagneyrol, B.; Charbonnier, Y.; Dawud, S.M.; Deconchat, M.; et al. Tree diversity is key for promoting the diversity and abundance of forest-associated taxa in Europe. Oikos 2020, 129, 133–146. [Google Scholar] [CrossRef] [Green Version]
- Mace, G.M.; Norris, K.; Fitter, A.H. Biodiversity and ecosystem services: A multilayered relationship. Trends Ecol. Evol. 2012, 27, 19–26. [Google Scholar] [CrossRef]
- Gamfeldt, L.; Snäll, T.; Bagchi, R.; Jonsson, M.; Gustafsson, L.; Kjellander, P.; Ruiz-Jaen, M.C.; Fröberg, M.; Stendahl, J.; Philipson, C.D.; et al. Higher levels of multiple ecosystem services are found in forests with more tree species. Nat. Commun. 2013, 4, 1340. [Google Scholar] [CrossRef]
- Camacho-Cervantes, M.; Ojanguren, A.F.; MacGregor-Fors, I. Birds from the burgh: Bird diversity and its relation with urban traits in a small town. J. Urban Ecol. 2018, 4, 1–7. [Google Scholar] [CrossRef]
- Jetz, W.; Thomas, G.; Joy, J.B.; Hartmann, K.; O Mooers, A. The global diversity of birds in space and time. Nature 2012, 491, 444–448. [Google Scholar] [CrossRef] [PubMed]
- Evans, K.L.; Newson, S.E.; Gaston, K.J. Habitat influences on urban avian assemblages. Ibis 2009, 151, 19–39. [Google Scholar] [CrossRef]
- Dallimer, M.; Rouquette, J.R.; Skinner, A.M.J.; Armsworth, P.R.; Maltby, L.M.; Warren, P.H.; Gaston, K.J. Contrasting patterns in species richness of birds, butterflies and plants along riparian corridors in an urban landscape. Divers. Distrib. 2012, 18, 742–753. [Google Scholar] [CrossRef]
- Brockerhoff, E.G.; Barbaro, L.; Castagneyrol, B.; Forrester, D.I.; Gardiner, B.; González-Olabarria, J.R.; Lyver, P.O.; Meurisse, N.; Oxbrough, A.; Taki, H.; et al. Forest biodiversity, ecosystem functioning and the provision of ecosystem services. Biodivers. Conserv. 2017, 26, 3005–3035. [Google Scholar] [CrossRef] [Green Version]
- Gray, M.A.; Baldauf, S.; Mayhew, P.J.; Hill, J.K. The Response of Avian Feeding Guilds to Tropical Forest Disturbance. Conserv. Biol. 2007, 21, 133–141. [Google Scholar] [CrossRef]
- Gregory, R.D.; van Strien, A. Wild bird indicators: Using composite population trends of birds as measures of environmental health. Ornithol. Sci. 2010, 9, 3–22. [Google Scholar] [CrossRef]
- Rajpar, M.N.; Zakaria, M. Bird Species Abundance and Their Correlationship with Microclimate and Habitat Variables at Natural Wetland Reserve, Peninsular Malaysia. Int. J. Zool. 2011, 2011, 758573. [Google Scholar] [CrossRef] [Green Version]
- Lamb, D.; Erskine, P.D.; Parrota, J.A. Restoration of degraded tropical forest landscape. Science 2005, 310, 1628–1632. [Google Scholar] [CrossRef] [Green Version]
- Chazdon, R.L. Beyond Deforestation: Restoring Forests and Ecosystem Services on Degraded Lands. Science 2008, 320, 1458–1460. [Google Scholar] [CrossRef] [Green Version]
- Hernández-Stefanoni, J.L.; Dupuy, J.M.; Tun-Dzul, F.; May-Pat, F. Influence of landscape structure and stand age on species density and biomass of a tropical dry forest across spatial scales. Landsc. Ecol. 2011, 26, 355–370. [Google Scholar] [CrossRef]
- Pinotti, B.T.; Pagotto, C.P.; Pardini, R. Habitat structure and food resources for wildlife across successional stages in a tropical forest. For. Ecol. Manag. 2012, 283, 119–127. [Google Scholar] [CrossRef]
- Sol, D.; Gonzalez-Lagos, C.; Moreira, D.; Maspons, J.; Lepiedra, O. Urbanization tolerance and the loss of avian diversity. Ecol. Lett. 2014, 17, 942–950. [Google Scholar] [CrossRef] [PubMed]
- BirdLife International. The Top Five Threats to the Birds May Surprise You. 2018. Available online: https://www.birdlife.org/worldwide/news/top-five-threats-birds-may-surprise-youweb (accessed on 15 July 2021).
- McClure, C.J.; Westrip, J.R.; Johnson, J.A.; Schulwitz, S.E.; Virani, M.Z.; Davies, R.; Butchart, S.H. State of the worls’s raptors: Distributions, threats, and conservation recommendations. Biol. Conserv. 2018, 27, 390–402. [Google Scholar] [CrossRef]
- Wang, X.; Kuang, F.; Tan, K.; Ma, Z. Population trends, threats, and conservation recommendations for waterbirds in China. Avian Res. 2018, 9, 14. [Google Scholar] [CrossRef] [Green Version]
- Fancy, S.G.; Gross, J.E.; Carter, S.L. Monitoring the condition of natural resources in US national parks. Environ. Monit. Assess. 2008, 151, 161–174. [Google Scholar] [CrossRef] [PubMed]
- Hansen, A.J.; Davis, C.R.; Piekielek, N.; Gross, J.; Theobald, D.M.; Goetz, S.; Melton, F.; DeFries, R. Delineating the ecosystems containing protected areas for monitoring and management. BioScience 2011, 61, 363–373. [Google Scholar] [CrossRef]
- IUCN. Guidelines for Using the IUCN Red List Categories and Criteria; IUCN: Gland, Switzerland; Cambridge, UK, 2004. [Google Scholar]
- Kotiaho, J.S.; Kaitala, V.; Komonen, A.; Palvinen, J. Predicting the risk of extinction from shared ecological characteristics. Proc. Natl. Acad. Sci. USA 2005, 102, 1963–1967. [Google Scholar] [CrossRef] [Green Version]
- Pérez-Arteaga, A.; Jackson, S.F.; Carrera, E.; Gaston, K.J. Priority sites for wildfowl conservation in Mexico. Anim. Conserv. 2005, 8, 41–50. [Google Scholar] [CrossRef] [Green Version]
- Buckland, S.T.; Anderson, D.R.; Burnhan, K.P.; Lake, J.L.; Borchers, D.L.; Thomas, L. Advance Distance Sampling; Estimating Abundance of Biological Populations; Oxford University Press: London, UK, 2004; pp. 141–172. [Google Scholar]
- Broekema, I.; Overdyck, O. Distance sampling to estimate densities of four native forest bird species during multispecies surveys. N. Z. J. Ecol. 2012, 36, 1–12. [Google Scholar]
- Marques, T.A.; Thomas, L.; Fancy, S.G.; Buckland, S.T. Improving estimates of bird density using multiple covariate distance sampling. Auk 2007, 127, 1229–1243. [Google Scholar] [CrossRef]
- Innes, J.; Spurr, E.B.; Arnold, G.C.; Morgan, D.; Waas, J.R.; Watts, C. Using five-minutes bird counts to study magpie (Gymnorhina tibicen) impacts on the birds in New Zealand. N. Z. J. Ecol. 2012, 36, 324–332. [Google Scholar]
- Buckland, S.T. Point transect surveys for songbirds: Robust methodologies. Auk 2006, 123, 345–357. [Google Scholar] [CrossRef]
- Gregory, R.D.; Gibbons, D.W.; Donald, P.F. Bird census and survey techniques. In Bird Ecology and Conservation, A Handbook of Techniques; Sutherland, W.J., Newton, I., Green, R.E., Eds.; Oxford University Press: Oxford, UK, 2006; p. 386. [Google Scholar]
- Aborn, D.A. Abundance, Density, and Diversity of Neotropical Migrants at the Lula Lake Land Trust, GA. Southeast. Nat. 2007, 6, 293–304. [Google Scholar] [CrossRef]
- Nadeau, C.P.; Conway, C.J.; Smith, B.S.; Lewis, T.E. Maximizing detection probability of wetland-dependent birds during point-count surveys in northwestern Florida. Wilson J. Ornithol. 2008, 120, 513–518. [Google Scholar] [CrossRef]
- McGill, B.J.; Etienne, R.; Gray, J.S.; Alonso, D.; Anderson, M.J.; Benecha, H.K.; Dornelas, M.; Enquist, B.; Green, J.L.; He, F.; et al. Species abundance distributions: Moving beyond single prediction theories to integration within an ecological framework. Ecol. Lett. 2007, 10, 995–1015. [Google Scholar] [CrossRef]
- Verberk, W. Explaining general patterns in species abundance and distributions. Nat. Educ. Knowl. 2011, 3, 38. [Google Scholar]
- Anderson, A.S.; Marques, T.A.; Shoo, L.P.; Williams, S. Detectability in Audio-Visual Surveys of Tropical Rainforest Birds: The Influence of Species, Weather and Habitat Characteristics. PLoS ONE 2015, 10, e0128464. [Google Scholar] [CrossRef] [Green Version]
- McGraw-Hill Companies. Statistix 8.1; Analytical Software; McGraw-Hill Companies: Tallahassee, FL, USA, 2008. [Google Scholar]
- Buckland, S.T.; Summers, R.W.; Borchers, D.L.; Thomas, L. Point transect sampling with traps or lures. J. Appl. Ecol. 2006, 43, 377–384. [Google Scholar] [CrossRef]
- Fewster, R.M.; Buckland, S.T.; Burnham, K.P.; Borchers, D.L.; Jupp, P.E.; Laake, J.L.; Thomas, L. Estimating the encounter rate variance in distance sampling. Biometrics 2009, 65, 225–236. [Google Scholar] [CrossRef]
- Henderson, P.A.; Seaby, R.M.H. Community Analysis Package 4.0; Pisces Conservation Ltd.: Lymington, UK, 2007. [Google Scholar]
- Nebel, S.; Jackson, D.L.; Elner, R.W. Functional association of bill morphology and foraging behavior in Calidrid Sandpipers. Anim. Biol. 2005, 55, 235–243. [Google Scholar] [CrossRef] [Green Version]
- Leso, P.; Kropil, R. A comparison of three different approaches for the classification of bird foraging guilds: An effect of leaf phenophase. Folia Zool. 2007, 56, 51–70. [Google Scholar]
- Goteli, N.J.; Chao, A. Measuring and estimating species richness, species diversity and biotic similarity from sampling data. In Encyclopedia of Biodiversity; Levin, S.A., Ed.; Academic Press: Cambridge, MA, USA, 2013; Volume 5, pp. 195–211. [Google Scholar]
- Pedley, S.M.; Barbaro, L.; Guilherme, J.L.; Irwin, S.; O’Halloran, J.; Proenca, V.; Sullivan, M.J. Functional shift in bird communities from semi-natural oak forests to conifer plantations are not consistent across Europe. PLoS ONE 2019, 14, e0220155. [Google Scholar] [CrossRef] [Green Version]
- Raman, T.R.S. Effects of habitat structure and adjacent habitats on the birds in tropical rainforest fragments ad shaded plantations in the Western Ghats, India. Biodivers. Conserv. 2006, 15, 1577–1607. [Google Scholar] [CrossRef]
- Bar-Massada, A.; Wood, E.M. The richness-heterogeneity relationship differs between heterogeneity measures within and among habitats. Ecography 2014, 37, 528–535. [Google Scholar] [CrossRef]
- Lee, M.-B.; Martin, J.A. Avian Species and Functional Diversity in Agricultural Landscapes: Does Landscape Heterogeneity Matter? PLoS ONE 2017, 12, e0170540. [Google Scholar] [CrossRef]
- Hewson, C.M.; Amar, A.; Lindsell, J.A.; Thewlis, R.M.; Butler, S.; Smith, K.; Fuller, R.J. Recent changes in bird populations in British broadleaved woodland. Ibis 2007, 149 (Suppl. S2), 14–28. [Google Scholar] [CrossRef]
- Poulin, B.; Lefebvre, G.; McNEIL, R. Variations in bird abundance in tropical arid and semi-arid habitats. Ibis 1993, 135, 432–441. [Google Scholar] [CrossRef]
- Sweeney, O.F.M.; Wilson, M.W.; Irwin, S. Are bird density, species richness and community structure similar between native woodlands and non-native plantations in the area with a generalist bird fauna? Biodivers. Conserv. 2010, 19, 2329–2342. [Google Scholar] [CrossRef]
- Jayson, E.A.; Mathew, D.N. Vertical Stratification and its Relation to Foliage in Tropical Forest Birds in Western Ghats (India). Acta Ornithol. 2003, 38, 111–116. [Google Scholar] [CrossRef] [Green Version]
- Tu, H.-M.; Fan, M.W.; Ko, J.C.-J. Different habitat types affect bird richness and evenness. Sci. Rep. 2020, 10, 1221. [Google Scholar] [CrossRef] [PubMed] [Green Version]
- Dagan, U.; Izhaki, I. Understory vegetation in planted pine forests governs bird community composition and diversity in the eastern Mediterranean region. For. Ecosyst. 2019, 6, 29. [Google Scholar] [CrossRef] [Green Version]
- Smith, K.M.; Keeton, W.S.; Donovan, T.M.; Mitchell, B. Stand-Level Forest Structure and Avian Habitat: Scale Dependencies in Predicting Occurrence in a Heterogeneous Forest. For. Sci. 2008, 54, 36–46. [Google Scholar] [CrossRef]
- Gil-Tena, A.; Saura, S.; Brotons, L. Effects of forest composition and structure on bird species richness in a Mediterranean context: Implications for forest ecosystem management. For. Ecol. Manag. 2007, 242, 470–476. [Google Scholar] [CrossRef]
- Batary, P.; Fronczek, S.; Normann, C.; Scherber, C.; Tscharntke, T. How do edge effect and tree species diversity change bird diversity and avian nest survival in Germany’s largest deciduous forest? For. Ecol. Manag. 2014, 319, 44–50. [Google Scholar] [CrossRef]
- Benayas, J.R.; Galván, I.; Carrascal, L.M. Differential effects of vegetation restoration in Mediterranean abandoned cropland by secondary succession and pine plantations on bird assemblages. For. Ecol. Manag. 2010, 260, 87–95. [Google Scholar] [CrossRef] [Green Version]
- Ulysen, M.D. Arthropod vertical stratification in temperate deciduous forests: Implications for conservation-oriented management. For. Ecol. Manag. 2011, 261, 1479–1489. [Google Scholar] [CrossRef]
- Stireman, J.O.; Devlin, H.; Doyle, A.L. Habitat fragmentation, tree diversity, and plant invasion interact to structure forest caterpillar communities. Oecologia 2014, 176, 207–224. [Google Scholar] [CrossRef]
- Wood, E.M.; Pidgeon, A.M. Extreme variation in spring temperature affects ecosystem regulating services provided by bird during spring migration. Ecosphere 2015, 6, 216. [Google Scholar] [CrossRef]
- Robertson, O.J.; McAlpine, C.; House, A.; Maron, M. Influence of Interspecific Competition and Landscape Structure on Spatial Homogenization of Avian Assemblages. PLoS ONE 2013, 8, e65299. [Google Scholar] [CrossRef] [Green Version]
- Cloyed, C.S. Forest structure affects resource portioning between pygmy and white-breasted nuthatches. Coevolution 2014, 2, 26–30. [Google Scholar] [CrossRef]
- Mansor, M.S.; Ramli, R.; Sah, S.A.M. The Foraging Tactics of Chestnut-winged Babbler (Stachyris erythroptera) and Abbott’s Babbler (Malacocincla abbotti) in a Lowland Rainforest, Malaysia. Sains Malays. 2015, 44, 687–692. [Google Scholar] [CrossRef]
- Styring, A.R.; Ragi, R.; Zakaria, M.; Sheldon, F.H. Foraging ecology and occurrence of seven sympatric babbler species (Timaliidae) in the lowland rainforest of Borneo and Peninsular Malaysia. Curr. Zool. 2016, 62, 1–11. [Google Scholar] [CrossRef] [PubMed] [Green Version]
- Bosakoski, T.; Smith, D.G. Distribution and species richness of a forest raptors community in relation to urbanization. J. Raptor Res. 1997, 31, 26–33. [Google Scholar]
- Widén, P. Habitat Quality for Raptors: A Field Experiment. J. Avian Biol. 1994, 25, 219. [Google Scholar] [CrossRef]
- Ellis, T.M.; Betts, M.G. Bird abundance and diversity across a hardwood gradient within early seral plantation forest. For. Ecol. Manag. 2011, 261, 1372–1381. [Google Scholar] [CrossRef]
- Huang, Q.; Swatantran, A.; Dubayah, R.; Goetz, S. The Influence of Vegetation Height Heterogeneity on Forest and Woodland Bird Species Richness across the United States. PLoS ONE 2014, 9, e103236. [Google Scholar] [CrossRef] [Green Version]
- Morelli, F.; Benedetti, Y.; Ibáñez-Álamo, J.D.; Jokimäki, J.; Mänd, R.; Tryjanowski, P.; Møller, A.P. Evidence of evolutionary homogenization of bird communities in urban environments across Europe. Glob. Ecol. Biogeogr. 2016, 25, 1284–1293. [Google Scholar] [CrossRef]
- Seress, G.; Sándor, K.; Evans, K.L.; Liker, A. Food availability limits avian reproduction in the city: An experimental study on great tits Parus major. J. Anim. Ecol. 2020, 89, 1570–1580. [Google Scholar] [CrossRef]
- Keynan, O.; Ridley, A.R.; Lotem, A. Social foraging strategies and acquisition of novel foraging skills in cooperatively breeding Arabian babblers. Behav. Ecol. 2015, 26, 207–214. [Google Scholar] [CrossRef] [Green Version]
- Rafay, M.; Ahmad, G.; Ruby, T.; Abdullah, M.; Rasheed, F.; Abid, M.; Akhtar, S.; Ahmad, Z.; Huaain, R. Breeding and feeding behavior of Jungle Babbler (Turdiodes striata Dumont, 1923) in agro-ecological zones of district Layyah, Pakistan. Pak. J. Zool. 2020, 52, 1707–1708. [Google Scholar]


| Description | Name of Subtropical Broad-Leaved Urban Forest | |||||
|---|---|---|---|---|---|---|
| Dob Ghar | Kamal Khan | Kityari | Palamar | Seya Sar | Shahabad | |
| Latitude | 34°43′36″ N | 34°42′32″ N | 34°44′46″ N | 34°46′46″ N | 34°47′44″ N | 34°45′31″ N |
| Longitude | 72°05′56″ E | 72°05′53″ E | 72°04′29″ E | 72°0′04″ E | 72°01′26″ E | 71°59′47″ E |
| Elevation feet (asl) | 3942 to 4487 feet | 3017 to 3966 feet | 2968 to 3125 feet | 4044 to 4959 feet | 5015 to 5822 feet | 3319 to 3775 feet |
| Landscape | Comprises hilly terrain dominated by small trees and shrubs | Encompasses hilly terrain and riparian areas | Contains hilly terrain ridges that are covered by coniferous vegetation on a higher elevation | It is a transition zone between coniferous and scrub vegetation, surrounded by agricultural fields | Comprises inner ridges of the mountains | It is a hilly terrain dominated by evergreen vegetation |
| Vegetation Cover % | 30.0% | 38.0% | 70.0% | 50.0% | 45.0% | 40.0% |
| Total area | 150 ha | 135 ha | 140 ha | 145 ha | 130 ha | 125 ha |
| Surveyed area | 50 ha | 45 ha | 46 ha | 46 ha | 65 ha | 55 ha |
| Most Dominant flora | Phulai (Acacia modesta), kau (Olea ferruginea), snatha (Dodonaea viscosa), mallah ber (Zizyphus nummularia), yellow Himalayan raspberry (Rubus ellipticus), shrubby blackberry(Rubus fruticosus), Scarlet spiderling (Boerhavia coccinea) | White mulberry (Morus alba), black mulberry (Morus nigra), common fig (Ficus carica), paper mulberry (Broussonetia papyrifera), bhimal (Grewia optiva), bakain or dharek (Melia azedarach), snatha (Dodonaea viscosa), mallah ber (Zizyphus nummularia), yellow Himalayan raspberry (Rubus ellipticus)and shrubby blackberry (Rubus fruticosus) | Chir pine (Pinus roxburghii), snatha (Dodonaea viscosa), blackberry (Rubus fruticosus), mallah ber (Zizyphus nummularia), yellow Himalayan raspberry (Rubus ellipticus), shrubby blackberry (Rubus fruticosus), Bermuda grass (Cynodon dactylon), bluegrass (Poa annua) and tall fescue (Festuca arundinacae) | Chir pine (Pinus roxburghii), kamala or kumkum tree (Mallotus philippensis), kau (Olea ferruginea), Snatha (Dodonaea viscosa), wild anar (Punica granatum), bhaikar (Adatoda vasica), Indian Lycium (Berberis lycium), Indigo (Indigfera trictoria), bhaikar or beheda (Justicia adhatoda), royale’s spike thorn (Gymnosporia royleana), and barbery (Berberis lyceum) | Chir pine (Pinus roxburghii), kau (Olea ferruginea), snatha (Dodonaea viscosa), bhaikar or beheda (Justicia adhatoda), scarlet spiderling (Boerhavia coccinea), and bhaikar or beheda (Justicia adhatoda) | Phulai (Acacia modesta), white mulberry (Morus alba), black mulberry (Morus nigra), kau (Olea ferruginea), snatha (Dodonaea viscosa), Indian lycium (Berberis lycium), bhaikar or beheda (Justicia adhatoda), and barbery (Berberis lyceum) |
| Surrounding habitat | Agricultural fields and human settlements | Agriculture fields and human settlement | Agriculture fields and human settlement | Agriculture fields | Agriculture fields and human settlement | Agriculture fields and orchards |
| Family Name | Scientific Name | Common Name | Name of Urban Forest Habitat | ||||||
|---|---|---|---|---|---|---|---|---|---|
| Shahabad | Seya Sar | Palamar | Kamal khan | Dob Ghar | Kityari | IUCN Status | |||
| Relative Species Abundance (%) | |||||||||
| Sturnidae | Acridotheres tristis | Common myna | 1.216 | 1.042 | 0.938 | 1.111 | 0.729 | 1.389 | LC |
| Corvidae | Corvus splendens | House crow | 1.042 | 0.347 | 0.278 | 0.556 | 0.175 | 2.779 | LC |
| Fringillidae | Carpodacus erythrinus | Common rosefinch | 1.042 | 1.216 | 0.521 | 0.695 | 0.347 | 1.042 | LC |
| Passeridae | Passer montanus | Eurasian tree sparrow | 1.042 | 0.799 | 0.590 | 0.452 | 0.347 | 1.111 | LC |
| Phasianidae | Alectoris chakur | Chakur | 0.868 | 0.695 | 1.216 | 0.243 | 0.417 | 0 | LC |
| Passeridae | Passer domesticus | House sparrow | 0.729 | 0.347 | 0.347 | 1.042 | 0.521 | 1.737 | LC |
| Sturnidae | Sturnus vulgaris | Common starling | 0.729 | 0.417 | 0.347 | 0.278 | 0.625 | 0.417 | LC |
| Hirundinidae | Hirundo rustica | Common swallow | 0.695 | 0.347 | 0.278 | 1.042 | 0.695 | 0.799 | LC |
| Leiothrichidae | Turdoides caudate | Common babbler | 0.695 | 0.347 | 0.695 | 0.868 | 0.521 | 0.868 | LC |
| Dicruridae | Dicrurus macrocercus | Black drongo | 0.625 | 0.417 | 0.521 | 0.695 | 0.347 | 0.695 | LC |
| Leiothrichidae | Trochalopteron lineatum | Streaked laughing thrush | 0.625 | 0.208 | 0.521 | 0.417 | 0.347 | 0.521 | LC |
| Phasianidae | Coturnix coturnix | Common quail | 0.521 | 0.347 | 0.521 | 0.695 | 0.695 | 0.417 | LC |
| Monarchidae | Terpsiphone paradise | Indian paradise flycatcher | 0.521 | 0.695 | 0.521 | 0.695 | 0.347 | 0.868 | LC |
| Paridae | Parus cinereus | Cinereous tit | 0.521 | 0.695 | 0.625 | 0.417 | 0.452 | 0.695 | LC |
| Pycnonotidae | Pycnonotus cafer | Red–vented bulbul | 0.521 | 0.695 | 0.625 | 0.521 | 0.347 | 0.521 | LC |
| Sturnidae | Sturnus pagodarum | Brahminy starling | 0.521 | 0.069 | 0.278 | 0.208 | 0.139 | 0.347 | LC |
| Turdidae | Turdus atrogularis | Black–throated thrush | 0.521 | 0.695 | 0.868 | 1.042 | 0.695 | 0.139 | LC |
| Emberizidae | Emberiza cia | Rock bunting | 0.452 | 0.695 | 0.278 | 0.139 | 0.347 | 0.278 | LC |
| Corvidae | Corvus macrorhynchos | Large–billed crow | 0.347 | 0.521 | 0.417 | 0.175 | 0.347 | 0.139 | LC |
| Laniidae | Lanius tephronotus | Grey–backed shrike | 0.347 | 0.313 | 0.243 | 0.278 | 0.347 | 0.695 | LC |
| Phylloscopidae | Phylloscopus collybita | Common chiffchaff | 0.347 | 0.243 | 0.486 | 0.625 | 0.521 | 0.417 | LC |
| Pycnonotidae | Pycnonotus leucogenys | Himalayan bulbul | 0.347 | 0.278 | 0.347 | 0.451 | 0.313 | 0.208 | LC |
| Columbidae | Streptopelia orientalis | Oriental turtle dove | 0.313 | 0.175 | 0.278 | 0.243 | 0.175 | 0.278 | LC |
| Oriolidae | Oriolus oriolus | Golden oriole | 0.313 | 0.347 | 0.417 | 0.486 | 0.452 | 0.660 | LC |
| Alaudidae | Galerida cristata | Crested lark | 0.278 | 0.139 | 0.069 | 0.104 | 0.069 | 0.139 | LC |
| Columbidae | Streptopelia turtur | European turtle dove | 0.243 | 0.139 | 0.104 | 0.175 | 0.243 | 0.139 | VU |
| Columbidae | Streptopelia chinensis | Spotted dove | 0.208 | 0.417 | 0.347 | 0.175 | 0.069 | 0.139 | LC |
| Columbidae | Columba livia | Rock pigeon | 0.175 | 0.347 | 0.243 | 0.139 | 0.069 | 0.069 | LC |
| Laniidae | Lanius vittatus | Bay–backed shrike | 0.175 | 0.139 | 0.069 | 0.139 | 0.175 | 0.347 | LC |
| Motacillidae | Motacilla alba | White wagtail | 0.175 | 0.139 | 0.556 | 0.347 | 0.139 | 0.347 | LC |
| Falconidae | Falco tinnunculus | Common kestrel | 0.139 | 0.139 | 0.175 | 0.104 | 0.069 | 0.069 | LC |
| Phasianidae | Francolinus francolinus | Black francolin | 0.139 | 0.104 | 0.278 | 0.175 | 0.208 | 0.069 | LC |
| Muscicapidae | Saxicola caprata | Pied bushchat | 0.139 | 0.175 | 0.139 | 0.208 | 0.278 | 0.208 | LC |
| Phylloscopidae | Phylloscopus chloronotus | Lemon–rumped warbler | 0.139 | 0.278 | 0.104 | 0.175 | 0.452 | 0.347 | LC |
| Corvidae | Dendrocitta vagabunda | Rufous treepie | 0.104 | 0.069 | 0.069 | 0.139 | 0.069 | 0.139 | LC |
| Motacillidae | Motacilla cinerea | Grey wagtail | 0.104 | 0.139 | 0.208 | 0.139 | 0.069 | 0.208 | LC |
| Accipitridae | Accipiter virgatus | Besra | 0.069 | 0.035 | 0.104 | 0.069 | 0 | 0.035 | LC |
| Upupidae | Upupa epops | Common hoopoe | 0.069 | 0 | 0.104 | 0 | 0.069 | 0.069 | LC |
| Columbidae | Streptopelia senegalensis | Laughing dove | 0.069 | 0.243 | 0.104 | 0.069 | 0.139 | 0.139 | LC |
| Columbidae | Treron phoenicoptera | Yellow-footed green pigeon | 0.069 | 0.035 | 0 | 0 | 0 | 0.069 | LC |
| Alcedinidae | Halcyon smyrnensis | White–throated kingfisher | 0.069 | 0.069 | 0.035 | 0.069 | 0 | 0.069 | LC |
| Coraciidae | Coracias benghalensis | Indian roller | 0.069 | 0.035 | 0 | 0.035 | 0 | 0.069 | LC |
| Cuculidae | Eudynamys scolopacea | Asian koel | 0.069 | 0 | 0 | 0.035 | 0 | 0.104 | LC |
| Muscicapidae | Myophonus caeruleus | Blue whistling thrush | 0.069 | 0.139 | 0.069 | 0.139 | 0.139 | 0.104 | LC |
| Muscicapidae | Copsychus saularisi | Oriental magpie robin | 0.069 | 0.069 | 0 | 0.069 | 0 | 0.069 | LC |
| Phylloscopidae | Phylloscopus trochiloides | Greenish warbler | 0.069 | 0.175 | 0.243 | 0.347 | 0.243 | 0.278 | LC |
| Pycnonotidae | Pycnonotus leucotis | White–eared bulbul | 0.069 | 0.104 | 0.139 | 0.347 | 0.521 | 0.139 | LC |
| Sturnidae | Acridotheres ginginianus | Bank myna | 0.069 | 0 | 0 | 0.208 | 0 | 0 | LC |
| Strigidae | Glaucidium brodiei | Collard owl | 0.069 | 0.069 | 0 | 0.313 | 0.139 | 0.139 | LC |
| Accipitridae | Accipiter badius | Shikra | 0.035 | 0.035 | 0.069 | 0.035 | 0.035 | 0 | LC |
| Columbidae | Columba hodgsonii | Speckled wood pigeon | 0.035 | 0 | 0.035 | 0 | 0 | 0.069 | LC |
| Accipitridae | Elanus caeruleus | Black–shouldered kite | 0 | 0 | 0 | 0.104 | 0.069 | 0.035 | LC |
| Meropidae | Merops orientalis | Green bee–eater | 0 | 0 | 0.035 | 0.069 | 0.069 | 0 | LC |
| Overall Percentage | 17.885 | 15.18 | 15.45 | 17.301 | 13.580 | 20.627 | |||
| Sub-Total | 515 | 437 | 445 | 497 | 391 | 594 | |||
| Grand Total | 2879 | ||||||||
| Habitat | Density (birds/ha) |
|---|---|
| Palamar | 3.954 ± 0.221 |
| Kityari | 3.138 ± 0.162 |
| Dob Ghar | 2.874 ± 0.230 |
| Shahabad | 2.170 ± 0.147 |
| Seya Sar | 1.808 ± 0.209 |
| Kamal Khan | 1.102 ± 0.178 |
| Scientific Name | Common Name | Density (birds/ha) | |||||
|---|---|---|---|---|---|---|---|
| Name of the Habitat (Urban Forest) | |||||||
| Dob Ghar | Shahabad | Kityari | Seya Sar | Kamal Khan | Palamar | ||
| Streptopelia chinensis | Spotted dove | – | – | – | 0.406 ± 0.114 | – | 0.578 ± 0.210 |
| Alectoris chakur | Chakur | 0.735 ± 0.237 | 0.162 ± 0.553 | – | 0.109 ± 0.363 | – | 0.347 ± 0.965 |
| Coturnix coturnix | Common quail | 0.696 ± 0.307 | 0.158 ± 0.817 | 0.129 ± 0.855 | 0.158 ± 0.778 | 0.263 ± 0.153 | 0.173 ± 0.824 |
| Corvus splendens | House crow | – | 0.303 ± 0.119 | 0.386 ± 0.302 | 0.241 ± 0.121 | 0.241±0.168 | – |
| Corvus macrorhynchos | Large–billed crow | 0.252 ± 0.101 | 0.833 ± 0.270 | – | 0.168 ± 0.459 | – | 0.252 ± 0.975 |
| Dicrurus macrocercus | Black drongo | 0.103 ± 0.391 | 0.166 ± 0.732 | 0.996 ± 0.266 | 0.151 ± 0.432 | 0.131 ± 0.326 | 0.136 ± 0.504 |
| Emberiza cia | Rock bunting | 0.108 ± 0.419 | 0.694 ± 0.210 | – | 0.127 ± 0.487 | – | – |
| Carpodacus erythrinus | Common rosefinch | 0.833 ± 0.259 | 0.617 ± 0.177 | 0.558 ± 0.203 | 0.574 ± 0.183 | 0.694 ± 0.212 | 0.254 ± 0.111 |
| Hirundo rustica | Common swallow | 0.108 ± 0.353 | 0.648 ± 0.175 | 0.228 ± 0.170 | 0.129 ± 0.425 | 0.196 ± 0.119 | – |
| Lanius tephronotus | Grey–backed shrike | 0.103 ± 0.376 | 0.694 ± 0.289 | 0.133 ± 0.480 | 0.123 ± 0.476 | – | – |
| Lanius vittatus | Bay–backed shrike | – | – | 0.771 ± 0.259 | – | – | – |
| Turdoides caudata | Common babbler | 0.641 ± 0.231 | 0.525 ± 0.173 | 0.717 ± 0.186 | 0.222 ± 0.737 | 0.887 ± 0.249 | 0.790 ± 0.253 |
| Trochalopteron lineatum | Streaked laughing thrush | 0.205 ± 0.525 | 0.729 ± 0.295 | 0.101 ± 0.340 | – | 0.109 ± 0.417 | 0.694 ± 0.249 |
| Terpsiphone paradisi | Indian paradise flycatcher | 0.896 ± 0.326 | 0.120 ± 0.365 | 0.176 ± 0.697 | 0.164 ± 0.558 | 0.144 ± 0.420 | 0.121 ± 0.445 |
| Motacilla alba | White wagtail | – | – | 0.241 ± 0.152 | – | 0.378 ± 0.253 | 0.317 ± 0.197 |
| Oriolus oriolus | Golden oriole | 0.548 ± 0.259 | – | 0.616 ± 0.220 | 0.450 ± 0.162 | 0.635 ± 0.214 | 0.612 ± 0.205 |
| Parus cinereus | Cinereous tit | 0.119 ± 0.387 | 0.694 ± 0.238 | 0.109 ± 0.289 | 0.926 ± 0.324 | 0.160 ± 0.471 | 0.757 ± 0.235 |
| Passer montanus | Eurasian tree sparrow | 0.264 ± 0.113 | 0.168 ± 0.367 | 0.520 ± 0.151 | 0.716 ± 0.268 | 0.264 ± 0.180 | 0.100 ± 0.310 |
| Passer domesticus | House sparrow | 0.138 ± 0.404 | 0.617 ± 0.196 | 0.119 ± 0.308 | 0.222 ± 0.109 | 0.961 ± 0.307 | 0.241 ± 0.126 |
| Phylloscopus collybita | Common chiffchaff | 0.126 ± 0.430 | 0.757 ± 0.244 | 0.144 ± 0.582 | – | 0.120 ± 0.406 | 0.108 ± 0.379 |
| Phylloscopus chloronotus | Lemon–rumped warbler | 0.104 ± 0.319 | – | 0.114 ± 0.480 | – | – | – |
| Phylloscopus trochiloides | Greenish warbler | – | – | – | – | 0.126 ± 0.467 | – |
| Pycnonotus cafer | Red–vented bulbul | 0.747 ± 0.253 | 0.177 ± 0.348 | 0.756 ± 0.242 | 0.124 ± 0.391 | 0.129 ± 0.459 | 0.669 ± 0.200 |
| Pycnonotus leucotis | White–eared bulbul | 0.173 ± 0.636 | – | – | – | 0.195 ± 0.405 | – |
| Pycnonotus leucogenys | Himalayan bulbul | – | 0.617 ± 0.202 | – | – | 0.120 ± 0.391 | 0.252 ± 0.840 |
| Acridotheres tristis | Common myna | 0.106 ± 0.246 | 0.733 ± 0.203 | 0.105 ± 0.308 | 0.101 ± 0.382 | 0.142 ± 0.514 | 0.868 ± 0.284 |
| Acridotheres ginginianus | Bank myna | – | – | – | – | – | – |
| Sturnus pagodarum | Brahminy starling | – | 0.119 ± 0.412 | 0.264 ± 0.135 | – | – | – |
| Sturnus vulgaris | Common starling | 0.666 ± 0.219 | 0.823 ± 0.283 | 0.666 ± 0.236 | 0.100 ± 0.295 | – | 0.666 ± 0.231 |
| Turdus atrogularis | Black–throated thrush | 0.966 ± 0.329 | 0.104 ± 0.319 | – | 0.555 ± 0.189 | 0.115 ± 0.400 | 0.732 ± 0.281 |
| Habitat | Shannon–Wiener Index (H’) | Margalef Index (R1) | Pielou J Index (E) |
|---|---|---|---|
| Dob Ghar | 3.580 | 7.372 | 0.940 |
| Palamar | 3.545 | 7.379 | 0.926 |
| Kamal Khan | 3.581 | 7.892 | 0.915 |
| Shahabad | 3.558 | 8.007 | 0.905 |
| Seya Sar | 3.524 | 7.566 | 0.915 |
| Kityari | 3.375 | 7.515 | 0.867 |
| Overall | 3.626 | 6.528 | 0.913 |
| Standard Error | 0.021 | 0.053 | 0.005 |
| Guild | Shahabad | Seya Sar | Palamar | Kamal Khan | Dob Ghar | Kityari |
|---|---|---|---|---|---|---|
| Carnivore | 0.313% | 0.278% | 0.347% | 0.625% | 0.313% | 0.278% |
| Insectivore | 5.488% | 5.036% | 5.175% | 6.391% | 5.141% | 7.398% |
| Carnivore/Piscivore/Insectivore | 0.069% | 0.069% | 0.035% | 0.069% | 0 | 0.069% |
| Granivore | 1.007% | 1.320% | 1.077% | 0.799% | 0.695% | 0.764% |
| Frugivore | 0.104% | 0.035% | 0.035% | 0 | 0 | 0.139% |
| Omnivore | 3.890% | 3.196% | 2.223% | 2.918% | 1.667% | 5.592% |
| Frugivore/Insectivore | 3.717% | 2.952% | 3.612% | 3.856% | 3.578% | 3.057% |
| Granivore/Insectivore | 3.300% | 2.292% | 2.952% | 2.605% | 2.188% | 3.334% |
| Sub-Total | 515 | 437 | 445 | 497 | 391 | 594 |
| Grand Total | 2879 |
Publisher’s Note: MDPI stays neutral with regard to jurisdictional claims in published maps and institutional affiliations. |
© 2021 by the authors. Licensee MDPI, Basel, Switzerland. This article is an open access article distributed under the terms and conditions of the Creative Commons Attribution (CC BY) license (https://creativecommons.org/licenses/by/4.0/).
Share and Cite
Rajpar, M.N.; Khan, S.A.; Ditta, A.; Ali, H.M.; Ullah, S.; Ibrahim, M.; Rajpar, A.H.; Zakaria, M.; Salem, M.Z.M. Subtropical Broad-Leaved Urban Forests as the Foremost Dynamic and Complex Habitats for a Wide Range of Bird Species. Sustainability 2021, 13, 13021. https://doi.org/10.3390/su132313021
Rajpar MN, Khan SA, Ditta A, Ali HM, Ullah S, Ibrahim M, Rajpar AH, Zakaria M, Salem MZM. Subtropical Broad-Leaved Urban Forests as the Foremost Dynamic and Complex Habitats for a Wide Range of Bird Species. Sustainability. 2021; 13(23):13021. https://doi.org/10.3390/su132313021
Chicago/Turabian StyleRajpar, Muhammad Nawaz, Shahab Ali Khan, Allah Ditta, Hayssam M. Ali, Sami Ullah, Muhammad Ibrahim, Altaf Hussain Rajpar, Mohamed Zakaria, and Mohamed Z. M. Salem. 2021. "Subtropical Broad-Leaved Urban Forests as the Foremost Dynamic and Complex Habitats for a Wide Range of Bird Species" Sustainability 13, no. 23: 13021. https://doi.org/10.3390/su132313021