1. Introduction
Today, the video game industry is the largest entertainment industry worldwide. According to a survey released by newzoo.com (accessed on 8 October 2020) [
1], the global games market was estimated to generate a revenue of
$152.1 billion in 2019, surpassing revenues produced by the film and music industries. The medium of the video game, which was once a minor media art, has gradually become mainstream with the rising prevalence of game engines and game editing software. Video games are considered a legitimate art form in 21st century research [
2,
3]. The artistic genres in modern games can be divided into realism and stylization. Realism refers to the use of realistic visuals striving to mimic the real world, in which scenes and characters are lifelike. Stylization [
4] emphasizes the use of nonrealistic artistic images to distinguish the world and characters in a game from those in real life. Because of changes in gamer preferences and technical development, realistic and stylized graphics have diversified, whereas the differences between these two types of techniques have become increasingly subtle. Gamers can nonetheless distinguish a game with realistic graphics from the real world. To generate visual effects that suit the theme of a game, game designers tend to make the lights, colors, and atmospheres in video games darker, more vivid, or more dramatic than those of the real world. This provides the desired ambience for gamers or conveys a message from game designers, creating the so-called “game feel”. The aforementioned discussion indicates that the differences between realistic and stylized games have blurred.
The term “next generation” originated from the competition between video game consoles in the 1990s [
5], and the term “generation” represents the concept of periodization in video games [
6]. According to the historical development of video games [
7], video game consoles have entered the ninth generation, whereas PC games have adopted concurrent or advanced technologies. In the video game industry, visual art design achieved using the most advanced techniques is known as next-generation art (NGA). NGA can be considered the highest benchmark for current game art and scenery design. Following the development of various video game platforms and hardware, video gameplay has diversified, and gamers have raised their standards for visual presentation. NGA enables games to represent a highly realistic world that satisfies gamers’ demands. Among the techniques for creating lifelike objects in game scenes, physically based rendering (PBR) [
8,
9] is a mainstream approach currently used for three-dimensional (3D) animation software and game engines. In the NGA course designed in this study, the professional software Substance Painter was adopted to instruct students how to perform PBR texture mapping. Originally developed by a French company Allegorithmic, which was later acquired by Adobe, Substance Painter is a tool for material and texture mapping and has become a standard PBR development tool in the game and animation industries. The flow of the students’ game art course is shown in
Table 1, and this course is the final integrated course.
The NGA course is designed to instruct students to use Substance Painter for per-forming PBR mapping. It is an advanced course that focuses on comprehensive applications and requires the integration of a wide range of software and production techniques, and is a hybrid application of multiple technologies. Learning to apply NGA production methods is a must-have skill for digital media students who intend to move towards the game industry. This course is designed for fourth-year university students who should already be familiar with 3D animation software, digital sculpting, and game engines and are in the final stages of producing their final project. The purpose of this study is to enhance students’ interest in learning specific software and to strengthen their motivation to use it consistently through a working example combined with a blended learning curriculum design.
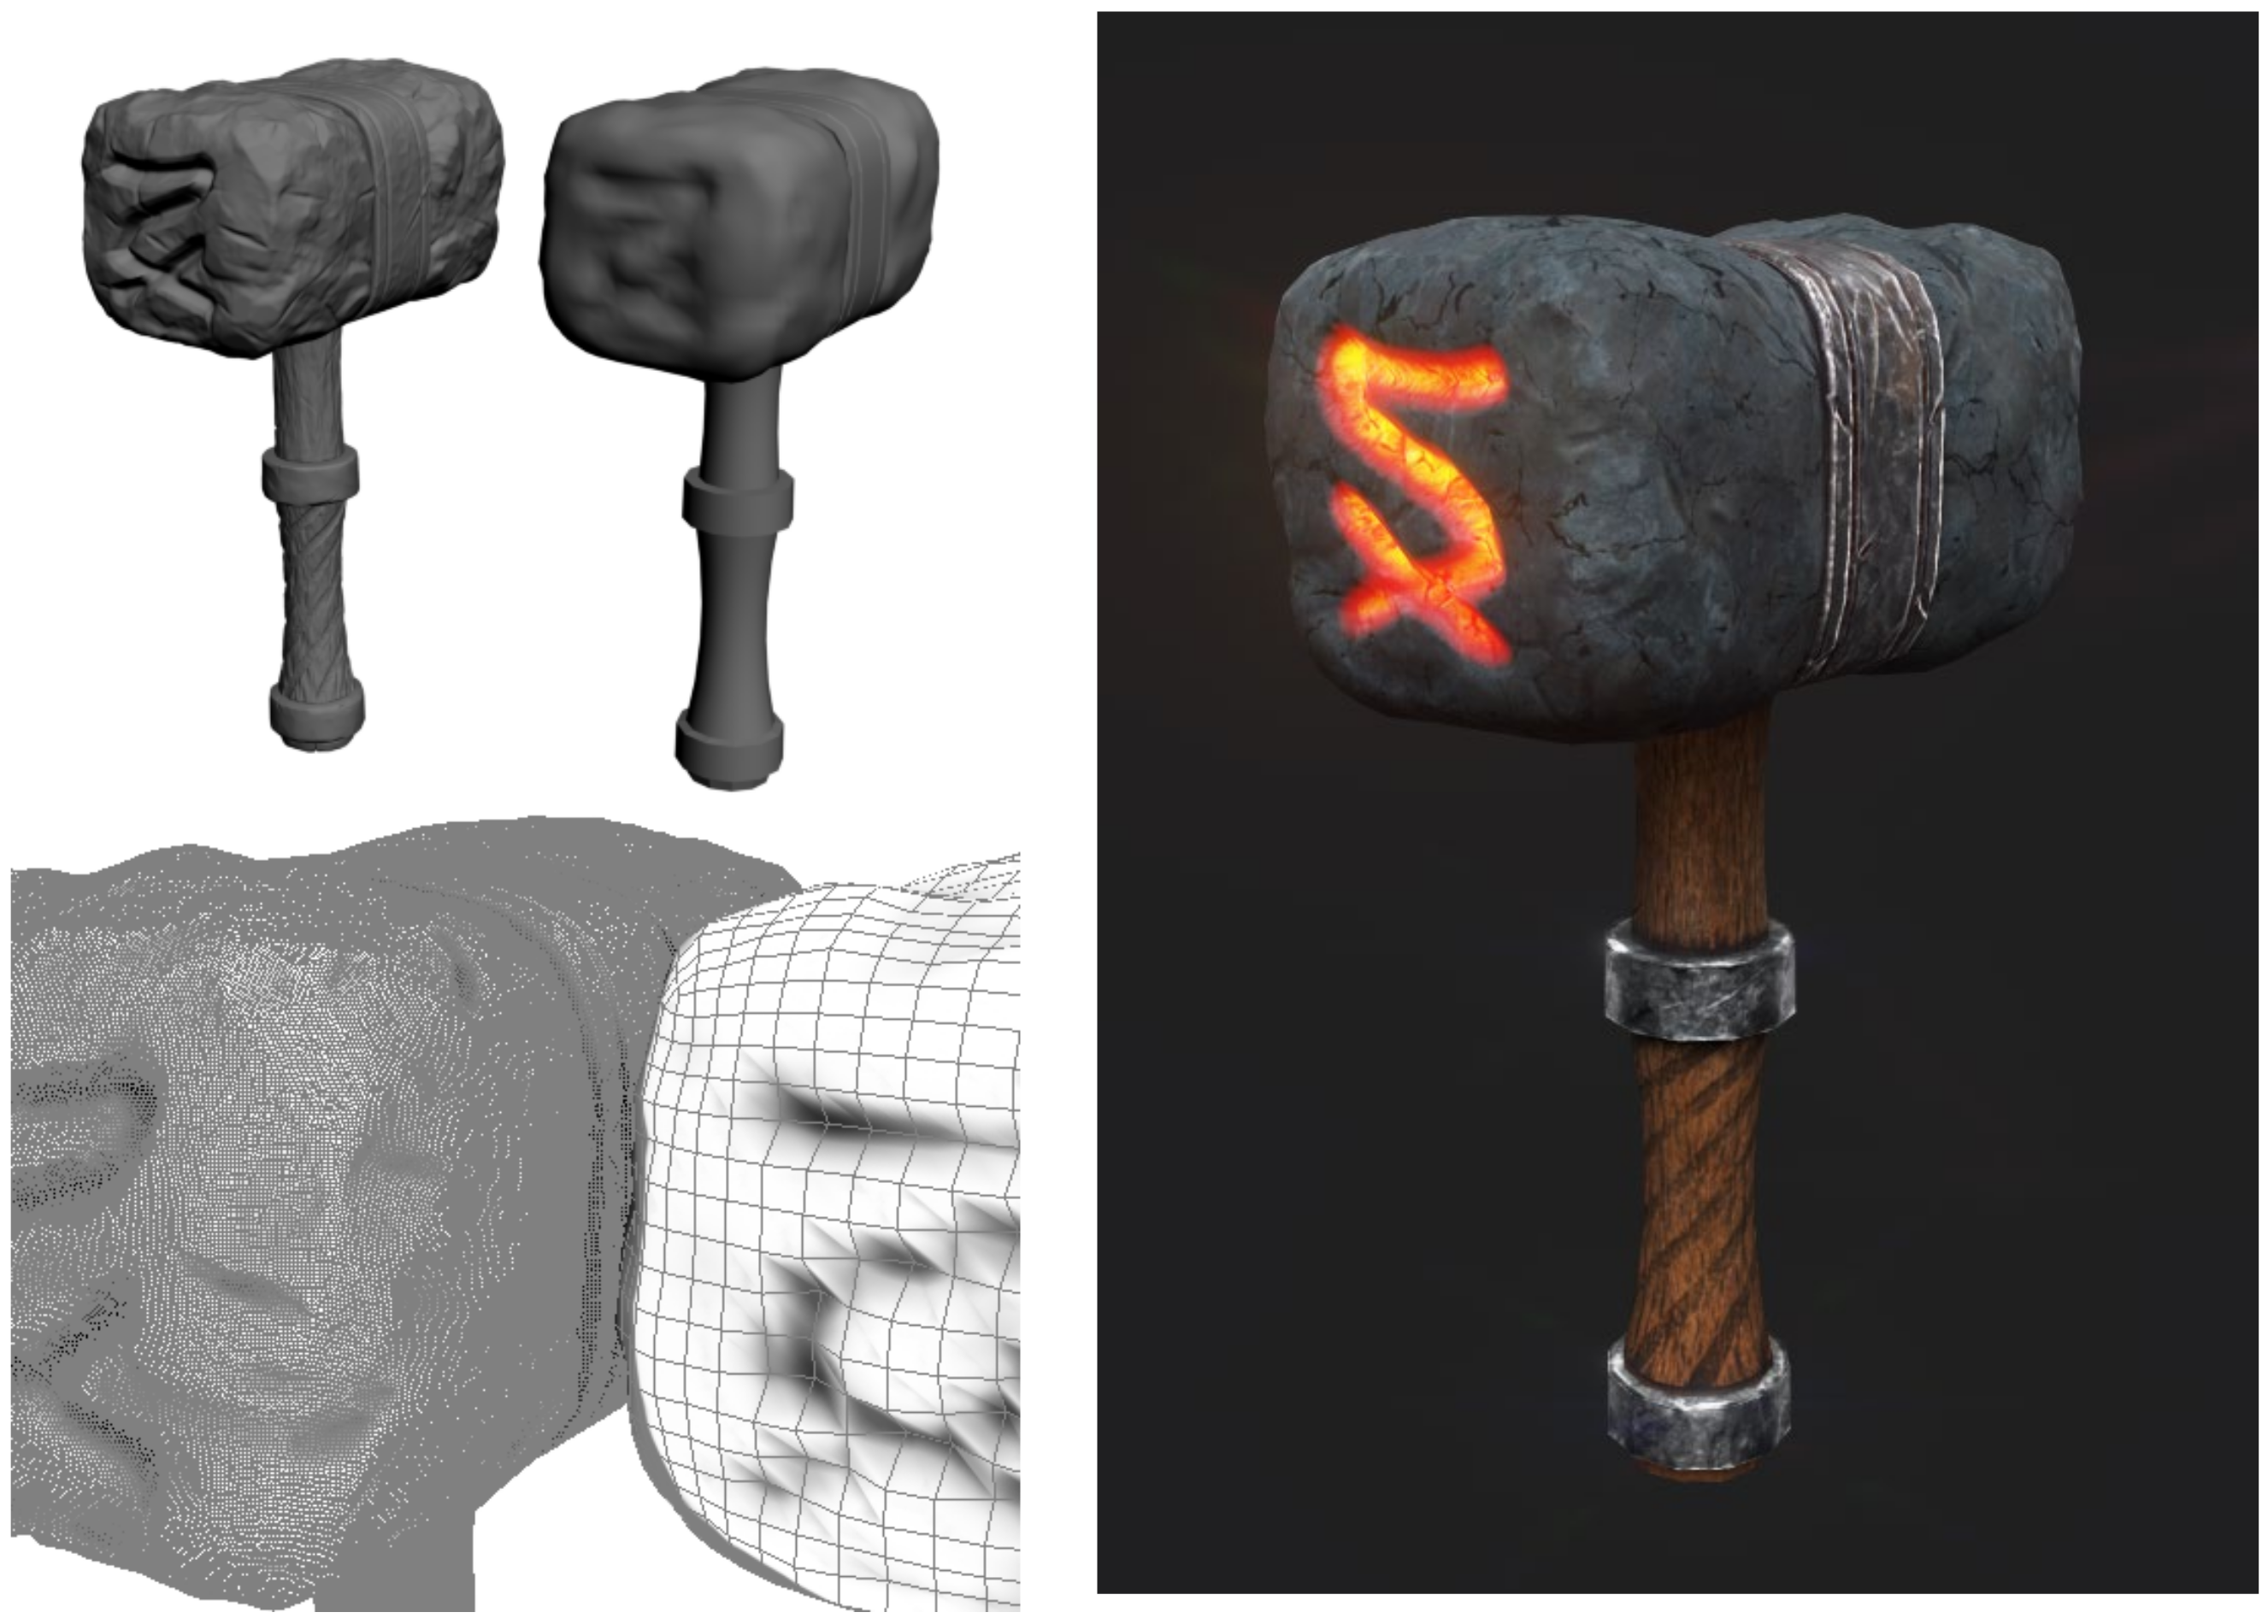
In order to bridge the gap between students’ 3D production abilities, the course example files and assignments were provided by the instructor to avoid students who are not capable of completing the pre-modeling and UV disassembly assignments due to the small number of courses in the 3D professional program. The worked examples used are shown in
Figure 1, and there are three sets of examples used in the course according to the progress. All worked examples include low poly and high poly models, and complete UV processing. For students with strong 3D skills, it is still recommended to create the required 3D objects by themselves.
2. Background and Literature Review
2.1. Physically Based Render (PBR)
Compared with the graphics on mobile devices, those in PCs and video game consoles have fewer limitations thanks to continuous information technology and computational capacity improvements. However, game developers must nonetheless consider technological limitations because video games now tend to feature cross-platform support. Therefore, game artists must be familiar with how graphics may affect gameplay. Compared with conventional techniques such as Lambert and Phong shading, PBR has an additional feature, namely ray-tracing computation; this computational technique is an industry standard for filming, animation production, and video game development. Through the use of specific texture, PBR facilitates the reconstruction of materials and light reflection effects in the real world, improves 3D display quality, and constitutes a mainstream approach in NGA. PBR consists of four key principles, namely the specular and diffuse reflection, microfacet theory, F0 reflectance, and energy conservation [
10]. Alternatively, the physically based shader (PBS) in game engines is used to describe shaders [
11].
Commonly used two-dimensional (2D) graphic design software (e.g., Adobe Photoshop) is unsuitable for the creation of PBR texture in 3D animations or games; PBR texture cannot be adjusted to achieve What You See is What You Get. To solve this problem, Substance Painter, a tool that renders PBR workflows simply and intuitively, can be used. Substance Painter is a type of 3D graphic software specializing in PBR mapping for 3D models; it exports texture to a wide range of 3D file formats and game engines and processes 2D texture in a 3D environment. According to the physical materials in animation software and PBS in game engines, game artists produce maps that follow PBR rules, of which the basic components are summarized in
Table 2, and they increase or decrease those textures according to the desired visual effects. The PBR process can be divided into two types of workflows on the basis of the physical properties of substances, namely, the conductor and nonconductor workflows. These two workflows can simulate physical optics effects; the suitable workflow is selected according to the game engine and shader adopted.
The NGA course was established according to students’ PBR learning demand. Although specific software can process PBR texture, game artists must devote a lot of effort to studying and practicing PBR mapping before they can successfully control synchronized render pipelines of complex images and produce realistic materials [
12]. This NGA course required prior knowledge of and ability to produce highly precise models by using 3D animation software or digital sculpting, using topology to construct low-poly models that fulfil the requirements of the adopted game engine. Subsequently, UV maps were processed before PBR textures were processed on Substance Painter, thus completing a complete NGA production process (
Figure 2). Because Substance Painter provides various templates for specific materials, game artists can produce precise effects without presetting their own parameters.
The two major game engines (i.e., Unity and Unreal) [
13] both consider PBR as a basic rendering approach [
14,
15]. In addition, PBR has been used in Disney 3D animated movies [
16] as well as in architectural, automotive, and product visualization industries that require simulated display. Specifically, PBR-based image rendering is applied to the verification of automated driving functions in the automotive industry [
17,
18], realistic architectural and product rendering, simulation of simple and advanced fiber-optic communication [
19], and teeth rendering in dentistry research [
20].
2.2. Worked Examples and Blended Learning
The NGA course content requires 3D software as the pre-production, paste through Substance Painter, and output to the game engine integration process. Considering the fact that students with different numbers of credits in previous elective courses have different abilities in 3D production, and the graduation project may not be in 3D form, the course design uses worked examples and hybrid teaching as follows.
- 1.
Worked examples: Worked examples are teaching tools that learners can use to study the steps needed to solve problems. The combination of worked examples and completed examples facilitates the acquisition of problem-solving skills more than worked examples alone [
21]. Research indicates that exemplar-based learning can be effectively applied to a variety of tasks, settings, and learners, and that exemplar-based learning is a widely applicable approach [
22].
- 2.
Blended Learning: Unlike traditional face-to-face instruction in the classroom and online learning, blended learning encompasses all the benefits of digital learning, including low build costs, increased learner efficiency and ease of use independent of time and space, and the basic one-to-one understanding and motivation presented by face-to-face instruction [
23]. Blended learning refers to “the thoughtful integration of face-to-face learning experiences in the classroom with online learning experiences” [
24]. Research indicates that well-designed blended learning can enhance the campus experience and expand thinking and learning through the use of web-based messaging technology [
25]. Students’ responses favored the use of multimedia, indicating that blended learning is beneficial to supplement instruction [
24]. Previous literature has shown that the use of online videos as a supplement to physical courses can indeed enhance students’ motivation and learning outcomes [
26,
27].
The blended learning content of this course consists of online learning videos. The classroom videos and example files are shared using Google Classroom, and students can reinforce or practice them on their own outside of class. At the same time, additional step-by-step integration videos are provided so that learners can articulate to course assignments, thereby enhancing learning for students who lack basic training.
2.3. The Technology Acceptance Model
For many years, educators have sought to include new technologies in curricula and adopted various theoretical frameworks to assess factors influencing user acceptance and technology usage. These frameworks include Rogers’ diffusion of innovation theory [
28], theory of reasoned action [
29], and the TAM [
30], with the TAM being the most widely adopted model.
The TAM was proposed by Davis (1986) on the basis of the theory of reasoned action [
31] and the theory of planned behavior [
32]. This theoretical model explains and predicts information technology usage behavior, and it has been used to determine decision-making factors or processes among users in relation to their acceptance or usage of a new technology. The TAM comprises two deciding elements: perceived usefulness (PU) and perceived ease-of-use (PEU) [
33]. PU is the degree to which a user believes that certain information technology would enhance their performance. PEU refers to the degree to which someone believes that using this technology would be effortless [
34]. The TAM framework is illustrated in
Figure 3.
A literature review indicated that researchers from different disciplines have revised and extended the original TAM [
34]; TAM research is popular in the education field, and this model serves as the most common basic theory for e-learning studies [
35,
36,
37].
2.4. Practical Application of TAM
TAM has evolved to become the key model in understanding the predictors of human behavior toward potential acceptance or rejection of the technology [
38]. For example, the TAM has been adopted to perform a retrospective study of mobile services [
39], determine the acceptance of virtual reality use in classrooms [
40], compare the acceptance levels of virtual reality use with that of face-to-face teaching in class [
41], explore patients’ acceptance of medical services and health information technology [
42], and appraise the acceptance of 3D printing in medical treatment [
43]. For teacher training, a study utilized TAM for training on a video game platform to increase teachers’ engagement with and behavioral intention to use technology [
44]. Similarly, another study applied this model to confirm participants’ acceptance during the learning process [
45].
The TAM has several extended models (i.e., “TAM ++ research”); the advantages of these extended models have been confirmed by numerous studies, highlighting the wide applicability of TAM usage for various technologies and environments. For example, these TAM-extended models have been adopted to explore students’ intention to participate in computer courses [
46], understand student acceptance of online learning environments [
37], and measure users’ intention to continue enrolling in massive open online courses after being integrated with the task technology fit theory [
36]. Moreover, extended TAMs were established to confirm the effects of perceived usability and technology self-efficacy on technology acceptance levels among teachers [
47,
48] and teachers’ intention of using dynamic geometry software to teach geometrics in secondary schools [
49].
3. Method
Many researchers widely support the direct and indirect relationship between perceived ease of use, perceived usefulness, and behavioral intention; there is a direct relationship between ease of use and usage behavior, and usefulness has a significant impact on behavioral intention [
38,
50]. In order to understand the association between the learning context of the subjects and the learning effectiveness of the course, TAM was therefore used for the assessment. We considered the following:
- •
PU is the user’s perceived usefulness of NGA technology in providing production techniques;
- •
PEU represents the effort required to use NGA technology as perceived by the user;
- •
ATT is defined as the attitude toward using NGA technology due to its ease of use and usefulness;
- •
BI indicates the user’s willingness to continue using it in the future.
Therefore, students’ graduation project type, professional course credits, software application, blended learning, and worked examples should affect perceived usefulness (PU) and perceived ease of use (PEU), which in turn affects users’ attitudes toward further use (ATT) and intentions for further use (BI) after graduation.
A survey was conducted to evaluate the application of TAM in the NGA curriculum for fourth-year digital media students at two campuses in Taipei and Hsinchu. The total number of students in the two campuses was 154, with 36 students in class A in Taipei, 39 students in class B in Taipei, 35 students in class A in Hsinchu, and 44 students in class B in Hsinchu. A total of 104 valid questionnaires (
Appendix A) were returned, and the total response rate was 68%, with a higher response rate of 72% in Taipei than 63% in Hsinchu.
During the last week of the semester, students from four classes in two school districts were asked to freely complete an anonymous online questionnaire. The questionnaire was based on the TAM developed by Davis (1989) [
33]; the original questionnaire was modified to describe the context in which the NGA course was used, and course-related questions were added. The questionnaire was designed using a five-point Likert scale indicating agreement or disagreement with each statement with the endpoints of “strongly disagree” and “strongly agree”. The main research variables included “Perceived Usefulness”, “Perceived ease of Use”, “Attitude toward”, and “Behavioral Intention to Use”. The data collected included school district, class level, topic type, number of credits taken in professional courses, blended learning, worked examples, and knowledge of NGA. We expected that (1) the type of graduation project, (2) the number of credits in the professional program, (3) the application of NGA, (4) the blended-learning-based course model, and (5) the worked examples would influence the ATT and BI through PU and PEU (
Figure 4).
4. Results
4.1. Sample Structure Narrative Statistics
During the last week of the semester, a survey was conducted on the classes taking classes at both schools. Due to COVID-19 and the class being a graduating class, the attendance rate was affected. A total of 105 students out of 154 students responded to the questionnaire, of which 104 valid questionnaires were obtained; the basic information is shown in
Table 3.
Among the background information of the questionnaire responses, the gender ratio is just about 50/50. The Taipei and Hsinchu campuses each received 54 and 50 questionnaires, respectively, with little difference. Among the students’ graduation projects, 53 of them were produced in 3D and 51 in 2D. Although we have not investigated whether or not the NGA method was used, the percentage should be less than 10% based on the graduation project exhibition. In addition, 63.5% of the students thought that the operation and functions were complicated, 23.1% thought that the English software was a barrier to learning, and only 13.5% of the students said they were not interested for other reasons. In terms of students’ 3D ability, 30.8% of the students thought their 3D production ability was good, while 59.2% were average or poor, which was in line with the tendency of choosing the format of the topic. In the blended learning section, 88.5% thought that the course instructional videos were helpful for learning, which is consistent with previous studies [
51,
52], confirming the effectiveness of blended learning. The baseline analysis showed that most students understood the importance of the course, and were able to comprehend the content and complete the assignment requirements.
Seventy-four percent of the students reported that the NGA courses were scheduled too late to be applied to the topic production. A total of 67.3% of the students felt that they could generally understand the process of NGA through the course. However, 26.9% said they were able to integrate the various software needed for NGA, similar to the percentage of those who said they were good at 3D production (30.8%).
4.2. Reliability Analysis
Reliability analysis was performed to ensure internal validity and consistency of the items used for each variable. Reliability was assessed using Cronbach’s alpha. Statistical analysis was conducted using IBM SPSS version 26 software, and the reliability analysis of this study is shown in
Table 4. All structural reliability and alpha coefficients were higher than the benchmark of 0.6 proposed by Bagozzi and Yi (1988) and had good reliability [
53]. The Cronbach’s alpha for the overall scale was 0.930, indicating that the reliability of this scale was very good.
4.3. Analysis of Total Validity and Validity of Various Aspects
To determine the suitability of the questionnaire data for factor analysis, the KMO and Bartlett’s spherical check were used. According to Kaiser, KMO values of >0.8, >0.7, >0.6, and <0.5 indicate meritorious, middling, mediocre, and unacceptable results, respectively. Bartlett’s test was implemented to verify whether the collected data were multivariate normally distributed and suitable for factor analysis. The KMO coefficients of the overall scale, PU, and PEU exceeded 0.8 (
Table 5), suggesting excellent validity; the KMO value of ATT was higher than 0.7, indicating moderate validity, whereas the KMO value of BI was slightly higher than 0.6, with mediocre validity. The results of Bartlett’s test all reached the significance level (
p < 0.01), indicating that the sampled data were suitable for factor analyses.
4.4. Convergent Validity
SPSS Amos was run to perform confirmatory factor analysis (
Figure 5). The analysis was conducted on the basis of the assumption that the hypothesized factors and relevant items existed; subsequently, relationships between these factors and variables were determined, enabling researchers to verify whether the collected data fit the hypothesized model. Convergent validity was assessed according to the following standard: values of 0.9 < r, 0.7 < r < 0.9, 0.3 < r < 0.7, and r < 0.3 indicated high, higher than moderate, lower than moderate, and low results levels, respectively. Except for the PEU–B3 path (0.28), all factor–item correlations exceeded 0.653, most surpassed 0.7, and some even reached 0.9. Therefore, the overall convergent validity reached the lower-than-moderate level.
4.5. Independent Sample t-Test
Independent samples were examined to analyze the relationship between gender, different school districts, and graduation project types, and PU, PEU, ATT, and BI. It was found that gender and school district were not significantly related to the four dimensions of PU, PEU, ATT, and BI, nor were they significantly related to the Overall Course questions. However, graduation project type was found to be significant in PU, PEU, ATT, BI, and Overall Course questions. The results of the independent sample T-assay are shown in
Table 6.
Contrary to the reality, students with non-3D graduation projects were more willing to accept and use NGA than those who chose to use 3D for their graduation projects, even if they had no practical application at all. Since NGA is mainly about creating PBR maps for 3D creative content, it is assumed that the concept and operation of using Substance Painter to create PBR textures is similar to the image processing software commonly used for 2D painting, which is familiar to students who are good at 2D. The course provides 3D models and basic textures as worked examples, unifying the teaching content and operation steps, and reducing the learning barrier caused by the difference in the basic level of 3D. Students who are not skilled in 3D will feel more comfortable with the course.
4.6. Analysis of Variance (ANOVA)
In order to understand the relationship between students’ 3D ability and TAM, the number of 3D professional courses taken by students was divided into three levels: above 9 credits, 6 to 9 credits, and fewer than 6 credits, which were used to differentiate students’ 3D level. This factor was used to analyze the one-way variance with PU, PEU, ATT, and BI, and the Scheffe method was used to check the post hoc. The results of the analysis are shown in
Table 7, which shows the effects of different levels of 3D expertise on PU, PEU, ATT, and BI.
From
Table 6, it can be found that students with the least number of credits in 3D courses showed significance in PU, PEU, ATT, and understanding of NGA processes. This means that the course provides working example files and instructional videos, which only lower the learning barrier for students who are not good at 3D, making them feel good and easy to use, but not enhancing students’ intention to actually use the software. Students with moderate credit in the course became interested in NGA, demonstrated intent to use it, and were willing to review and use it on an ongoing basis. Surprisingly, they found it less difficult to integrate 3D software than students with higher credit levels.
5. Discussion
This study course uses the PBR coloring method and Substance Painter software, which is the main application tool for today’s digital game industry artists. Regardless of the demand for highly realistic or stylized graphics, the NGA method can create high-quality visual effects and modularize art resources to achieve a consistent working method, which can save a lot of resources and is extremely important for game production.
According to Davis (1989) [
33], perceived usefulness is the main determinant of an individual’s intention to use computer-related technology, and perceived ease of use directly or indirectly influences people’s intention to use technology through perceived usefulness. The analyses examined by the independent sample in this study showed that gender was not correlated with any of the influences. Although there were differences between school districts in terms of high and low enrollment scores, i.e., students had different initial levels, this did not affect students’ acceptance of NGA. The type of graduation project is a summary of learning outcomes, and students decide on the form based on their expertise, so the type of graduation project is significantly correlated in both the TAM questionnaire and the Overall Class items. In particular, students whose graduation project type was not 3D showed a higher willingness to accept and use it, suggesting that blended learning and worked examples may be possible reasons for lowering barriers to learning.
The results of the analysis of variance, comparing the groups with different numbers of credits in 3D courses, showed that students with the less number of credits in 3D courses were more influenced by blended learning and worked examples, and showed significant results in PU, PEU, and ATT, indicating that they found NGA useful, easy to use, and were willing to use it, but this did not increase their actual intention to use it. This is all consistent with the fact that worked examples are more effective for novices than solving equivalent problems in terms of knowledge transfer performance [
54]. Students with medium course credits were interested in NGA and had the intention to continue using it. In particular, students with medium grades found it less difficult to integrate 3D software than students with high grades. Since the technical difficulty of integration is higher, the students with high credits tended to create their own materials from scratch and felt that this was more difficult. Students with moderate credits, however, used sample files to create their assignments and did not encounter the difficulty of creating their own work from scratch, which may have created a bias in their learning perception, i.e., they had incorrect perceptions due to technical inexperience [
55].
In this study, instructional support consisting of real-world 3D example files and instructional videos were provided to fourth-grade students during the learning process to study whether it improved their PU, PEU, and ATT for NGA techniques, as measured by questionnaires. We found that students with low 3D ability had a working example effect. When students who were not proficient in 3D learned through practical examples during the learning phase, they showed positive responses in PU, PEU, ATT, and understanding of NGA processes. This is consistent with the findings of Nievelstein, F, et al. [
56]. We also found that the practical examples were more effective and accessible in the learning process, i.e., less time and effort were invested in the learning process to achieve better results, resulting in significant improvements in student motivation.
6. Conclusions
With the rapid impact of the digital gaming industry, school content needs to be adapted to new technology applications, introducing software applications that meet industry needs and production trends, and educators need to understand students’ learning status and curriculum responses to new technology areas in order to adjust and improve students’ motivation and willingness to learn.
TAM provides a well-defined framework for assessing students’ acceptance of technology-based curricula. Students’ 3D ability is reflected in the number of credits and type of graduation project in 3D courses, and this study has shown that by providing worked examples, combined with blended learning instructional videos, low 3D ability students’ perceived ease of use and perceived usefulness of NGA technology can be improved, thereby increasing motivation to use, but not significantly affecting intent to use. Therefore, teachers must recognize the differences in learners and incorporate such differences into the design of teaching and curriculum to effectively address the different needs and abilities of learners [
57]. In the future, differentiated worked examples may be considered for teaching technical courses.
Finally, the students’ feedback about the late scheduling of courses in the curriculum module has been brought to the attention of the Departmental Curriculum Committee and has been adjusted to the second semester of the third year in the new year to meet the schedule and needs of the students’ final projects. At the same time, the original two-credit course has been increased to three credit hours to allow for sufficient teaching hours. The new program will only provide practice worked examples at the beginning of the program, and homework assignments will need to be done on their own to reflect the learning outcomes.
7. Research Limitations
This study had limitations in relation to profession and instructors. First, only students from a digital media department participated in the study. A more coherent course module was required because complete NGA involved extremely professional production skills, from modeling to texturing, including digital sculpting, retopology, and the use of game shaders or animation renderers. This study focused only on the later stages of software integration, i.e., the Substance Painter for course applications. To expand the research scope, researchers should meticulously apply research results to verify technology acceptance among students majoring in other fields.
The instructor-related limitation is that, to design a desirable course, instructors require abundant knowledge and excellent software operation skills, diverse teaching skills, and the ability to adjust course content to new technologies [
58,
59]. In particular, development techniques for video games evolve continually, and instructors in this discipline must comprehensively understand the game production process in the front-end and back-end. This places a potentially heavy burden on instructors, who must maintain learning motivation among students and must frequently adjust course content according to changes in the industry and relevant technologies as well as acquiring excellent video game development skills.
Author Contributions
H.S., methods, investigation, analysis, verification, writing and editing. C.-C.C., design and production of classroom examples and evaluation of student work. All authors have read and agreed to the published version of the manuscript.
Funding
The study did not receive external funding.
Institutional Review Board Statement
Ethical review and approval were waived for this study, due to This study is not a project and is a study of educational assessment or testing, teaching techniques, or effectiveness evaluation in a general teaching environment.
Informed Consent Statement
Informed consent was obtained from all individual participants included in the study.
Data Availability Statement
The data presented in this study are available on request from the corresponding author. The data are not publicly available due to survey of learning experience in general education courses.
Acknowledgments
Thanks to all the students who participated in this research and the Course Committee of the Department of Digital Multimedia of the China University of Technology.
Conflicts of Interest
The authors declare no conflict of interest.
Appendix A
This is an anonymous, free-choice end-of-semester survey of feelings about learning that is not related to grades. The questions are based on TAM, with the addition of blended instructional feelings and collection of learning contexts for comparison.
Table A1.
Next Generation Art Techniques - Post-Course Questionnaire (Please fill out the questionnaire with your help as a reference for course improvement and adjustment.).
Table A1.
Next Generation Art Techniques - Post-Course Questionnaire (Please fill out the questionnaire with your help as a reference for course improvement and adjustment.).
| Basic Background |
|---|
Gender Class Graduation project type Total number of credits of 3D courses taken in school Preferred art style My opinion on learning 3D Compared to my classmates, I think my 3D ability level is Factors that I think affect my learning of 3D
|
| TAM | Perceived Ease of Use (PEU) |
- A1
I found Substance Painter very easy to use. - A2
Learning to use Substance Painter was easy for me. - A3
My interaction with Substance Painter is clear and easy to understand. - A4
It is easy for me to find features in Substance Painter.
|
| Perceived Usefulness (PU) |
- B1
Using Substance Painter can improve my 3D mapping efficiency. - B2
Improve my 3D art performance with Substance Painter. - B3
Use Substance Painter to increase my efficiency in my theme production. - B4
I find Substance Painter very useful.
|
| Attitude Toward Using (ATT) |
- C1
I don’t like the need to use Substance Painter. (R) - C2
I still like using Substance Painter. - C3
I think it’s a good idea to use Substance Painter for mapping. - C4
Using Substance Painter is a poor constraint. (R)
|
| Behavioral Intention to Use (BI) |
- D1
I will use Substance Painter in my projects. - D2
I will use Substance Painter frequently. - D3
I plan to review Substance Painter tutorial resources frequently.
|
| Overall Course | Blended Learning |
- O1
Without videos, it would be harder to learn. - O2
The videos are very helpful to me.
|
| Course-related |
- O3
I think this course is scheduled too late. - O4
It was not difficult for me to integrate all the 3D software. - O5
I can understand the process of next-generation art.
|
References
- Tom Wijman, The World’s 2.7 Billion Gamers Will Spend $159.3 Billion on Games in 2020; The Market Will Surpass $200 Billion by 2023. Available online: https://newzoo.com/insights/articles/newzoo-games-market-numbers-revenues-and-audience-2020-2023/ (accessed on 8 October 2020).
- Jenkins, H. Games, the new lively art. In Handbook of Computer Game Studies; The MIT Press: Cambridge, MA, USA, 2005; pp. 175–189. [Google Scholar]
- Jenkins, H. Convergence Culture, Revisited; University of Southern California: Los Angeles, CA, USA, 2018; Volume 2, pp. 10–19. [Google Scholar]
- 80.lv. Available online: https://80.lv/articles/realistic-vs-stylized-technique-overview/ (accessed on 8 August 2020).
- Daidj, N.; Thierry, I. Entering the economic models of game console manufacturers. Commun. Strateg. 2009, 73, 23. [Google Scholar]
- Garda, M.B.; Grabarczyk, P.; Sivula, A.; Suominen, J. Next gen? A Critical Examination of Historical Periodization in Video Games. 2018. Available online: http://www.digra.org/wp-content/uploads/digital-library/DIGRA_2018_paper_274.pdf (accessed on 25 July 2020).
- Amos, E. The Game Console: A Photographic History from Atari to Xbox; No Starch Press: San Francisco, CA, USA, 2018. [Google Scholar]
- Pharr, M.; Jakob, W.; Humphreys, G. Physically Based Rendering: From Theory to Implementation; Morgan Kaufmann: Burlington, MA, USA, 2016. [Google Scholar]
- Wes, M. The PBR Guide: A Handbook for Physically Based Rendering, 3rd ed.; Allegorithmic: Clermont-Ferrand, France, 2018. [Google Scholar]
- Allegorithmic. The Pbr Guide by Allegorithmic-Part 1. Available online: https://academy.substance3d.com/courses/the-pbr-guide-part-1 (accessed on 25 July 2020).
- Stephen, M.; Stephen, H.; Naty, H.; Yoshiharu, G.; Brian, S.; Brent, B.; Adam, M. Practical physically-based shading in film and game production. In Proceedings of the SIGGRAPH’12: Special Interest Group on Computer Graphics and Interactive Techniques Conference, Los Angeles, CA, USA, 5–9 August 2012; pp. 1–7. [Google Scholar]
- Pai, H.-Y. An imitation of realistic subsurface scattering texture for physically based rendering workflow. In Proceedings of the 2019 IEEE 2nd International Conference on Knowledge Innovation and Invention (ICKII), Seoul, Korea, 13–16 July 2019. [Google Scholar]
- Šmíd, A. Comparison of Unity and Unreal Engine; Czech Technical University: Prague, Czechia, 2017. [Google Scholar]
- Karis, B.; Games, E. Real shading in unreal engine 4. Proc. Phys. Based Shading Theory Pract. 2013, 4, 1–59. [Google Scholar]
- Pranckevičius, A.; Dude, R. Physically based shading in Unity. In Proceedings of the Game Developer’s Conference, San Francisco, CA, USA, 17 March 2014. [Google Scholar]
- Burley, B.; Disney, W. Animation Studios. Physically-based shading at disney. ACM Siggraph 2012, 2012, 1–7. [Google Scholar]
- Günther, J.; Grau, O.; Sharma, I.; Brücher, B. Advantages of Physically Based Rendering for Autonomous Driving Validation. In Proceedings of the ACM CSCS 2019, Kaiserslautern, Germany, 8 October 2019. [Google Scholar]
- Tsirikoglou, A.; Kronander, J.; Wrenninge, M.; Unger, J. Procedural modeling and physically based rendering for synthetic data generation in automotive applications. arXiv 2017, arXiv:1710.06270. [Google Scholar]
- Křivánek, J.; Chevallier, C.; Koylazov, V.; Karlik, O.; Jensen, H.; Ludwig, T. Realistic rendering in architecture and product visualization. In Proceedings of the ACM SIGGRAPH 2018 Courses, Vancouver, BC, Canada, 12–16 August 2018; pp. 1–5. [Google Scholar]
- Reischl, M.; Derzapf, E.; Guthe, M. Physically Based Real-Time Rendering of Teeth and Partial Restorations. Comput. Graph. Forum. 2020, 39, 106–116. [Google Scholar] [CrossRef]
- Dyer, J.-O.; Hudon, A.; Montpetit-Tourangeau, K.; Charlin, B.; Mamede, S.; Van Gog, T. Example-based learning: Comparing the effects of additionally providing three different integrative learning activities on physiotherapy intervention knowledge. BMC Med. Educ. 2015, 15, 37. [Google Scholar] [CrossRef] [Green Version]
- Van Gog, T.; Rummel, N. Example-based learning: Integrating cognitive and social-cognitive research perspectives. Educ. Psychol. Rev. 2010, 22, 155–174. [Google Scholar] [CrossRef] [Green Version]
- Brown, R. Blended learning: Rich experiences from a rich picture. Train. Dev. Aust. 2003, 30, 14–17. [Google Scholar]
- Garrison, D.; Kanuka, H. Blended learning: Uncovering its transformative potential in higher education. Internet High. Educ. 2004, 7, 95–105. [Google Scholar] [CrossRef]
- Ngan, O.M.Y.; Tang, T.L.H.; Chan, A.K.Y.; Chen, D.M.; Tang, M.K. Blended learning in anatomy teaching for non-medical students: An innovative approach to the health professions education. Health Prof. Educ. 2018, 4, 149–158. [Google Scholar] [CrossRef]
- Rafiola, R.; Setyosari, P.; Radjah, C.L.; Ramli, M. The Effect of Learning Motivation, Self-Efficacy, and Blended Learning on Students’ Achievement in The Industrial Revolution 4.0. Int. J. Emerg. Technol. Learn. (IJET) 2020, 15, 71–82. [Google Scholar] [CrossRef]
- Islam, S.; Baharun, H.; Muali, C.; Ghufron, M.I.; Bali, M.E.; Wijaya, M.; Marzuki, I. To boost students’ motivation and achievement through blended learning. J. Phys. Conf. Ser. 2018, 1114, 012046. [Google Scholar] [CrossRef]
- Sahin, I. Detailed review of Rogers’ diffusion of innovations theory and educational technology-related studies based on Rogers’ theory. Turk. Online J. Educ. Technol. 2006, 5, 14–23. [Google Scholar]
- Fishbein, M.; Ajzen, I. Belief, attitude, intention, and behavior: An introduction to theory and research. Philos. Rhetor. 1977, 10, 130–132. [Google Scholar]
- Davis, F.D. A technology acceptance model for empirically testing new end-user information systems: Theory and results. In Management; Massachusetts Institute of Technology: Massachusetts, CB, USA, 1985. [Google Scholar]
- Harsanyi, J.C. Morality and the theory of rational behavior. Soc. Res. 1977, 44, 623–656. [Google Scholar]
- Ajzen, I. From intentions to actions: A theory of planned behavior. In Action Control; Springer: Berlin, Germany, 1985; pp. 11–39. [Google Scholar]
- Davis, F.D. Perceived usefulness, perceived ease of use, and user acceptance of information technology. MIS Q. 1989, 13, 319–340. [Google Scholar] [CrossRef] [Green Version]
- Granić, A.; Marangunić, N. Technology acceptance model in educational context: A systematic literature review. Br. J. Educ. Technol. 2019, 50, 2572–2593. [Google Scholar] [CrossRef]
- Hussein, Z. Leading to intention: The role of attitude in relation to technology acceptance model in e-learning. Procedia Comput. Sci. 2017, 105, 159–164. [Google Scholar] [CrossRef]
- Wu, B.; Chen, X. Continuance intention to use MOOCs: Integrating the technology acceptance model (TAM) and task technology fit (TTF) model. Comput. Hum. Behav. 2017, 67, 221–232. [Google Scholar] [CrossRef]
- Ibrahim, R.; Leng, N.S.; Yusoff, R.C.M.; Samy, G.N.; Masrom, S.; Rizman, Z.I. E-learning acceptance based on technology acceptance model (TAM). J. Fundam. Appl. Sci. 2018, 9, 871. [Google Scholar] [CrossRef] [Green Version]
- Marangunić, N.; Granić, A. Technology acceptance model: A literature review from 1986 to 2013. Univers. Access Inf. Soc. 2014, 14, 81–95. [Google Scholar] [CrossRef]
- Al-Emran, M.; Mezhuyev, V.; Kamaludin, A. Technology Acceptance Model in M-learning context: A systematic review. Comput. Educ. 2018, 125, 389–412. [Google Scholar] [CrossRef]
- Abd Majid, F.; Shamsudin, N.M. Identifying factors affecting acceptance of virtual reality in classrooms based on Technology Acceptance Model (TAM). Asian J. Univ. Educ. 2019, 15, 51–60. [Google Scholar] [CrossRef]
- Estriegana, R.; Medina-Merodio, J.-A.; Barchino, R. Student acceptance of virtual laboratory and practical work: An extension of the technology acceptance model. Comput. Educ. 2019, 135, 1–14. [Google Scholar] [CrossRef]
- Rahimi, B.; Nadri, H.; Afshar, H.L.; Timpka, T. A systematic review of the technology acceptance model in health informatics. Appl. Clin. Inform. 2018, 9, 604–634. [Google Scholar] [CrossRef] [Green Version]
- Chang, S.L.; Chen, J.K. 3D bio-printing in medical treatment: A technology acceptance model. In Proceedings of the 2016 Portland International Conference on Management of Engineering and Technology (PICMET), Honolulu, HI, USA, 4–8 September 2016. [Google Scholar]
- Vanduhe, V.Z.; Nat, M.; Hasan, H.F. Continuance Intentions to Use Gamification for Training in Higher Education: Integrating the Technology Acceptance Model (TAM), Social Motivation, and Task Technology Fit (TTF). IEEE Access 2020, 8, 21473–21484. [Google Scholar] [CrossRef]
- Yuniarto, D.; Helmiawan, M.A.; Firmansyah, E. Technology Acceptance in Augmented Reality. J. Online Inform. 2018, 3, 10–13. [Google Scholar] [CrossRef]
- To, W.M.; Tang, M.N.F. Computer-based course evaluation: An extended technology acceptance model. Educ. Stud. 2018, 45, 131–144. [Google Scholar] [CrossRef]
- Holden, H.; Rada, R. Understanding the influence of perceived usability and technology self-efficacy on teachers’ technology acceptance. J. Res. Technol. Educ. 2011, 43, 343–367. [Google Scholar] [CrossRef] [Green Version]
- Joo, Y.J.; Park, S.; Lim, E. Factors influencing preservice teachers’ intention to use technology: TPACK, teacher self-efficacy, and technology acceptance model. J. Educ. Technol. Soc. 2018, 21, 48–59. [Google Scholar]
- Pittalis, M. Extending the technology acceptance model to evaluate teachers’ intention to use dynamic geometry software in geometry teaching. Int. J. Math. Educ. Sci. Technol. 2020, 52, 1385–1404. [Google Scholar] [CrossRef]
- Yousafzai, S.Y.; Foxall, G.R.; Pallister, J.G. Technology acceptance: A meta-analysis of the TAM: Part 1. J. Model. Manag. 2007, 2, 251–280. [Google Scholar] [CrossRef]
- Sáiz-Manzanares, M.C.; Escolar-Llamazares, M.-C.; González, A.A. Effectiveness of Blended Learning in Nursing Education. Int. J. Environ. Res. Public Health 2020, 17, 1589. [Google Scholar] [CrossRef] [Green Version]
- Coyne, E.; Rands, H.; Frommolt, V.; Kain, V.; Plugge, M.; Mitchell, M. Investigation of blended learning video resources to teach health students clinical skills: An integrative review. Nurse Educ. Today 2018, 63, 101–107. [Google Scholar] [CrossRef] [Green Version]
- Bagozzi, R.P.; Yi, Y. On the evaluation of structural equation models. J. Acad. Mark. Sci. 1988, 16, 74–94. [Google Scholar] [CrossRef]
- Sweller, J.; Chandler, P.; Tierney, P.; Cooper, M. Cognitive load as a factor in the structuring of technical material. J. Exp. Psychol. Gen. 1990, 119, 176. [Google Scholar] [CrossRef]
- Kruger, J.; Dunning, D. Unskilled and unaware of it: How difficulties in recognizing one’s own incompetence lead to inflated self-assessments. J. Personal. Soc. Psychol. 1999, 77, 1121. [Google Scholar] [CrossRef]
- Nievelstein, F.; Van Gog, T.; Van Dijck, G.; Boshuizen, H.P. The worked example and expertise reversal effect in less structured tasks: Learning to reason about legal cases. Contemp. Educ. Psychol. 2013, 38, 118–125. [Google Scholar] [CrossRef] [Green Version]
- Dalton, E.M. Beyond Universal Design for Learning: Guiding Principles to Reduce Barriers to Digital & Media Literacy Competence. J. Media Lit. Educ. 2017, 9, 17–29. [Google Scholar]
- Rienties, B.; Giesbers, B.; Lygo-Baker, S.; Ma, H.W.S.; Rees, R. Why some teachers easily learn to use a new virtual learning environment: A technology acceptance perspective. Interact. Learn. Environ. 2014, 24, 539–552. [Google Scholar] [CrossRef]
- Teo, T.; Zhou, M. The influence of teachers’ conceptions of teaching and learning on their technology acceptance. Interact. Learn. Environ. 2016, 25, 513–527. [Google Scholar] [CrossRef]
| Publisher’s Note: MDPI stays neutral with regard to jurisdictional claims in published maps and institutional affiliations. |
© 2021 by the authors. Licensee MDPI, Basel, Switzerland. This article is an open access article distributed under the terms and conditions of the Creative Commons Attribution (CC BY) license (https://creativecommons.org/licenses/by/4.0/).


