Article

Sustainable Performances of Small to Medium-Sized Airports in the Adriatic Region

1
Department of Industrial Engineering and Mathematical Sciences, Università Politecnica delle Marche, 60131 Ancona, Italy
2
Department of Construction, Civil Engineering and Architecture, Università Politecnica delle Marche, 60131 Ancona, Italy
3
Institute of Atmospheric Sciences and Climate, National Research Council, 73100 Lecce, Italy
*
Author to whom correspondence should be addressed.
Sustainability 2021, 13(23), 13156; https://doi.org/10.3390/su132313156
Submission received: 26 October 2021 / Revised: 14 November 2021 / Accepted: 24 November 2021 / Published: 27 November 2021

Abstract

:
The aim of the present paper is to evaluate the greenhouse gas savings and economic benefits associated with sustainable water and energy management at six small-to-medium airports in the Adriatic region. All the data were provided by the airport authorities in terms of the consumption of water, electricity, and energy for heating and company-operated vehicles for three years (2016–2018), as well as information about good practices and the sustainable use of water and energy resources. For the water and energy benchmarks, the most plausible predictive variables were selected according to the literature relevant to the environmental benchmarking of airports. The stepwise linear regression method was used to select the most significant predictive variables in explaining the dataset. The airports showed positive steps towards sustainability, such as a higher share of natural gas in the mix of fuel used for heating, and a green electricity tariff. The CO2 emissions and budget related to motor fuels were less than a quarter of the emissions and budget for energy consumption for heating and electricity. To achieve the goal of zero-emission airports, the decarbonisation of motor fuels and transport should follow the actions aimed at increasing energy efficiency and clean energy for heating and electricity.

1. Introduction

The demand for energy, fuels, and water at airports may be compared to that of small cities [1], with the operation and maintenance of airports having an impact on the environment and climate, including greenhouse gas (GHG) emissions, noise, air, soil, and water pollution [2]. Therefore, the transition to zero-emission airports and the sharing of best practices are part of “The Sustainable and Smart Mobility Strategy” launched by the European Commission aiming at the optimisation of the European transports on track for the future [3]. Moreover, airports can benefit from green initiatives (e.g., increasing the energy efficiency of buildings and the demand for zero- and low-emission vehicles) that are mentioned in the Annual Sustainable Growth Strategy set by the European Commission [4].
Between 2016 and 2018, Croatia and Italy were above their national target of 20 and 17%, respectively, of gross final energy consumption from renewable sources [5] according to the EU’s 2020 renewable energy target set by the European Parliament and the Council in 2009 [6].
Transport shows a lower share of energy from renewable sources (up to about 2.6 and 7.7% in Italy and Croatia, respectively), compared to electricity, heating, and cooling sectors [5].
In the Republic of Croatia, electricity from renewable sources is expected to cover about 15% of the direct consumption of energy in transport to achieve the national target by 2030 [7]. The Republic of Croatia [8] listed the reduction of the impact of the transport system on climate change and air quality among the policy objectives of the transport strategy by the same date.
Italy, to achieve the national target of 30% of total gross final consumption from renewable sources by 2030, has planned to increase the share of renewables up to 22, 33.9, and 55% of total gross final consumption for the transport, heating and cooling, and electricity sectors, respectively. By 2030, the share of electricity from renewable sources for road transport is planned to increase to 5.9% of the gross final consumption in the transport sector [9].
EU regional policy (or cohesion policy) provides subsidies aimed at achieving the goals of the EU 2020 strategy through regional and national cooperation such as the Interreg programme [10].
In this context, two Croatian airports (i.e., Dubrovnik and Pula), and four Italian airports (i.e., Bari, Brindisi, Pescara, and Rimini) took part in the Green and Intermodal Solutions for Adriatic Ports and Airports “ADRIGREEN” project [11] under the Interreg V-A Italy Croatia. The Interreg V-A Italy Croatia fosters cooperation across the Adriatic Sea for a sustainable development financed with the EU regional policy budget.
The aim of the present paper is to evaluate the GHG savings and economic benefits associated with sustainable water and energy management at small-to-medium airports.
Relevant data were provided by the airport authorities about water, electricity, and energy consumption for heating and company-operated vehicles for three years, namely, 2016, 2017, and 2018. Airport authorities also provided information about good practices, in place or to be implemented locally, regarding the sustainable use of water and energy resources.

Literature Review

In 2014, small airports (less than 1 million passengers per year) were less profitable than medium airports (1–5 million passengers per year) because of the economies of scale [12].
Martini et al. [13] evaluated the environmental footprint of a set of Italian airports only focusing on local emissions of noise and airborne pollutants (i.e., hydrocarbons and NOx) deriving from aircraft operations during landing and take-off cycles.
According to the Airports Council International (ACI) [14], an external benchmarking should be based on peer evaluation of the economic, management and environmental performances of airports. The benchmarking of environmental externalities is useful for improving the sustainable performance of airport activities [15]. A comprehensive analysis about the benchmarks of the environmental impacts of airports has been presented in previous works by Kılkış and Kılkış [16], Chao et al. [17], and Gómez Comendador et al. [18]. Table 1 shows the environmental indicators for managing the carbon footprint and water and energy consumption at airports.
Previous studies [15,16,19] addressed the selection of key performance indicators for the assessment of environmentally sustainable and energy efficient airports. The heating and cooling energy requirements of buildings can be expressed through the heating degree-day and cooling degree-day indexes, respectively, based on outdoor temperature and average room temperature [20]. The heating degree-day index is a standard parameter for considering the effect of weather conditions on the heating demand of buildings [21].
However, the cooling and heating demand of infrastructures such as airport terminal buildings can be significantly affected by other factors, such as heat dissipation related to the presence of appliances, the number of people, their activities, and their perception of thermal comfort [25,26]. For the energy benchmarking of airports, common performance indicators are kWh per passenger, kWh weighed against terminal building surface, and kWh for heating, ventilation, and air conditioning weighed against surface [27]. However, by introducing the surface parameter alone for estimates, one does not consider other building characteristics (e.g., compactness, shape factors, and volume) that are essential for determining the true energy consumption of terminal buildings.
According to Greer et al. [28], the evaluation of GHG emissions related to energy consumption is most often reported within the literature pertinent to sustainable airports. To evaluate the productivity of airports, aircraft movements are considered the output of airside operations, whereas passenger traffic is the output of landside operations or the final output of the airport [29]. Workload unit is used to measure the airport performance in terms of passengers and their baggage or quantities of air cargo. Therefore, it is useful to express the airports’ performances in terms of the workload unit for the airports with comparable passenger and freight traffic.
Kılkış and Kılkış [16] developed an index with five indicators to benchmark the sustainability performance of airports. However, these authors observed a poor prediction, by means of a linear regression, of the indicator values calculated for nine airports and the annual passenger traffic. The ( ·passenger−1) index is commonly used for evaluating water consumption, but it may not reflect conservation actions or a better management of water resources at a specific airport [19].

2. Methods and Data Sets

2.1. Airport Characteristics and Dataset

Table 2 displays the environmental characteristics and certifications of the airports. The airports are classified as regional airports when managing less than 5 million passengers per year [30].
From 2016 to 2018, the total traffic of passengers at the Dubrovnik and Pula airports accounted for 30.7% of the whole Croatian passenger traffic. In the Dubrovnik and Pula airports, the demand significantly increases from May to September, with risks for bottlenecks due to season peaks [8]. Particularly, Pula Airport has marginal traffic volumes during the off-season. Dubrovnik Airport serves South Dalmatia, which is geopolitically and territorially isolated from the rest of Croatia and the European Union because of the border with Bosnia and Herzegovina [8]. Since 2010, Dubrovnik Airport has been mapping direct and indirect CO2 emissions according to the Airport Carbon Accreditation Programme set by ACI [14].
From 2016 to 2018, total traffic of passengers at the Bari, Brindisi, Pescara, and Rimini airports accounted for about 4.5% of the whole Italian passenger traffic. These airports have passenger traffic marked by a high season from May to October and a low season for the rest of the year (Appendix A, Figure A1). Rimini Airport has the highest seasonal peak in July, with the number of passengers 8.7 times that of the lowest mean passenger traffic per month. The airports of Bari, Brindisi, and Pescara have the peak values of monthly passenger traffic in July and August, with the number of passengers 1.7–2 times that of the lowest mean monthly passenger traffic.
Zuidberg [31] has observed that seasonality positively affects profit margins only for an optimal range of a parabolic-like relationship between airport profitability and the operations occurring throughout the year.
The airport authorities provided data about the consumption of water, electricity, and energy for heating and company-operated vehicles (Table 3). Upon specific request of some of the airport managing authorities, all data are presented in an anonymous form.

2.2. Statistical Analysis and Calculations

To compare the energy utilised irrespective of the type of fuel, the amount of energy for heating buildings and company-operated vehicles was expressed in terms of net calorific value.
The energy from liquid fuels for heating buildings (ELFH) was calculated as follows:
E L F H i , b = N C V i × C L F i , b × d i
where E L F H i , b (MJ) is the energy for heating deriving from the consumption of the i-type of fuel (i.e., diesel oil, and heating oil) during the b-year (with b from 2016 to 2018); N C V i (MJ·kg−1) is the net calorific value of the i-type of fuel (Table 4); C L F i , b   ( ) is the consumption of the i-type of liquid fuel during the b-year; and d i (kg· −1) is the density of the i-type of fuel (i.e., 0.835 and 0.923 for diesel oil and heating oil, respectively) [32].
Energy from natural gas for heating buildings (ENGH) was calculated as follows:
E N G H b = N C V b × C N G b
where E N G H b (MJ) is the energy for heating deriving from natural gas consumption for the b-year (b ranging from 2016 to 2018); N C V b is the net higher calorific value (MJ·(scm)−1) (scm = standard cubic metre) for the b-year (Table 4); and C N G b (scm) is the consumption of natural gas for the b-year.
The consumption of energy for company-operated vehicles (ECOV) was calculated as follows:
E C O V i , b = N C V i × C i , b
where E C O V i , b is the energy (MJ) for company-operated vehicles deriving from the consumption of the i-type of fuel (i.e., diesel, and gasoline) or electricity, and the b-year (with b from 2016 to 2018); N C V i is the net calorific value of the i-type of fuel (i.e., 32 MJ· −1 for gasoline, 36 MJ· −1 for diesel, and 3.6 MJ·kWh−1 for electricity) according to the Annex 10 to the Clean Vehicles Directive [38]; and C i , b is the consumption for the b-year of the i-type of fuel, (kWh) for electricity and ( ) for diesel fuel and gasoline.
ACI [23] reported limitations inherent to benchmarking airport datasets with sharp differences in airport activities and characteristics. To evaluate the accuracy of benchmarking the airport dataset, the performances of the airports were expressed in terms of water and energy consumption, budget, and GHG emissions based on the most significant predictive variables defined with the stepwise linear regression method. This method consists of doing an iteration of multiple regressions, adding or removing the predictive variables based on their statistical significance in explaining the response variable [39]. Starting with an initial model, the model that fits the dataset with a constant and a predictive variable with a p-value below the threshold becomes the new starting model [40]. At each step, a p-value of 0.05 is the threshold to accept or reject the null hypothesis that the predictive variable in/added to the model has/would have a zero coefficient [41].
The response variable is the dependent variable that is described by the equation having one or several predictive variables as independent (or input) variables. Table 5 displays the response and predictive variables considered for calculating stepwise linear regressions. The most plausible predictive variables were selected according to the literature relevant to the environmental benchmarking of airports.
The benchmarks were the median values of the airports’ yearly consumption of water and energy, budget, and CO2 emissions expressed in terms of the respective significant predictive variables.
The yearly number of passengers and aircraft movements were considered potential predictive variables of each response variable (i.e., water, electricity, and energy consumption) (Table 5).
Heating degree-days and air-conditioned spaces were considered as potential predictive variables of energy consumption for heating purposes. Cooling degree-days and air-conditioned spaces were considered potential predictive variables of electricity and water consumption. Heating and cooling degree-days (Appendix A, Table A1 and Table A2) were calculated from 2016 to 2018 based on the monthly data reported by Eurostat [42] at level 3 (i.e., provinces in Italy and counties in Croatia) of the disaggregation of territorial units for statistics.
The direct emissions of GHG deriving from fossil fuel consumption for heating buildings and company-operated vehicles (EGHGFF) were evaluated as follows:
E G H G F F i , b = E F i × E C i , b × 10 3
where E G H G F F i , b (kg CO2) represents greenhouse gas emissions for the i-type of fuel for heating (i.e., diesel oil, heating oil, and natural gas) and company-operated vehicles (i.e., diesel and gasoline) during the b-year (with b from 2016 to 2018); E F i (kg CO2·GJ−1) is the emission factor of the i-type of fuel for heating (Table 4) and company-operated vehicles (Table 6); and E C i , b (MJ) is the energy associated with the consumption of the i-type of fuel, i.e., liquid fuels for heating ( E L F H i , b of Equation (1)), natural gas for heating ( E N G H b of Equation (2)), and fossil fuel for company-operated vehicles ( E C O V i , b of Equation (3)), all of them during for the b-year.
The emissions of GHG deriving from electricity consumption (EGHGE) were evaluated as follows:
E G H G E i , b = C i , b × E F i × 10 3
where E G H G E i , b (kg CO2) represents greenhouse gas emissions for the i-type of electricity (i.e., electricity purchased from a mix of national energy sources or from a mix of renewable sources or produced on-site) during the b-year (b ranging from 2016 to 2018); C i , b (kWh) is the consumption during the b-year of the i-type of electricity; and E F i (g CO2·kWh−1) is the emission factor related to the i-type of electricity (Table 6).
Costs were expressed per unit of the statistically significant predictive variables (Table 7).
For each airport, the yearly budget related to the consumption of water, energy, and electricity was divided by the respective value of the predictive variables. For the b-year (with b in the time interval 2016–2018), the missing budget data of the e-airport were replaced by the average unit price of the i-airports of the same country as follows:
B u d g e t e , b = [ 1 n i = 1 n B u d g e t i , b C o n s u m p t i o n i , b ] × C o n s u m p t i o n e , b

3. Results

3.1. Performance Indicators for Water and Energy Consumption

Figure 1 shows the yearly consumption of water, electricity, and energy for heating and company-operated vehicles at the airports. The x axes (Figure 1a1–c1) show the significant predictive variables selected from the set of potential predictive variables (Table 5) with the stepwise linear regression method for describing the data provided by the airports. Following the evaluation of the statistically significant predictive variables, the airports’ yearly values of water, electricity and energy consumption were plotted versus the respective independent variables (i.e., the statistically significant predictive variables). The values of R2 (or the coefficient of determination) between 0.68 and 0.995 denote that the departures in the consumption values can be explained by the predictive variables in the range from 68% to 99.5% (Figure 1a1–d1). The performance indicators are the consumption of water expressed per unit of aircraft movements ( per aircraft movement in Figure 1a2), energy for heating expressed per unit of air-conditioned spaces (MJ per m−3 of air-conditioned spaces in Figure 1b2), energy for company-operated vehicles expressed per unit of passenger (MJ per passenger in Figure 1c2), and electricity expressed per unit of passenger (kWh per passenger) and per unit of air-conditioned spaces (kWh per m−3 of air-conditioned spaces) as depicted in Figure 1(d2,d3), respectively.
Following the evaluation of the performance indicators that best suit the consumption of water and energy dataset, the median values of carbon dioxide emissions (Section 3.2) and budget (Section 3.3) related to water and energy consumption are assumed as the benchmarks of the airports’ GHG emissions and budget performances.
The yearly consumption of water is best predicted by the aircraft-movements-per-year variable, with an R2 equal to 0.875 and a p-value far below the significance level of 0.05 (Figure 1a1). At various airports, water consumption ranged from 1275 to 3063 per aircraft movement (Figure 1a2). These values were obtained by dividing the yearly values of water consumption (data not shown) provided by each airport by the respective yearly aircraft movements (data not shown).
Air-conditioned spaces and passengers per year are the significant predictive variables for energy and electricity consumption. The air-conditioned spaces of the terminal buildings are the predictive variable for the yearly energy consumption for heating, with R2 equal to 0.68 and p-value < 0.0001 (Figure 1b1). From 2016 to 2018, airports’ yearly energy consumption for heating ranged from 16.2 to 104.1 MJ·m−3 of air-conditioned spaces (Figure 1b2). These values were obtained by dividing the yearly values of energy consumption for heating from liquid fuels (Equation (1)) and natural gas (Equation (2)) calculated for each airport by the respective air-conditioned spaces (data not shown).
The passengers-per-year variable significantly describes (with a p < 0.0001) the energy consumption of company-operated vehicles, R2 being equal to 0.973 (Figure 1c1). At various airports, from 2016 to 2018, the energy consumption of company-operated vehicles ranged between 2.3 and 4.5 MJ per passenger (Figure 1c2). These values were obtained by dividing the yearly values of energy consumption for company-operated vehicles (Equation (3)) calculated for each airport by the respective passenger traffic (data not shown).
The linear regression between the yearly values of electricity consumption and two variables (i.e., air-conditioned spaces and passengers per year) showed the highest value of R2 (0.995) and a p-value far below the significance level (Figure 1d1). Between 2016 and 2018, airports’ yearly consumption of electricity ranged from 1.9 to 5.3 kWh per passenger (Figure 1d2) and from 7.8 to 36.9 kWh per m−3 of air-conditioned spaces (Figure 1d3). These values were obtained by dividing the yearly values of electricity consumption (data not shown) calculated for each airport by the respective passenger traffic and air-conditioned spaces.

3.2. Carbon Dioxide Emissions Deriving from Energy Consumption

Figure 2 shows the airports’ yearly values of CO2 emissions plotted versus the performance indicators related to energy and electricity consumption in the time period of 2016–2018. The emissions of CO2, which were calculated according to Equations (4) and (5), were plotted versus the performance indicators of energy and electricity consumption determined in Section 3.1. In Figure 2, the markers that are enclosed by the dashed lines show airports’ yearly energy consumptions below the energy consumption benchmarks associated with airports’ yearly GHG emissions below the GHG emission benchmarks.
Some airports reported energy consumptions for heating between 1.7 and 31.2 MJ·m−3 below the average benchmark (namely, 47.4 MJ m−3) and this let them to prevent up to 2.5 kg of CO2 emissions per m−3. Other airports registered consumptions up to 56.7 MJ·m−3 above the same benchmark and this triggered extra CO2 emissions up to 2.5 kg of per m−3 (Figure 2a).
Certain airports reported an energy consumption for motor vehicles up to 0.25 MJ per passenger below the average benchmark (2.6 MJ per passenger); this let them to avoid up to 0.02 kg of CO2 emissions per passenger, whereas other airports had consumptions up to 1.9 MJ per passenger above the benchmark, leading to extra CO2 emissions up to 2.5 kg of CO2 per passenger (Figure 2b).
Each kilogram of fuel burnt by diesel or petrol vehicles pours more than 3 kg of CO2 [45] together with several other toxic substances, mainly airborne pollutants deriving both from the combustion and from the wearing of brake pads, tires, etc. While there is currently no way to reduce the latter, the former can be significantly reduced or even zeroed by introducing modern technologies such as electrification.
The median values of yearly electricity consumption benchmarks were 2.4 kWh per passenger and 29.1 kWh·m−3, leading to average CO2 emissions of 0.6 kg per passenger and 7.1 kg·m−3 (Figure 2c,d). No GHG emissions were attributable to two airports with electricity consumption in the range of 2.1–2.7 kWh per passenger and 17–37 kWh per m−3 of conditioned spaces (markers on the x axes in Figure 2c,d). The goal of zeroing GHG emissions due to electricity consumption was achieved with the on-site photovoltaic production of electricity combined with the purchase of electricity produced by renewable energy sources.

3.3. Budgets Related to Water and Energy Consumption

Figure 3 shows yearly budgets of water and energy consumption and the median values as the benchmarks. The yearly budgets related to the consumption of water, energy, and electricity were plotted versus the performance indicators of water, energy, and electricity consumption determined in Section 3.1. In Figure 3, the markers that are enclosed within the dashed boxes indicate airports whose yearly water, energy, and electricity consumptions and related yearly budgets were both below the respective averages.
At certain airports, water consumption up to 1148 per aircraft movement above the benchmark (namely 1916 per aircraft movement) resulted in higher costs up to 2.69 € per aircraft movement, whereas other airports showing reduced water consumptions up to 640 per aircraft movement saved up to 1.39 € per aircraft movement (Figure 3a).
At some airports, energy consumptions between 1.69 and 31.17 MJ m−3 below the average led to saving up to 0.62 € m−3, whereas the airports with consumption up to 56.66 MJ m−3 above the benchmark paid up to 1.4 €·m−3 more than the average (Figure 3b). The fuel mix with heating oil accounting for 54% of the total energy spent for heating likely explains the budget performance of airport D saving 0.13 €·m−3 despite an energy consumption of 11.06 MJ·m−3 above the benchmark.
At certain airports, energy consumption for motor fuels up to 1.9 MJ per passenger above the average led to extra costs up to 0.05 € per passenger, whereas the airports with lower energy budgets up to 0.25 MJ per passenger saved up to 0.01 € per passenger (Figure 3c).
Figure 3d,e shows electricity budgets expressed in terms of passengers and air-conditioned spaces of the terminal buildings.
Electricity consumptions up to 2.9 kWh per passenger and up to 7.8 kWh·m−3 above the benchmark resulted in higher budgets up to 0.63 € per passenger and up to 2.03 € m−3, whereas lower consumption up to 0.5 kWh per passenger and up to 21.3 kWh m−3 led to saving up to 0.15 € per passenger and up to 2.95 € m−3.

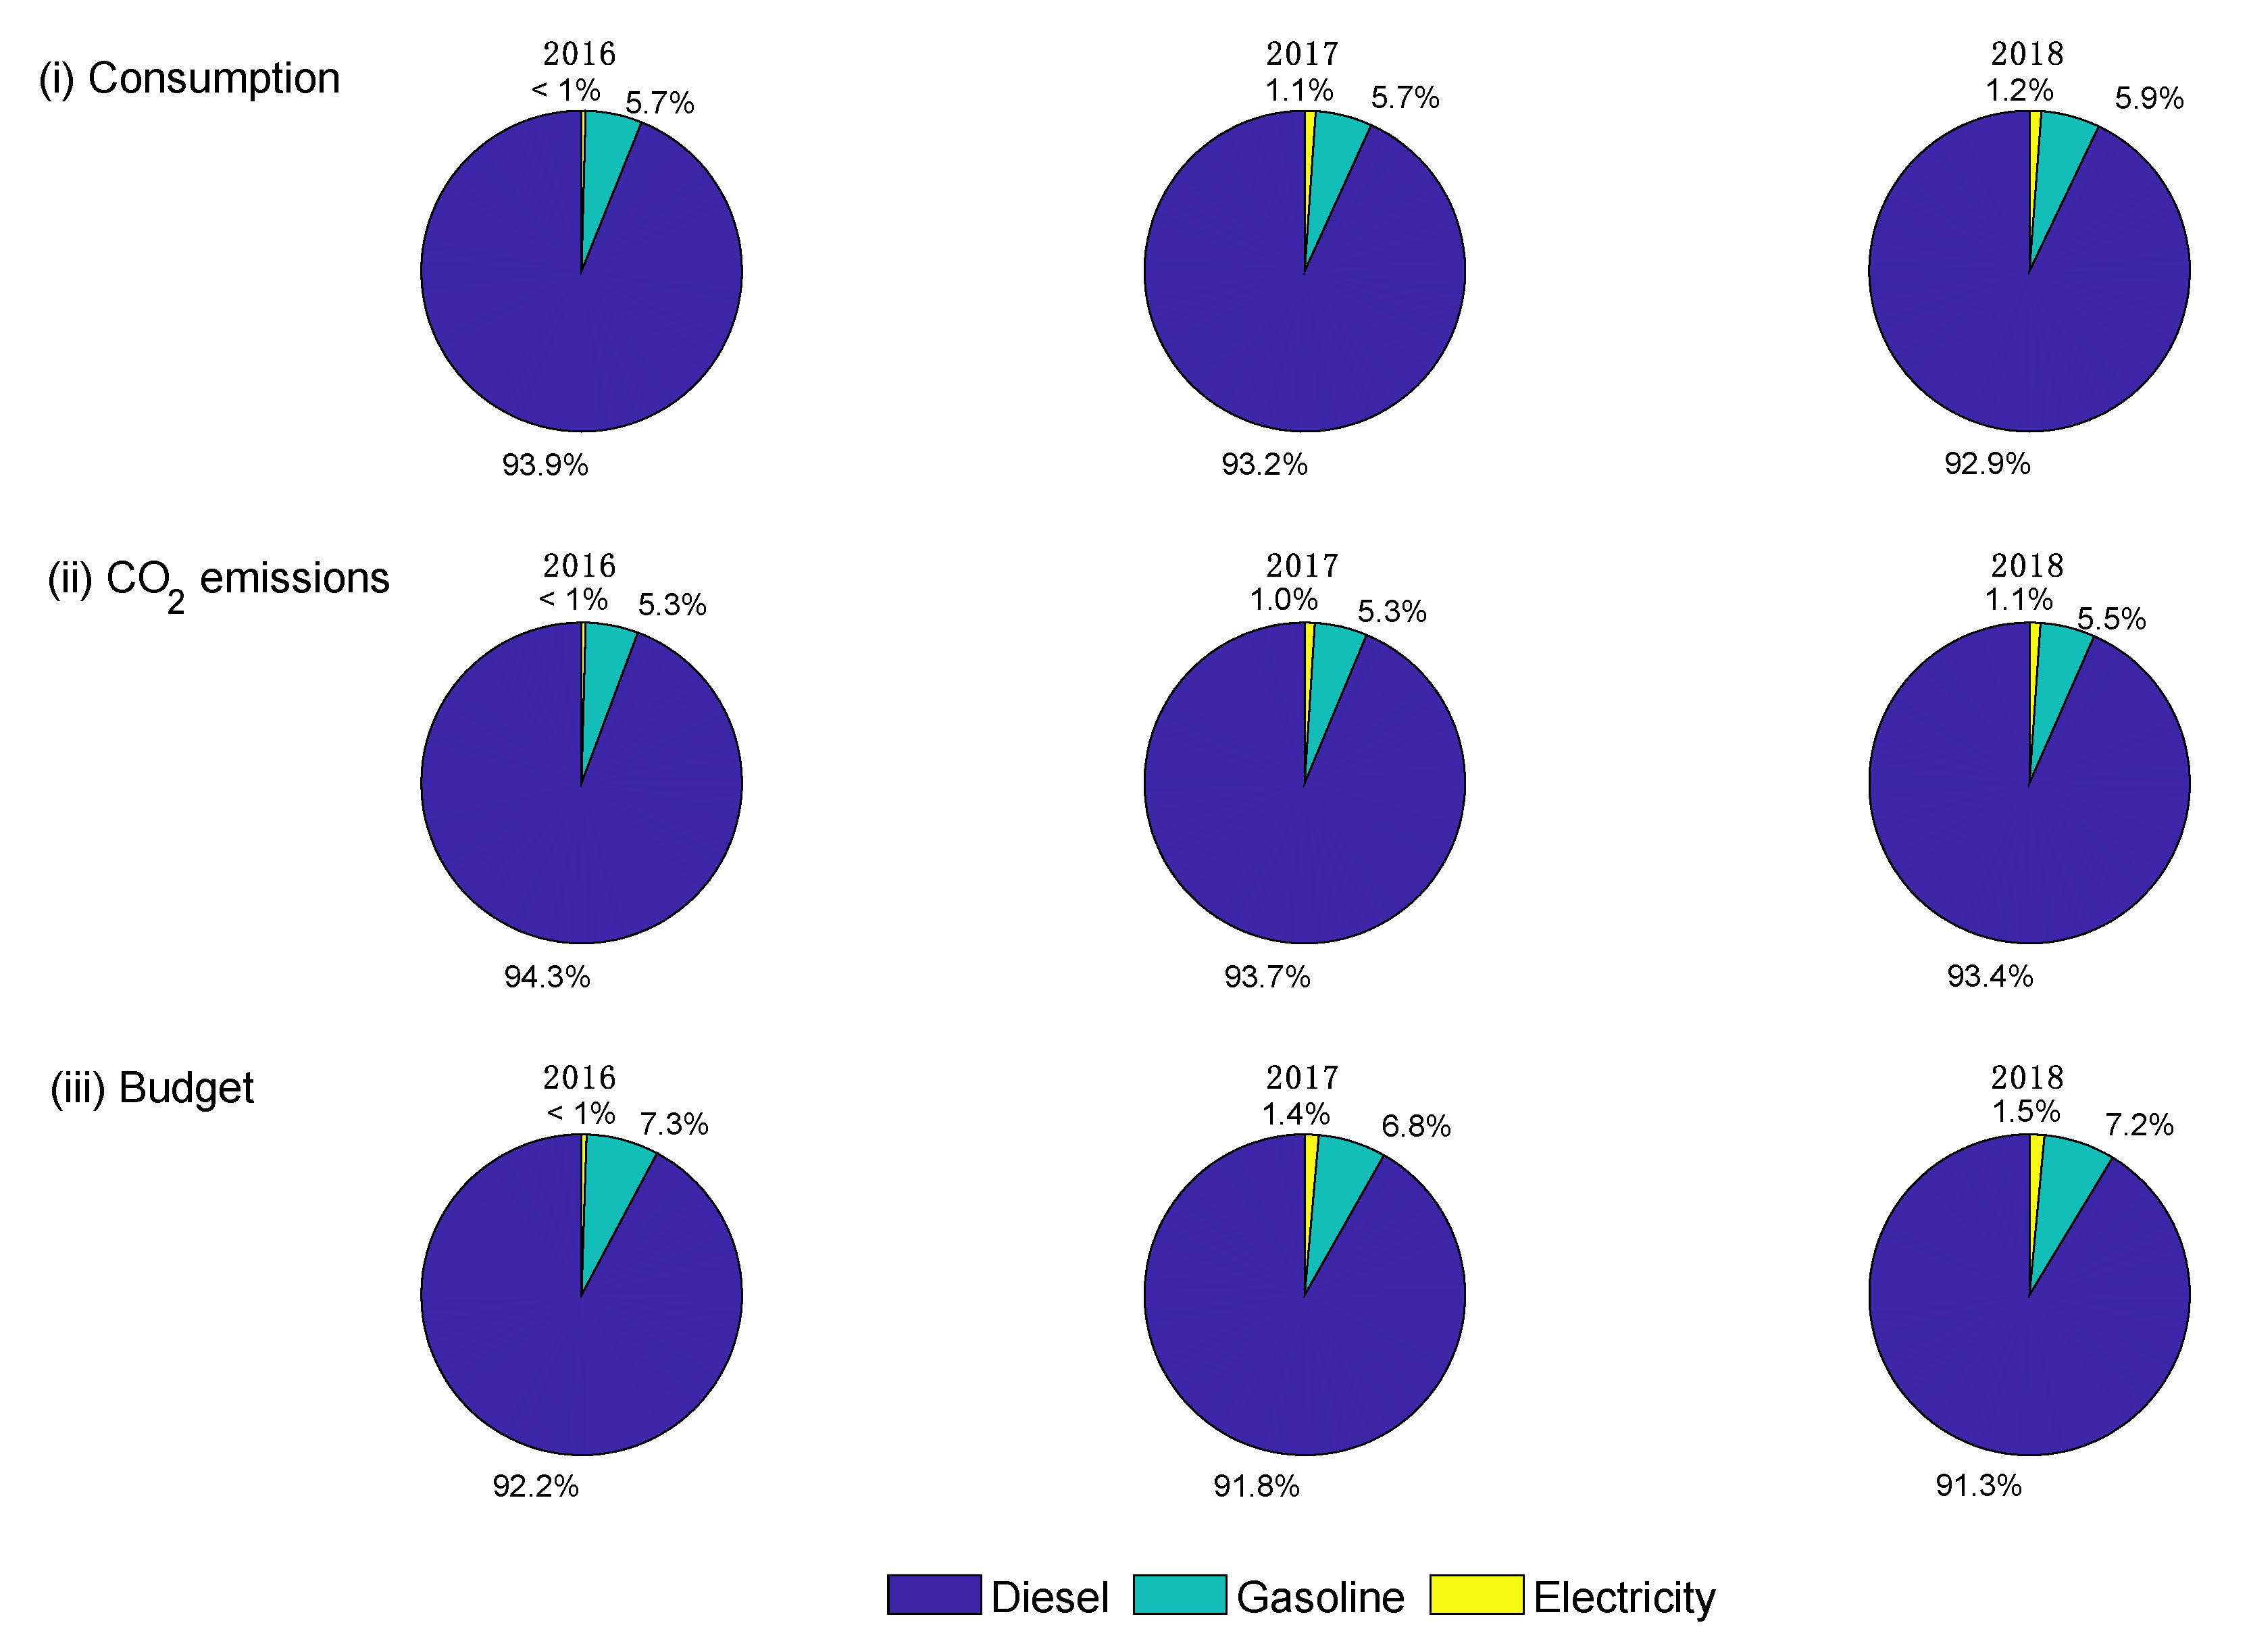
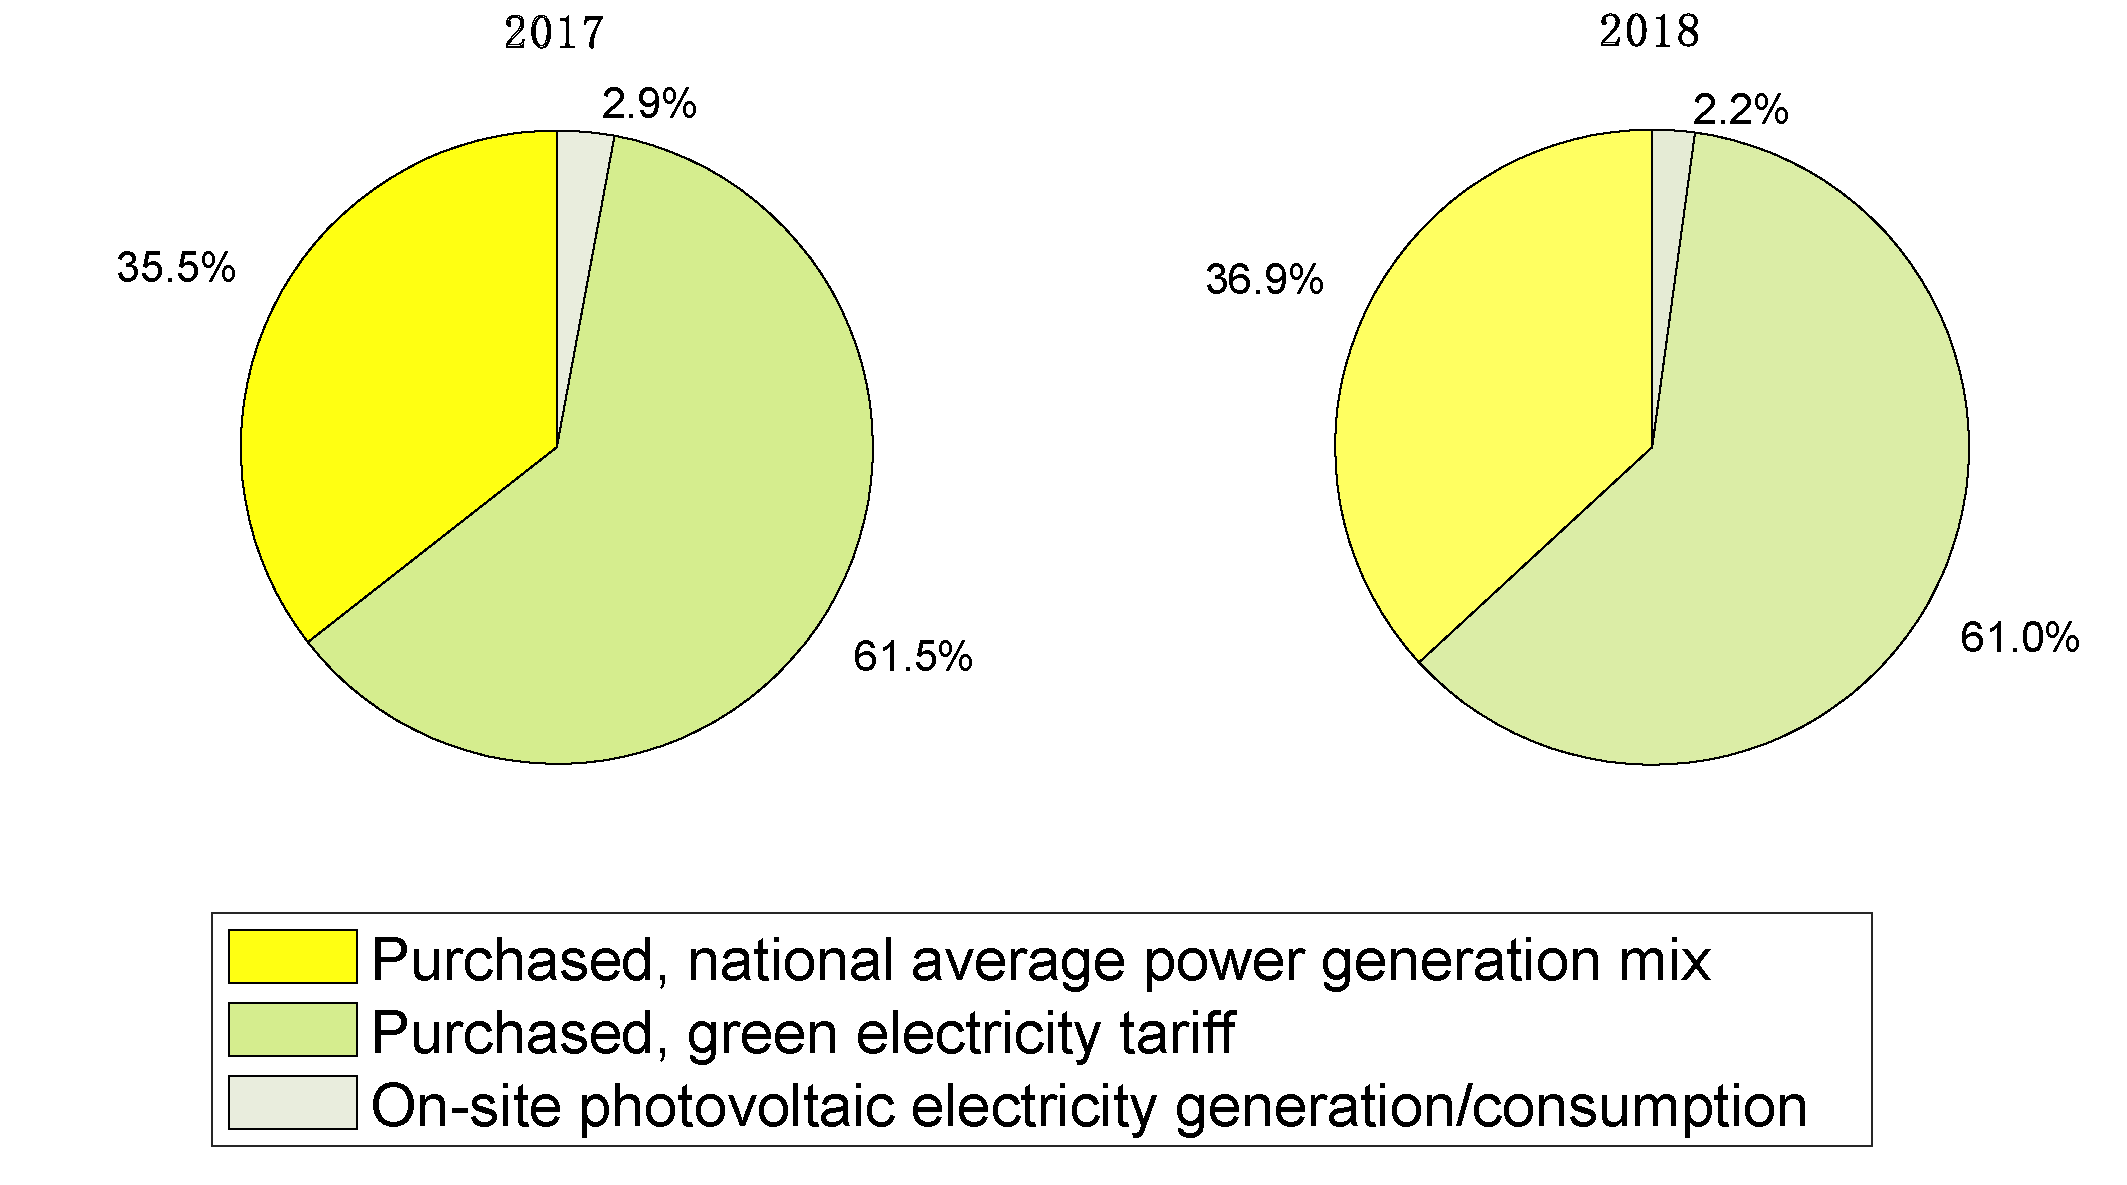
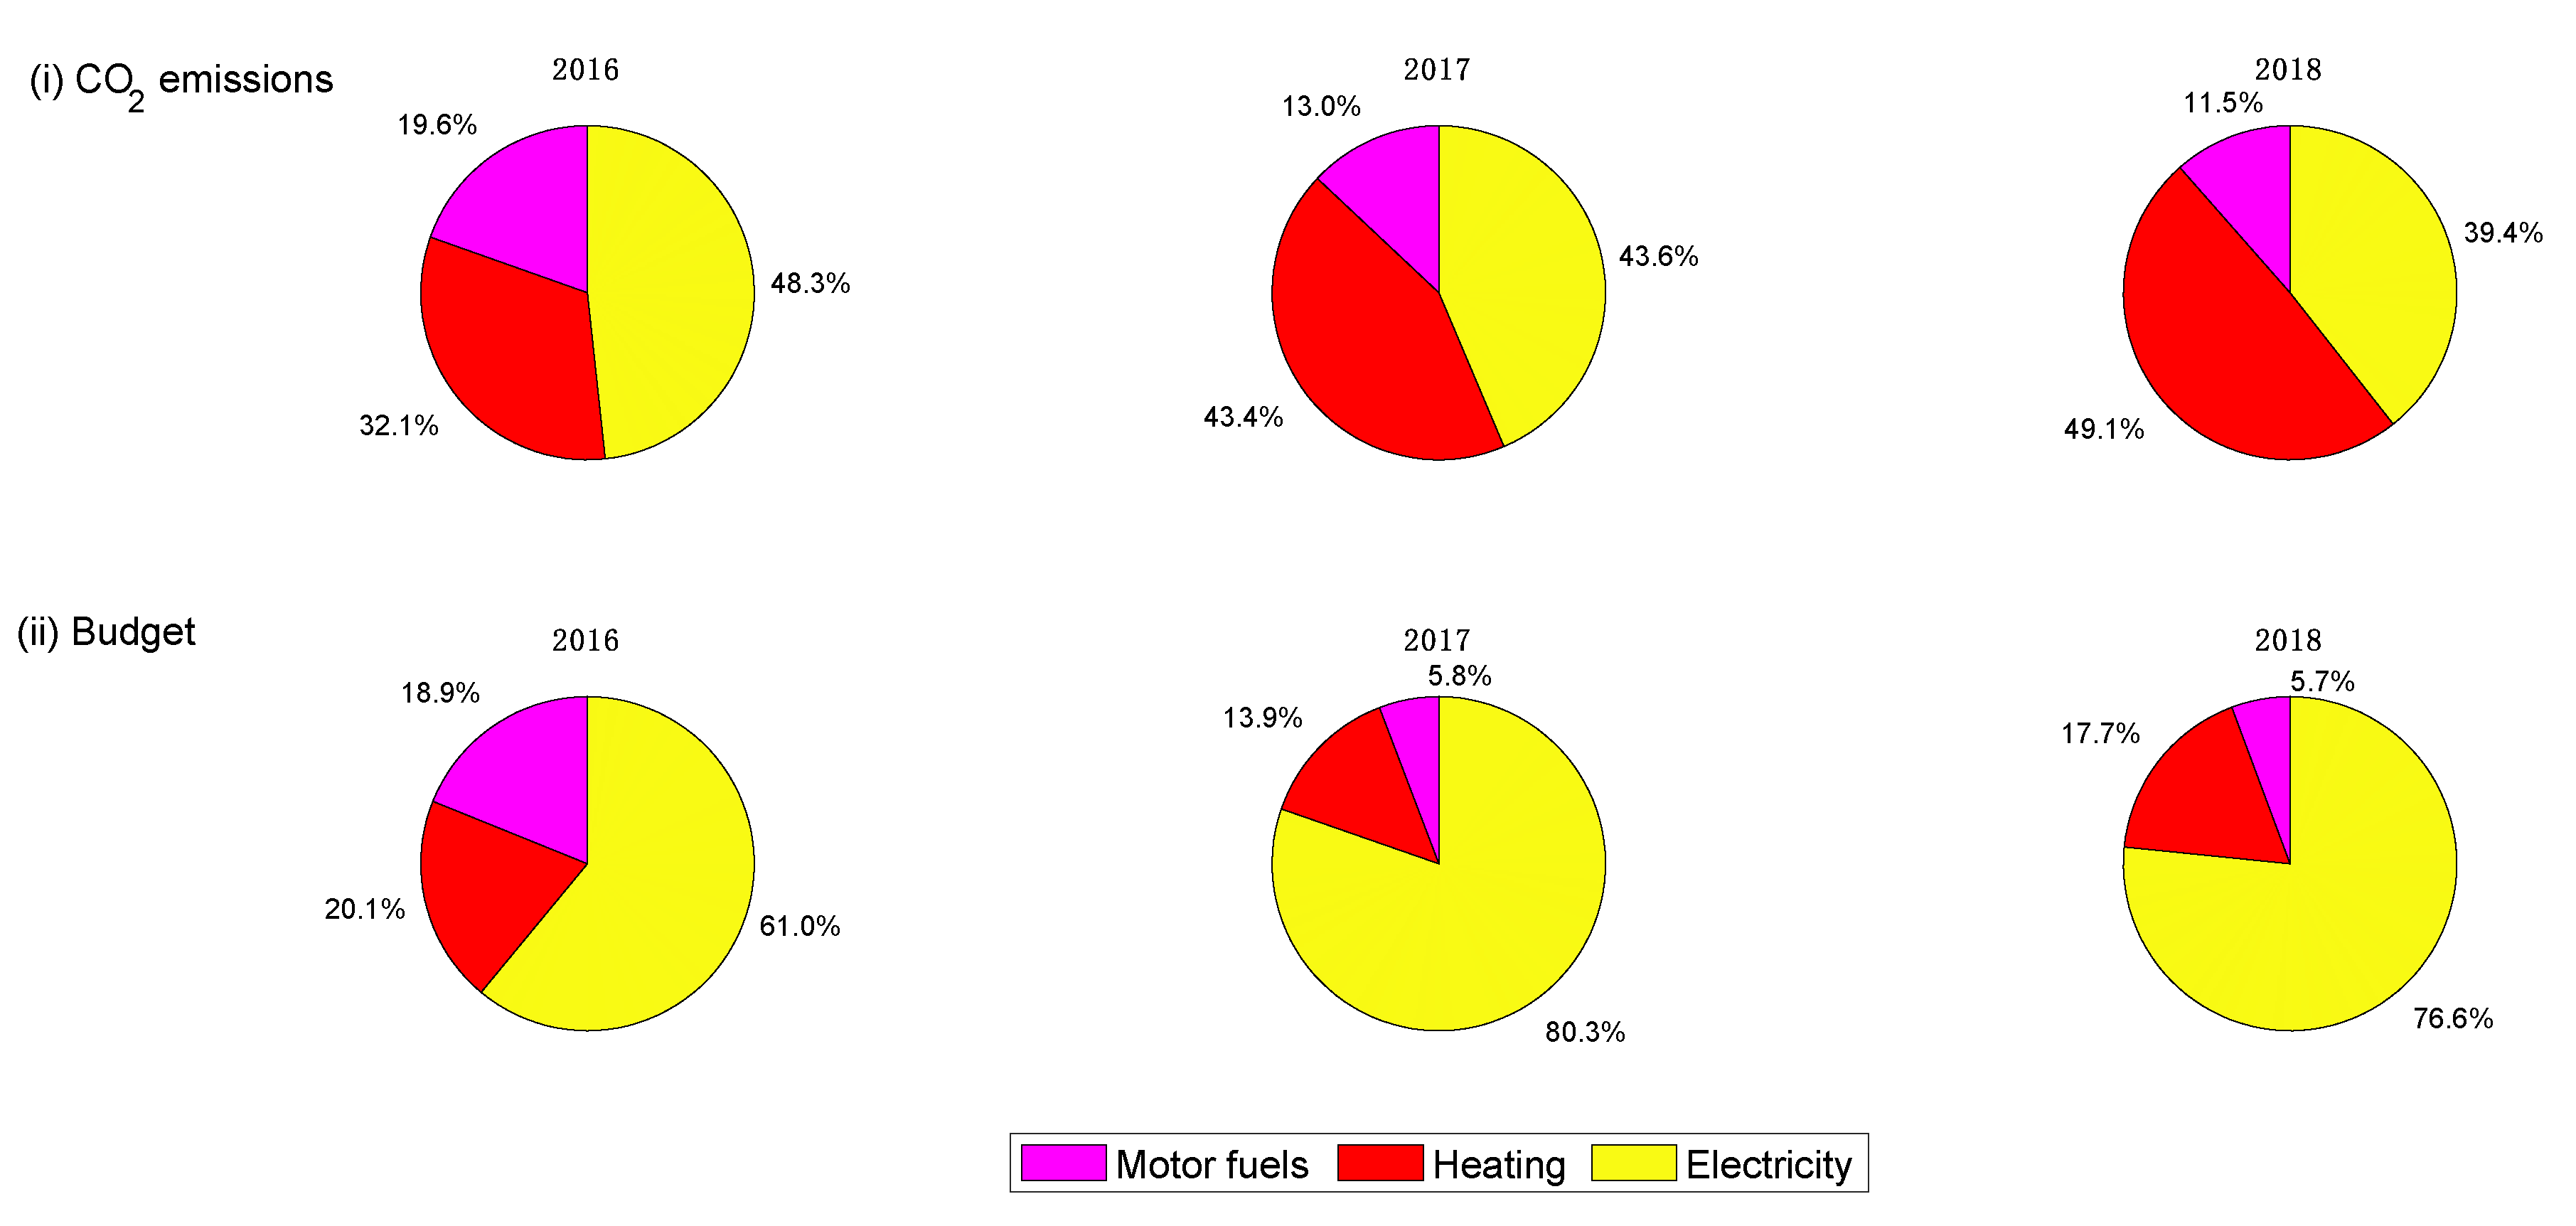
3.4. Contribution of Different Types of Fuel and Electricity to Energy Consumption, CO2 Emissions, and Budget

The percentage contribution of various fuels to total energy consumption for company-operated vehicles ranked as diesel > gasoline > electricity (Figure 4). From 2016 to 2018, electricity increased from 0.4 to 1.2% of the total energy consumption, whereas diesel showed a slight decrease. Electricity consumption as a motor fuel was reported by only one airport, whereas diesel fuel was in use at all the airports. The budgets and CO2 emissions reflected ranks and trends observed for motor fuel consumptions (Figure 4).
Between 2017 and 2018, the percentage contribution to the total energy consumption for heating ranked as natural gas > diesel > heating oil (Figure 5). The percentage values that were calculated for the year 2016 were based on the data reported by three airport authorities. Moreover, the fuel mix in use for heating purposes showed marked differences between Croatian and Italian airports, with the former also burning heating oil and the latter natural gas.
Between 2017 and 2018, the use of natural gas was valuable both from the emission and budget perspectives with consumption percentages higher than CO2 and budget percentages (Figure 5). On the contrary, the use of diesel fuel was not profitable either from the emission or budget perspective, with higher percentage values of CO2 and budget compared to the consumption percentages.
The use of heating oil makes no sense in terms of carbon emissions and air pollution, with percentages of emissions being much higher compared to the consumption ones. However, comparisons between the percentages of consumption and budget show that the use of heating oil is economically advantageous.
From 2017 to 2018, the mix of fuel used for heating showed a positive trend in terms of carbon footprint due to a decrease in the use of heating oil and diesel fuel and the increase in the use of natural gas.
Between 2017 and 2018, about 61% of the electricity consumption was purchased from renewable sources, 36% from the national average power mix, and up to 2.9% was produced from on-site photovoltaic systems (Figure 6).
At the airports, CO2 emissions and budget related to motor fuels were less than a quarter of the emissions and budget for energy consumption for heating and electricity (Figure 7).

4. Discussion

Airports have large water consumption due to common end uses of commercial buildings, but also for handling and maintenance services [18].
Generally, lower values of water consumption per aircraft movement were estimated at those airports that have in place initiatives aimed at improving water management (monitoring for water consumption and leaks, rainwater harvest and reuse). Moreover, for the airports located at relatively short distances from the nearby cities and/or managing a lower number of passengers per year, water consumption per passenger may be higher. For the second situation, this is mostly due to the rather constant amount of water consumed for basic activities (e.g., cleaning) and by the personnel while the first situation is mostly due to the groups of relatives or friends that tend to escort the true passengers from/to the airports when they are close to the nearby cities.
Up to 67% of the airports reported to have in place or plan to implement initiatives aiming at reducing the water footprint of the airport infrastructures (Appendix A, Table A3). Readers can refer to the comprehensive work by Baxter et al. [24] about sustainable airport water management.
The reduction in water consumption would result in decreasing GHG emissions deriving from water management. For example, in Italy the consumption of one cubic metre of drinking water leads to the emission of 0.579 kg of equivalent CO2 [46].
Terminals are responsible for the largest fraction of energy consumption at airports [23]. For example, at Santander Airport (Spain) the terminal building accounted for about 76.6% of the energy consumption of the entire infrastructure [27].
Energy efficiency of terminal buildings and the related appliances varies with the technologies employed and the design and the age of the building [23]. Improving the energy efficiency is a prerequisite to reduce exhaust emissions deriving from the combustion of fuel for heating purposes.
Most airports have in place or plan to implement initiatives aimed at reducing the energy footprint of the airport infrastructures (Appendix A, Table A4). However, the airports showed a wide range of yearly values of energy consumption per air-conditioned spaces. From 2016 to 2018, the highest values of energy consumption for heating (99.7–104.1 MJ per m3 of air-conditioned spaces, Figure 1b2) were scored by an airport (namely, airport C) with year-round operations and terminal buildings that need renovation. Irrespective of seasonality, two airports (namely, airports E and F) improved the insulation of terminal buildings so that the values of energy for heating were in the lowest range (16.2 and 43.6 MJ per m3 of air-conditioned spaces, Figure 1b2). An exception is represented by airport B, which tripled the energy spent for heating from 20.8 (2017) to 64 (2018) MJ per m3 of air-conditioned spaces for the reason that its operations were extended to the winter season.
Considering the comparisons between consumption, CO2 emissions, and budget percentages between the different types of heating fuels in use at the airports, natural gas is profitable both in terms of CO2 emissions and budget, whereas diesel fuel shows higher percentage values of CO2 and budget compared to the consumption percentages (Figure 5).
As already outlined, the use of heating oil is economically advantageous but involves much higher emissions. This is an aspect that should be addressed in the price structure of heating oil with energy taxes in line with the EU GHG emission reduction objectives. Today, the use of diesel fuel for heating is strongly discouraged both for its rather high carbon footprint and for the relevant emissions of airborne pollutants associated to its use, while the use of heating oil is almost banned and should be discontinued as its related effects on the environment are even more relevant. The European Commission [47] proposed reformulating the European energy taxation system of energy products used as motor fuels and heating fuel and of electricity considering energy content and CO2 emissions to overcome the distortions in taxation under Directive 2003/96/EC [48].
In line with the findings reported, among all, by Ortega Alba and Manana [27], electricity is the dominant energy supplier at the airports. In general, the electricity is delivered by the commercial grid, and it is supplied by a power company at each airport. The airports that gained energy efficiency because of the renovation of terminal buildings showed good performances both in terms of electricity consumption per passenger (Figure 1d2) and per air-conditioned spaces (Figure 1d3). It must be pointed out that one of the airports, operating at passenger traffic volumes of about one third of its capacity, showed the worst performance in terms of electricity consumption per passenger but the best performance in terms of electricity consumption per m3 of terminal buildings.
In such a framework, action plans aimed at reducing electricity consumption would also have a robust impact on the total energy consumption of the airports, visibly decreasing the carbon footprint of overall airport activities. On the other hand, action plans aimed at decarbonising the electricity budget would decrease the carbon footprint of the airport activities, even without decreasing its electricity absorption. In fact, part of the electricity consumed at airports is already produced or is going to be produced through on-site renewable energy generation (e.g., photovoltaic systems) or “renewable-like” energy generation (e.g., combined heat and power or combined cooling, heat, and power plants). In terms of carbon footprint, the best results were scored by the airports purchasing green power (i.e., electricity generated from renewable resources) while running on-site photovoltaic systems. An important step towards zero emissions is going to be taken by Bari airport through energy efficiency interventions in buildings and a combined heat and power plant running with local biomass sources [49].
According to a survey promoted by the European Environment Agency [50], 65% of the airports reported purchasing electricity from renewable sources. Moreover, on-site renewable energy generation is done at 61% of the airports that took part in the survey [50], with the renewable energy produced on site covering 1–20% of the energy needs of 89% of these airports.
The consumption of motor fuels represents less than 20% of CO2 emissions and budgets related to the energy consumption at airports. The airports have in place or plan to implement measures aimed at decreasing the carbon footprint of vehicles (Appendix A, Table A5). The purchase of electric vehicles is the most popular mitigation action to contain the environmental impact of the airports’ vehicle fleets [50]. Fossil fuel vehicles impair the condition of the ambient air in the vicinity of the airports. For instance, diesel passenger cars release about 13 g of nitrogen oxides and more than 1 g of particulate matter per each kilogram of fuel they burn [45]. Quite obviously, switching from fossil fuel to electric vehicles would result in the decrease of local emissions of airborne pollutants.
In 2018, total GHG emissions from road transport were about 22.7% and 27.1% of the GHG national total of Italy [34] and Croatia [33], respectively.

5. Conclusions

The aim of the present paper was to evaluate the GHG savings and economic benefits associated with sustainable water and energy management at small-to-medium airports in the Adriatic region.
The airports of Dubrovnik and Pula (Croatia), and the airports of Bari, Brindisi, Pescara, and Rimini (Italy) took part in the Green and Intermodal Solutions for Adriatic Ports and Airports “ADRIGREEN” project under the Interreg V-A Italy Croatia.
Most of the analysed airports rely primarily on passenger traffic and experience seasonal peaks. From 2016 to 2018, the total passenger traffic of the Dubrovnik and Pula airports accounted for 30.7% of the Croatian passenger traffic. The total passenger traffic of the Bari, Brindisi, Pescara, and Rimini airports was about 4.5% of the Italian passenger traffic.
The airports provided data about the consumption of water, electricity, and energy for heating and company-operated vehicles for three years (2016–2018). The airports also provided information about good practices and the sustainable use of water and energy resources in place or to be implemented. Finally, they provided activity data useful for benchmarking.
Most airports have in place or plan to implement initiatives aimed at reducing water and energy footprints of the airport infrastructures.
To assess the water and energy benchmarks representative of the airports, the most plausible predictive variables were selected according to the literature relevant to the environmental benchmarking of airports. Stepwise linear regression was used to select the predictive variables most significant in explaining the datasets. Statistically significant predictive variables showed R2 values between 0.68 and 0.995. These variables were aircraft movements per year for the consumption of water; passenger per year for energy consumption of company-operated vehicles; volume of air-conditioned spaces of the terminal buildings for energy consumption for heating; and volume of air-conditioned spaces and passengers per year for electricity consumption.
Yearly water consumption ranged from 1275 to 3063 per aircraft movement. Generally, lower values of water consumption per aircraft movement were estimated at airports that have in place initiatives such as monitoring for water consumption and leaks and rainwater harvest and reuse. Water consumption per passenger likely reflects economies of scale and is influenced by the number of people likely accompanying the passengers at various airports.
Yearly energy consumption for company-operated vehicles ranged between 2.3 and 4.5 MJ per passenger. The percentage contribution of motor fuels to total energy consumption for company-operated vehicles ranked as diesel > gasoline > electricity. The budgets and CO2 emissions reflected ranks and trends observed for motor fuels consumption.
Yearly energy consumption for heating ranged from 16 to 104 MJ per m3 of air-conditioned spaces. The mix of fuel used for heating showed a positive trend in terms of sustainability, with a decrease in the use of heating oil and diesel, and an increase in the use of natural gas.
The yearly consumption of electricity was from 1.9 to 5.3 kWh per passenger and from 7.8 to 36.9 kWh per m3 of air-conditioned spaces. Between 2017 and 2018, about 61% of the electricity consumed was purchased from renewable sources, 36% was purchased from the national average power mix, and 3% was produced by on-site photovoltaic systems. Two airports achieved the goal of zeroing GHG emissions due to electricity consumption by combining on-site photovoltaic production and green electricity purchase.
CO2 emissions and budgets related to motor fuels were less than a quarter of the emissions and budgets related to electricity and energy consumption for heating. Therefore, for the transition to zero-emission airports, actions should address first energy efficiency and clean energy for electricity, heating and air conditioning, then for company-operated vehicles.
A statistical method was developed for better analysing the environmental footprint of small and medium-sized airports. The same method was successfully applied for analysing the performance of some Adriatic ports with comparable results. On such a basis, the application of the methodology to other transportation infrastructures (e.g., ports, main railway stations, and other transport hubs) could be extremely valuable. Furthermore, its application to any large-scale commercial infrastructure (e.g., malls and shopping centres) is readily foreseeable.

Author Contributions

Conceptualization, E.M. and G.P.; methodology, E.M.; resources, G.P. and F.C.; data curation, E.M.; writing—original draft preparation, E.M.; writing—review and editing, E.M., G.P., A.G., F.C. and U.R.; visualization, E.M.; supervision, G.P. and U.R.; project administration, G.P., A.G. and F.C.; funding acquisition, F.C. All authors have read and agreed to the published version of the manuscript.

Funding

This research was funded by INTERREG, grant number 10044741, for the Green and Intermodal Solutions for Adriatic Airports and Ports (ADRIGREEN) project under the Interreg V-A Italy Croatia.

Data Availability Statement

Datasets can be made available upon request and on a case-by-case basis provided the anonymity of the data.

Acknowledgments

The results and opinions presented in this paper are those of the authors. The authors are grateful to the airports’ teams members who provided useful data and shared their knowledge and opinions.

Conflicts of Interest

The authors declare no conflict of interest. Moreover, the funders had no role in the design of the study; in the collection, analyses, or interpretation of data; in the writing of the manuscript, or in the decision to publish the results.

Appendix A

Figure A1. Variation in monthly passenger traffic at Bari, Brindisi, Pescara, and Rimini airports from 2016 to 2018. The error bars show standard deviation. The authors’ own elaboration based on data from the Assaeroporti website [51]. Data about Rimini (2016) were retrieved from ENAC [52].
Sustainability 13 13156 g0a1
Table A1. Heating degree-days (own elaboration based on data retrieved from Eurostat [42]).
NUTS 3201620172018
Bari1387.231586.081331.62
Brindisi970.111202.921016.94
Dubrovnik-Neretva1304.491471.971301.86
Istria 1768.321907.821718.61
Pescara1114.061361.281389.86
Rimini1885.471830.51859.04
Table A2. Cooling degree-days (own elaboration based on data retrieved from Eurostat [42]).
NUTS 3201620172018
Bari246.12415250.19
Brindisi341.85430.35394.68
Dubrovnik-Neretva346.1403.85437.66
Istria 166.47222.69205.62
Pescara349.96378.58262.01
Rimini150.21334.29180.28
Table A3. Percentage of the six airports with initiatives aiming at reducing the water footprint of the airport infrastructures.
MeasuresAirports (%)
Training and education of airport staff67
Monitoring of water consumption 50
Harvest and reuse of rainwater33
Initiatives aiming at reducing water consumption (in place or plan to implement)50
Surface water and groundwater quality monitoring67
Initiatives to prevent groundwater pollution (in place)67
Table A4. Percentage of the six airports with initiatives aiming at reducing the energy footprint of the airport infrastructures.
MeasuresAirports (%)
On-site photovoltaic electricity production (in place or plan to implement)83
New operational and maintenance procedures to improve and optimize energy efficiency and improvements in heating, ventilation, and air conditioning83
Actions to improve management systems and energy facilities (i.e., installing new metres and a building management system in the gates area; rebuilding the terminal and purchasing new equipment; installing a cogeneration plant and improving the energy efficiency of the passenger terminal)50
LED lighting 100
Table A5. Percentage of the six airports with initiatives aiming at reducing the carbon footprint of the vehicles at the airport infrastructures.
MeasuresAirports (%)
Switching from vehicles burning diesel fuels to vehicles burning bio-fuels or powered by electricity generated from renewable sources (in place or plan to implement)83
Charging stations for electric vehicles (in place or plan to implement)100

References

  1. European Environment Agency (EEA). Aviation and Shipping—Impacts on Europe’s Environment—TERM 2017: Transport and Environment Reporting Mechanism (TERM) Report, EEA Report No. 22/2017. 2017. Available online: https://www.eea.europa.eu/publications/term-report-2017 (accessed on 9 June 2021).
  2. European Environment Agency (EEA). Transport and Environment Report 2020—Train or Plane? EEA Report No. 19/2020. 2020. Available online: https://www.eea.europa.eu/publications/transport-and-environment-report-2020 (accessed on 5 July 2021).
  3. European Commission. Communication from the Commission to the European Parliament, the Council, the European Economic and Social Committee and the Committee of the Regions Sustainable and Smart Mobility Strategy—Putting European Transport on Track for the Future. COM/2020/789 Final. 2020. Available online: https://eur-lex.europa.eu/legal-content/en/TXT/?uri=CELEX%3A52020DC0575 (accessed on 19 April 2021).
  4. European Commission. Communication from the Commission to the European Parliament, the European Council, the Council, the European Central Bank, the European Economic and Social Committee, the Committee of the Regions and the European Investment Bank Annual Sustainable Growth Strategy 2021. COM/2020/575 Final. 2021. Available online: https://eur-lex.europa.eu/legal-content/en/TXT/?uri=CELEX:52020DC0575 (accessed on 3 July 2021).
  5. Eurostat. Share of Energy from Renewable Sources. [nrg_ind_ren]. 2021. Available online: https://appsso.eurostat.ec.europa.eu/nui/show.do?dataset=nrg_ind_ren&lang=en (accessed on 3 July 2021).
  6. European Commission. Directive 2009/28/EC of the European Parliament and of the Council of 23 April 2009 on the Promotion of the Use of Energy from Renewable Sources and Amending and Subsequently Repealing Directives 2001/77/EC and 2003/30/EC. 2009. Available online: http://data.europa.eu/eli/dir/2009/28/oj (accessed on 3 July 2021).
  7. Ministry of Environment and Energy of the Republic of Croatia. Integrated National Energy and Climate Plan for the Republic of Croatia for the Period 2021–2030. 2019. Available online: https://mingor.gov.hr/UserDocsImages/UPRAVA%20ZA%20ENERGETIKU/Strategije,%20planovi%20i%20programi/hr%20necp/Integrated%20Nacional%20Energy%20and%20Climate%20Plan%20for%20the%20Republic%20of_Croatia.pdf (accessed on 2 March 2021).
  8. Republic of Croatia (Ministry of the Sea, Transport and Infrastructure). Transport Development Strategy of the Republic of Croatia (2017–2030). 2017. Available online: https://mmpi.gov.hr/UserDocsImages/dokumenti/INFRASTRUKTURA/Infrastruktura%2010_19/Transport%20Development%20Strategy%20of%20the%20Republic%20of%20Croatia%202017-2030%2029-10_19.pdf (accessed on 3 June 2021).
  9. Italian Republic (Ministry of Economic Development, Ministry of the Environment and Protection of Natural Resources and the Sea, Ministry of Infrastructure and Transport). Integrated National Energy and Climate Plan. 2019. Available online: https://ec.europa.eu/energy/sites/ener/files/documents/it_final_necp_main_en.pdf (accessed on 28 July 2021).
  10. Interreg—The portal to all Interreg programmes, financed by the EU. Available online: https://interreg.eu/ (accessed on 26 November 2021).
  11. About the Project—ADRIGREEN—Italia—Croatia. Available online: https://www.italy-croatia.eu/web/adrigreen (accessed on 26 November 2021).
  12. European Commission. Annual Analyses of the EU Air Transport Market 2016. 2017. Available online: https://ec.europa.eu/transport/sites/default/files/2016_eu_air_transport_industry_analyses_report.pdf (accessed on 9 March 2021).
  13. Martini, G.; Manello, A.; Scotti, D. The influence of fleet mix, ownership and LCCs on airports’ technical/environmental efficiency. Transp. Res. Part E Logist. Transp. Rev. 2013, 50, 37–52. [Google Scholar] [CrossRef]
  14. Airports Council International (ACI). Interim Report 2019–2020. 2021. Available online: https://www.airportcarbonaccreditation.org/aca-media/annual-reports.html (accessed on 19 May 2021).
  15. Baltazar, M.E.; Rosa, T.; Silva, J. Global decision support for airport performance and efficiency assessment. J. Air Transp. Manag. 2018, 71, 220–242. [Google Scholar] [CrossRef] [Green Version]
  16. Kılkış, Ş.; Kılkış, Ş. Benchmarking airports based on a sustainability ranking index. J. Clean. Prod. 2016, 130, 248–259. [Google Scholar] [CrossRef]
  17. Chao, C.C.; Lirn, T.C.; Lin, H.C. Indicators and evaluation model for analyzing environmental protection performance of airports. J. Air Transp. Manag. 2017, 63, 61–70. [Google Scholar] [CrossRef]
  18. Comendador, V.F.G.; Valdés, R.M.A.; Lisker, B. A holistic approach to the environmental certification of green airports. Sustainability 2019, 11, 4043. [Google Scholar] [CrossRef] [Green Version]
  19. De Castro Carvalho, I.; Calijuri, M.L.; Assemany, P.P.; e Silva, M.D.F.M.; Neto, R.F.M.; da Fonseca Santiago, A.; de Souza, M.H.B. Sustainable airport environments: A review of water conservation practices in airports. Resour. Conserv. Recycl. 2013, 74, 27–36. [Google Scholar] [CrossRef] [Green Version]
  20. Eurostat. Heating and Cooling Degree Days—Statistics. 2021. Available online: https://ec.europa.eu/eurostat/statistics-explained/index.php?title=Heating_and_cooling_degree_days_-_statistics#Heating_and_cooling_degree_days_at_EU-27_level (accessed on 3 July 2021).
  21. Krtkovaá, E.; Risto, S.; Müllerová, M. Approximated EU Greenhouse Gas Inventory Proxy GHG Emission Estimates for 2019. Eionet Report—ETC/CME 1/2020; ETC on Climate Change Mitigation and Energy: Copenhagen, Denmark, 2020. [Google Scholar]
  22. Baxter, G.; Srisaeng, P.; Wild, G. An assessment of airport sustainability, part 2—Energy management at Copenhagen Airport. Resources 2018, 7, 32. [Google Scholar] [CrossRef] [Green Version]
  23. Airports Council International (ACI). Guide to Airport Performance Measures. 2012. Available online: http://www.aci.aero/Media/aci/downloads/ACI_APM_Guidebook_2_2012.pdf (accessed on 19 November 2020).
  24. Baxter, G.; Srisaeng, P.; Wild, G. An assessment of airport sustainability: Part 3—Water management at Copenhagen Airport. Resources 2019, 8, 135. [Google Scholar] [CrossRef] [Green Version]
  25. Kotopouleas, A.; Nikolopoulou, M. Thermal comfort conditions in airport terminals: Indoor or transition spaces? Build. Environ. 2016, 99, 184–199. [Google Scholar] [CrossRef] [Green Version]
  26. Jakubcionis, M.; Carlsson, J. Estimation of European Union service sector space cooling potential. Energy Policy 2018, 113, 223–231. [Google Scholar] [CrossRef]
  27. Alba, S.O.; Manana, M. Energy research in airports: A review. Energies 2016, 9, 349. [Google Scholar] [CrossRef] [Green Version]
  28. Greer, F.; Rakas, J.; Horvath, A. Airports and environmental sustainability: A comprehensive review. Environ. Res. Lett. 2020, 15, 103007. [Google Scholar] [CrossRef]
  29. Carlucci, F.; Cirà, A.; Coccorese, P. Measuring and explaining airport efficiency and sustainability: Evidence from Italy. Sustainability 2018, 10, 400. [Google Scholar] [CrossRef] [Green Version]
  30. Airports Council International Europe|ACI Europe—Regional Airports Forum. Available online: https://www.aci-europe.org/regional-airports-forum (accessed on 26 November 2021).
  31. Zuidberg, J. Exploring the determinants for airport profitability: Traffic characteristics, low-cost carriers, seasonality and cost efficiency. Transp. Res. Part A Policy Pract. 2017, 101, 61–72. [Google Scholar] [CrossRef]
  32. Virdis, M.R.; Gaeta, M.; Ciorba, U.; D’Elia, I. Impatti Energetici e Ambientali dei Combustibili nel Riscaldamento Residenziale. 2017. Available online: https://www.enea.it/it/seguici/pubblicazioni/pdf-volumi/v2017-impatti-combustibili-nel-riscaldamento.pdf (accessed on 1 April 2021).
  33. Republic of Croatia (Ministry of Environment and Energy). Croatian Greenhouse Gas Inventory for the Period 1990–2018 (National Inventory Report 2020). 2020. Available online: http://www.haop.hr/sites/default/files/uploads/dokumenti/012_klima/dostava_podataka/Izvjesca/NIR_2020_eng.pdf (accessed on 1 March 2021).
  34. Romano, D.; Arcarese, C.; Bernetti, A.; Caputo, A.; Contaldi, M.; Coredlla, M.; De Lauretis, R.; Di Cristofaro, E.; Gagna, A.; Gonella, B.; et al. 2020. Italian Greenhouse Gas Inventory 1990–2018—National Inventory Report 2020; ISPRA–Institute for Environmental Protection and Research: Rome, Italy, 2020. Available online: https://www.isprambiente.gov.it/it/pubblicazioni/rapporti/italian-greenhouse-gas-inventory-1990-2018.-national-inventory-report-2020 (accessed on 3 May 2021).
  35. Istituto Superiore per la Protezione e la Ricerca Ambientale (ISPRA). Tabella Parametri Standard Nazionali. 2016. Available online: https://www.minambiente.it/sites/default/files/archivio/allegati/emission_trading/tabella_coefficienti_standard_nazionali_2013_2015_v2.pdf (accessed on 16 June 2021).
  36. Istituto Superiore per la Protezione e la Ricerca Ambientale (ISPRA). Tabella Parametri Standard Nazionali. 2017. Available online: https://www.minambiente.it/sites/default/files/archivio/allegati/emission_trading/tabella_coefficienti_standard_nazionali_31122017.pdf (accessed on 16 June 2021).
  37. Istituto Superiore per la Protezione e la Ricerca Ambientale (ISPRA). Tabella Parametri Standard Nazionali. 2018. Available online: https://www.mite.gov.it/sites/default/files/archivio/allegati/emission_trading/tabella_coefficienti_standard_nazionali_11022019.pdf (accessed on 16 June 2021).
  38. European Commission. Directive 2009/33/EC of the European Parliament and the Council of 23 April 2009 on the Promotion of Clean and Energy-Efficient Road Transport Vehicles. Available online: http://data.europa.eu/eli/dir/2009/33/oj (accessed on 20 March 2021).
  39. Smith, G. Step away from stepwise. J. Big Data 2018, 5, 32. [Google Scholar] [CrossRef]
  40. Draper, N.R.; Smith, H. Applied Regression Analysis; John Wiley & Sons: Hoboken, NJ, USA, 1998; Volume 326, pp. 307–312. [Google Scholar]
  41. Passerini, G.; Mancinelli, E.; Morichetti, M.; Virgili, S.; Rizza, U. A preliminary investigation on the statistical correlations between SARS-CoV-2 spread and local meteorology. Int. J. Environ. Res. Public Health. 2020, 17, 4051. [Google Scholar] [CrossRef] [PubMed]
  42. Eurostat. Cooling and Heating Degree Days by NUTS 3 Regions—Monthly Data [nrg_chddr2_m]. 2021. Available online: http://appsso.eurostat.ec.europa.eu/nui/show.do?dataset=nrg_chddr2_m&lang=en (accessed on 3 July 2021).
  43. European Investment Bank (EIB). EIB Project Carbon Footprint Methodologies—Methodologies for the Assessment of Project GHG Emissions and Emission Variations. 2020. Available online: https://www.eib.org/attachments/strategies/eib_project_carbon_footprint_methodologies_en.pdf (accessed on 9 January 2021).
  44. Koffi, B.; Cerutti, A.; Duerr, M.; Iancu, A.; Kona, A.; Janssens-Maenhout, G. CoM Default Emission Factors for the Member States of the European Union—Version 2017, European Commission, Joint Research Centre (JRC) [Dataset]. 2017. Available online: http://data.europa.eu/89h/jrc-com-ef-comw-ef-2017 (accessed on 1 December 2020).
  45. Ntziachristos, L.; Samaras, Z. EMEP/EEA Air Pollutant Emission Inventory Guidebook 2019. 2019. Available online: https://www.eea.europa.eu/publications/emep-eea-guidebook-2019/part-b-sectoral-guidance-chapters/1-energy/1-a-combustion/1-a-3-b-i/view (accessed on 1 October 2020).
  46. Loprieno, A.D.; Scalbi, S.; Tonon, D.; Zamagni, A. Update—Italian Database Emission Factors. 2017. Available online: https://climfoot-project.eu/download/689 (accessed on 19 October 2020).
  47. European Commission. Commission Staff Working Document—Evaluation of the Council Directive 2003/96/EC of 27 October 2003 Restructuring the Community Framework for the Taxation of Energy Products and Electricity {SWD (2019) 332 Final}. 2019. Available online: https://ec.europa.eu/taxation_customs/sites/taxation/files/energy-tax-report-2019.pdf (accessed on 19 March 2021).
  48. European Commission. Council Directive 2003/96/EC of 27 October 2003 Restructuring the Community Framework for the Taxation of Energy Products and Electricity (Text with EEA Relevance). Available online: http://data.europa.eu/eli/dir/2003/96/oj (accessed on 19 March 2021).
  49. Assaeroporti. Il Sistema Aeroportuale Italiano—Cardine e Protagonista dello Scenario Socio-Economico del Paese. 2017. Available online: http://www.assaeroporti.com/wp-content/uploads/censis/Rapporto-Censis-Assaeroporti-Completo.pdf (accessed on 3 May 2021).
  50. European Environment Agency (EEA). European Aviation Environmental Report. 2019. Available online: https://www.easa.europa.eu/eaer/system/files/usr_uploaded/219473_EASA_EAER_2019_WEB_LOW-RES_190311.pdf (accessed on 18 June 2021).
  51. Statistiche Dati di Traffico Aeroportuale Italiano |Assaeroporti. Available online: https://assaeroporti.com/statistiche/ (accessed on 26 November 2021).
  52. Ente Nazionale per l’Aviazione Civile (ENAC). Dati Traffico 2016. 2016. Available online: https://www.enac.gov.it/repository/ContentManagement/information/N1512426776/Dati_di_Traffico_2016_update_novembre%202017.pdf (accessed on 19 March 2021).
Figure 1. Airports’ consumptions of water and energy between 2016 and 2018 plotted versus the respective significant predictive variables (left column) and performance indicator values (right column). Panels a1, b1, c1, and d1 show yearly consumption of water, energy for heating, company-operated vehicles, and electricity, respectively. The right column shows comparisons of the performance indicator values for (a2) water, energy for (b2) heating, (c2) company-operated vehicles, and (d2,d3) electricity between airports A, B, C, D, E, and F. Plots (c1,c2) report data provided by four airports (i.e., A, B, C, and D). AC = Air-conditioned.
Sustainability 13 13156 g001
Figure 2. Benchmark of CO2 emissions derived from energy consumption for (a) heating buildings per air-conditioned spaces and (b) company-operated vehicles per passenger, and electricity consumption per (c) passenger and (d) air-conditioned spaces. Panel (b) shows data provided by 4 airports (i.e., A, B, C, and D). Dashed lines show median values. AC = Air-conditioned.
Sustainability 13 13156 g002
Figure 3. Benchmarks of budgets related to the consumption of (a) water per aircraft movement; energy for (b) heating buildings per air-conditioned spaces and (c) company-operated vehicles per passenger; and electricity per (d) passenger and (e) air-conditioned spaces at A, B, C, D, E, and F airports. Panel (c) shows budget data provided by 3 airports (i.e., A, B, and C). Dashed lines show median values. AC = Air-conditioned.
Sustainability 13 13156 g003
Figure 4. Percentage contribution of diesel, gasoline, and electricity to (i) energy consumption, (ii) CO2 emissions, and (iii) budget related to company-operated vehicles at the airports. Data were provided by 4 airport authorities (i.e., A, B, C, and D).
Sustainability 13 13156 g004
Figure 5. Percentage contribution of diesel, heating oil, and natural gas at the airports to (i) energy consumption, (ii) CO2 emissions, and (iii) budget for heating buildings.
Sustainability 13 13156 g005
Figure 6. Percentage of electricity consumption purchased from national average power generation mix or renewable energy sources, and from on-site photovoltaic generation. Data about 2016 electricity consumption provided by 3 airports not shown.
Sustainability 13 13156 g006
Figure 7. Percentage of (i) CO2 emissions and (ii) budget related to energy consumption for heating, electricity, and company-operated vehicles at the airports. Data about consumption of motor fuels were provided by 4 airports (i.e., A, B, C, and D).
Sustainability 13 13156 g007
Table 1. Literature relevant to the environmental indicators for managing the consumption of water, energy, and GHG emissions at airports.
Environmental IndicatorDescription (Unit)Reference
Carbon footprint CO2 emissions per passenger traffic workload unit (g)Baxter et al. [22]
CO2 emissions per passenger (GHG·passenger−1)Baltazar et al. [15]
CO2 emissions (t CO2; t CO2·passenger−1; t CO2·unit energy−1)Kılkış and Kılkış [16]
Energy consumptionUtilities energy usage per square metre of the terminal (kWh·m−2)
Renewable energy purchased by the airport as a percentage of total energy consumption (%)
Airports Council International [23]
Baltazar et al. [15]
Total energy consumption per aircraft movement (MWh), and workload unit (kWh·(100·kg)−1)Baxter et al. [22]
Energy consumption (toe; toe·passenger−1)Kılkış and Kılkış [16]
Water consumption Water   consumption   per   passenger   ( ·passenger−1)Airports Council International [23]
Baltazar et al. [15]
Water withdrawal (m3)Kılkış and Kılkış [16]
Total ,   drinking   and   second   quality   water   consumption   ( m 3 ;   ·passenger−1; m3·aircraft movement−1)Baxter et al. [24]
toe—Tonne of oil equivalent.
Table 2. Environmental characteristics and certifications of the investigated airports.
AirportIATA CodeRegionCountryDistance from Nearby City (km)ManagementCertifications
*BariBRIApuliaItaly9PublicISO 14001:2004;
ISO 9001
*BrindisiBDSApuliaItaly5PublicISO 14001:2004
ISO 9001
DubrovnikDBVAdriatic CroatiaCroatia22PublicISO 14001;
Airport carbon accreditation
PescaraPSRAbruzzoItaly4PrivateISO 9001:2015
PulaPUYAdriatic CroatiaCroatia6PublicISO 9001
RiminiRMIEmilia-RomagnaItaly8PrivateNone
*Bari and Brindisi airports have the same managing authority.
Table 3. Summary of the data provided by the airport authorities for assessing the yearly consumption of water, electricity, and energy.
Consumption Data
Water Water provided by local providers
Electricity Electricity purchased from the commercial grid and/or produced on-site
Energy for heating the buildings Fossil fuel consumptions (i.e., diesel fuel, heating oil, and natural gas)
Energy for company-operated vehicles Overall consumptions: fossil fuel (i.e., diesel fuel, and gasoline) and electricity consumptions
Table 4. National net calorific value and CO2 emission factors for the fuels used for heating at the airports from 2016 to 2018.
Unit of Measure for NCVNCV
(Year of Reference)
EF
[kg CO2 GJ−1]
Country
Heating oil (MJ·kg−1)40.19 a
(2016–2018)
77.4 aCroatia
Diesel for heating (MJ·kg−1)42.71 a
(2016–2018)
74.1 aCroatia
Diesel for heating(MJ·kg−1)42.877 b
(2016–2018)
73.578 bItaly
Natural gas(MJ·scm−1)35.0197 c (2016)
35.134 d (2017)
35.253 e (2018)
57.512 bItaly
NCV—Net calorific value; EF—emission factor. a [33]; b [34]; c [35]; d [36]; e [37].
Table 5. The predictive variables considered to describe the consumption of water and energy at the airports.
Response VariablesPredictive Variables
Number of Passengers (–)Number of Aircraft Movements (–)Air-Conditioned Spaces (m3)Cooling Degree-Days (–)Heating Degree-Days (–)
Water   ( )YesYesYesYesNo
Electricity (kWh)YesYesYesYesNo
Energy for heating the terminal buildings (MJ)YesYesYesNoYes
Energy for company-operated vehicles (MJ)YesYesYesNoNo
Table 6. National CO2 emission factors for electricity and motor fuels.
CountryElectricity Consumption Including Network Losses at Low-Voltage Grids (+7%)
(g CO2·kWh−1)
Electricity Generation/Consumption from Renewable Energy Sources
(g CO2·kWh−1)
Diesel Oil
(kg CO2·GJ−1)
Gasoline
(kg CO2·GJ−1)
Croatia253 a0 d74.10 b69.3 b
Italy269 a0 d73.648 c
a [43]; b [33]; c [34]; d [44].
Table 7. The airports’ budgets for energy and water consumption expressed in terms of the statistically significant predictive variables.
Unit Cost for the Predictive Variable
Water €·aircraft movement−1
Energy for heating€·(m3 of air-conditioned spaces)−1
Energy for company-operated vehicles€·passenger−1
Electricity€·passenger−1
€·(m3 of air-conditioned spaces)−1
Publisher’s Note: MDPI stays neutral with regard to jurisdictional claims in published maps and institutional affiliations.

