Article

Analysis of the Effect of Cooperatives on Increasing Farmers’ Income from the Perspective of Industry Prosperity Based on the PSM Empirical Study in Shennongjia Region

1
Management School, South-Central University for Nationalities, Wuhan 430074, China
2
Research Center for Digital Development and Governance in Ethnic Regions, Wuhan 430074, China
*
Author to whom correspondence should be addressed.
Sustainability 2021, 13(23), 13172; https://doi.org/10.3390/su132313172
Submission received: 14 October 2021 / Revised: 22 November 2021 / Accepted: 25 November 2021 / Published: 28 November 2021

Abstract

:
“Industry prosperity”, as a key content of the Rural Revitalization Strategy, is an effective way to increase farmers’ income, agricultural development and rural prosperity. Cooperatives have the functions of serving, assisting and enriching the people and are an important organizational carrier for achieving rural industry prosperity. This paper uses the propensity score-matching model and the field survey data of Dajiuhu Town, Shennongjia, Hubei Province to study the effect of farmers’ participation in cooperatives on their net income by means of quantitative analysis. The empirical results show that (1) farmers’ participation in cooperatives can improve their net income level; (2) the education level of farmers has a significant effect on their participation in cooperatives; (3) household factors, production and management characteristics and external environment also have an important effect on farmers’ participation. Based on the above conclusions, this research proposes the encouragement of farmers to actively participate in cooperatives, improve their education level, vigorously improve rural infrastructure and enhance farmers’ self-development efficiency to promote the continuous increase of farmers’ incomes, and give rise to the positive role of cooperatives in rural development, in order to realize the revitalization and sustainable development of rural areas.

1. Introduction

As an intermediate economy that connects the macro economy and the micro economy, industry is not only an important engine for promoting national or regional economic growth, but also an important means for driving employment and increasing residents’ income. As a gathering place of advantageous resources, cities are extremely attractive to industrial development, while rural areas are in a weak position for industrial participation due to factors such as geographic location and resource endowments. As the world’s economic development links deepen and the breadth of openness increases, the development gap between urban and rural areas has gradually increased. Rural areas mainly comprise primary industry, and the ability of farmers to resist risks is weak. With the increased intensity of environmental shocks, changes in natural factors such as climate pose a severe threat to agricultural livelihoods. Rural areas are extensive and the population is large [1]. How to improve its ability to increase income, improve the diversification of sustainable livelihoods and realize the improvement of the sustainability of farmers’ own development capacity is important for social stability and sustainable rural construction [2].
In 2017, the Chinese government proposed the implementation of the Rural Revitalization Strategy, and cooperatives are valued by the government for their functions of serving, helping and enriching the people. Cooperatives have been repeatedly mentioned in the No.1 central document in recent years. From cultivating and developing cooperatives in 2018, to focusing on the new agricultural operating entities of farmers’ cooperatives in 2019, and improving the interest connection mechanism of “farmers + cooperatives”, to focusing on cultivating farmers’ cooperatives in 2020, and cultivating agricultural industrialization consortium and encouraging the development of various forms of moderately scaled operations in 2021, and promoting the quality improvement of farmers’ cooperatives.
Cooperatives have played a prominent role in poverty reduction and development in China’s rural areas. As China’s poverty alleviation task is fully completed and the Rural Revitalization Strategy is fully launched, methods by which poverty-stricken areas can further stabilize their sources of income and promote the continuous improvement of their income capacities is worthy of consideration. In addition, there are still many poor areas around the world, and removing poverty and achieving sustainable livelihoods are the primary problems for poor areas. Considering that industrial poverty alleviation has played an important role in the process of poverty alleviation in Shennongjia, we decided that through in-depth research, using this area as an example, the effectiveness of cooperatives at increasing farmers’ incomes was clarified, and successful experiences and effective measures are summarized, which not only have an important impact on the realization of income sustainability and rural prosperity in this region but also provide a certain reference for regions in similar situations around the world.
Therefore, this study uses the PSM model to examine the difference between participating and nonparticipating cooperatives on the income of farmers and to explore ways to achieve sustainable income growth for farmers. The reason for adopting this method is that if we directly compare the differences between those participating in cooperatives and those who do not, it is easy to produce systematic deviation. Therefore, under a counterfactual framework, a random simulation experiment is created using the PSM matching resampling method to find a group of farmers who do not participate in cooperatives with similar characteristics to farmers participating in cooperatives, solving the effect of sample biased estimation, in order to observe the impact of participating in cooperatives on farmers’ income. In addition, the prosperity of rural industry is an important content of rural revitalization. The existing research on rural industry is mostly carried out from the development of rural leisure industry, e-commerce and other market value and economic and financial aspects. The development of these types of industries requires high re-source endowment conditions in rural areas. However, rural areas are vast, the development base varies greatly in different places, and they do not have complete universality. Therefore, in view of the characteristics of rural heterogeneity, by studying the industrial development organization of cooperatives, considering its role in the development of rural industries and exploring ways to realize the prosperity of rural industries and increase farmers’ incomes, we wish to look at this from the perspective of sociology.

2. Literature Review

A cooperative is a special form of economic organization spontaneously formed under the condition of market economic systems [3]. It organizes individual farmers into action groups to overcome production and market restrictions and solves the shortcomings of small farmers’ fragmentation and dispersion. It is an ideal organizational form for agricultural producers [4,5]. In the cooperative practice of farmers, democracy, solidarity, and autonomy are the three main cooperative values [6]. As an institutional arrangement, the establishment of cooperatives comes from the pursuit of potential profits [7].Through organizational innovation, scattered small farmers are organized to form a relatively close connection, realize self-management and self-service, gain the advantages of economies of scale and resource agglomeration, help farmers solve problems that they cannot solve alone, improve their organization level and promote the connection between small farmers and the big market [8,9,10]. As its core, it is the formation of collective strength through the unity of vulnerable groups, changing the vulnerable status of farmers into mutual assistance. By leveraging the framework of the cooperative system, integrating the power of dispersed farmers enhances their ability to resist risks, reduces the internal and external costs of production, increases employment and income levels, and improves the economic division of labor and specialization of farmers, thereby improving the economic and social aspects of members statues so that they can obtain better development opportunities and achieve fairness [11,12].
Through combing the relevant studies on farmers’ cooperatives around the world, it can be seen that there is basically a consensus on the role of cooperatives in improving members’ income [13]. The functions of farmers’ cooperatives mainly focus on providing socialized services, as well as economic growth, quality safety, etc., among which the economic functions are mainly reflected in the existence of scale advantages and promoting farmers’ income [14]. It also involves improving the technical efficiency of farmers [15]. With the goal of improving production, marketing and livelihoods, cooperatives are a way to reduce high transaction costs as well as serving multiple purposes, such as increasing member income and improving productivity and product quality [16,17]. Cooperatives effectively improve the technical efficiency of members by providing support to farmers, and then promote the productivity and commercialization of small farmers [18]. Different scholars have different research conclusions on the benefits to farmers of different sizes. Some believe that small-scale farmers can benefit more [19,20], while others think that the larger can [21]. Aiming at how to realize the sustainable development of cooperatives, Boone believes that cooperatives have the disadvantage of expensive coordination costs and that increasing the participation rate of members will curb coordination costs and help maintain the durability of the cooperative [22]. Meador believes that the key element of building a sustainable development cooperative is the ability of the cooperative manager. The person in charge should have the ability to pay attention to the overall interests of the members and formulate business strategies in line with the social environment so as to ensure that the cooperative can achieve the dual purpose of adapting to the market and motivating members [23]. Chinese scholars have conducted in-depth research on cooperatives from different angles. From the perspective of internal governance mechanisms, through an empirical analysis of survey data from Nanjing, Suzhou, and Lianyungang, it was found that increasing education for members can improve the competitiveness of cooperatives and promote the continuous increase of farmers’ income [24]. Affected by factors such as factor endowment and resource differences, farmers have experienced multidimensional differentiation, and cooperatives can narrow the differentiation gap between farmers and promote the realization of rural revitalization [25]. From the perspective of participation mode, with the help of the multi-value processing effect model, the collected micro-survey data of cooperative members in Sichuan Province was analyzed, and it was found that when members change from passive participation to loose participation and close participation, their income can be significantly increased [26]. In terms of performance, based on an analysis of the data of 561 farmers in 16 provinces through the two-stage method, it was found that participating in cooperatives has a significant effect in income increase [27]. From the empirical point of view, analyzing the panel data of 644 grain family farms, it was found that participating in cooperatives can significantly increase the average net income of family farms [28]. According to the micro-survey data of Yunnan Province for empirical analysis, joining cooperatives can not only promote the farmers’ income growth but also benefit their family development, and the income increasing function of cooperatives is more prominent for low-income farmers [29].
In addition, some scholars have conducted research on the poverty reduction effect of cooperatives. Cooperatives can connect the poor with the rich, integrate social resources in poor areas, effectively guide poor groups into society and create income-increasing opportunities for the poor. Moreover, in the face of many challenges, such as economic globalization, expanding the organizational network of cooperatives will help more poor farmers benefit [30,31,32]. Chikwendu found that poor women in Nigeria increased their access to healthcare, economic opportunities, and decision-making power by participating in cooperatives [33]; Basu compared the effect of farmers’ cooperatives on two villages in India on farmers’ poverty alleviation, and found that dairy cooperatives played a stronger role in promoting farmers’ poverty alleviation [34]; Verhofstadt and Maertens analyzed the income of 154 participating cooperatives and 235 non-cooperative farmers in the Muhanga region of Rwanda and found that cooperatives effectively increased the income of farmers and reduced rural poverty [35]. Chinese scholar Liu Junwen took Shandong and Guizhou provinces as examples to study the effect of professional farmer cooperatives on the income and stability of poor farmers, and found that it had a significant income-promoting effect on poor and low-income farmers, but it was more helpful to poor households [36].

3. Research Method

In this paper, we adopted the propensity score matching (PSM) model to investigate whether participating in cooperatives has an effect on farmers’ net income by considering the heterogeneity of farmers between participating and non-participating cooperatives. The reason for adopting the PSM method is that if you directly compare the difference in net income of farmers who do or do not participate in a cooperative, it is easy to produce systematic deviations. Because whether to participate in the cooperative is a self-choice made by farmers based on their own actual situation, in reality, there are some factors that affect farmers’ decision making whether to participate in the cooperative, such as farmers’ education level, the amount of family labor, agricultural land area and other individual heterogeneous factors. The basic conditions for whether farmers participate in cooperatives differ, and there is a problem of sample self-selection. If the existence of this problem is ignored and the regression estimation is carried out directly, the results are biased. Therefore, under a counterfactual framework, a random simulation experiment is created using the PSM matching resampling method to find a group of farmers who do not participate in cooperatives with similar characteristics to farmers participating in cooperatives, to solve the effect of sample biased estimation, and to observe the effect of participating in cooperatives on farmers’ net income.
The process of propensity value analysis can be divided into three steps. The first step is to use the Logit model to estimate the fitted value of the conditional probability of each farmer participating in the cooperative, that is, the propensity score value.
P ( x i ) =   Pr [ T   = 1 | X i ] = exp ( β x i ) 1 +   exp ( β x i )
In Equation (1), T represents the processing variable. When T = 1, it indicates that farmers participate in cooperatives. When the value is equal to 0, it indicates that farmers do not participate in cooperatives, X i representing the covariates that affect farmers’ participation in cooperatives, such as age, education level, etc. The propensity score can be obtained using Formula (1) so as to obtain the probability of farmers participating in cooperatives.
The second step is to match samples with the same or similar propensity values from the experimental group and the control group into pairs. The propensity value is simplified into a one-dimensional value through multi-dimensional covariates, but if one-to-one matching is strictly used, it may not find a match. Moreover, due to the different weights and matching values of different matching methods, in order to ensure the robustness of matching results, this paper also adopts five other matching methods on the basis of one-to-one matching, including nearest neighbor matching (k = 4), caliper (k = 4), radius matching, kernel matching, and local linear regression matching.
The third step is to conduct a matching analysis, that is, to estimate the average treatment effect (ATT) to obtain the effect of participating in cooperatives on the net income of farmers.
A T T = E   [ Y 1 i Y 0 i ] = E   [ Y 1 i Y 0 i | T = 1 ] = E   [ Y 1 i | T = 1 ] E   [ Y 0 i | T = 0 ]
Y 1 i represents the income effect of farmers’ participation in cooperatives, Y 0 i represents the income effect of farmers’ nonparticipation in cooperatives. E   [ Y 1 i | T = 1 ]   is the observable part in reality, that is, the expectation of farmers’ net income from participating in cooperatives, while E   [ Y 0 i | T = 1 ]   is an unobservable situation, which represents the expectation of farmers’ net income from not participating in cooperatives on the basis of being counterfactual. By using the PSM method, a group of farmers who do not participate in cooperatives with similar characteristics to farmers participating in cooperatives is obtained, and E   [ Y 0 i | T = 1 ] is estimated by observing their income. The difference between the two results is the effect of participating in cooperatives on farmers’ net income.
The application of the propensity score-matching method also needs to meet two assumptions: (1) negligibility and (2) mean negligibility.
Assuming that the meaning of (1) is given to x i , the influence of ( y 0 i , y 1 i ) on T i can be ignored, that is, the distribution of processing group and control group is exactly the same; thus,
F   ( y 0 i , y 1 i | x i , T i = 1 ) = F   ( y 0 i ,   y 1 i | x i , T i = 0 )
Suppose (2) that given x i , the mean values of y 0 i and y 1 i   are independent of T i ; that is E   ( y 0 i | x i , T i ) = E   ( y 0 i | x i ) and E   ( y 1 i | x i , T i ) = E   ( y 1 i | x i ) .

4. Data and Descriptive Analysis

4.1. Data Source and Variable Definition

The empirical data of this paper was mainly obtained through a field survey in the Shennongjia area of Hubei Province from July to September 2020. The survey participants were farmers in Dajiuhu town in Shennongjia. The data were gathered by means of a household questionnaire survey. A total of 1244 valid questionnaires were finally obtained after sorting and statistics. The questionnaire involved four levels of information. The first is the basic information of the individual farmers, such as gender, age and education level; second, the characteristics of farmers’ families, including the number of family members, the number of family members in school, the number of labor force, housing area and energy type; third, the production and operation status of farmers, including the number of migrant workers, working time, agricultural land area and whether they have production power; fourth, the external environment, including whether they have network and the distance from the village trunk road. The questionnaire contains the question of “whether to participate in the cooperative” and provides the information of farmers’ annual household income and annual expenditure, so it is very suitable for the problem to be investigated in this paper. The definition and description of variables are shown in Table 1.
  • Result variable. In order to ensure the reliability of the data, this paper mainly uses the net income of farmers as the measurement index. Because the selected area is in the Chinese region, in order to facilitate comparison with similar studies in the world, the RMB income is converted into US dollars according to the exchange rate standard and then the logarithm is taken. The net income of farmers is a continuous variable, and the unit is dollar per person per year.
  • Dependent variables. The dependent variable is whether the farmers participate in the cooperative. If they participate in the cooperative, it is assigned 1; otherwise, it is assigned 0.
  • Control variables. This paper selects the individual characteristics, family characteristics, production and management characteristics and external environment of the interviewed farmers as the control variables. Specific variables and descriptions are shown in Table 1.
First, the individual characteristic information of farmers includes gender, age and culture. Second, the information on the characteristics of farmers’ families mainly include the number of family members, number of laborers, as well as number of students in school, housing area and whether they use clean energy. The third is the production and operation characteristics of farmers, the number of migrant workers, the working time, the area of agricultural land and whether they have production power. The fourth is the external environment, including whether they have network and the distance from the main road of the village.

4.1.1. Individual Characteristics of Farmers

Gender differences make farmers form different views on whether to participate in cooperatives. Age also has an effect on cognition. Younger farmers generally have a higher acceptance of new things. Education level will also affect judgment and decision making because, generally speaking, the higher the education level of farmers, the better their understanding of the role of cooperatives in increasing income, thus likely having a positive effect on their participation in cooperatives.

4.1.2. Household Characteristics of Farmers

Farmers’ behavioral decisions are rational. The number of family members and the number of family students in school directly determine the burden of their families. The amount of labor force reflects the strength of the family production capacity. The size of housing area is the performance of family life quality and also reflects the economic capacity of farmers’ families. The use of clean energy is not only an important part of ecological civilization construction in the process of rural revitalization but is also the embodiment of family economic conditions.

4.1.3. Characteristics of Farmers’ Production and Management

The number of migrant workers and their working hours reflects the external income of the family while the amount of agricultural land area determines the income of farmers’ agricultural operation. For farmers with less agricultural land, they may be willing to participate in the final bonus by participating in cooperatives and contributing labor and other production factors so as to increase their income. Farmers with larger agricultural land area tend to carry out large-scale production through cooperatives to reduce production costs. Cooperatives have the function of helping farmers and can help farmers solve some problems they cannot solve by themselves. Electricity, as an important power source of production activities, is widely used in all aspects of rural life. Some farmers may have no source of production power due to their geographical location and family economic conditions, and they will tend to seek the help of cooperatives.

4.1.4. External Environment

Cooperatives are new types of agricultural business entities, and many farmers’ understandings of cooperatives are still the traditional impression—knowledge of their contemporary role in connecting small farmers and modern agricultural development is lacking. Network is an important tool for rural areas to understand social information and has a considerable effect on farmers’ behavioral decisions. The village main road is the channel between the countryside and the outside world. Usually, infrastructure along the main road is better, and there are more people flowing along the main road, which can also promote the dissemination of information to a certain extent and can have an effect on farmers’ participation in cooperatives.

4.2. Descriptive Analysis

After removing the missing values, the statistical results of relevant samples show that the overall sample of respondents was 1244, of which 611 households participate in cooperatives, accounting for 49.12%, and 633 households did not participate, accounting for 50.88%. The ratio between the two was almost 1:1. The overall average net income was 5710 USD, with the participating group being 6003 USD, higher than the average, while the other group was lower, with a mean of 5486 USD. The descriptive statistical results show in Table 2.
From the results of the mean, the participating group has higher mean values in gender, amount of labor force, number of migrant workers, number of family school students, family members, working time, whether they have a network, housing area, and cultural variables than those of nonparticipants. The nonparticipating group has higher values in age, agricultural land management area, whether they have production power, distance from village trunk road, and whether they use clean energy than the participating group. The differences in mean results indicates that there are systematic differences in observable characteristics between the two groups. However, the difference in means does not imply causality. To show whether the difference between the two is statistically significant, the t-test is used to test the difference between the two groups.
According to the results of the t-test, at the level of individual characteristics of the farmers, the mean difference between the age of the participating group and the nonparticipating group was about four years old. The result of the t-test was significant but negative. The possible reason is that younger people are more accepting of new things. Moreover, the Shennongjia area was originally a poverty-stricken area, and older groups lack the initiative to overcome poverty, while young people more strongly pursue higher living standards and have a strong need to change the status quo. There were 711 males, accounting for 57.15% of the sample, and 533 females, accounting for 42.85%, but the test results were not significant, and the t-values of the three different levels of education were all significant. Farmers with education levels have higher understanding and cognitive abilities, and their minds are relatively open. Moreover, their ability to accept new things is higher, which has a certain effect on the decision making of farmers.
In terms family characteristics, the number of households, the number of laborers, and the use of clean energy were statistically significant. The larger the number of households, the greater the livelihood expenditure required by the household, the stronger the demand for income, and they are thus more willing to increase income through a variety of ways, so the probability of seeking to participate in cooperatives to increase their income is also greater. The statistical value of the number of laborers reaches 5.44. The number of laborers indirectly reflects the size of the family. Due to the risk aversion, families with more laborers will engage in a variety of business activities to improve their income. With regard to using clean energy as a way of expressing the family’s quality of life, its t-value is negative. From the perspective of usage, users account for 21.22%, and non-users account for 78.78%. The possible reason is that the use proportion is low, which has little actual effect on farmers.
In terms of the characteristics of farmer production and operation, the results of t-values of the number of migrant workers and working time were 5.68 and 4.02, respectively, which are statistically significant. Most migrant workers are young and middle-aged, while young and old workers stay in the family. Limited by the difference in working abilities between the young and the old, they are unable to engage in business operations and have livelihood needs, so they tend to participate in cooperatives through land stocks and other methods to obtain a certain income. The results of the area of agricultural land and whether electricity is used for production are not significant. The possible reason is that some farmers do not have land but participate in cooperatives by contributing labor and other factors. Regarding the use of production power, 55.06% of them have it and 44.94% do not. There is little difference between the two, so its actual effect is not significant.
In the external environment, the t-test result of whether having network is connected is significant, with a t-value of 2.93. As an important channel for obtaining external information, it can be used to obtain information on relevant national policies in time and to provide a certain reference for individual decision making. However, the distance to the main village road is not significant. The possible reason is that the rural households live in the same areas, the rural areas are not large and the communication methods are mostly neighborhood communication and the information can be shared to a certain extent, so the effect is not significant.

5. Empricial Analysis

Using the PSM method, we must first perform a logit regression to select the variable to be matched. However, because the coefficients of logit regression obtained in PSM are of no practical significance, it is necessary to conduct the marginal processing effect and then judge the effect based on the marginal effect. The model performs well according to the percentage of correct predictions, which is 76% (The experimental results in Table A1 and Table A2 in Appendix A). The estimation results obtained for the dependent variable in the logit model have little substantive meaning and can therefore safely be omitted, and the significance of the dependent variables does not need to be focused on because the estimated coefficients of dependent variables are likely to be biased anyway in practical applications. Instead, the marginal effects of the main variables should be rather focused on [37,38].

5.1. Match Estimation Result

In order to obtain more accurate and robust estimation results, we calculate the estimates using six matching methods: one-to-one matching, close neighbor matching, one-to-four matching in caliper, radius matching, kernel matching and local linear regression matching. The estimation results of propensity score matching are shown in the Appendix A Table A3. In order to improve the efficiency of matching, the one-to-four matching method is selected for close neighbor matching. For caliper matching, the propensity score should be calculated first. The calculated propensity score is 0.07. To be conservative, a caliper range of 0.05 is selected. Both kernel matching and local linear regression matching use the default kernel function and bandwidth. The kernel matching uses the eqan kernel by default; the default bandwidth is 0.06. The local linear regression matching uses tricubic kernel by default and the default bandwidth is 0.8 [39]. Although the selection of kernel function and bandwidth parameters will affect the final estimated processing effect [40], the Smith and Todd study found that the difference between the function and the bandwidth selection is not big; that is, the processing effect estimated by the kernel matching method is not sensitive to the choice of the kernel function and the bandwidth parameter [41]. The standard error after regression does not fully consider the fact that the propensity score is estimated; therefore, the standard error is obtained by adopting the Bootstrap method.
Table 3 shows the estimated effect of farmers’ participation in cooperatives on their net income. In order to improve the robustness of the research results, different matching methods are used for estimation. The results obtained by different evaluation methods are not significantly different, at least significant at the 5% level, and the ATT value ranges from 0.105 to 0.121, among which the nearest neighbor matching, radius matching and kernel matching are all significant at 1%. The monetary value ranges from 601 USD to 687 USD. The largest effects (687 USD) are estimated by caliper algorithm, and the lowest effects are one-to-one matching (601 USD). The results show that participating in cooperatives has a positive impact on the increase of farmers’ net income.
The above results show that farmers’ participating in cooperatives has a positive role in improving their net income level. The reason is that farmers enhance their ability to resist risks and reduce costs by participating in cooperatives. The mutual assistance among cooperative members improves production efficiency and promotes the increase of income.

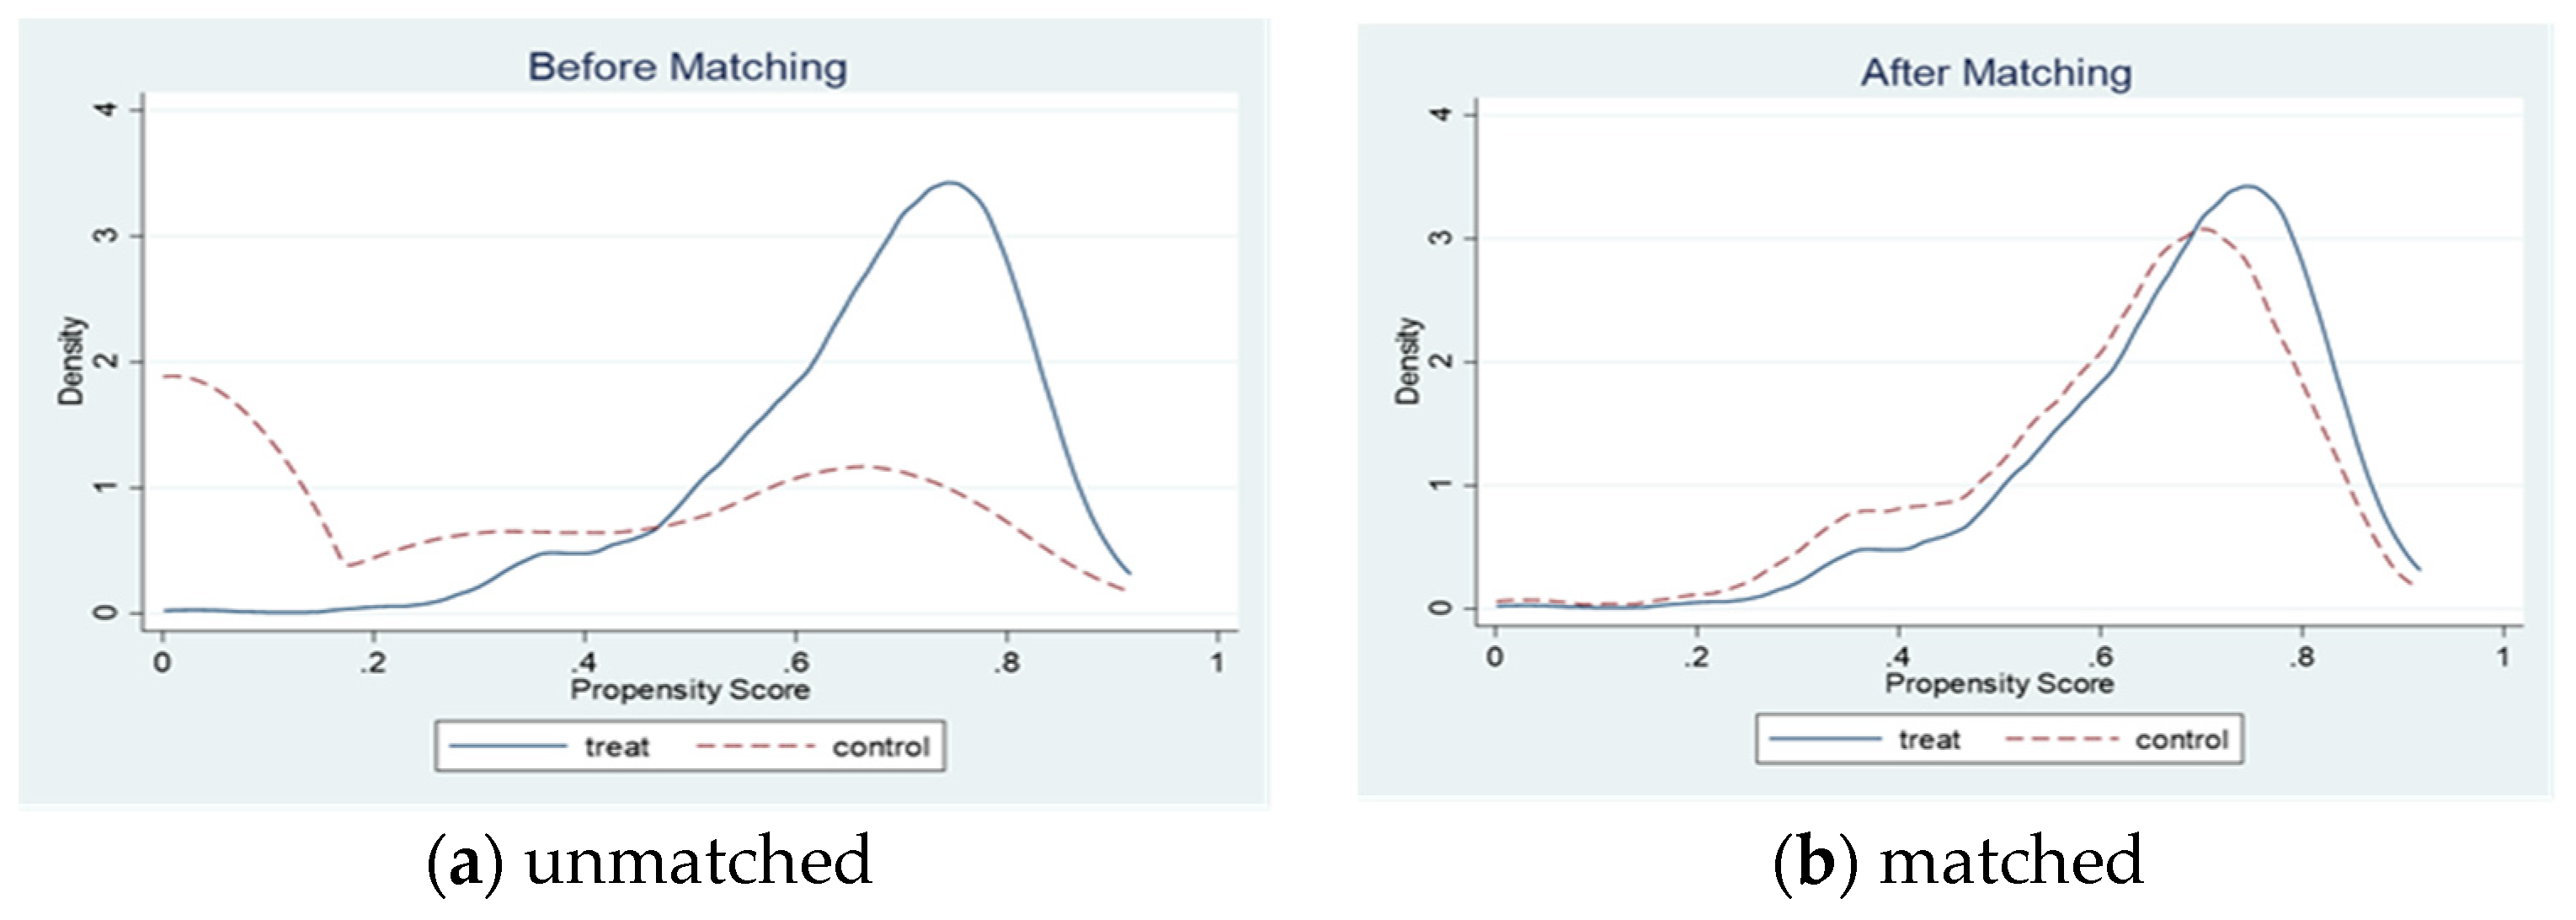
5.2. Common Support Hypothesis

Figure 1 is the propensity score kernel density function diagram obtained according to the estimation results of the logit model. The solid line in the figure indicates the farmers that participate in cooperatives, and the dotted line indicates that farmers do not participate in cooperatives. Figure 1a shows the distribution of the propensity score kernel density function of the treatment group and the control group before matching. It can be found that the distribution of the treatment group and the control group before matching is quite different, Figure 1b presents the distribution of kernel density function after matching. It can be seen that the trend of density function diagram of treat group and control group after matching is highly similar, indicating that the propensity scores of farmers who do and do not participate in cooperatives basically overlap, the sample characteristics are closer, and the matching effect is better. Thus, the common support hypothesis is satisfied.

5.3. Matching Quality and Sensitivity Analysis

In order to ensure the validity of the estimation results and the quality of the treatment effect, a balance test is required. We first test for balance of covariates between the treated and untreated groups before and after matching for each treatment variable. In general, the results after matching are satisfactory, the difference between the treatment group and the control group is significantly reduced, the standardization deviation is within 10%, and the result of the t-test shows that there is no obvious difference between the two groups (The balance test results are shown in Table A3 in the Appendix A). The reason why the distance from the village trunk road failed to pass the balance test may be that farmers live densely. Although some farmers are not close to the village trunk road, they can obtain relevant information in time from conversations with their neighbors. Therefore, it can be considered that the variables selected in this paper are effective after matching, and the matching estimation results are reliable. In order to further ensure the estimation quality after matching, the matching method used in the paper is also tested for balance to observe whether there is a systematic difference between the treatment group and the control group after matching (The match quality test in Table A4). The results of various statistics after matching are significantly reduced compared with those before matching, the B values are all reduced to less than 25%, and the R values are all within the interval of [0.5, 2]. The test result shows that the matching result significantly reduces the difference between the treatment group and the control group, and it reduces the sample selection bias to the greatest extent.
Finally, PSM relies on the conditional independence assumption. That is, estimates of treatment effects based on matching are unbiased if all relevant covariates are included in the model and no unobservable confounding factors exist, which is a rather restrictive assumption [42]. Therefore, a common concern of matching models is that they may fail to account for relevant covariates that are not observable to researchers. Thus, a sensitivity analysis is necessary. We adopt the Rosenbaum bounds to test the sensitivity. As shown in Table 4, our result is robust according to the threshold gamma. This means that the statistical significance of the ATT for net income would be questionable if the odds ratio of joining cooperatives between enrolled and non-enrolled farmer differed by more than 1.80 [43].

6. Conclusions and Suggestions

6.1. Conclusions

Cooperatives can help farmers solve the problems of capital shortage, backward technology and information asymmetry in production, reduce the risk of individual small farmers facing the market directly, improve farmers’ market negotiation position and reduce transaction costs (Glove and Goldsmith) [44,45]. An agricultural cooperation system is an important way for farmers to improve their economic status, and the economic benefits of cooperation are significant for small-scale farms [46]. For Getnet based on the data analysis of Ethiopia, it is found that cooperatives play a positive role in supporting people’s livelihood development and poverty reduction, reducing the instability and vulnerability of the livelihood of the poor, improving the overall quality and income of poor farmers [47]. The cooperatives are considered to be an important factor in increasing farmers’ income. Relevant studies have proved that cooperatives are beneficial to poverty, but whether they can help farmers remove poverty and achieve sustainable income growth is still inconclusive. Therefore, in the context of China’s poverty alleviation, we consider that cooperatives have played a prominent role in China’s poverty reduction and Shennongjia is a typical area. Through in-depth study of the role of cooperatives in increasing farmers’ income, we can supplement the existing research and explore an effective path for farmers in poor areas to achieve sustainable income growth. We demonstrate the application of propensity score matching, together with quality and robustness checks, as a means to address self-selection issues that may confound analysis of income differences attributable to cooperatives. By comparing farmers who join cooperatives to observationally equivalent control farmers through PSM, we reduce the impact of selection bias on our estimates of farmers net income differentials.
Our primary empirical contribution is the validation of qualitative claims that cooperatives can improve famer’s income. We find that participating in cooperatives can effectively promote the net income of farmers. The net income of farmers participating in cooperatives is 601–687 USD more than the income of those not participating. This finding compares with the finding of Hoken that cooperatives have the effect of income increasing [48]. In addition, the education level, family members and the distance from the main road of the village have a significant impact on farmers’ participation in cooperatives. The reason is that the higher the education level, the more they can realize the advantages of cooperatives in increasing income. A large number of family laborers can provide more output and enhance their ability to deal with risks, and the distance from the main road of the village can affect whether the farmers obtain relevant information in a relatively timely manner, which may promote farmers’ awareness of cooperative organizations. This is consistent with Kumar findings [49].
This study verifies that cooperatives play a significant role in increasing farmers’ income, but some scholars hold different views. For example, Ofori used the survey data of farmers in two provinces of Cambodia to control the institutional and member heterogeneity of cooperatives and used the propensity score matching method to study the impact of commercial vegetable cooperatives on members’ agricultural performance. The results showed that the agricultural income of members who joined cooperatives did not increase [50]. Excluding issues such as country and policy response, different research conclusions also make us think. First, the use of PSM ameliorates but does not eliminate the challenge of producing reliable treatment effects in instances in which observational participants self-select into a treatment [43]. While robustness checks give us confidence in our study results, the potential remains that unobserved heterogeneity linked to the decision to engage in cooperatives may also be affecting farmers net income. We should adopt an instrumental variable method to deal with the unobservable bias, but considering the focus of this study, the difficulty of data acquisition and the time limit, the method including the combination of PSM and other instrumental variable techniques cannot be adopted. In the next research, we will focus on solving this problem. Second, this paper takes Shennongjia as an example, which has strong pertinence, but the universality is relatively insufficient. In the future research, the research scope will be further expanded to enhance the universality of the research conclusions, so as to provide more powerful support for the sustainable increase of farmers’ income.

6.2. Suggestions

First, we should encourage farmers to actively participate in cooperatives. From the analysis results, the income of farmers participating in cooperatives is higher than that of nonparticipating farmers. Therefore, it is necessary to actively increase the participation rate of farmers in order to take advantage of the role of cooperatives in raising farmers’ income. The government department should first increase the publicity of cooperatives to let more farmers know about cooperatives, let farmers understand the role of cooperatives in improving income, and reduce misunderstandings. In addition, it is necessary to give play to the guiding role of policies, provide policy support, so that farmers can reduce their worries, and then guide farmers to participate in cooperatives to promote the formation of decentralized management to collective cooperation to improve risk resistance and resource utilization efficiency. Local grassroots organizations should also actively respond to the policy, calling on farmers to participate in cooperatives or even establishing cooperatives on their own according to the actual situation of the region, forming a demonstration effect and increasing farmers’ enthusiasm for participating in cooperatives.
Second, we should strive to improve the education level of farmers. The level of education will affect the cognitive level of farmers and thus affect their decision making. First of all, we should carry out quality education for all farmers and popularize basic cultural knowledge so that they can establish a certain cultural foundation, know and understand social development trends, social policies, etc. Additionally, we should carry out higher-level education for farmers with a certain cultural foundation, so as to act as the leader of rural development and drive the development of farmers. For rural technical farmers, such as farmers with rich experience in planting and breeding, technical education can be carried out to improve their technical and business capabilities and then they can use their technical advantages in cooperatives to help members solve their problems in the production process.
Third, we should vigorously improve rural infrastructure. The backwardness of infrastructure not only affects the convenience of production and life in a region, but also is not conducive to the inflow of external resources. Through the implementation of road construction projects and network construction projects, it can be ensured that farmers can not only communicate with the outside world, but can also obtain timely information and interact with the virtual world. Farmers should understand the state of social development and improve their ideological cognition, thereby improving their ability to accept new things and reducing the probability of making adverse decisions due to conservative thinking. In addition, the improvement of infrastructure also has a positive effect on the production and living conditions of farmers. The entry of external resources can bring capital, technology and other factors to improve the relatively backward production conditions in the local area. The improvement of production conditions leads to the improvement of output efficiency so as to improve the income level of farmers.
Fourth, enhance the self-development efficiency of farmers. The general population of rural families is relatively large and the burden on young people in the family is heavier, which affects the performance of their effectiveness. The government should actively solve the problems of the elderly and children in the family and reduce the pressure on the youth and middle-aged groups. The government should provide relatively comprehensive social security and appropriate welfare subsidies for the elderly and certain living allowances for school students to reduce the cost of family living. At the same time, the implementation of people’s livelihood construction projects, the transformation of rural dilapidated houses, and an increase in the clean energy utilization rate will not only benefit the improvement of local people’s livelihoods but also provide certain jobs or contracts to local cooperatives and give technical guidance during the implementation process. It not only reduces the burden on farmers, but also provides a certain channel for them to increase their income, thereby raising farmers’ life expectations and enhancing their self-development efficiency.

Author Contributions

Conceptualization, M.W. and B.H.; methodology, B.H. and Y.J.; investigation and data collection, Y.J. and J.Z.; software processing, B.H.; validation, M.W. and J.Z.; writing-original draft preparation, B.H. and Y.J.; writing-review and editing, M.W. and J.Z.; supervision, B.H. and Y.J. All authors have read and agreed to the published version of the manuscript.

Funding

This research was funded by the Major Projects of National Social Science Foundation-- Research on monitoring and early warning mechanism of poverty return risk in the post-2020 period from the perspective of big data (Grant No.19AGL029).

Institutional Review Board Statement

Not applicable.

Informed Consent Statement

Not applicable.

Data Availability Statement

Not applicable.

Acknowledgments

The authors thank the Research Center for Digital Development and Governance in Ethnic Regions and National Social Science Foundation for their financial support.

Conflicts of Interest

The authors declare no conflict of interest.

Appendix A

Table A1. Logit marginal effect.
Average Marginal Treatment EffectMarginal Effect at Sample Mean
dy/dxStd. Err.zp > |z|dy/dxStd. Err.zp > |z|
Age0.000.003.450.001 **0.000.003.250.001 **
Gender−0.060.03−2.120.034 **−0.070.04−2.070.038 **
Number of laborers 0.040.022.390.017 **0.060.032.320.021 **
Number of migrant workers−0.070.02−3.630.000 ***−0.010.03−3.410.001 **
Number of family members in school−0.030.02−1.300.194−0.040.03−1.290.198
Family members−0.020.02−1.030.304−0.020.02−1.020.307
Working time(months)0.000.001.410.1590.000.001.400.163
Agricultural land management area−0.000.00−1.060.287−0.000.00−1.060.289
Whether have production power0.040.021.540.1240.050.031.520.128
Whether have network0.140.052.710.007 **0.180.072.610.009 **
Distance from village trunk road−0.030.01−3.930.000 ***−0.040.01−3.650.000 ***
Housing area−0.000.00−0.190.850−0.000.00−0.190.850
Clean energy or not−1.070.15−6.940.000 ***−1.430.11−13.570.000 ***
Primary school0.210.036.460.000 ***0.280.055.390.000 ***
Junior school0.320.057.190.000 ***0.430.085.760.000 ***
Senior school and above0.310.065.470.000 ***0.410.084.770.000 ***
Net income0.220.045.760.000 ***0.300.065.000.000 ***
Note: **, *** are significant at the level of 5% and 1%, respectively
Table A2. Logit model accurate prediction ratio.
ClassifiedD~DTotal
+530211741
81422503
total6116331244
SensitivityPr(+|D)86.74%
SpecificityPr(−|~D)66.67%
Positive predictive valuePr(D|+)71.52%
Negative predictive valuePr(~D|-)83.90%
False + rate for true ~DPr(+|~D)33.33%
False-rate for true DPr(−|D)13.26%
False + rate for classified+Pr(~D|+)28.48%
False-rate for classified−Pr(D|−)16.10%
Correctly classified76.53%
Table A3. Balance test.
VariableMatch Whether or NotMeanBias (%)Difference (%)t Test
TreatControltp > |t|
AgeUnmatched49.6553.69−23.6 −4.170.000
Matched49.6749.590.598.00.090.931
GenderUnmatched0.580.563.1 0.550.584
Matched0.580.59−2.036.1−0.350.728
Number of laborersUnmatched2.792.4230.8 5.440.000
Matched2.782.706.678.51.210.226
Number of migrant workersUnmatched1.861.5232.2 5.670.000
Matched1.851.823.389.80.590.553
Number of family members in schoolUnmatched0.800.773.8 0.670.506
Matched0.800.729.1−140.01.590.112
Family membersUnmatched4.203.8221.4 3.760.000
Matched4.194.076.967.81.240.214
Working timeUnmatched5.254.1322.8 4.020.000
Matched5.255.40−3.086.7−0.530.595
Agricultural land management areaUnmatched54.1261.11−6.8 −1.200.231
Matched54.1057.23−3.155.2−0.640.521
Whether have production powerUnmatched0.540.56−3.5 −0.620.535
Matched0.540.532.625.10.460.646
Whether have networkUnmatched0.960.9216.5 2.910.004
Matched0.960.960.795.70.150.882
Distance from village trunk roadUnmatched0.520.57−3.2 −0.570.570
Matched0.520.398.3−156.22.560.010
Housing areaUnmatched118.43116.047.4 1.310.191
Matched118.32119.76−4.539.8−0.730.466
Clean energy or notUnmatched0.000.42−118.3 −20.670.000
Matched0.000.000.0100.00.001.000
Primary schoolUnmatched0.570.4622.1 3.890.000
Matched0.570.61−9.258.2−1.630.103
Junior
school
Unmatched0.230.1229.6 5.230.000
Matched0.230.207.973.31.260.207
Senior school and aboveUnmatched0.110.0714.0 2.470.014
Matched0.110.103.475.50.560.578
Table A4. Matching quality.
Item Ps   R 2 LR   c h i 2 p > |t|MeanBiasMedBiasBR%Var
One to one matching0.01017.230.3054.53.423.91.4138
Nearest neighbor matching (k = 4)0.0058.560.8993.74.616.81.1225
Caliper (k = 4)0.0058.560.8993.74.616.81.1225
Radius matching (0.05)0.0047.580.9393.12.715.81.1413
Kernel matching0.0057.780.9323.22.816.01.1613
Local linear regression matching0.01017.320.3054.53.423.91.4138

References

  1. Saradr, A.; Kiani, A.K.; Kuslu, Y.; Bilgic, A. Examining The Role of Livelihood Diversification as a Part of Climate-Smart Agriculture (CSA) Strategy. J. Agric. Fac. 2020, 51, 79–87. [Google Scholar]
  2. Kiani, A.K.; Sardar, A.; Khan, W.U.; He, Y.; Bilgic, A.; Kuslu, Y.; Raja, M.A.Z. Role of Agricultural Diversification in Improving Resilience to Climate Change: An Empirical Analysis with Gaussian Paradigm. Sustainability 2021, 13, 9539. [Google Scholar] [CrossRef]
  3. Yuan, P. On the essential attributes of cooperatives and the basic conditions for the development of Chinese farmers’ professional cooperative economic organizations. Rural. Manag. 2006, 8, 16–21+15. [Google Scholar]
  4. Francesconi, G.N.; Ruben, R. The Hidden Impact of Cooperative Membership on Quality Management: A Case Study from the Dairy Belt of Addis Ababa. J. Entrep. Organ. Divers. 2012, 1, 85–103. [Google Scholar] [CrossRef]
  5. Mojo, D.; Fischer, C.; Degefa, T. The determinants and economic impacts of membership in coffee farmer cooperatives: Recent evidence from rural Ethiopia. J. Rural. Stud. 2017, 50, 84–94. [Google Scholar] [CrossRef]
  6. Forney, J.; Haberli, I. Co-operative values beyond hybridity: The case of farmers’ organisations in the Swiss dairy sector. J. Rural. Stud. 2017, 53, 236–246. [Google Scholar] [CrossRef]
  7. Pan, J. Chinese Farmer Cooperatives: Interpretation Behind the Data. China Rural. Obs. 2011, 2–11, 94. [Google Scholar]
  8. Jiang, C.Y. Research on the Development Relationship between Leading Enterprises, Farmer Cooperatives and Family Farms. Soc. Sci. Front. 2018, 58–67. [Google Scholar]
  9. Ye, J.Z.; Dou, S.L.; Zhang, M.H. Small farmers and modern agricultural development: How to organically connect? China Rural. Econ. 2018, 11, 64–79. [Google Scholar]
  10. Zhao, X.F.; Xu, Z.Z. The construction of cooperative promotion mechanism for the development of farmer cooperatives and rural revitalization: Theoretical logic and practical path. J. Yunnan Adm. Inst. 2019, 6–11. [Google Scholar]
  11. Guo, L.L. Analysis of the promotion policy for the development of farmer cooperative organizations. China Rural. Econ. 2006, 4–11, 37. [Google Scholar]
  12. Huang, Z.H.; Shao, K. The nature of cooperatives and their drift. J. Zhejiang Univ. Humanit. Soc. Sci. Ed. 2009, 11–16. [Google Scholar]
  13. Grashuis, J.; Magnier, A. Product differentiation by marketing and processing cooperatives: A choice experiment with cheese and cereal products. Agribusiness 2018, 34, 813–830. [Google Scholar] [CrossRef]
  14. Liang, Q.; Dong, H. Looking at the development of my country’s farmer cooperatives based on relevant researches on farmer cooperatives at home and abroad—Based on a review of relevant literature from 2015 to 2018. Issues Agric. Econ. 2019, 86–98. [Google Scholar]
  15. Ma, W.; Renwick, A.; Yuan, P.; Ratna, N. Agricultural cooperative membership and technical efficiency of apple farmers in China: An analysis accounting for selectivity bias. Food Policy 2018, 81, 122–132. [Google Scholar] [CrossRef]
  16. Fischer, E.; Qaim, M. Linking Smallholders to Markets: Determinants and Impacts of Farmer Collective Action in Kenya. World Dev. 2012, 40, 1255–1268. [Google Scholar] [CrossRef] [Green Version]
  17. Sebhatu, K.T.; Gezahegn, T.W.; Berhanu, T.; Maertens, M.; Van Passel, S.; D’Haese, M. Exploring variability across cooperatives: Economic performance of agricultural cooperatives in northern Ethiopia. Int. Food Agribus. Manag. Rev. 2021, 24, 397–419. [Google Scholar] [CrossRef]
  18. Abate, G.T.; Francesconi, G.N.; Getnet, K. Impact of agricultural cooperatives on smallholders’ technical efficiency: Empirical evidence from ethiopia. Ann. Public Coop. Econ. 2014, 85, 257–286. [Google Scholar] [CrossRef] [Green Version]
  19. Chagwiza, C.; Muradian, R.; Ruben, R. Cooperative membership and dairy performance among smallholders in Ethiopia. Food Policy 2016, 59, 165–173. [Google Scholar] [CrossRef]
  20. Ma, W.; Abdulai, A. Does cooperative membership improve household welfare? Evidence from apple farmers in China. Food Policy 2016, 58, 94–102. [Google Scholar] [CrossRef]
  21. Shumeta, Z.; Haese, M.D. Do coffee cooperatives benefit farmers? An exploration of heterogeneous impact of coffee cooperative membership in Southwest Ethiopia. Int. Food Agribus. Manag. Assoc. 2016, 19, 37–62. [Google Scholar] [CrossRef]
  22. Christophe, B.; Serden, O. Strategic Choices at Entry and Relative Survival Advantage of Cooperatives versus Corporations in the US Bio-Ethanol Industry, 1978–2015. J. Manag. Stud. 2015, 53, 1113–1140. [Google Scholar]
  23. Meador, J.; Savoie, R.; O’Brien, D.J.; Cook, M.L.; Grothe, G.; Werner, L.; Diang’A, D. Building sustainable smallholder cooperatives in emerging market economies: Findings from a five—year project in Kenya. Sustainability 2016, 8, 656–670. [Google Scholar] [CrossRef] [Green Version]
  24. Zhang, X.H.; Jin, S.H.; Zhou, L. Research on the impact of professional cooperatives on farmers’ income increase from the perspective of internal governance mechanism. J. Agric. For. Econ. Manag. 2020, 431–438. [Google Scholar]
  25. Hu, P.B.; Luo, L.Q. Cooperative construction and rural revitalization under the background of farmers’ multidimensional differentiation. Issues Agric. Econ. 2020, 53–65. [Google Scholar]
  26. Liu, Y.Y.; Zhang, S.M.; Fu, X.H. Can farmers’ professional cooperatives increase the income of their members?—An investigation based on the participation model. Rural. Econ. 2019, 71–79. [Google Scholar]
  27. Zhang, J.H.; Feng, K.W.; Huang, Y.W. An Empirical Study on the Performance of Farmers’ Professional Cooperatives in Increasing Farmers’ Income. China Rural. Econ. 2012, 4–12. [Google Scholar]
  28. Lai, X.D.; Du, Z.X.; Gao, L.L. An Empirical Analysis of the Impact of Joining Cooperatives on the Income of Grain Family Farms—Based on Panel Data of 644 Grain Family Farms in China. J. Nanjing Agric. Univ. Soc. Sci. Ed. 2021, 143–154. [Google Scholar]
  29. Xu, Y.; Tang, Y.J.; Shao, H.M.; Ma, L.L. Does joining a cooperative increase the income level of farmers? An empirical analysis based on the micro-survey data of Yunnan Province. West. Econ. Manag. Forum 2019, 32–41. [Google Scholar]
  30. Majee, W.; Hoytb, A. Cooperatives and Community Development: A Perspective on the Use of Cooperatives in Development. J. Community Pract. 2011, 19, 48–61. [Google Scholar] [CrossRef]
  31. Simmons, R.; Birchall, J. The role of co-operatives in poverty reduction: Network perspectives. J. Socio Econ. 2008, 22, 2131–2140. [Google Scholar] [CrossRef]
  32. Wanyama, F.; Develtere, P.; Pollet, I. Encountering the Evidence: Cooperatives and Poverty Reduction in Africa; Catholic University of Leuven: Leuven, Belgium, 2008. [Google Scholar]
  33. Chikwendu, E. Women, Cooperatives and Economic Recovery in Nigeria. Dialect. Anthropol. 1997, 22, 353–371. [Google Scholar] [CrossRef]
  34. Basu, P.; Chakraborty, J. Land Labor and Rural Development: Analyzing Participation in India’s Village Dairy Cooperatives. Prof. Geogr. 2008, 60, 299–313. [Google Scholar] [CrossRef]
  35. Verhofstadt, E.; Maertens, M. Can Agricultural Cooperatives Reduce Poverty? Heterogeneous Impact of Cooperative Mem-bership on Farmers’ Welfare in Rwanda. Appl. Econ. Perspect. Policy 2015, 37, 86–106. [Google Scholar] [CrossRef] [Green Version]
  36. Liu, J.W. The impact of farmers’ professional cooperatives on the income and stability of poor farmers—A case study of Shandong and Guizhou provinces. Chinas Rural Econ. 2017, 39–54. [Google Scholar]
  37. Cinelli, C.; Hazlett, C. Making sense of sensitivity: Extending omitted variable bias. J. R. Stat. Soc. 2020, 82, 39–67. [Google Scholar] [CrossRef] [Green Version]
  38. Keele, L.; Stevenson, R.T.; Elwert, F. The causal interpretation of estimated associations in regression models. Political Sci. Res. Methods 2020, 8, 1–13. [Google Scholar] [CrossRef]
  39. Chen, Q. Advanced Econometrics and Stata Application, 2nd ed.; Higher Education Press: Beijing, China, 2014; pp. 537–556. [Google Scholar]
  40. Su, Y.S. Propensity Score Matching Methods: Fundamentals and Applications; Chongqing University Press: Chongqing, China, 2017; pp. 43–45. [Google Scholar]
  41. Smith, J.; Todd, P. Does Matching Overcome Lalonde’s Critique of Nonexperimental Estimators? University of Western Ontario, Centre for Human Capital and Productivity (CHCP): London, ON, Canada, 2003; pp. 305–353. [Google Scholar]
  42. Schilling, B.J.; Attavanich, W.; Jin, Y. Does Agritourism Enhance Farm Profitability? J. Agric. Resour. Econ. 2014, 39, 69–87. [Google Scholar]
  43. Schilling, B.J.; Attvanich, W.; Sullivan, K.P.; Marxen, L.J. Measuring the effect of farmland preservation on farm profitability. Land Use Policy 2014, 41, 84–96. [Google Scholar] [CrossRef]
  44. Glover, D.J. Contract farming and smallholder outgrower schemes in less-developed countries. World Dev. 1984, 12, 1143–1157. [Google Scholar] [CrossRef]
  45. Goldsmith, A. The private sector and rural development: Can agribusiness help the small farmer? World Dev. 1985, 13, 1125–1138. [Google Scholar] [CrossRef]
  46. Ito, J.; Bao, Z.; Su, Q. Distributional effects of agricultural cooperatives in China: Exclusion of smallholders and potential gains on participation. Food Policy 2012, 37, 700–709. [Google Scholar] [CrossRef]
  47. Getnet, K.; Anullo, T. Agricultural Cooperatives and Rural Livelihoods:Evidence from Ethiopia. Ann. Public Coop. Econ. 2012, 181–198. [Google Scholar] [CrossRef]
  48. Hoken, H.; Su, Q. Measuring the effect of agricultural cooperatives on household income: Case study of a rice-producing cooperative in China. Agribusiness 2018, 34, 831–846. [Google Scholar] [CrossRef]
  49. Kumar, A.; Saroj, S.; Joshi, P.K.; Takeshima, H. Does cooperative membership improve household welfare? Evidence from a panel data analysis of smallholder dairy farmers in Bihar, India. Food Policy 2018, 75, 24–36. [Google Scholar] [CrossRef] [Green Version]
  50. Ofori, E.; Sampson, G.S.; Vipham, J. The effects of agricultural cooperatives on smallholder livelihoods and agricultural performance in Cambodia. Nat. Resour. Forum 2019, 43, 218–229. [Google Scholar] [CrossRef]
Figure 1. Distribution of tendency score function before and after matching.
Sustainability 13 13172 g001
Table 1. Variable definitions.
Variable TypeVariable NameDescription Note
Outcome VariableNet IncomeContinuity Variable(dollar)Take Logarithm:LN
Treatment variableWhether to join cooperativesYes = 1, no = 0
Control variablesIndividual characteristicsGenderMen = 1, women = 0
AgeContinuity variable
Educationeducation1Primary school = 1, other = 0
education2Junior school = 1, other = 0
education3Senior school and above = 1, other = 0
Family
characteristics
Family membersContinuity variableUnit:pieces
Number of family members in schoolContinuity variableUnit:pieces
Number of laborersContinuity variableUnit:pieces
Housing areaContinuity variableUnit:square meters
Energy typeClean energy = 1, non clean energy = 0
Farmer production and operation characteristicsNumber of migrant workersContinuity variableUnit:piece
Working timeContinuity variableUnit:month
Agricultural land management areaContinuity variableUnit:mu (The sum of cultivated land area, effective irrigation area, forest land area and returning farmland to forest area)
Whether have production poweryes = 1, no = 0
External
environment
Whether have networkyes = 1, no = 0
Distance from village trunk roadContinuity variableUnit:kilometre
Table 2. Descriptive statistical results.
VariableSample JoinNot Joint-TestProportional
MeanSDMeanSDMeanSDEqual = 1Equal = 0
Age51.7017.2449.6416.3053.6917.88−4.17 ***
Gender0.570.500.580.500.560.500.55711
(57.15%)
533
(42.85%)
Number of laborers2.601.222.791.262.421.165.44 ***
Number of migrant workers1.681.061.860.991.521.105.68 ***
Number of family members in school0.800.870.810.870.770.870.67
Family members4.011.804.201.723.821.853.77 ***
Working time(months)4.684.955.255.054.134.794.02 ***
Agricultural land management area57.68102.8054.1292.0261.11112.19−1.02
Whether have production power0.550.500.540.500.560.50−0.62685
(55.06%)
559
(44.94%)
Whether have network0.950.230.960.200.920.262.93 ***1173
(94.29%)
71
(5.71%)
Distance from village trunk road0.551.570.520.910.572.01−0.57
Housing area117.2132.11118.4332.16116.0432.041.31
Clean energy or not0.210.410.000.040.420.50−21.04 ***264
(21.22%)
980
(78.78%)
Primary school0.510.500.570.500.460.503.89 ***635
(51.05%)
609
(48.95%)
Junior school0.170.380.230.420.120.325.21 ***213
(17.12%)
1031
(82.88%)
Senior school and above0.100.290.110.310.070.262.46 ***113
(9.08%)
1131
(90.92%)
Net income8.65
(5710)
0.528.70
(6003)
0.428.61
(5486)
0.603.37 ***
Observations1244611
(49.12%)
633
(50.88%)
(Note: data are present as n (%) *** are significant at the level of 1%, respectively; the net income are present as log form (monetary value USD)).
Table 3. Propensity score matching results.
Match TypeSampleTreatControlATTSET
One to one matchingUnmatched60335464569 3.35 ***
Matched602754266010.0482.17 **
Nearest neighbor matching(k = 4)Unmatched60335464569 3.35 ***
Matched602753406870.0432.82 ***
Caliper(k = 4)Unmatched60335464569 3.35 ***
Matched602753406870.0432.82 ***
Radius matching(0.05)Unmatched60335464569 3.35 ***
Matched602754046230.0422.61 ***
Kernel matchingUnmatched60335464569 3.35 ***
Matched602753996280.0422.63 ***
Local linear regression matchingUnmatched60335464569 3.35 ***
Matched602754156120.0492.21 **
(Note: **, *** are significant at the level of, 5% and 1%, respectively).
Table 4. Sensitivity analysis with Rosenbaum bounds.
Critical p-Value for Gammas
Treatment Variable: Whether to Join Cooperatives
GammaSig+Sig−
11.2 × 10–151.2 × 10⁻¹⁵
1.12.6 × 10–120.000
1.21.0 × 10–90.000
1.31.2 × 10–70.000
1.45.2 × 10–60.000
1.50.0000.000
1.60.0010.000
1.70.0070.000
1.80.0300.000
1.850.0540.000
1.90.0900.000
Notes: Gamma, log odds of differential assignment due to unobserved factors; sig+, upper bound significance level; sig−, lower bound significance level. The boxed numbers indicate the critical level of the strength of the effect, Gamma for each of the dependent variables.
Publisher’s Note: MDPI stays neutral with regard to jurisdictional claims in published maps and institutional affiliations.

