Abstract
This study aims to analyze the effects of COVID-19 on actors in the informal economy in Cameroon. To analyze the effects of the COVID-19 crisis on actors in the informal economy, we use secondary data from the National Institute of Statistics (NIS). These data come from a survey of 1310 households. We performed data analysis using comparative methods and a labor market participation model that considers changes in people’s behavior towards health risks in order to explore and compare empirical results with earlier studies. From this analysis, it was revealed that job losses are more important in the informal sector (and, in particular, among men). We note that the absence of wearing a mask decreases the chances of having an informal job and of being suspended from one’s job during the crisis. Likewise, time restrictions that are not appreciated by workers will push actors more towards the informal sector. These results lead to recommendations that contribute towards providing support or direct support to informal workers in the sector.
1. Introduction
Due to the lack of connection with the formal economy, people often consider the informal economy to be spared from economic shocks. Indeed, since it does not register them with administrative authority, the actors of the informal economy often escape the rules decreed by the government and, consequently, the economic shocks affecting the formal sector which create jobs for poor populations in response to earlier crises. Thus, it reflects a resilience effect in the face of crises [1]. However, the sudden onset of the current health crisis called into question this response capacity by highlighting the limits of informal activities and the difficulties these actors face without government intervention [2]. Measures taken by the government have effects on informal workers more than other sections. In particular, the mandatory (partial or total) confinement rules resulting from the COVID-19 health crisis called this lemma into question [3,4].
Indeed, even informal workers had to stop working for a while. Most organizations and researchers, therefore, believe that the impact of COVID-19 on the labor market in Africa will take disproportionate effects on vulnerable populations, young people, and women who are most active in the workplace informal sector or who have only occasional employment opportunities in the formal one (AFDB 2020; UN Cameroon 2020; WIEGO, 2020). Thus, with COVID-19, the government has adopted in developing countries varied policy measures, ranging from cash transfers for the poor to multifaceted support for small businesses. However, the precarious state of public finances in Sub-Saharan Africa (SSA) has limited the capacity of governments in the region to implement expansionary fiscal stimulus plans. Looking ahead, it remains to be seen what the overall effect of the pandemic will be on employment and livelihoods in the region, and whether the policy responses adopted so far suffice to address the adverse effects of the pandemic, especially for informal workers [5,6,7,8].
In Cameroon, the first measures took place in March 2020, after the detection of the first cases in February. There were thirteen (13) measures ranging from the closure of borders to the ban on urban and interurban travel and the ban on gatherings of over fifty (50) people. On 24 March, the government, following many breaches, reinforced these measures and on 1 April they had endorsed and extended those measures for a further fortnight. On 9 April 2020, the government instituted a generalization of the wearing of masks in all spaces open to the public, the intensification of the COVID-19 screening campaign, and the systematic sanction of any violator of the restrictive measures in force and confinement imposed on people at risk. Following the GICAM report, to relieve the sectors severely affected by the pandemic, the government took nineteen (19) relaxation measures. Among which, fiscal and social measures, such as an increase in the level of family allowances and a 20% increase in the level of old pensions, did not benefit from the automatic change of 2016.
In this country, the informal sector is the largest provider of employment (90.5% in 2010, and 86.4% in 2016) (National Institut of Statistics). Most of the people who work therein earn an income that barely allows them to survive and cover their daily needs. In addition, most of these actors have neither access to social security nor social redistributions. This implies that the recent crisis may have had negative effects on their activities. Several measures have been taken by the government to support economic players and households to assist them in managing the crisis. These are the primary measures aimed at limiting the spread of the crisis [9,10], secondary measures (fiscal and social measures) for the protection of economic actors, and finally redistributions to support households in loss of income [4,11].
However, a tiny fraction of these aforementioned measures cover the losses suffered by informal economy workers and households in their livelihoods and health [6,12]. When we know that actors in the informal economy very often have less access to social services (health insurance, unemployment insurance, and paid holidays.) and health and that their activities are their only source of daily income [13]. Public measures to prevent the health crisis that limit all or part of the work of actors in the informal sector may therefore be more important for the latter than for informal workers. Some authors even believe that “lifestyles, informal settlements and poverty are incompatible with strict confinement of populations, like that practiced elsewhere” [14].
According to the National Institute of Statistics in its report on the situation of COVID-19 in Cameroon, indicates that nearly 80% of business leaders in the formal sector and 82% of informal unit heads believe they know an average or significant slowdown in their activity [15]. Several companies have experienced a temporary or permanent shutdown of their activity, including nearly 13% of companies in the informal sector and 15.7% of companies in the formal sector, with 5.4% for large companies and 10.3% for SMEs.
According to this study, the main difficulties encountered by companies in this period of COVID-19 concern the decline in demand, supply, and financing difficulties [15]. Around 82% of companies recorded a decrease in their production of up to 50%, more than 95% recorded a decrease in their turnover, and more than 58% reduced the number of their employees [15]. Several response strategies have been adopted by companies, in particular the reduction of working hours, the postponement of planned investments, the cancellation of orders from suppliers (50.1% of companies), the layoff of certain employees, reduction of wages as well as the use of teleworking [15].
No direct or indirect transfer of funds was made to the actors (jobs and workers) of the informal economy, contrary to what the international organizations recommended. Conversely, certain distributions of basic food products (water, necessities foods, etc.), and hygiene (seals, soaps, gel, etc.) during the confinement period suggested the measures concerned the actors of the informal economy. However, there may be several public health effects on households [16]. On the one hand, it can reduce the working capacity of households affected and recovering to engage in income-generating activities [17]. This reduction in income can be more serious for economic agents in the informal sector, increasing their level of precariousness, which is already dominant in this sector. Since it offers few or no social protection mechanisms [5,10,18,19].
In this context, this article aims to analyze the effect of the COVID-19 crisis on the informal economy in the country. Two types of analysis are necessary: a descriptive analysis (to highlight the facts on the labor market while distinguishing between the formal and informal sectors) and an econometric analysis.
The rest of this article presents in a Section 2 the review of the literature on the relationship between the informal economy and COVID-19. The Section 3 discusses the data and socio-economic characteristics of the sample used to measure COVID-19 in the informal sector while analyzing the knowledge and attitudes of informal workers in the face of the COVID-19 crisis and the measures taken by the government. The Section 4 presents the methodology used in this study and the results of the econometric analysis of the effect of the COVID-19 crisis on the activity of workers in the informal sector. We will conclude with economic policy recommendations.
2. Literature Review: Empirical Evidence of the Economic Impact of the COVID-19 in the Informal Sector
Following recent empirical work, several negative effects of the COVID-19 pandemic are expected on the economy in the short and long term [20]. In particular, ref. [20] in a review of the literature on COVID-19 show that the authors question the repercussions of the pandemic on the economy, in particular: (i) the repercussions due to distance measures social; (ii) direct effects on household spending (medical costs); (iii) indirect losses on economic activity; (iv) long-term macroeconomic effects (lower growth rate).
- (i)
- The repercussions due to social distancing measures
The COVID-19 pandemic has forced many African countries to take drastic measures to reduce its spread and impact. Among these measures, we distinguish measures of confinement, strict or light lockdowns, and social distancing measures [20,21,22,23]. These measures are unprecedented and are the subject of many case studies. For example, ref. [21] supports the phenomenon in Uganda, ref. [12] advocates for South Africa, and [23] studies the case of Zimbabwe. The authors show that while foreclosure may be a necessary evil; it represents a financial crisis for three-quarters (76%) of the workforce working in the informal sector [23]. Thus, the repercussions vary according to the individual characteristics of the population’s concerned (sector of activity, employment status, place of work, and gender).
Regarding gender factors, ref. [22] shows that the negative economic impact of COVID-19 has been greater for women, and in particular for those working in the informal economy. In particular, it highlights the vulnerabilities linked to the economic stress of informal workers. For the latter, informal actors lack legal and social protections. However, ref. [21] established that stopping or suspending economic activity did not reduce women’s work. It extended it to the home. Still in the same vein, ref. [24] point out that changes in mobility have changed the working relationships of millions of people around the world, thus leading to the restructuring of jobs. This is the case in the United States, Germany, and Singapore.
The pandemic has therefore increased gender equality and put into perspective the traditional role of the housewife. However, the sustainability of these results will depend on the evolution of future changes. The work of [25] points in the same direction while focusing on the origin of home workers (African Americans and Hispanics). For him, job losses are higher for this type of worker than for others, ref. [26] review the role of constraints (space, violence and overcrowding) in poor neighborhoods that make physical distancing and quarantine impossible. According to these authors, the acuteness of basic needs (such as water, toilets, and sewers, age of sewers, waste collection, and safe housing) encountered by informal enterprises in the South makes them less prepared for the pandemic.
- (ii)
- Direct effects on household spending
Regarding the repercussions of the restrictions due to COVID-19 on households, the researchers analyze the impact of the measures on trade, access to food, and the means of household livelihood during the crisis. Knowing that the actors of the informal economy depend on both small trade and agricultural products, reference [12] shows that informal traders play an important role in food security and the provision of other economic and social goods (This is in line with the theory of optimal transportation by which consists in minimizing the costs related to the transportation of goods from one place to another) in South Africa. It thus underlines the need for additional consideration of the informal sector. For example, by creating more space for small retailers and putting in place a social safety net to support them. For him, the measures put in place by the South African State are unfavorable to the informal sector. The work of [27] on food security goes in the same direction. In addition, reference [4] shows that the aid of 500 million Rand which made it possible to stimulate economic activity, did not make it possible to protect workers in the informal economy. Since government interventions do not consider the needs of these actors who do not have access to social security.
Regarding petty trade, reference [11] demonstrates that the partial blockage of Ghana’s economy has affected the performance of informal enterprises and the well-being of their owners. And this regardless of gender or area of residence (urban or rural). Using a multivariate decomposition regression model shows the existence of an unexplained spatial gap in sales between informal owners residing in Accra and Tema. Knowing that containment affects the performance of informal businesses, they speculate that the COVID-19 pandemic is likely to increase gender disparities and spaces in informal business production.
- (iii)
- Indirect effects on economic activity
Many studies have attempted to expect the economic and social losses of the pandemic by tackling direct and indirect approaches to varied subjects. Regarding indirect effects, several empirical works attempt to find the economic implications on growth, international trade and employment. Under the work of [10], it is the strong dependence on international trade that is at the origin of many economic and social consequences. The author relies on the use of secondary data from various sources to show that the COVID-19 harms the economic productivity of companies up to 92%; on the contraction of formal and informal jobs, the worsening of the educational inequality between boys and girls depending on the place of residence (i.e., an allocation of 7.3 million pupils and students affected in Cameroon). For [9,28] the current pandemic will cause a drop in GDP of around 6% for the Cameroonian economy.
To characterize how the COVID-19 pandemic affected labor markets, refs. [16,29] reveal that the lockdown has affected economically informal sector workers in Kumasi (Ghana) due to COVID-19 and other government restriction measures. For [29], these restrictions disrupted their trade and livelihoods. Ref. [30] find that informal workers have experienced dramatic declines in their monthly income in Thailand, although the reduction has varied from occupation to occupation and geographic region to region. To compensate for the reduction in income, workers in the informal economy drew on their savings and increased their debt.
- (iv)
- Long-term macroeconomic effects
Several studies focus on the impact of the crisis on the long-term economy. Knowing about the informal sector is essential for economic growth in African countries. It is also seen by these authors as a key provider of jobs and income in emerging economies. Therefore, ref. [13], they find that the crisis caused by the COVID-19 pandemic will have a significant impact on developing countries. The amplification of the crisis for informal actors in Nigeria is caused by institutional shortcomings, unsafe working conditions, poor law enforcement, and non-participation of informal workers in decision-making. For him, these are effective and cost-effective incentives that can minimize the impact of coronavirus outbreaks on the informal sector.
Reference [31] test the optimistic assumptions that are made about the informal economy (such as survival of the crisis) and the pessimistic theories (such as the losses). In Indonesia, they find that in the long term, the informal sector risks no longer being the hero for improving household income but an alternative offering only job flexibility. Ref. [32] reports that COVID-19 will have both short- and long-term effects on the rural economy in India. In the short term, on the one hand, it risks sinking nearly 400 million informal workers deeper into poverty. It risks creating a reverse migration from urban to rural areas. Comparing the job losses between the two sectors [18] estimates that the job losses of informal workers amount to 22.6% compared to formal workers who have only 3.6% of losses.
In addition, these workers will suffer a loss of wages of 635.53 billion dollars. It suggests the necessity of a change in the social protection framework to cope with the crisis. These recommendations are in line with international bodies such as [33] which underscore the need for immediate assistance to protect informal workers in Mexico and for a long-term economic and social plan that incorporates the recovery of stronger and more equal social and labor protections for informal workers. In the same vein, ref. [5] shows that the pandemic has a significant negative effect on informal employment, which brings together most workers in Sub-Saharan Africa. Narula (2020) shows that the crisis provides the circumstances for greater active engagement with informal actors, placing them on an equal footing with formal actors.
Ultimately, some studies describe the negative economic impact of pandemics. However, the impact of the pandemic on the informal economy is not clear. While various previous works have attempted to explain the impact of crises on the informal economy. However, due to the novelty of this crisis, which does not respond to any classical economic theory, and the unprecedented restrictive measures taken by the various governments, this crisis has become a priority for empirical analysis. It therefore appears crucial to understand the impact that this epidemic could have on the informal sector. This is useful for understanding how these actors reacted to this crisis and the government policies put in place. This article highlights the impact of the Coronavirus health crisis on the informal economy through a case analysis from Cameroon based on the results of the NIS survey.
3. Materials and Methods
3.1. Empirical Specifications
To analyze the effects of barrier measures on informal employment in Cameroon, we used a labor supply model that considers government restrictions. The study of the labor supply is first that of an inter-temporal choice between consumption and leisure, the basic model of which we will reexamine.
The dependent variable of this study is therefore the employment status, entered as a dichotomous variable, where people with a job in the informal sector during the pandemic take the value 1 (EI = 1), and 0 otherwise.
The reduced form of the model is:
where EIconfinementi represents the outcome variable relating to the participation in the labor market of an informal worker i during the COVID-19 lockdown period. The vector Xi includes not only the individual characteristics of the household but also that of its job. The vector of variables Xi is age, place of residence, sex, mode of remuneration for household activity, type of job or position held by the worker in the unit of production, and sector of activity in the labor market. The COVID-19 variable measures the status of an individual while it takes the value of 1 if the individual has the virus and 0 otherwise. Other variables of interest include the characteristics of workers, the economic environment, and fluctuations in workers’ incomes. Indeed, we assume that, during the pandemic, the entire household is partially or blocked. We, therefore, incorporate dummy variables for blocking households given by Pmeasurei (captures containment and extension or hardening measures).
An informal worker who stops work to take care of the household (children, housework or other activity) during confinement. This may amount to a change in activity or a decrease during the said period.
By incorporating all the variables from Equation (1) above, we estimate the following extended model in the first phase:
where the vector Zi represents the characteristics of the working environment during confinement. (It captures all the difficulties encountered by workers, difficulties in accessing raw materials, the loss of customers, the increase in market uncertainty, etc.) is a control variable for employment status before the start of the pandemic to avoid multicollinearity between informal employment (IE) and the characteristics of households and individuals i.
Then, we also studied a change in employment to consider the impact of the pandemic on the evolution of the activity. We measure the effect of confinement on activity by: , which measures the variation in employment (temporary cessation or suspension of activity, or permanent loss of employment). The change in the employment situation can take two values, namely: the temporary stopping or suspension of the activity which takes the value 1 if the individual has temporarily stopped his activity and 0 otherwise. Likewise, job loss also takes the value of 1 if the individual has lost his job and 0 otherwise. This variation is estimated in the second stage by controlling the type of job this time. It’s question to estimate the equation of suspension of work during the confinement noted and the equation of loss of his job during the confinement noted .
3.2. Estimation Method
We estimate a logistic regression model using the maximum likelihood method. Using the test of chi2 Pearson, we identify the existence of correlations between variables. This method makes it possible to determine the variables which explain the model significantly. We present these results in the results section below.
3.3. Data and Variables
The data used within the framework of this study come from the survey carried out by the National Institute of Statistics in order to know the opinions of populations and business managers on the effects of the pandemic of coronavirus at the economic and social levels and to take suitable measures to better help them. The target population of this survey is the entire population of Cameroon, spread over its 10 regions. The data collection methods used are telephone interviews and online forms. The target populations are those over 14 years old. They carried the survey out on 1310 households. For our analysis, we keep socioeconomic variables, such as gender and level of education; and employment-related variables such as employment status, institutional sector (formal and informal), sector of activity, and the variable of interest, which provides information on job loss. In addition, we also invite the variable linked to income to assess the impact of the pandemic on the employment of informal workers.
4. Descriptive Analysis and Discussions
4.1. Impact of COVID-19 on Informal Employment in Cameroon: A Descriptive Analysis
This section provides a brief overview of the impact of the coronavirus pandemic on informal employment in the country. For this, the analyses are carried out before and after the lifting of the barrier measures.
4.1.1. The Informal Employment Situation before and after the First Confinement following COVID-19 in Cameroon
Table 1 below shows that in all sectors of activity combined, nearly 17.30% of Cameroonians have lost a job. The most significant loss is in private non-agricultural enterprises, the industrial or service sector.

Table 1.
Employment situation according to the sector of activity.
4.1.2. Employment Status and COVID-19
We find employment status among self-employed workers (downward variation of 5.71%) who are informal sector workers. Qualified employees follow them (−4.39%) and workers (−2.40%) who pay the price for the decline of activity (see Table 2).
Table 2.
Structure of employment according to the status before and after the lifting of barrier measures.
4.1.3. Institutional Sector and COVID-19
When we consider the institutional sector (see Table 3), we can see that the most significant job loss is in the informal sector (−12.74%), in particular the informal non-agricultural sector (−11.37%). The formal private enterprise sector follows this (−4.58%).
Table 3.
Institutional sector and confinement measures.
4.1.4. Gender, Institutional Sector, Income Situation and COVID-19
For gender, we see that the greatest job loss is among men working in the informal sector. This was also the group that suffered the most significant income loss, followed by the group of women working in the informal sector (see Table 4).
Table 4.
Institutional sector and income variation.
4.2. Discussions
The following table (Table 5) presents the results of the estimations of the binomial regression model, as well as those of the odds ratios and the marginal effects.
Table 5.
Results of the effect of the participation of informal workers in the labor market during confinement.
- The goodness of fit for the model
The value pseudo McFadden of the estimated model (0.6889) suggests that the model with explanatory variables adjusted to 68.89 % is better with the data than the model which is constant. Moreover, the statistical feature of the likelihood ratio is significant at 1%, which means that the model predictor is generally appropriate (see Table 5). At least one coefficient estimated in the model is significantly different from zero.
- Odds Ratio Analysis
The odds ratios or relative risk ratios are a measure of association, which measures the link between the characteristic of the company or the individual and the occurrence of the event (Occupation during confinement).
If the odds ratio (OR) = 1, the event and the characteristic are independent. If OR > 1 (respectively OR < 1), the link between and is positive (respectively, negative). Thus, in Table 1 above, we observe that several variables negatively influence the chances of having a job during confinement. Generally, the analysis of the odds ratio in this model shows that the individual characteristics of the elderly living in the central region and being remunerated by the dividend (shareholders) or by cash work are significantly and negatively linked to employment during the confinement period. Indeed, we can observe that the OR of age, the central region, shareholder, and cash work are lower than 1. Indeed, this result shows that the fact of being remunerated as a shareholder in cash work and to be in the central region decreases, respectively, by 0.45, 0.11, and 0.29 the chances of holding informal employment during confinement (see Table 5). That the central region has been the most affected by the COVID-19 pandemic can explain this.
The rise in prices is significantly and positively linked to employment during containment. The results show rising prices increase the chances of having a job in the informal sector. Indeed, many individuals have taken advantage of this price increase to engage in commercial activities such as the sale of “mufflers” taking advantage of the fact that goods are scarce to start a business during the lockdown. This work is in line with the work of [24,34,35] which shows that changes in mobility have changed the working relationships of millions of people around the world, thus leading to the restructuring of jobs.
Not having COVID-19 significantly decreases the chances of having an informal job by 0.07. Indeed, most people who work in the formal must all be negative for COVID-19. Therefore, most of those who have taken the test and declared negative are much more in the formal sector than in the informal one [25,26] for whom distancing is more difficult for informal workers than for formal workers, in particular due to space constraints, overcrowding, and an incapacity to meet basic needs.
Regarding satisfaction with barrier measures, we observe that most people who think that the time restrictions are “very bad” and who do not have enough materials for hand disinfection are significantly and positively linked to informal employment during containment. Indeed, the hourly restrictions and the absence of hand disinfection products respectively increase by 10.33% and 56.80% the chances of having an informal job during confinement. Companies with time restrictions and poor management of hand hygiene can explain this will push actors into the informal sector (for example, selling gels, or jobs with fewer time restrictions). These works [16,29] reveal that the lockdown due to COVID-19 and other government restrictions has economically affected informal sector workers in Kumasi (Ghana).
- Marginal effects
The analysis of the marginal effects on having an informal job during confinement presents the following results. About barrier measures, we can observe that the closure of schools and the wearing of compulsory masks reduce the probability of 5.7% and 4.32% of having a job during confinement. This measure seems particularly more restrictive for informal workers who have to work in these difficult conditions, particularly unsanitary conditions, lack of water and even fewer means of protection [16].
The price increase significantly increases the probability of having a job during containment by 12.1%. Likewise, that wages are not late increases by 13.6% the probability of having a job during the lockdown. Large businesses are more likely to employ than medium-sized businesses during containment. Indeed, the results show that large enterprises have a 54.68% chance of employing in the informal sector than medium-sized enterprises with a 42% chance.
These results are consistent with the work of [31] which shows that the informal sector is no longer a resilient sector that creates jobs and is a refuge for unemployed workers. On the contrary, it is the large companies that employ individuals, no doubt for the sake of continuity of production. Unless markets are reopened, UPIs use as few employees as possible.
- Effect of variation of use during confinement
- Effect of stopping or suspension of use during confinement (See Table 6)
Table 6.
Results of stopping or suspension of use during confinement.
Table 6.
Results of stopping or suspension of use during confinement.
| Work during Confinement | Logit Coeff. | Margin Effects | Odds Ratio |
|---|---|---|---|
| Mode of remuneration | |||
| Shareholder | −8.6893 ** | −0.4054 *** | 0.0001 ** |
| (4.3229) | (0.1090) | (0.0007) | |
| Commission | −3.783 | −0.2646 * | 0.02272972 |
| () | (0.1182) | (0.0675) | |
| Social distance | |||
| Good | −5.1972 ** | −0.3207 *** | 0.0055 ** |
| (2.2080) | (0.0598) | (0.0122) | |
| School closing | |||
| Very bad | −7.9375 ** | −0.4220 *** | 0.0003 ** |
| (3.8772) | (0.1121) | (0.0013) | |
| Time restrictions | |||
| Bad | −9.9729 *** | −0.5618 *** | 0.00004 *** |
| (3.7438) | (0.0849) | (0.0001) | |
| Public transport restrictions | |||
| Bad | 9.855 | 0.4067 ** | 19,055.25 |
| (13.77084) | (0.1934) | (262,406.8) | |
| Good | 2.4369 | 0.1940 * | 11.438 |
| (1.725) | (0.1106) | (19.7307) | |
| Mask Obligatory | |||
| wear Good | −3.6343 * | −0.2319 | 0.0264 * |
| (1.9125) | (3.5073) | (0.0504) | |
| Extension of measures | |||
| Somewhat strongly agree | 9.3418 *** | 0.4929 *** | 11,405.5 *** |
| (3.2598) | (0.0527) | (37,180.3) | |
| Not agree | 6.1284 ** | 0.3273 | 458.7219 ** |
| (3.0606) | (0.0970) | (1403.96) | |
| Hardening measures | |||
| Somewhat agree | −4.7615 ** | −0.2838 *** | 0.0085 ** |
| (2.0426) | (0.0531) | (0.0174) | |
| Extension and hardening | |||
| Somewhat agree | −4.7097 * | −0.2908 *** | 0.009 * |
| (2.4364) | (0.0780) | (0.0219) | |
| Difficulty in supply | |||
| No | 7.3563 ** | 0.3792 *** | 1566.04 ** |
| (3.2859) | (0.0460) | (5145.95) | |
| Shortage of inputs | |||
| No | −5.5257 ** | −0.4133 *** | 0.0039 ** |
| (2.6531) | (0.1009) | (0.0105) | |
| Customer loss | |||
| No | 2.6224 | 0.2076 * | 13.769 |
| (2.0766) | (0.1195) | (28.59) | |
| Salary delay | |||
| Don’t know | 10.111 * | 0.2807 *** | 24,624.8 * |
| (4.7163) | (0.0696) | (116,138.8) | |
| Lower salary | |||
| Don’t know | −17.755 ** | −0.5535878 | 1.94 × 10⁻⁸ ** |
| (7.1930) | (0.8203) | (1.40 × 10⁻⁷) | |
Source: Authors from NIS data, standard errors in parentheses *** p < 0.01, ** p < 0.05, * p < 0.1; Logistic regression Number of observations = 113; LR chi2 (48) = 89.32 Prob > chi2 = 0.0003; Log likelihood = −33.6620 Pseudo R2 = 0.5702.
- Quality of fit of the model
There are two ways to evaluate the overall quality of the estimated model. We base the first on its likelihood, the second on the probabilities predicted by the model.
One of the first indicators found in the literature is pseudo McFadden’s measures how well the model with explanatory variables fits the data compared to the model without explanatory variables. This indicator increases with the (log) likelihood lnL of the model.
The value pseudo of McFadden’s estimated model (0.5702) suggests that the model with explanatory variables fitted to 57.02% better the data than the model with constant. Moreover, the statistical feature of the likelihood ratio is significant at the 1% means that the model predictor is appropriate (see Table 6). At least one coefficient in the model is significantly different from zero.
- Odds Ratio Analysis
I often present the estimation results of the logit model as the odds ratio (OR) also called the relative risk ratio. OR is a measure of association, which captures the link between the characteristic of the company or the company manager and the occurrence of the event (Stop or suspension during confinement). If OR = 1, the event and the characteristic are independents. If OR > 1 (respectively, OR < 1), the link between and is positive (respectively, negative).
The analysis of the odds ratio in Table 6, shows that, overall, the suspension of work is significantly linked to six confinement measures. Indeed, social distancing, the closure of schools, and time restrictions and the wearing of the compulsory mask decreased respectively by 0.005; 0.0003; 0.0004 and 0.02, the chances of being suspended while in containment. Compliance with the barrier measures decreed by the government to protect individuals at work can explain this and, therefore, it does not frown upon them and has less chance of being suspended.
Extensions of these measures by the government increase the chances of being suspended from work by 11,405. I justify this since the barrier measures have considerably slowed down economic activity. As a result, extending them will put a lot of workers under arrest. In addition, the lack of inputs and the fact of being a shareholder reduces the chances of being suspended from work, respectively, by 0.003 and 0.0001. Finally, people with fewer difficulties in obtaining food products and catering services have a 1566.04% chance of being suspended during confinement. It is acceptable since it forces most businesses and people in the informal sector who are struggling during lockdown to continue their activities, despite certain restrictions. This situation can cause an amplification of the crisis.
These results are in the same direction as those of [13] which highlights the role of institutional shortcomings, dangerous working conditions, poor law enforcement, and non-participation of informal workers in decision-making on amplification of the crisis for informal actors in Nigeria.
- Marginal effects
The analysis of the marginal effects first shows that the fact of being a shareholder, social distancing, the closure of schools, and bad time restrictions decrease respectively by 40%; 32.07%; 42.2%; 56.1% the probability of being suspended from informal work. Then, the extension of the measures increases the probability of being suspended by 49.29%.
These results are consistent with the work of [5] which shows the significant effect of the pandemic on informal employment globally since the latter makes up most workers in Sub-Saharan Africa.
- Effect of loss of employment during confinement (See Table 7)
Table 7.
Results of loss and termination or suspension of employment during confinement.
Table 7.
Results of loss and termination or suspension of employment during confinement.
| Loss of Employment 1 | Logit | Odds Ratio | Marginal Effects |
|---|---|---|---|
| Age | −4.1116 *** | 0.0163 *** | −0.3373 *** |
| (1.3402) | (0.0219) | (0.0985) | |
| Region | |||
| Coastline | −3.532 * | 0.0292 * | −0.1619 ** |
| (2.0468) | (0.0598) | (0.0767) | |
| North-West | 3.5827 * | 35.970 * | 0.3033 ** |
| (1.8446) | (66.35) | (0.1392) | |
| School closure | |||
| Bad | −2.4658 * | 0.0849 * | −0.1753 ** |
| (1.4034) | (0.1192) | (0.0788) | |
| Restrictions of public transport | |||
| poor | 3.3614 * | 28.83 * | 0.2774 * |
| (1850) | (53.34) | (0.1985) | |
| movement restriction persons | |||
| Very bad | 4342 | 0.0130 | −0.2154 ** |
| (3.9787) | (0.0517) | (0.108) | |
| Stress pandemic | |||
| Less stressed | −1.7422 * | 0.1751 * | −0.1378 * |
| (1.0513) | (0.1841) | (0.0755) | |
| Price level | |||
| Rising | −6.2221 * | 0.0019 * | −0.5240 *** |
| (3.5807) | (0.0071) | (0.1605) | |
| Decreased activity | |||
| No | −5.5735 * | 0.0037 * | −0.2328 *** |
| (3. 3608) | (0.0239) | (0.0555) | |
| Shortage of inputs | |||
| No | −4.075 *** | 0.0169 *** | −0.3509 *** |
| (1.4086) | (0.0239) | (0.0873) | |
| Customer loss | |||
| Don’t know | −4.9248 *** | 0.0072 *** | −0.3129 *** |
| (1.8433) | (0.0133) | (0.0836) | |
| Salary delay | |||
| Don’t know | −4.5818 * | 0.0102 * | −0.3316 ** |
| (2.4768) | (0.0253) | (0.1069) | |
Source: Authors from NIS data, standard errors in parentheses *** p < 0.01, ** p < 0.05, * p < 0.1; Logistic regression Number of observations = 178; LR chi2 (60) = 112.40 Prob > chi2 = 0.0000; Log likelihood = −46.5507 Pseudo R2 = 0.5470.
- The quality of fit for the model
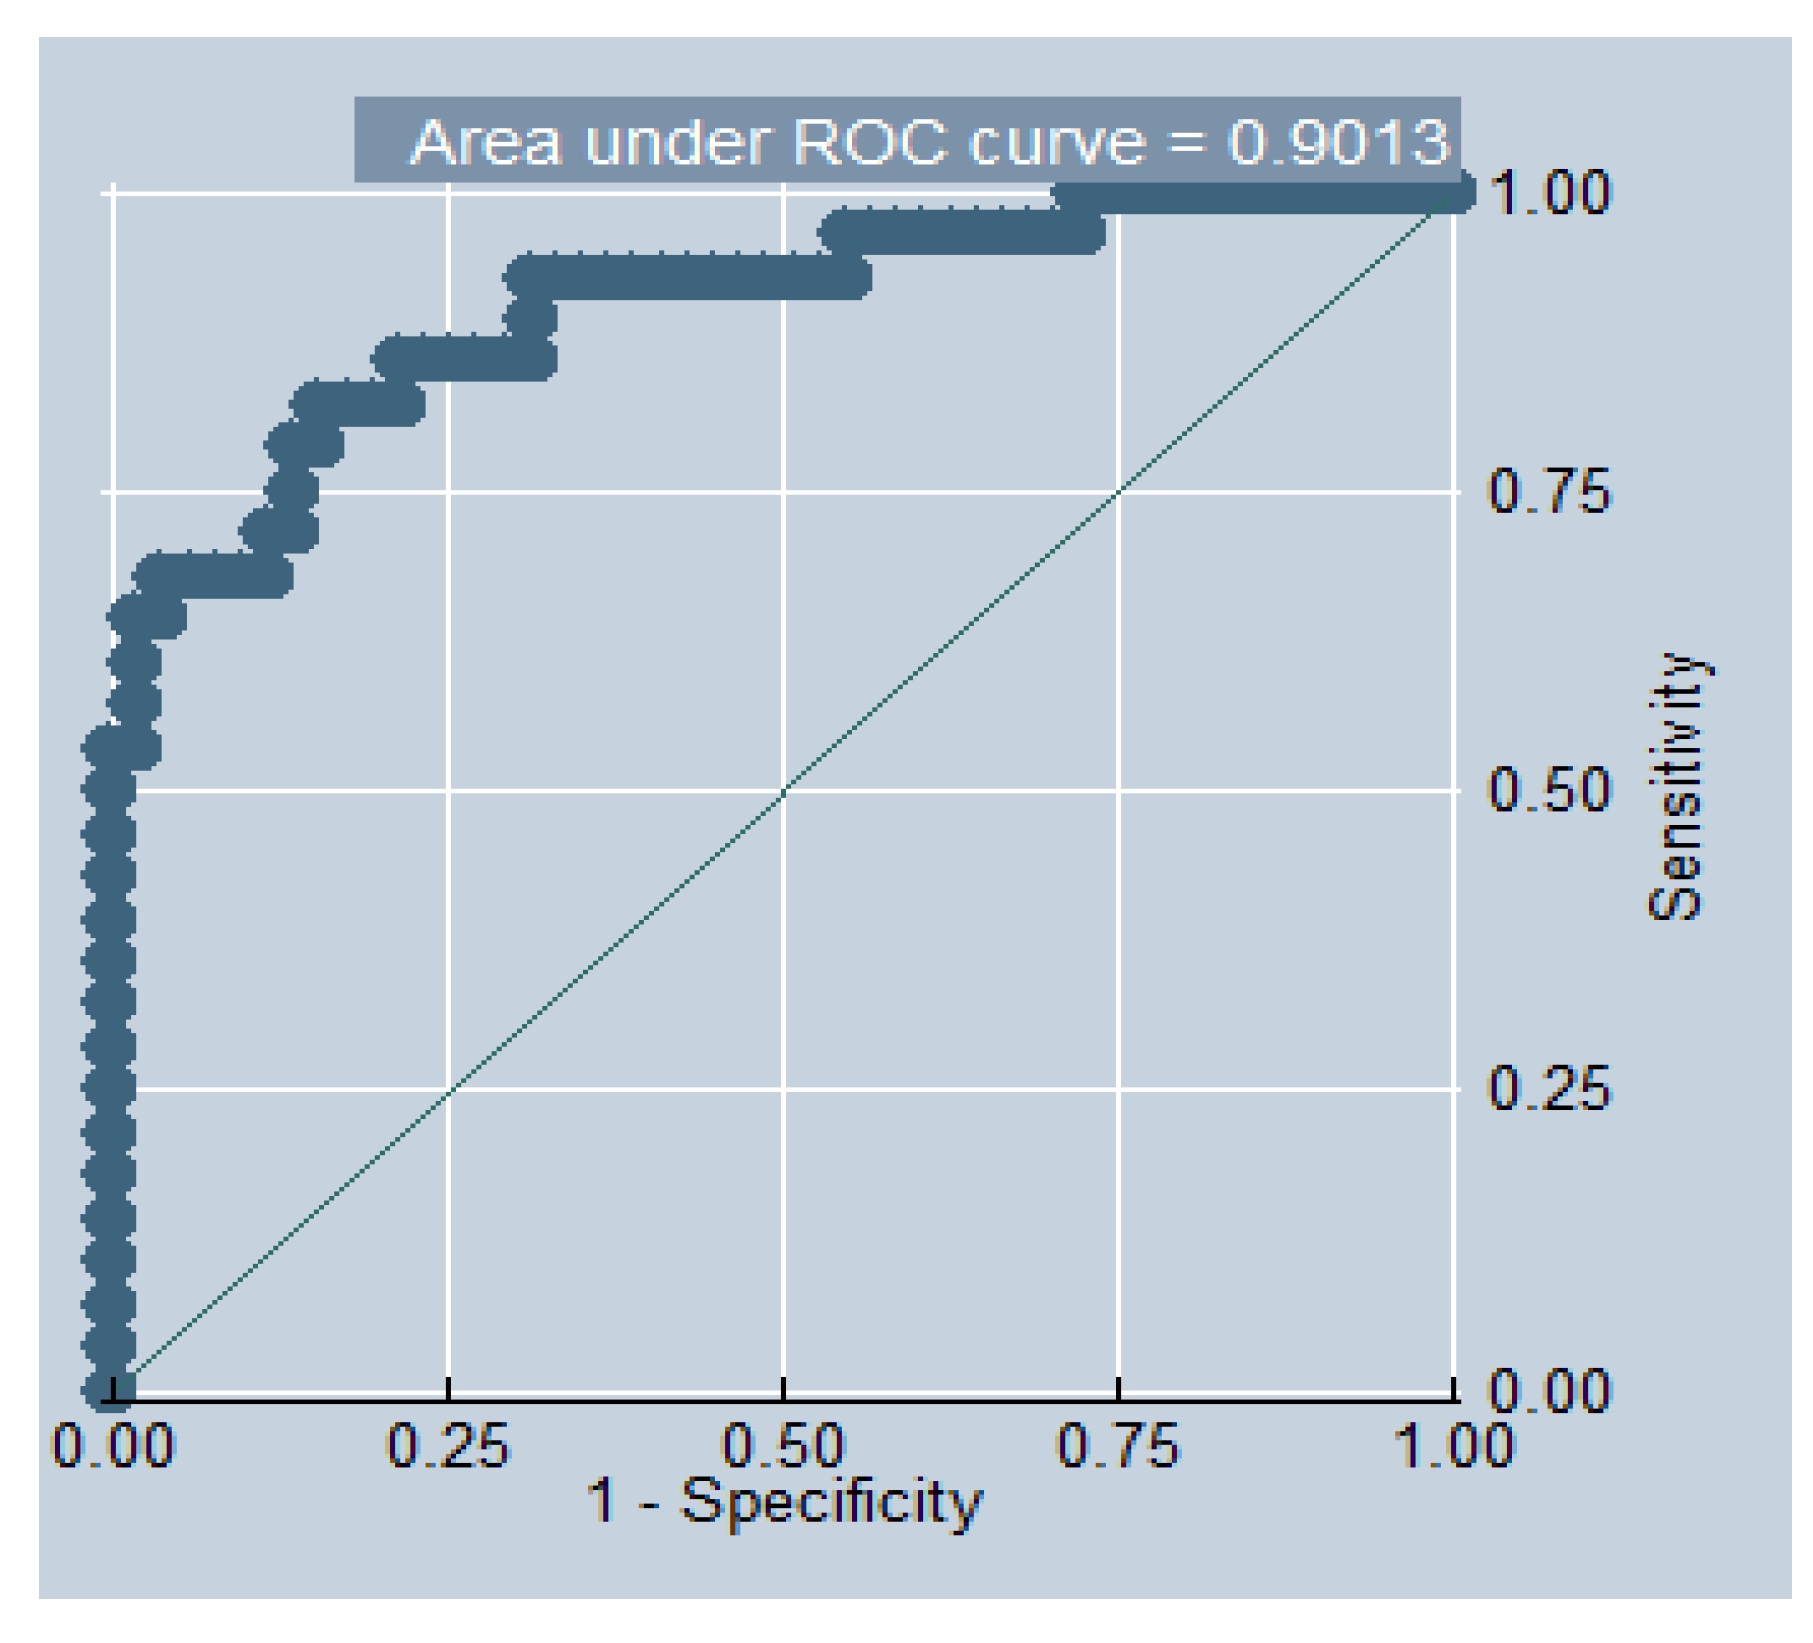
The value pseudo McFadden’s estimated model (0.5470) suggests that the model with explanatory variables adjust by 54.7% the data better than the model with constant. Moreover, the Statistical feature of the likelihood ratio is significant at 1% means that the model prediction is appropriate (see Table 7 and Appendix A: Figure A1, Figure A2 and Figure A3). At least one coefficient estimated in the model is significantly different from zero.
- Odds Ratio Analysis Odds ratio
Analysis shows that age is significantly and negatively related to the probability of losing a job in the informal sector during confinement. Specifically, age decreases by 0.0163% the chances of losing one’s job during confinement. This means that being older significantly reduces the risk of losing your job in the informal sector. Likewise, being in the littoral region significantly reduces the chances of losing a job by 0.0292 (see Table 7). This can be defensible that there is a high concentration of informal sector activities on the coast, and specifically in the city of Douala, the economic capital. The chances of running out of business or losing a job, especially in the informal sector that characterizes this city, are therefore quite low.
Being in the Northwest region significantly and negatively increases by 35.70 the chances of losing a job in the informal sector during confinement. This is due to the security situation in the area; with the pandemic, activities will be more difficult. As a result, it is more likely to have a complete lack of informal activity in this part of the country. Regarding barrier measures, the poor restriction of public transport significantly increases the chances of losing a job during confinement by 28.83%.
Being less stressed during the pandemic reduces the risk of losing your job in the informal sector by 0.17. Likewise, rising prices do not increase the chances of losing a job; it decreases by 0.0019 the chances of losing a job during confinement. Failure to drop-in activities decreases the odds of losing an informal job during lockdown by 0.0037 [18] estimates confirmed these results that the job losses of informal workers amount to 22.6% compared to formal workers who have only 3.6% of losses. This implies giving more consideration to informal workers.
- Marginal effects
The analysis of marginal effects presents similar observations. Indeed, age decreases by 33.73% the probability of losing an informal job during confinement. Likewise, those who found the measure to close schools bad have a 17.53% less chance of losing an informal job during confinement. Restrictions on public transport increase by 27.24% the probability of losing a job during confinement. Likewise, being in the northwest region increases the chances of losing a job while in lockdown by 30%.
People who have less stress and those who think there is a rise in prices have a lower probability of losing their job during lockdown (13.78% and 52.4%, respectively). Likewise, access to inputs significantly decreases (35%) the probability of losing a job in the informal sector during confinement. These results are consistent with the work of [26,29].
5. Conclusions
This work aimed to analyze the effects of the COVID-19 pandemic on the actors of the informal economy and the measures taken by the Cameroonian government to deal with it. We used a double methodological approach, namely descriptive analysis and econometric analysis, using multinomial logistic regression. The results show that wearing a compulsory mask decreases the chances of having a job, but it also decreases the chances of being suspended from work. In addition, higher market prices increase employment in the informal sector. Like the results of [22], being less stressed reduces the chances of losing a job and therefore of being insensitive to vulnerabilities linked to economic stress for workers in the informal sector.
At the end of this study, it is generally noted that the disease is well known through its main symptoms, as well as the response measures taken by the government and its partners. However, there is a significant difference between knowledge of the disease and response measures and their application, especially for workers in the informal sector. The application capacity is even more heterogeneous between the different sectors of activity. In particular, characteristics such as age, sex, income, and exercise or not in informal activity, the type of government measures put in place significantly influence the probability of working during the crisis. For example, the results also show that being older significantly reduces the risk of losing one’s job in the informal sector.
Due to financial constraints, difficulty in obtaining necessities and time and transport restrictions, informal workers find it difficult to apply certain measures, such as social isolation, hand washing, and time restrictions. However, when adapted workers are less worried about getting sick but more worried about losing their jobs. Many also change activities and adapt to restrictions. For some workers, price variations are a profitable opportunity, especially for women who can now work from home (making masks, gels, soaps, etc.). In addition, the results show that the government-imposed hand sanitization measure increased the likelihood of being employed while in lockdown. Likewise, time restrictions that are not appreciated by workers will push actors more towards the informal sector. Finally, the results show that those who do not test positive for COVID-19 typically withdraw from the informal labor market to limit the risks of being infected. Indeed, the fact of not being infected with COVID-19 significantly reduces the probability of having a job in the informal sector.
Faced with these results, more direct support measures and sanctions against individuals who do not comply with the prescriptions represent an opportunity to respond more effectively to this pandemic. Beyond this strategy, it is necessary to set up a mechanism for monitoring and evaluating the impact of the pandemic on households and to adapt it specifically to parts of the population outside the formal mechanism of social redistribution such as informal workers who lost their jobs or had to retrain during confinement. On the social level, the government (local government) could provide a little more direct support to informal workers, particularly in terms of health, food and social care during the crisis (for example, by strengthening the distribution of masks, hydroalcoholic gels, and food products). Finally, the major limitation noted in this study is the using of secondary data collected at the overall household level. A more specific survey of informal workers could provide more details on the characteristics of this population and their behaviors that should not be overlooked since it comprises a large part of the active population. Such an investigation will reduce the spread of the pandemic without causing a major social crisis [36].
Author Contributions
Conceptualization, R.T.N. and F.K.N.; methodology, formal analysis, and investigation, F.K.N. and L.-F.A.; validation, R.T.N. and J.A.B.E.; writing—original draft preparation, F.K.N. and L.-F.A.; writing—review and editing, J.A.B.E. and F.K.N.; supervision, R.T.N. All authors have read and agreed to the published version of the manuscript.
Funding
This research received no external funding.
Data Availability Statement
Data was obtained from [Institut National de la Statistique (Ministère de l’Economie, de la Planification et de l’Aménagement du Territoire)] and are available [from Institut National de la Statistique, Yaoundé, Cameroun/at contact@stat.cm], with the permission of [www.statistics-cameroon.org, (accessed on 3 November 2021)]. Source: Institut National de la Statistique, Ministère de l’Economie, de la Planification et de l’Aménagement du Territoire, EESC-2020-Phase1, Version 1.0 2020, ENQUETE D’EVALUATION DES EFFETS SOCIOECONOMIQUES DU CORONAVIRUS (COVID19) AU CAMEROUN(EESC), Résultats finals, Yaoundé, Cameroun.
Acknowledgments
Thank you to the reviewers of the collective book “Les pays francophones face à la COVID-19: Impacts socioéconomiques, politiques de riposte et stratégies de sortie de crise et de résilience économique”; published by the Observatoire de la Francophonie Economique of the University of Montréal; for their comments and suggestions on an earlier draft of this paper.
Conflicts of Interest
The authors declare no conflict of interest.
Appendix A. Graphics Curve ROC
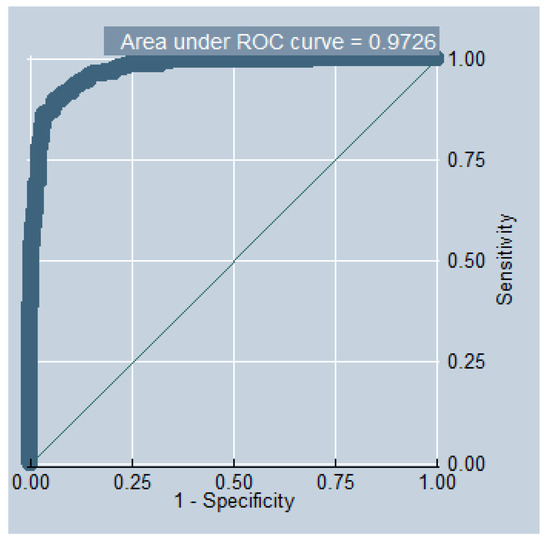
Figure A1.
Model 1.
Figure A1.
Model 1.
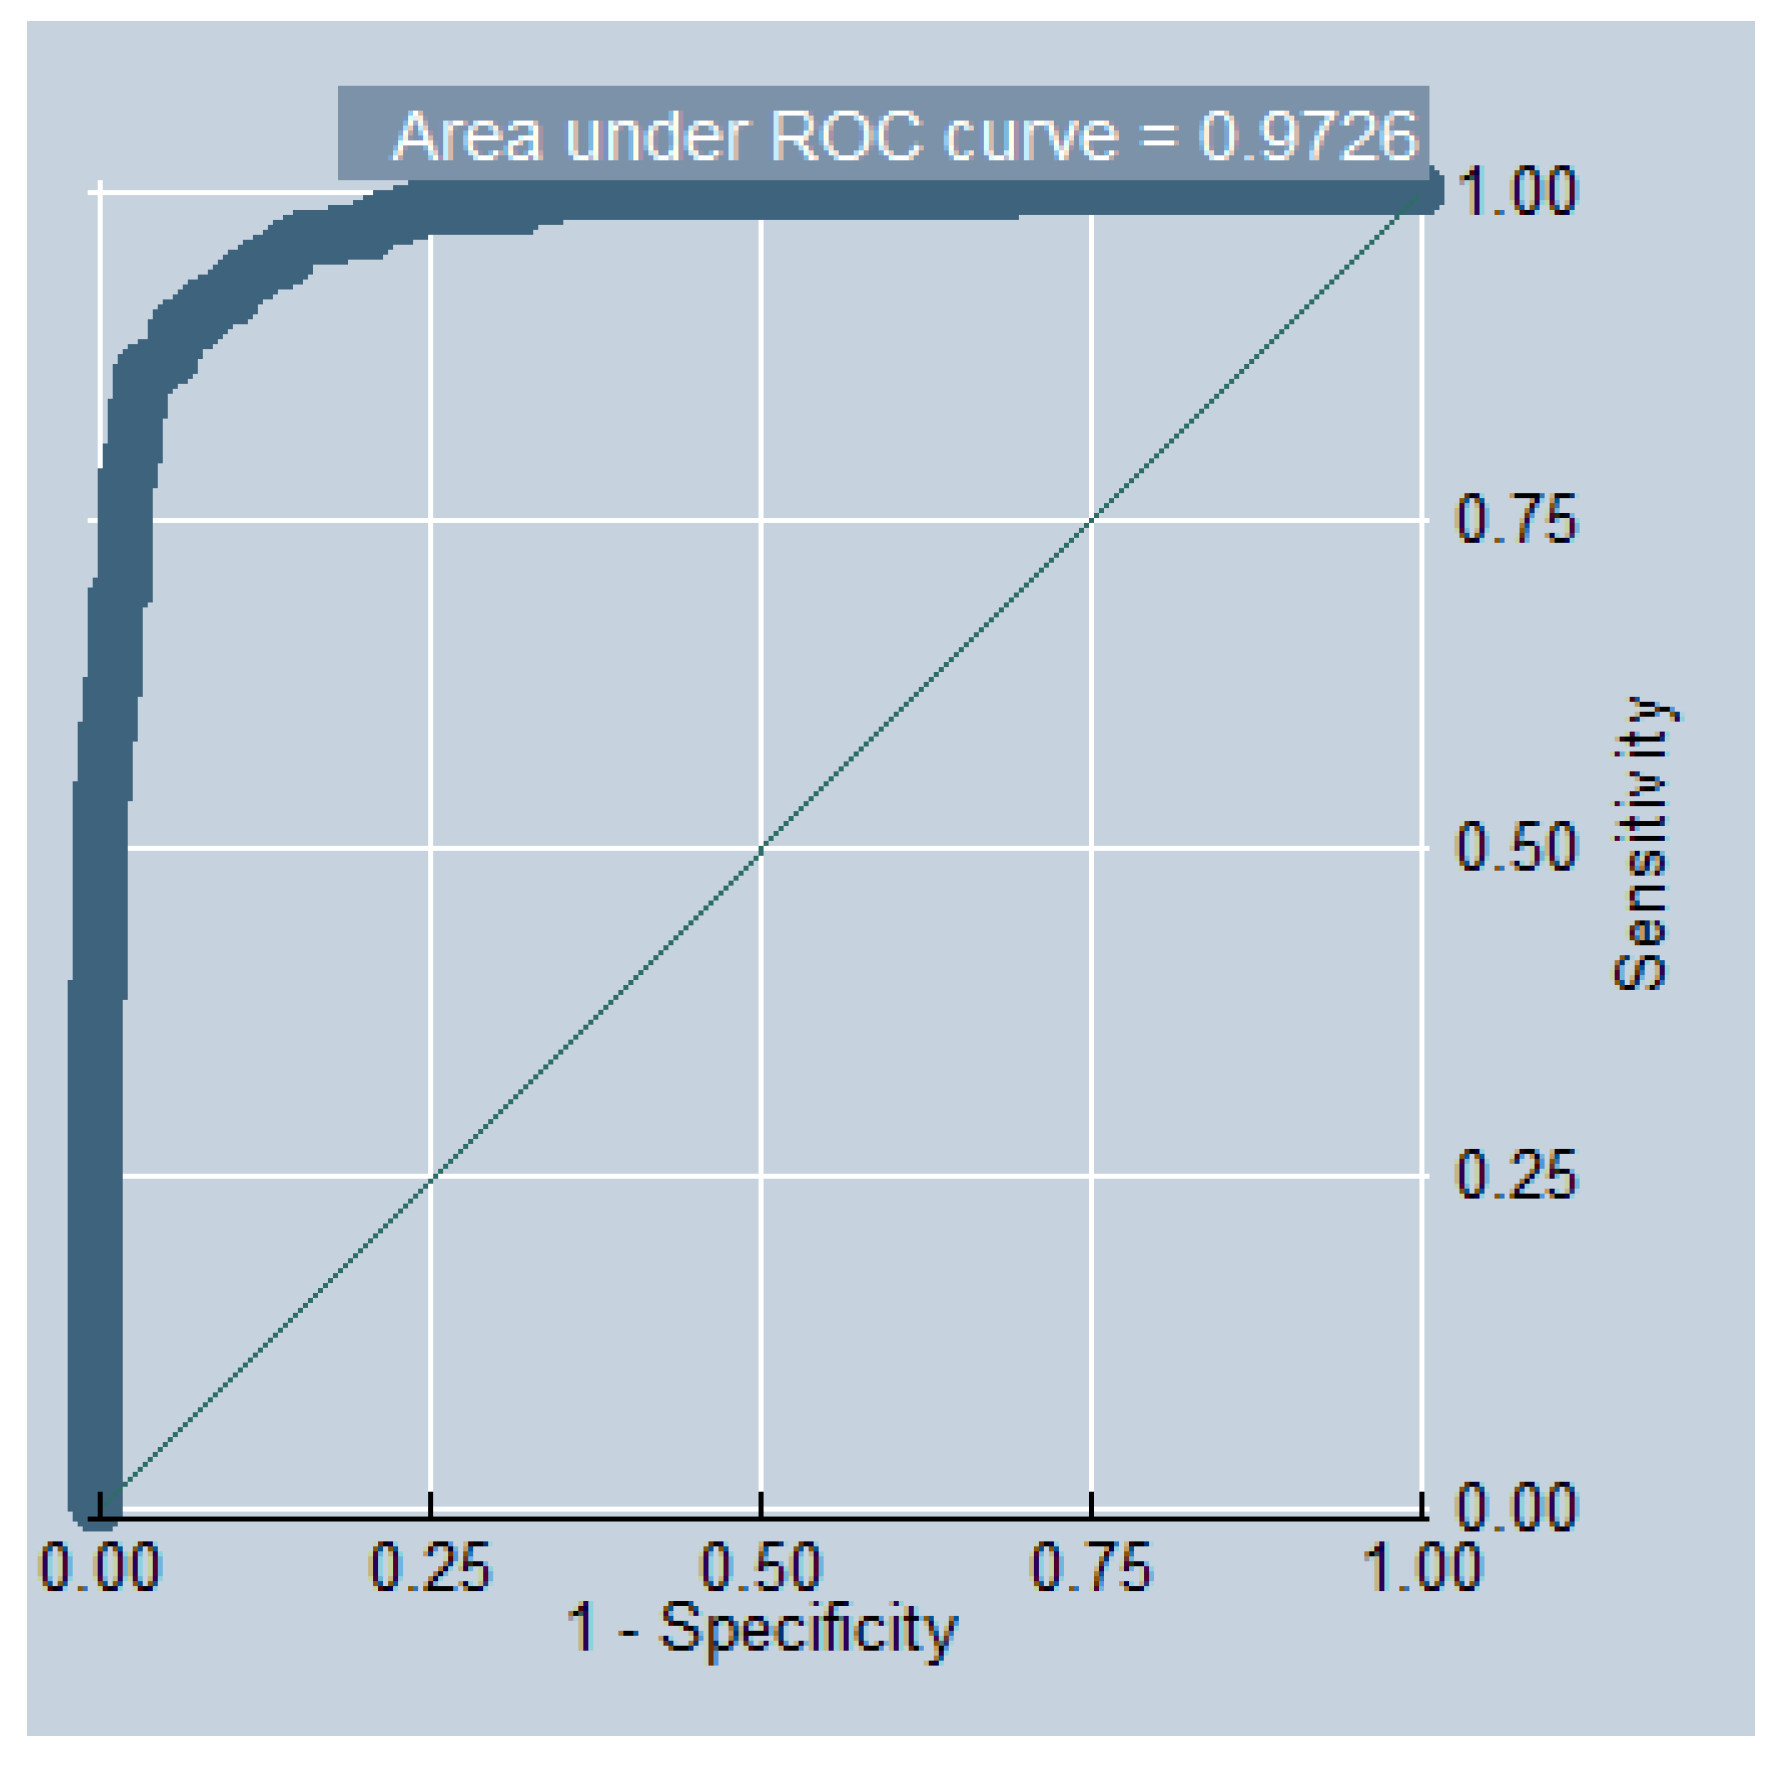
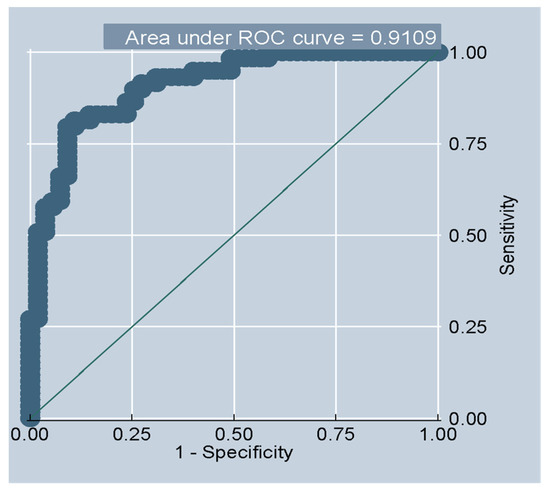
Figure A2.
Model 2.
Figure A2.
Model 2.
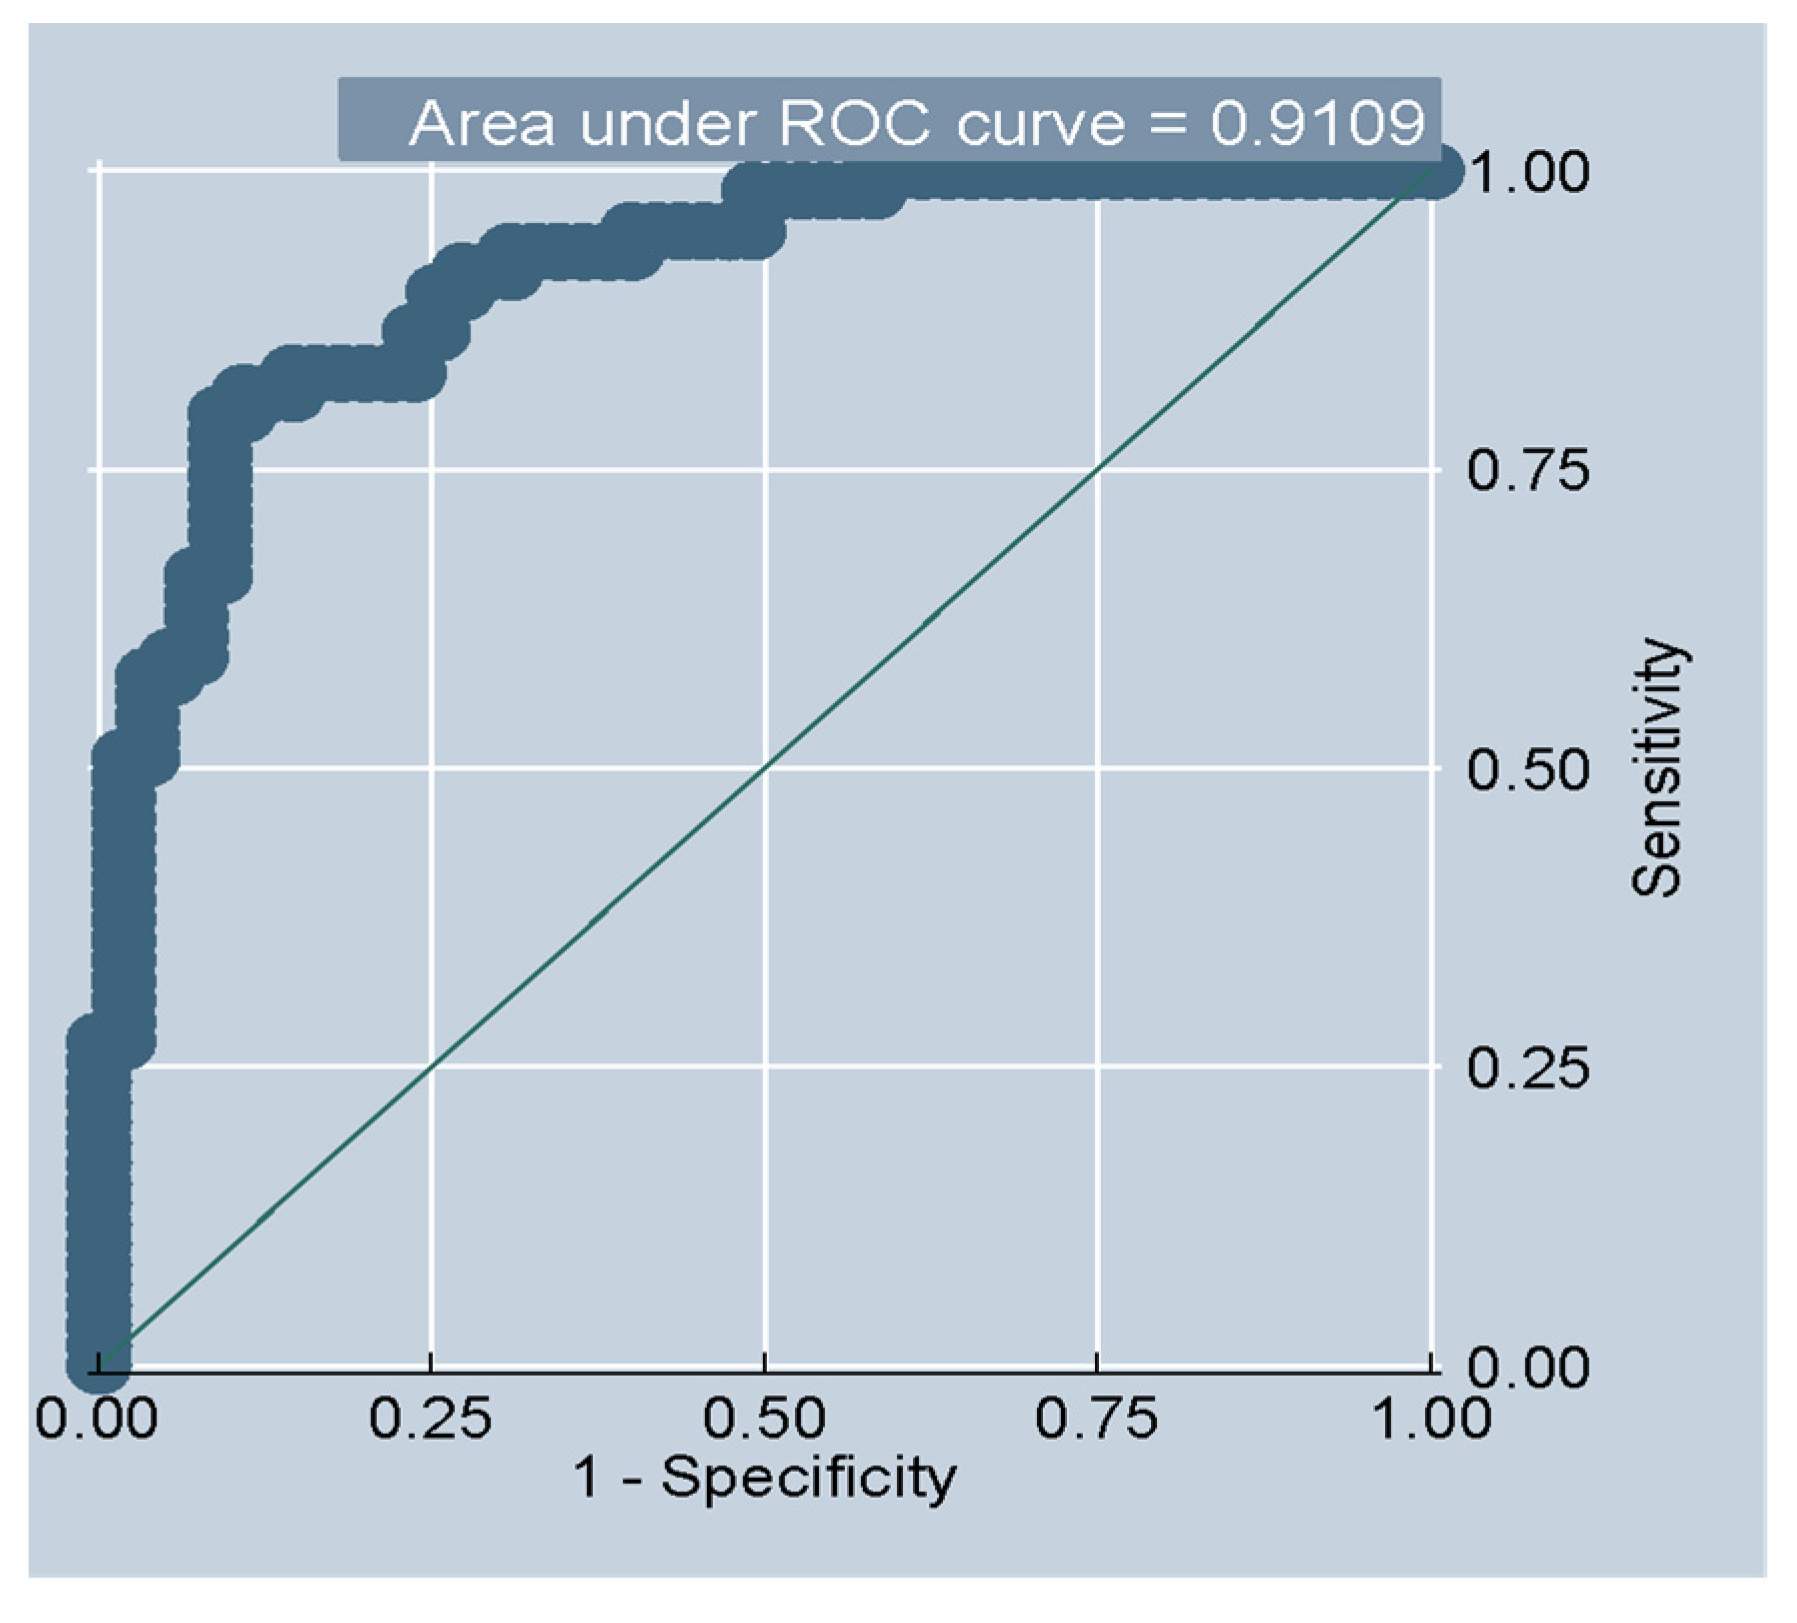
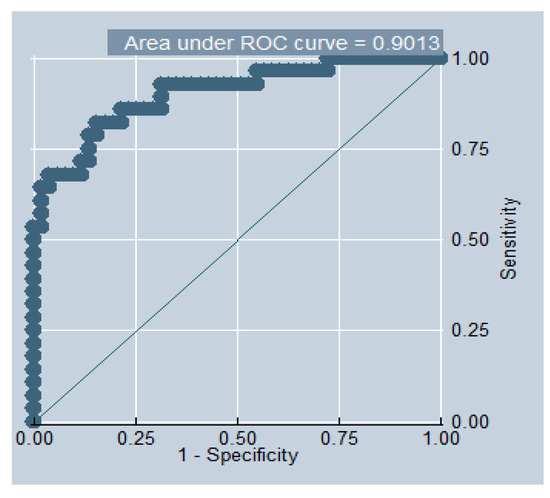
Figure A3.
Model 3.
Figure A3.
Model 3.
References
- Mbenda, M.S.; Ondoua, B.V. Épidémiologie de l’économie et Confinement de l’ Organization; Les Presse. 2020. Available online: https://www.codesria.org/spip.php?article3065&lang=en (accessed on 3 November 2021).
- Wegerif, M.C.A. “Informal” food traders and food security: Experiences from the COVID-19 response in South Africa. Food Secur. 2020, 12, 797–800. [Google Scholar] [CrossRef]
- Baldwin, R.; Weder, B.; Mauro, D. Economics in the Time of COVID-19. 2020. Available online: www.cepr.org (accessed on 3 November 2020).
- Khambule, I. The Effects of COVID-19 on the South African Informal Economy: Limits and Pitfalls of Government. Prog. Dev. Stud. 2021, 21, 380–396. [Google Scholar] [CrossRef]
- Danquah, M.; Schotte, S.; Sen, K. COVID-19 and Employment: Insights from the Sub-Saharan African Experience. 2020. Available online: https://journals.sagepub.com/doi/full/10.1177/14649934211030457 (accessed on 3 November 2021).
- Fernandes, N. Economic effects of coronavirus outbreak (COVID-19) on the world economy. SSRN Electron. J. 2020. [Google Scholar] [CrossRef]
- Guan, D.; Wang, D.; Hallegatte, S.; Huo, J.; Li, S.; Bai, Y.; Lei, T.; Xue, Q.; Davis, S.J.; Coffman, D.M.; et al. Global economic footprint of the COVID-19 pandemic. Res. Sq. 2020. [Google Scholar] [CrossRef]
- Hotez, P.J.; Alvarado, M.; Basáñez, M.-G.; Bolliger, I.; Bourne, R.; Boussinesq, M.; Brooker, S.J.; Brown, A.S.; Buckle, G.; Budke, C.M.; et al. The Global Burden of Disease Study 2010: Interpretation and Implications for the Neglected Tropical Diseases. PLoS Negl. Trop. Dis. 2014, 8, e2865. [Google Scholar] [CrossRef] [PubMed] [Green Version]
- Bodi, N.; Ghislain, F. Quels sont les effets des chocs liés à la pandémie COVID-19 au Cameroun? BEAC Occasional Paper; Banque des Etats de l’Afrique Centrale (BEAC). 2020. Available online: https://www.beac.int/wp-content/uploads/2020/08/Occasional-Paper-04-20_1.pdf (accessed on 3 November 2021).
- Nnabuife Ezimma, K.; Okoli Ifeanyi, E.; Clara, A.C. Informal Sector and Nigerian Economic Prospects: The COVID-19 Experience. Eur. J. Bus. Manag. Res. 2020, 5, 1–5. [Google Scholar]
- Avenyo, E.K.; Francois, J.N.; Zinyemba, T.P. COVID-19, Lockdowns, and Africa’s Informal Sector: Lessons from Ghana. UNU-MERIT Working Papers; Maastricht Economic and Social Research Institute on Innovation and Technology UNU-MERIT: Maastricht, The Netherlands, 2020. [Google Scholar]
- Tchamani, M. Analyse Rapide Genre Pour COVID-19. 2020. Available online: https://www.careevaluations.org/evaluation/analyse-rapide-genre-pour-covid-19-cameroun-mai-2020/ (accessed on 3 November 2021).
- Nguimkeu, B.Y.P.; Okou, C. A Tale of Africa Today: Balancing the Lives and Livelihoods of Informal Workers during the COVID-19 Pandemic. 2020. Available online: https://openknowledge.worldbank.org/handle/10986/9388 (accessed on 3 November 2021).
- Yapi-diahou, A. Cahier “ COVID-19 au Quotidien”. 2020. Available online: https://hal-univ-paris8.archives-ouvertes.fr/hal-02859844/document (accessed on 3 November 2021).
- Institut National de la Statistique (NIS). Évaluation des Effets Socioéconomiques du Coronavirus (COVID-19) au Cameroun—Phase 1. 2020. Available online: https://data2.unhcr.org/en/documents/download/79465 (accessed on 3 November 2021).
- Coibion, O.; Gorodnichenko, Y.; Weber, M. Labor Markets during the COVID-19 Crisis: A Preliminary View. J. Econ. Surv. 2020. [Google Scholar] [CrossRef]
- WIEGO. Informal Workers COVID-19 Crisis: A Global Picture of the Sudden Impact and Long-Term Risk; WIEGO: Manchester, UK, 2020. [Google Scholar]
- Estupinan, X.; Sharma, M. Job and Wage Losses in Informal Sector due to the COVID-19 Lockdown Job and Wage Losses in Informal Sector due to the COVID-19 Lockdown Measures in India. SSRN Electron. J. 2020. [Google Scholar] [CrossRef]
- Narula, R. Policy opportunities and challenges from the COVID-19 pandemic for economies with large informal sectors. J. Int. Bus. Policy 2020, 3, 302–310. [Google Scholar] [CrossRef]
- Brodeur, A.; Gray, D.; Islam, A.; Bhuiyan, S. A literature review of the economics of COVID-19. J. Econ. Surv. 2021, 35, 1007–1044. [Google Scholar] [CrossRef]
- James, M.; Douglas, C.A.; Kurayish, S.; Edward, M. Female Labor Force Participation under COVID-19 Pandemic: Evidence from the first round of the Uganda High-frequency Phone Survey on COVID-19. Res. Preprint. 2020, 1–24. [Google Scholar] [CrossRef]
- Mukhtarova, T. COVID-19 and the Informal Sector: What It Means for Women Now and in the Future. In Georgetown Institute for Women, Peace and Security Policy Brief. 2020. Available online: https://giwps.georgetown.edu/resource/covid-19-and-the-informal-sector/ (accessed on 3 November 2020).
- Moyo-Nyede, S. COVID-19 lockdown a crisis for informal traders disadvantaged by government inaction. Afrobarometer 2020, 385, 1–10. [Google Scholar]
- Pratap, B. Impact of COVID-19 on Rural Economy in India; Munich Personal RePEc Archive: New-Delhi, India, 2020. [Google Scholar]
- Angelucci, M.; Angrisani, M.; Bennett, D.; Kapteyn, A.; Schaner, S. Remote Work and the Heterogeneous Impact of COVID-19 on Employment and Health. J. Econ. Surv. 2020. [Google Scholar] [CrossRef]
- Corburn, J.; Vlahov, D.; Mberu, B.; Riley, L.; Caiaffa, W.T.; Rashid, S.F.; Ko, A.; Patel, S.; Jukur, S.; Martínez-Herrera, E.; et al. Slum Health: Arresting COVID-19 and Improving Well-Being in Urban Informal Settlements. J. Hered. 2020, 97, 348–357. [Google Scholar] [CrossRef] [Green Version]
- Wunsch-Vincent, S.; Kraemer, E. The Informal Economy in Developing Nations Hidden Engine of Innovation? WIPO: Geneva, Switzerland, 2016. [Google Scholar]
- Guerrieri, V.; Lorenzoni, G.; Straub, L.; Werning, I. Macroeconomic Implications of COVID-19: Can Negative Supply Shocks Cause Demand Shortages? Natl. Bur. Econ. Res. 2020. [Google Scholar] [CrossRef]
- Adom, D.; Adu-mensah, J.; Appiah, P. Hand-to-mouth work culture and the COVID-19 lockdown restrictions: Experiences of selected informal sector workers in Kumasi, Ghana. Res. J. Adv. Humanit. 2020, 12, 45–63. [Google Scholar]
- Komin, W.; Thepparp, R.; Subsing, B.; Engstrom, D. COVID-19 and its impact on informal sector workers: A case study of Thailand. Asia Pac. J. Soc. Work. Dev. 2020, 1–9. [Google Scholar] [CrossRef]
- Onana, J.-C. Etat des Lieux et Bref Aperçu des Effets Socio-Économiques; ULaval: Laval, QC, Canada, 2020. [Google Scholar]
- Pitoyo, A.J.; Aditya, B.; Amri, I. The impacts of COVID-19 pandemic to informal economic sector in Indonesia: Theoretical and empirical comparison. E3S Web Conf. 2020, 200, 3014. [Google Scholar] [CrossRef]
- Reichelt, M.; Makovi, K.; Sargsyan, A. The impact of COVID-19 on gender inequality in the labor market and gender-role attitudes. Eur. Soc. 2021, 23, S228–S245. [Google Scholar] [CrossRef]
- Sarkis, J.; Cohen, M.J.; Dewick, P.; Schröder, P. A brave new world: Lessons from the COVID-19 pandemic for transitioning to sustainable supply and production. Resour. Conserv. Recycl. 2020, 159, 104894. [Google Scholar] [CrossRef]
- Saunders-Hastings, P.R.; Krewski, D. Reviewing the history of pandemic influenza: Understanding patterns of emergence and transmission. Pathogens 2016, 5, 66. [Google Scholar] [CrossRef] [PubMed] [Green Version]
- Sohrabi, C.; Alsafi, Z.; O’Neill, N.; Khan, M.; Kerwan, A.; Al-Jabir, A.; Iosifidis, C.; Agha, R. World Health Organization declares global emergency: A review of the 2019 novel coronavirus (COVID-19). Int. J. Surg. 2020, 76, 71–76. [Google Scholar] [CrossRef] [PubMed]
Publisher’s Note: MDPI stays neutral with regard to jurisdictional claims in published maps and institutional affiliations. |
© 2021 by the authors. Licensee MDPI, Basel, Switzerland. This article is an open access article distributed under the terms and conditions of the Creative Commons Attribution (CC BY) license (https://creativecommons.org/licenses/by/4.0/).