Next Article in Journal
An Analysis of the Dynamic Relationship between the Global Macroeconomy and Shipping and Shipbuilding Industries
Next Article in Special Issue
A Modeling and Analysis Framework for Integrated Energy Systems Exposed to Climate Change-Induced NaTech Accidental Scenarios
Previous Article in Journal
Technological Solutions for Sustainable Development: Effects of a Visual Prompt Scaffolding-Based Virtual Reality Approach on EFL Learners’ Reading Comprehension, Learning Attitude, Motivation, and Anxiety
Previous Article in Special Issue
Grey Wolf Optimizer-Based Array Reconfiguration to Enhance Power Production from Solar Photovoltaic Plants under Different Scenarios
 
 
Correction published on 17 January 2023, see Sustainability 2023, 15(3), 1777.
Article

An Effective Control for Lead-Acid Performance Enhancement in a Hybrid Battery-Supercapacitor System Used in Transport Vehicles †

by
Mpho J. Lencwe
*,
S. P. Daniel Chowdhury
and
Thomas O. Olwal
Department of Electrical Engineering, Tshwane University of Technology, Pretoria 0001, South Africa
*
Author to whom correspondence should be addressed.
This paper extends the original conference paper published at the International Power Africa Conference, 25–28 August 2020, Nairobi, Kenya.
Sustainability 2021, 13(24), 13971; https://doi.org/10.3390/su132413971
Submission received: 28 October 2021 / Revised: 1 December 2021 / Accepted: 14 December 2021 / Published: 17 December 2021 / Corrected: 17 January 2023
(This article belongs to the Special Issue Renewable Energy Technologies for Sustainable Development)

Abstract

:
Modern vehicles have increased functioning necessities, including more energy/power, storage for recovering decelerating energy, start/stop criteria, etc. However, lead-acid batteries (LABs) possess a shorter lifetime than lithium-ion and supercapacitors energy storage systems. The use of LABs harms the operation of transport vehicles. Therefore, this research paper pursues to improve the operating performance of LABs in association with their lifetime. Integrated LAB and supercapacitor improve the battery lifetime and efficiently provide for transport vehicles’ operational requirements and implementation. The study adopts an active-parallel topology approach to hybridise LAB and supercapacitor. A fully active-parallel topology structure comprises two DC-to-DC conversion systems. LAB and supercapacitor are connected as inputs to these converters to allow effective and easy control of energy and power. A cascaded proportional integrate-derivative (PID) controller regulates the DC-to-DC converters to manage the charge/release of combined energy storage systems. The PID controls energy share between energy storage systems, hence assisting in enhancing LAB lifetime. The study presents two case studies, including the sole battery application using different capacities, and the second, by combining a battery with a supercapacitor of varying capacity sizes. A simulation software tool, Matlab/Simulink, is used to develop the model and validate the results of the system. The simulation outcomes show that the battery alone cannot serve the typical transport vehicle (TV) requirements. The battery and output voltage of the DC-to-DC conversion systems stabilises at 12 V, which ensures consistent DC bus link voltage. The energy storage (battery) state-of-charge (SoC) is reserved in the range of 90% to 96%, thus increasing its lifespan by 8200 cycles. The battery is kept at the desired voltage to supply all connected loads on the DC bus at rated device voltage. The fully active topology model for hybrid LAB and supercapacitor provides a complete degree of control for individual energy sources, thus allowing the energy storage systems to operate as they prefer.

1. Introduction

The research paper is an extended version of the original research work offered at the Power Africa Conference 2020 [1]. It includes additional materials to the introduction and related works section to enhance the paper and results significantly. Hybrid vehicles require energy storage devices to provide transitory highest loads, whereas the internal combustion engine (ICE) provides average power. The ICE assists in maintaining constant battery SoC [2]. In contrast, LABs are mature and have a low cost. However, renewable energy systems possess a high effect on cycle life cost for a standalone system. Thus, precise and effective modelling of energy storage systems is important for maximising the system’s performance and battery lifespan [3]. Additionally, in transport vehicle systems, it is important to monitor battery conditions for performance evaluation, lifespan prediction, increasing lifespan using battery management systems and strategies [4]. In cold weather conditions (i.e., 10–15 °C), the battery recharging process occurs, resulting in 0 °C of atmospheric temperature. This recharging process puts the battery under great stress through a small current, i.e., (end-of-charge). Moreover, daily peak frequencies of charging/discharging causes stratification on the energy storage electrolyte that stays permanently developed and indemnities the active battery material. Frequent charging/discharging decreases the battery’s lifetime expressively [5]. In the work of [6], Badeda et al. elaborate that battery lifespan shortens if it operates under high temperatures and if this operation prolongs for a lengthy time. Moreover, this high temperature also sources rust of the battery active materials because of the larger acid concentration stirring at the bottom of the battery through energy release. Furthermore, the evolution of hydrogen causes water loss in a battery. Moreover, lead sulphate (PbSO4) is attached to the battery’s plates when the lead-acid battery discharges. Lead sulphate has hard and soft formations. The soft one is an active material and usually lesser in size. The solid one is an active material and large. Therefore, the soft lead sulphate absorbs the charging power from a theoretical viewpoint and transforms into a liquid compound (H2SO4). However, in practice, hard lead sulphate cannot return to its original formation posterior to an electrolyte solution. Nonetheless, it continues to be attached to battery plates. This attachment of lead sulphate harms battery performance during discharge [7,8,9]. LABs have operational issues, including positive electrode cyclic performance, affected by rapid volumetric fade triggered by unstiffening and cracking. Long-life tests affect battery lifespan [10]. According to Mekonnen et al. [11], the study elaborates that the key factor to battery life degradation is temperature, excessive charge/discharge process, improper storage, and handling, respectively. Kumar et al. [12] report that the battery’s lifetime and innocuous functioning rely heavily on the current level used to charge and discharge the battery. It also includes different operating modes in stated bounds, plus entirely temperature differences. Furthermore, current automobile usage requires a system that calls for battery peak currents. The battery must deep discharge for a varied voltage range until it is bare. The latter harms the performance of the battery. A hybridised LAB with supercapacitor improves LABs dynamic performance under partial SoC duty and its lifespan as is essential for cross electric vehicles (CEVs). Presently, battery electric vehicles (BEVs) technology is promising; it can lead to de-carbonisation for light-duty vehicle fleets that use ICEs and provide liberation from lubricants. Electric vehicles bargain rewards for high efficacy, torque, no gas production, decent speeding-up, less sound, and charging during the night. However, these vehicles have problems caused by their associated energy storage systems, which relate to the range and less lifetime, expensive production cost; total compact size; partial highest speed; and long-duration charging. On the one hand, battery value denotes a vital portion of the overall BEVs costs. Hence, decreasing the price is of utmost importance [13,14]. Additionally, plug-in hybrid electric vehicles (i.e., PHEVs), their energy storage systems are re-charged right from the wall socket supply. These vehicles have ICE, which may help in battery recharging and use ICE once the capacity of the battery is small and extra power is needed. PHEVs are inexpensive. Accordingly, because of their grid charging capability and driven by a cleaner source of electricity than gasoline or diesel, they release expressively fewer contaminants when related to ICE-only automobiles [15,16]. Furthermore, through flooded LABs charge/discharge, the acid absorption varies. Hence, the sulphuric-acid bowls to the battery bottom compared to the upper region of the battery. The phenomenon stands for “acid stratification”. This marvel adjusts features of the battery to a particular level, decreases the battery total performance, and dynamic charge acceptance (DCA) significantly [17]. So, this research paper pursues the enhancement of lead-acid battery performance, particularly its lifetime. The performance improvement is performed by hybridising LAB with supercapacitor. The hybridisation of LAB and supercapacitor is formed by incorporating power electronic DC-to-DC converters for each energy source to independently ease the control structure using an active hybrid topology approach. This topology approach has more degree of freedom and allows effective control of dissimilar energy sources. The DC-to-DC converter control using cascaded PID provides an effective energy share between energy sources, thus ensuring the battery SoC is kept within the set constraints, and the voltage does not vary highly. The effective energy share improves battery performance in terms of lifespan, ensuring that the battery is not over-charged or under-charged. In addition, it provides an acceptable battery DCA to appropriately charge the battery during the reversed current. The hybrid system is tested under ±25 °C conditions because of the position placement of LABs in vehicles. It is positioned such that there is a constant air flow for cooling purposes. Hence, the ±25 °C assessment condition suffice for the purpose of the article and under standard circumstances.
The research article arrangement is as follows; Section 2 deliberates some of the connected research works available in the literature. Section 3 of the paper designates Materials and Methods applied to achieve the required research results; Section 4 reveals the research results and discusses the results in detail. Hereafter, Section 5 Completes the research paper with the provision of some future recommendations.

2. Related Works

This unit carries out the discussion of related works that are available in the existing literature. In [18], the authors propose a combination of supercapacitor and battery system to assist the battery with wild power delivery subtleties during TV’s deceleration and rushing speed. Janskowska et al. [19] propose a LAB and supercapacitor hybrid ESS to start an ICE automobile. They connect the battery and supercapacitor in series. However, the configuration method for hybridising the energy storage system is not practical due to supercapacitor tending to charge from the battery ESS, which could cause output DC-link voltage instability. In [7], the study proposes a hybrid LAB and supercapacitor to provide an improved charging/discharging criterion using atom search algorithm (ASA) and fractional order proportional integrate-derivative (FOPID) control to solve sulphation problem in LABs and enhance its lifespan during TV operation. Smith et al. [20] conduct an experimental evaluation for the effect of high-frequency ripple current and its impact on lead-acid battery DCA.
The study results show that high-frequency AC ripple current enhances the DCA of LABs by more than 50% without having any negative impact on the battery SoC. Whereas, Farjah et al. [18] elaborate that to provide the power required at a specific voltage level for TVs, the energy storage systems (ESSs) to be used need to be connected in series. However, ensuring a perfect voltage matching is highly unlikely over time. Additionally, enhancing battery lifespan in such configurations is difficult. Moreover, voltage mismatch during different operating conditions causes a reduced battery lifespan. In the work of [6], Badeda emphasises that the primary variable that shortens battery lifetime is high temperature. If this high temperature prolongs for an extended period, it significantly affects the battery’s performance. Moreover, it forms corrosion in the battery’s active materials. Additionally, more acid concentration is included at the bottom of the battery during discharge, thus creating hydrogen evolution, which results in water loss. Table 1 shows the types of LABs and their advantages and disadvantages in the automobile sector.
In the works of [21,22], Lencwe et al. emphasise LAB’s performance evaluation, which further reports that the criteria used to charge and discharge LABs can affect their performance significantly. Henceforth, if effective management of the setting or discharging process of LABs is maintained, it could substantially improve its operational performance. In [23], the study uses a field-programmable logic array (FPGA) to develop an unconventional BMS. The systems result shows a decent precision of greater than 99%. The study did not evaluate battery performance in terms of lifespan. Regardless of power electronics used to govern and alter the component’s power efficiently, present DC-to-DC converters and their regulators have restricted dimensions, effectiveness, undulations of currents, stresses of voltage, suppleness, and rate, respectively. In [24], an appropriate system for managing battery operation (BMS) and used in TVs would have precise structures that monitor and evaluate battery states, charge control, a technique for cell balancing, etc. There are numerous topology methods used to hybridise energy storage systems. Sreedhar et al. [25] relate diverse topologies of the converter to the hybridisation of dissimilar energy storage systems. Imitation results of the study indicate reduced battery peak currents of 40% and a rise in vehicle travel (in km). The study uses the United States of America (USA) driving cycle to obtain the results. Typical hybrid topologies of LAB and supercapacitor are shown in Figure 1.
The study [27] proposes an optimal control approach for a hybrid battery/supercapacitor used in neighbourhood transport vehicles. The research learning shows a decrease in LAB’s transient currents, and the system improves the battery’s functioning efficacy and lifetime throughout a particular driving sequence. Nevertheless, the study is not precise in terms of the driving sequence used during the testing process. Ferg et al. [28] evaluate lead-acid (LA) cells’ performance. These cells are hybridised with supercapacitors to operate using partial state of capacity (PSoC) cyclic circumstances. Yet, the method used shows an adverse consequence because the topology used is ineffective for the performance analysis of multi-source systems. In this topology, the supercapacitor charges from the battery cells when the supercapacitor capacity decreases. Therefore, by providing adequate energy share between LAB and supercapacitor, this research contribution is as follows:
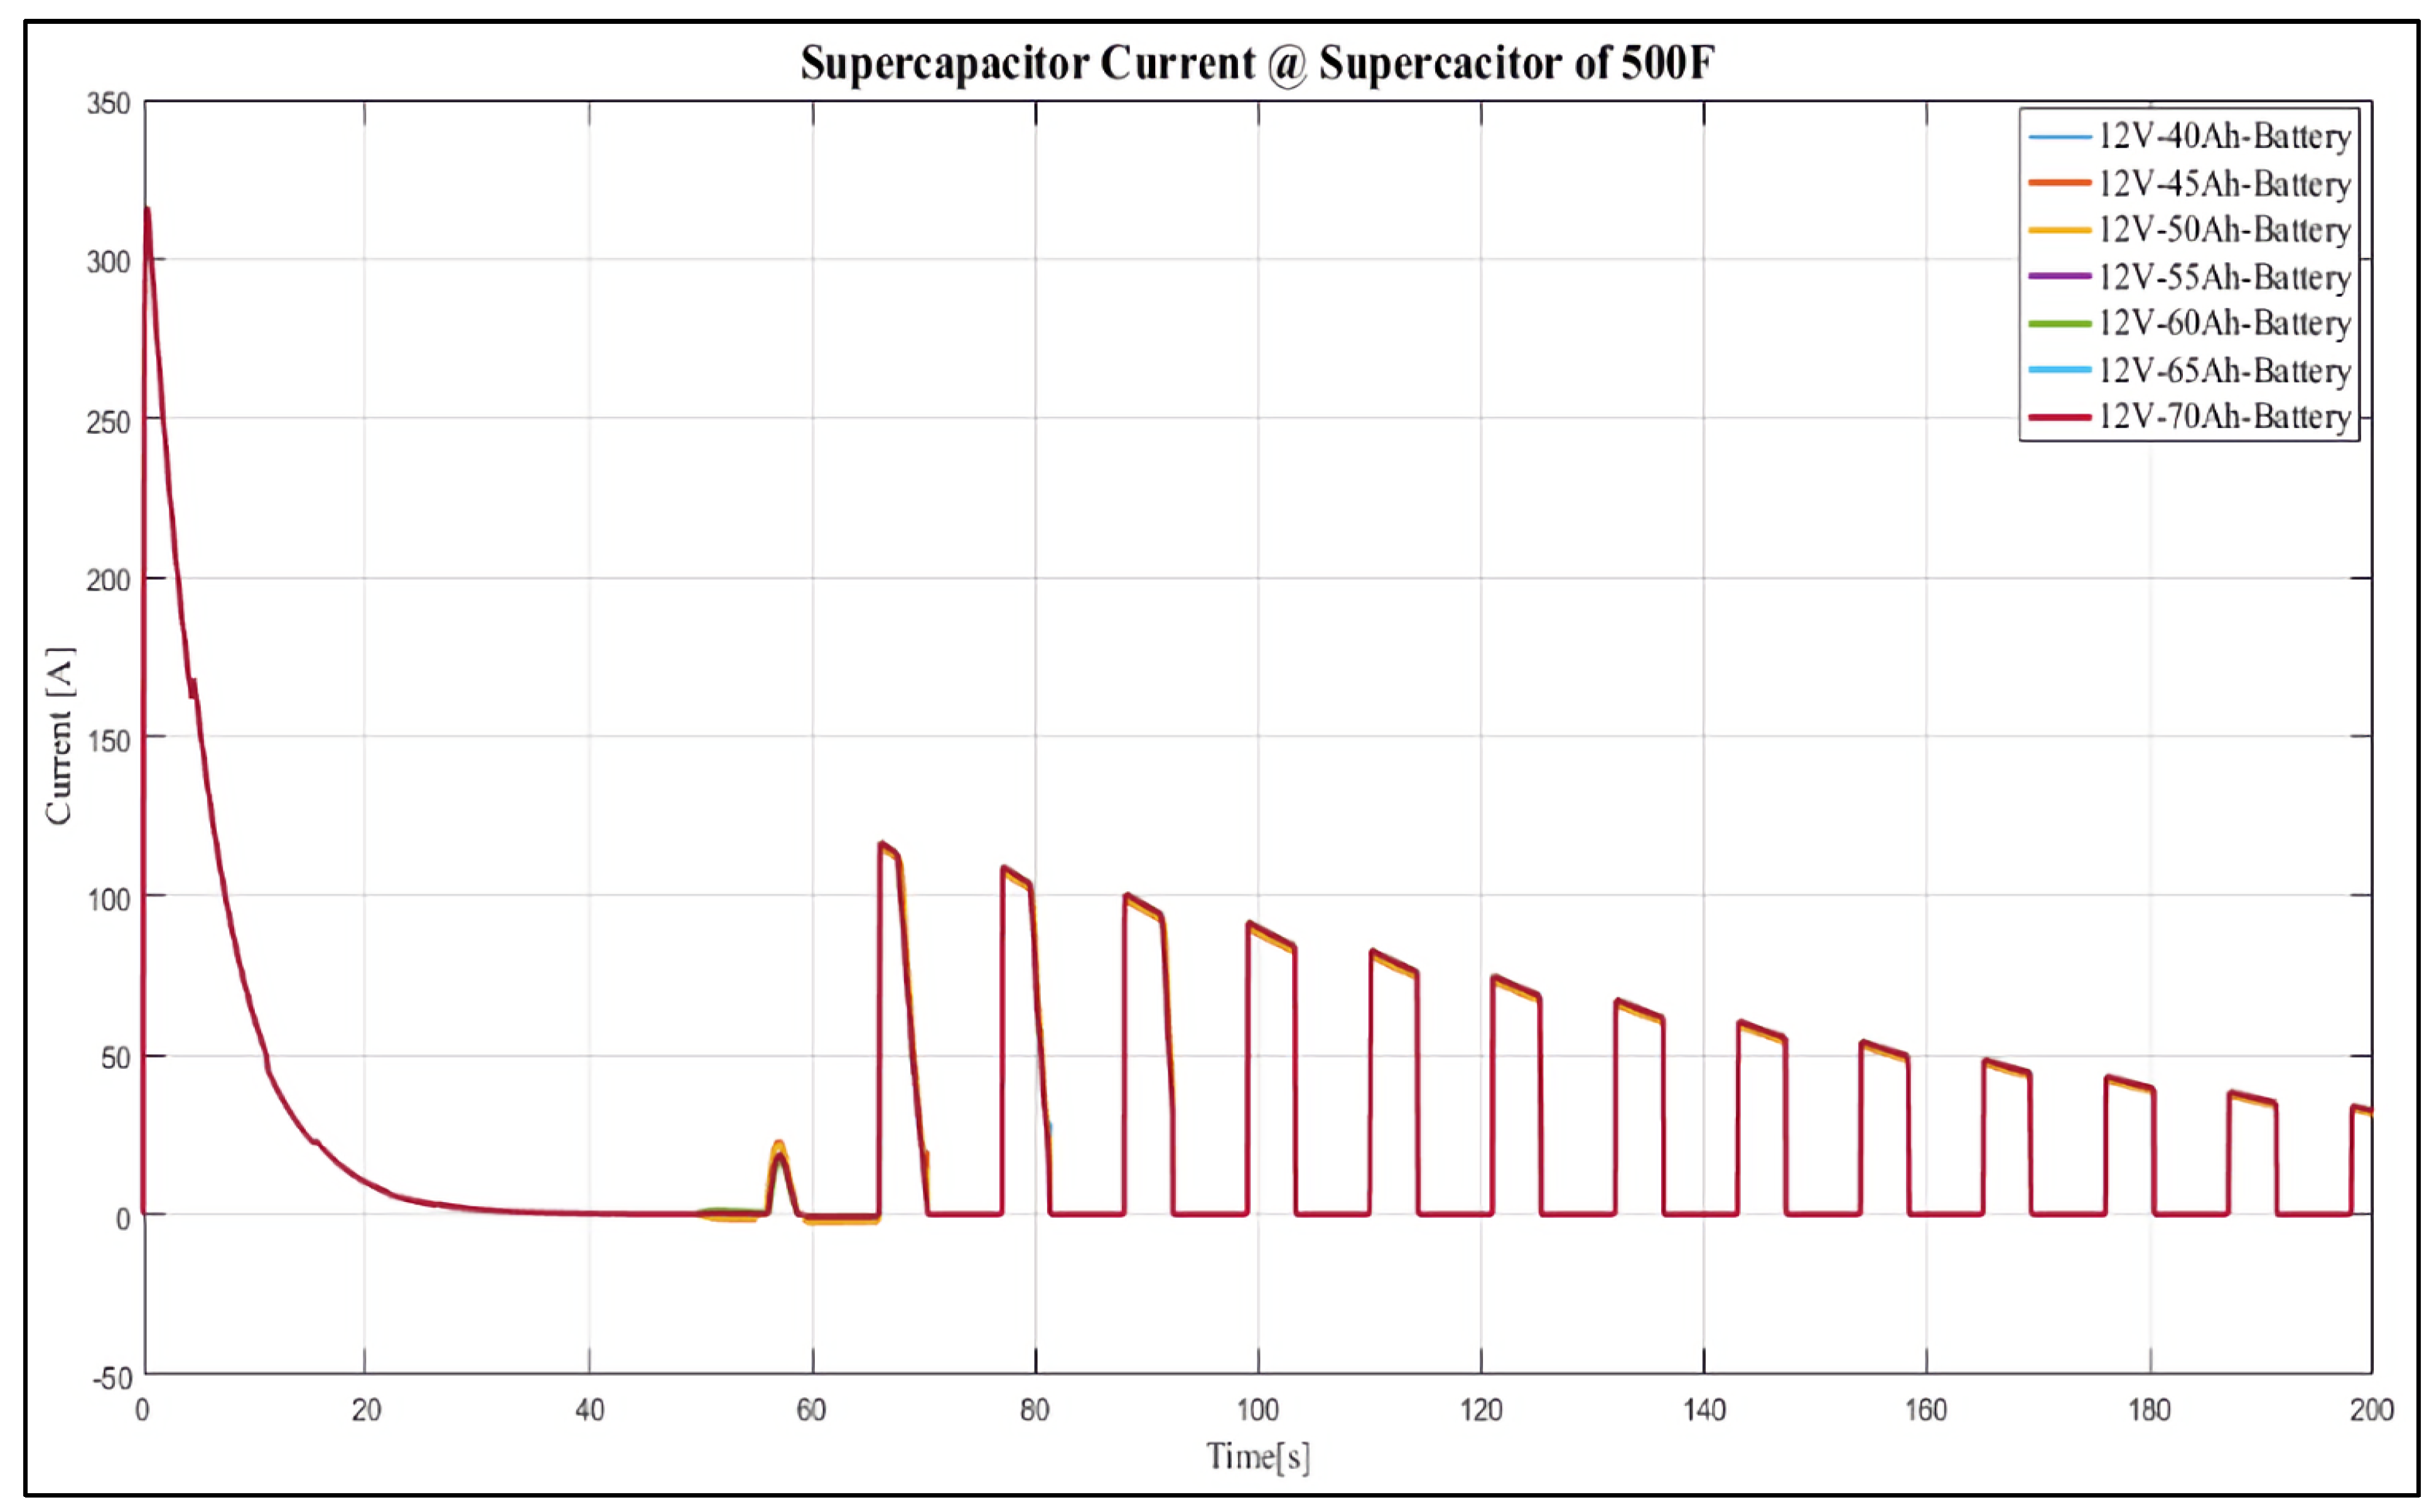
  • Currently, LABs have seen minimal adoption for use in modern vehicle applications as compared to lithium-ion. The biggest challenge of well-established LABs is its lifespan being about five years due to extra strain by high current demand on the battery during starting, and it leads to reducing the lifespan. Therefore, to enhance battery lifespan from 5 years to about eight years, hybridisation is needed. The research article presents a new application for LABs to meet these vehicles requirements by hybridising it with supercapacitor. The supercapacitor supplies a significant starting current (i.e., 400 A for up to 3 s); thus, it enhances LAB’s lifespan;
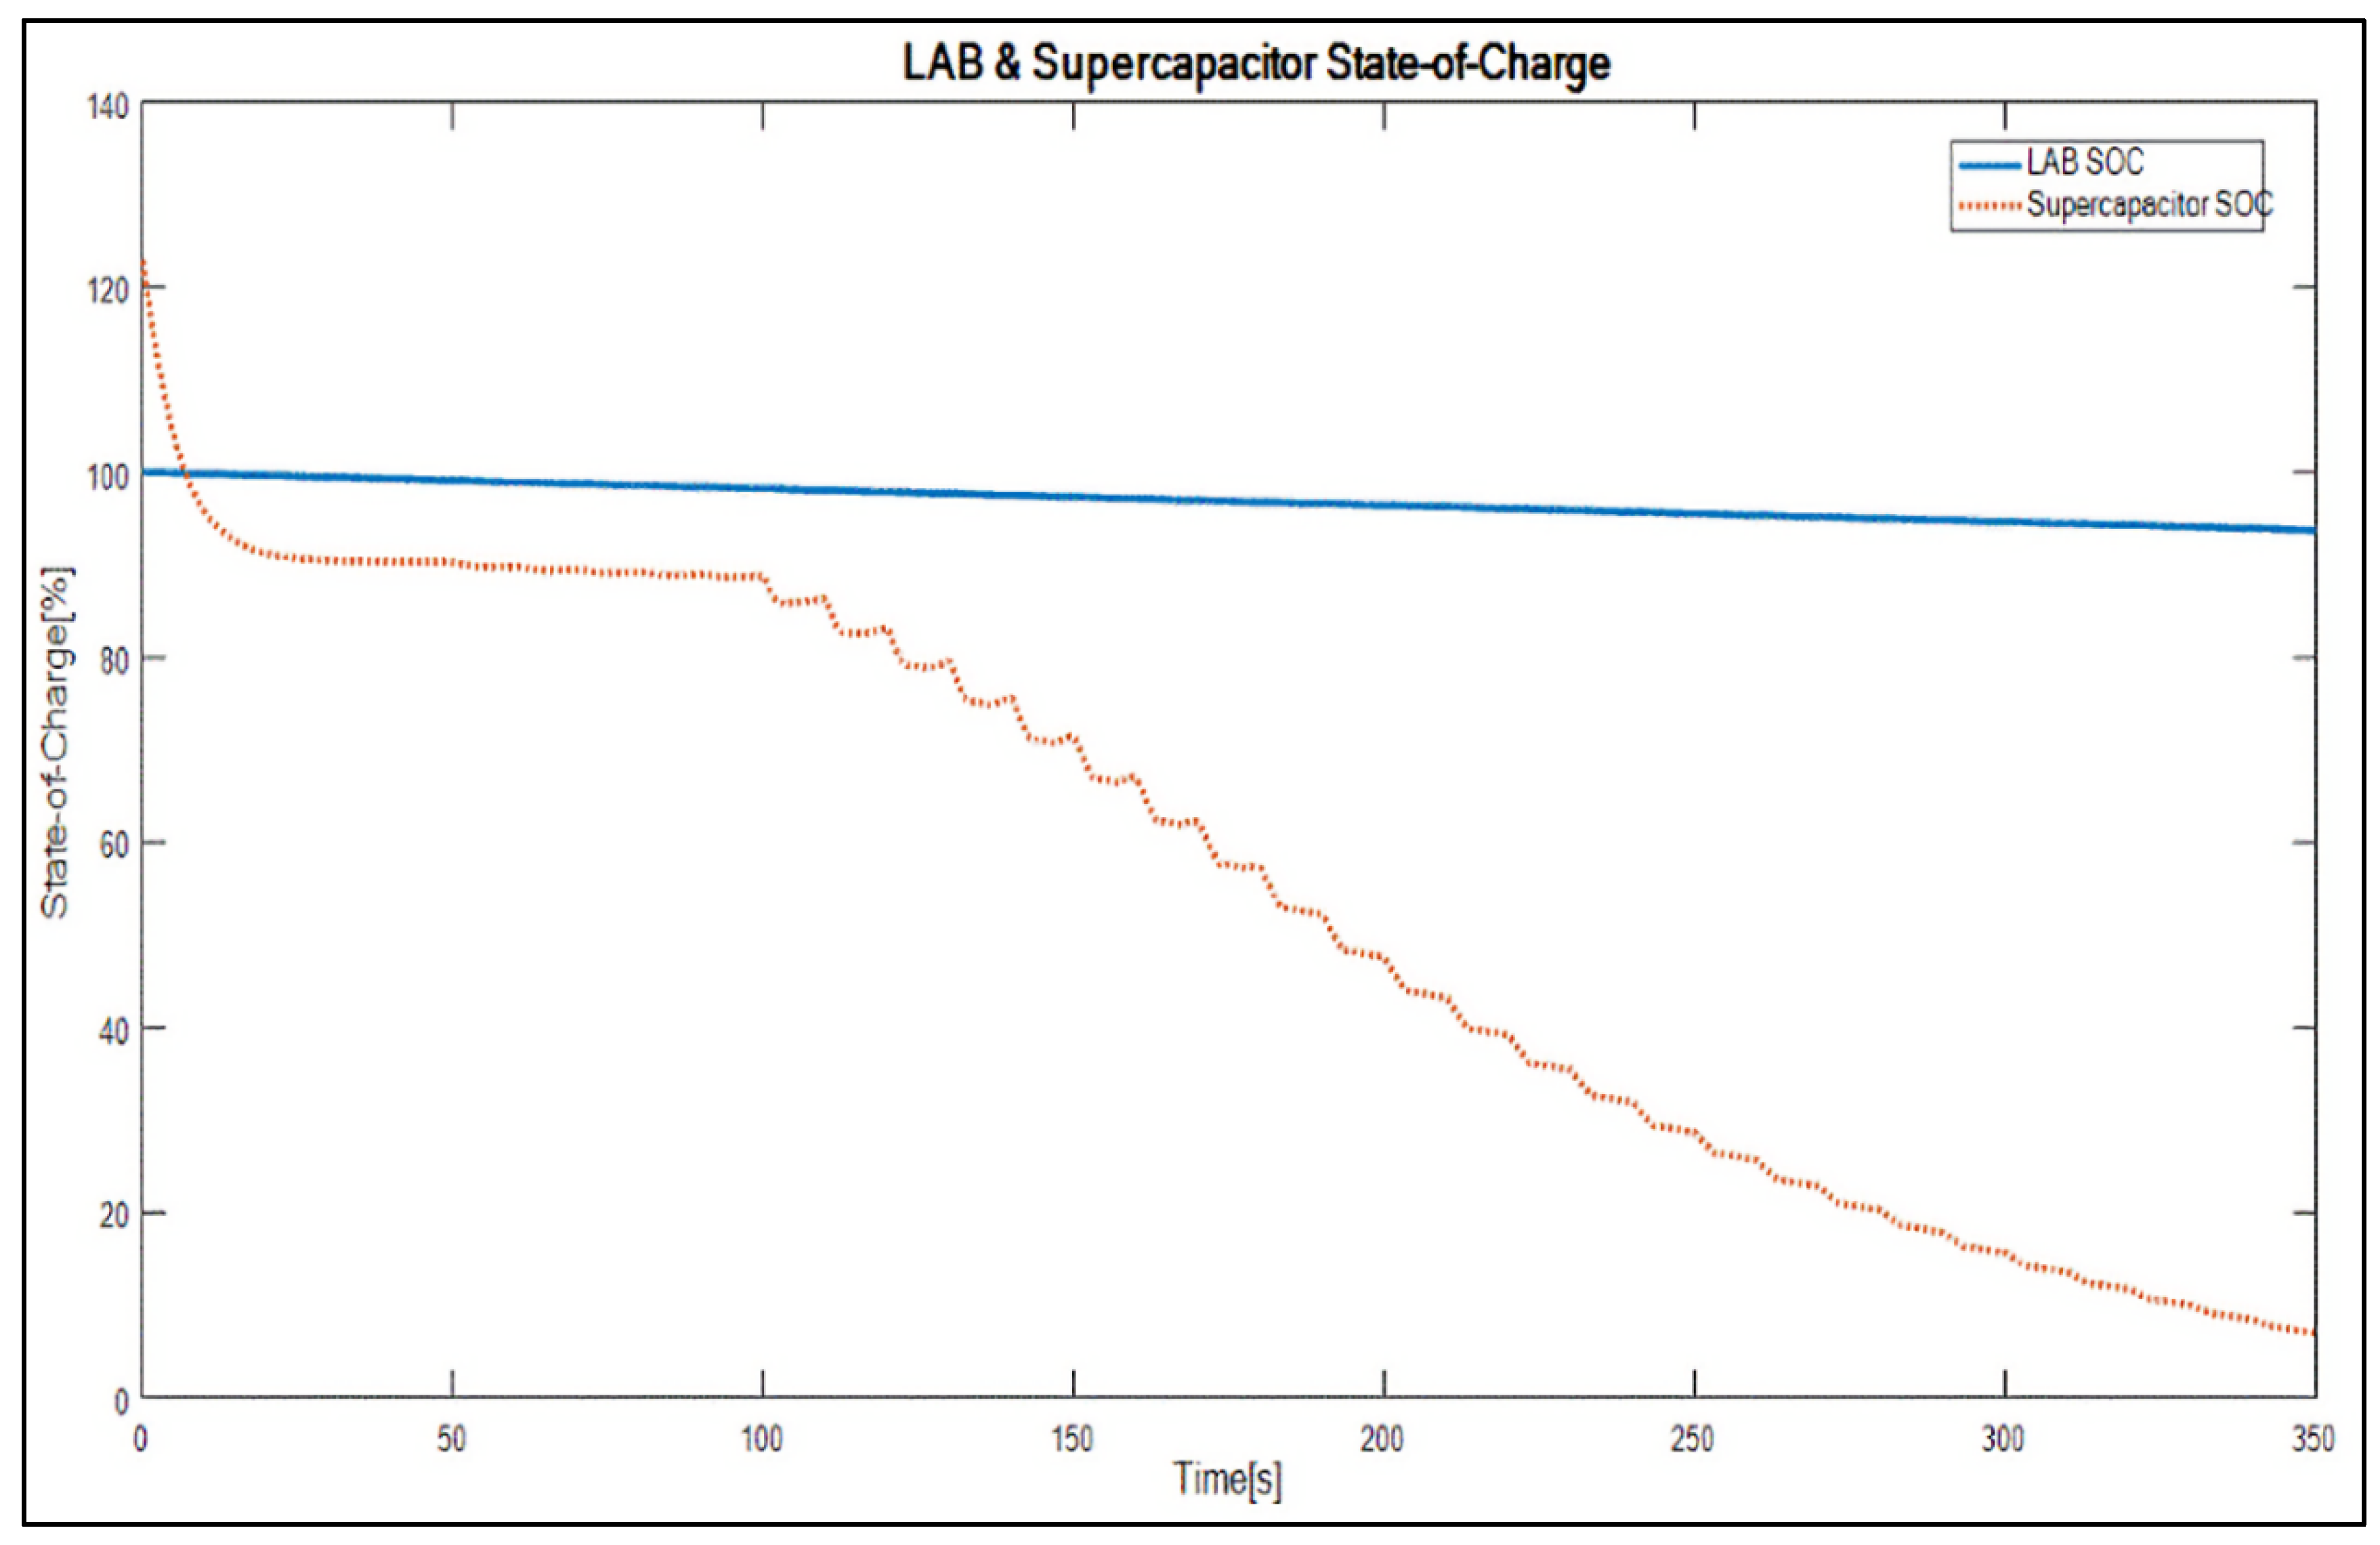
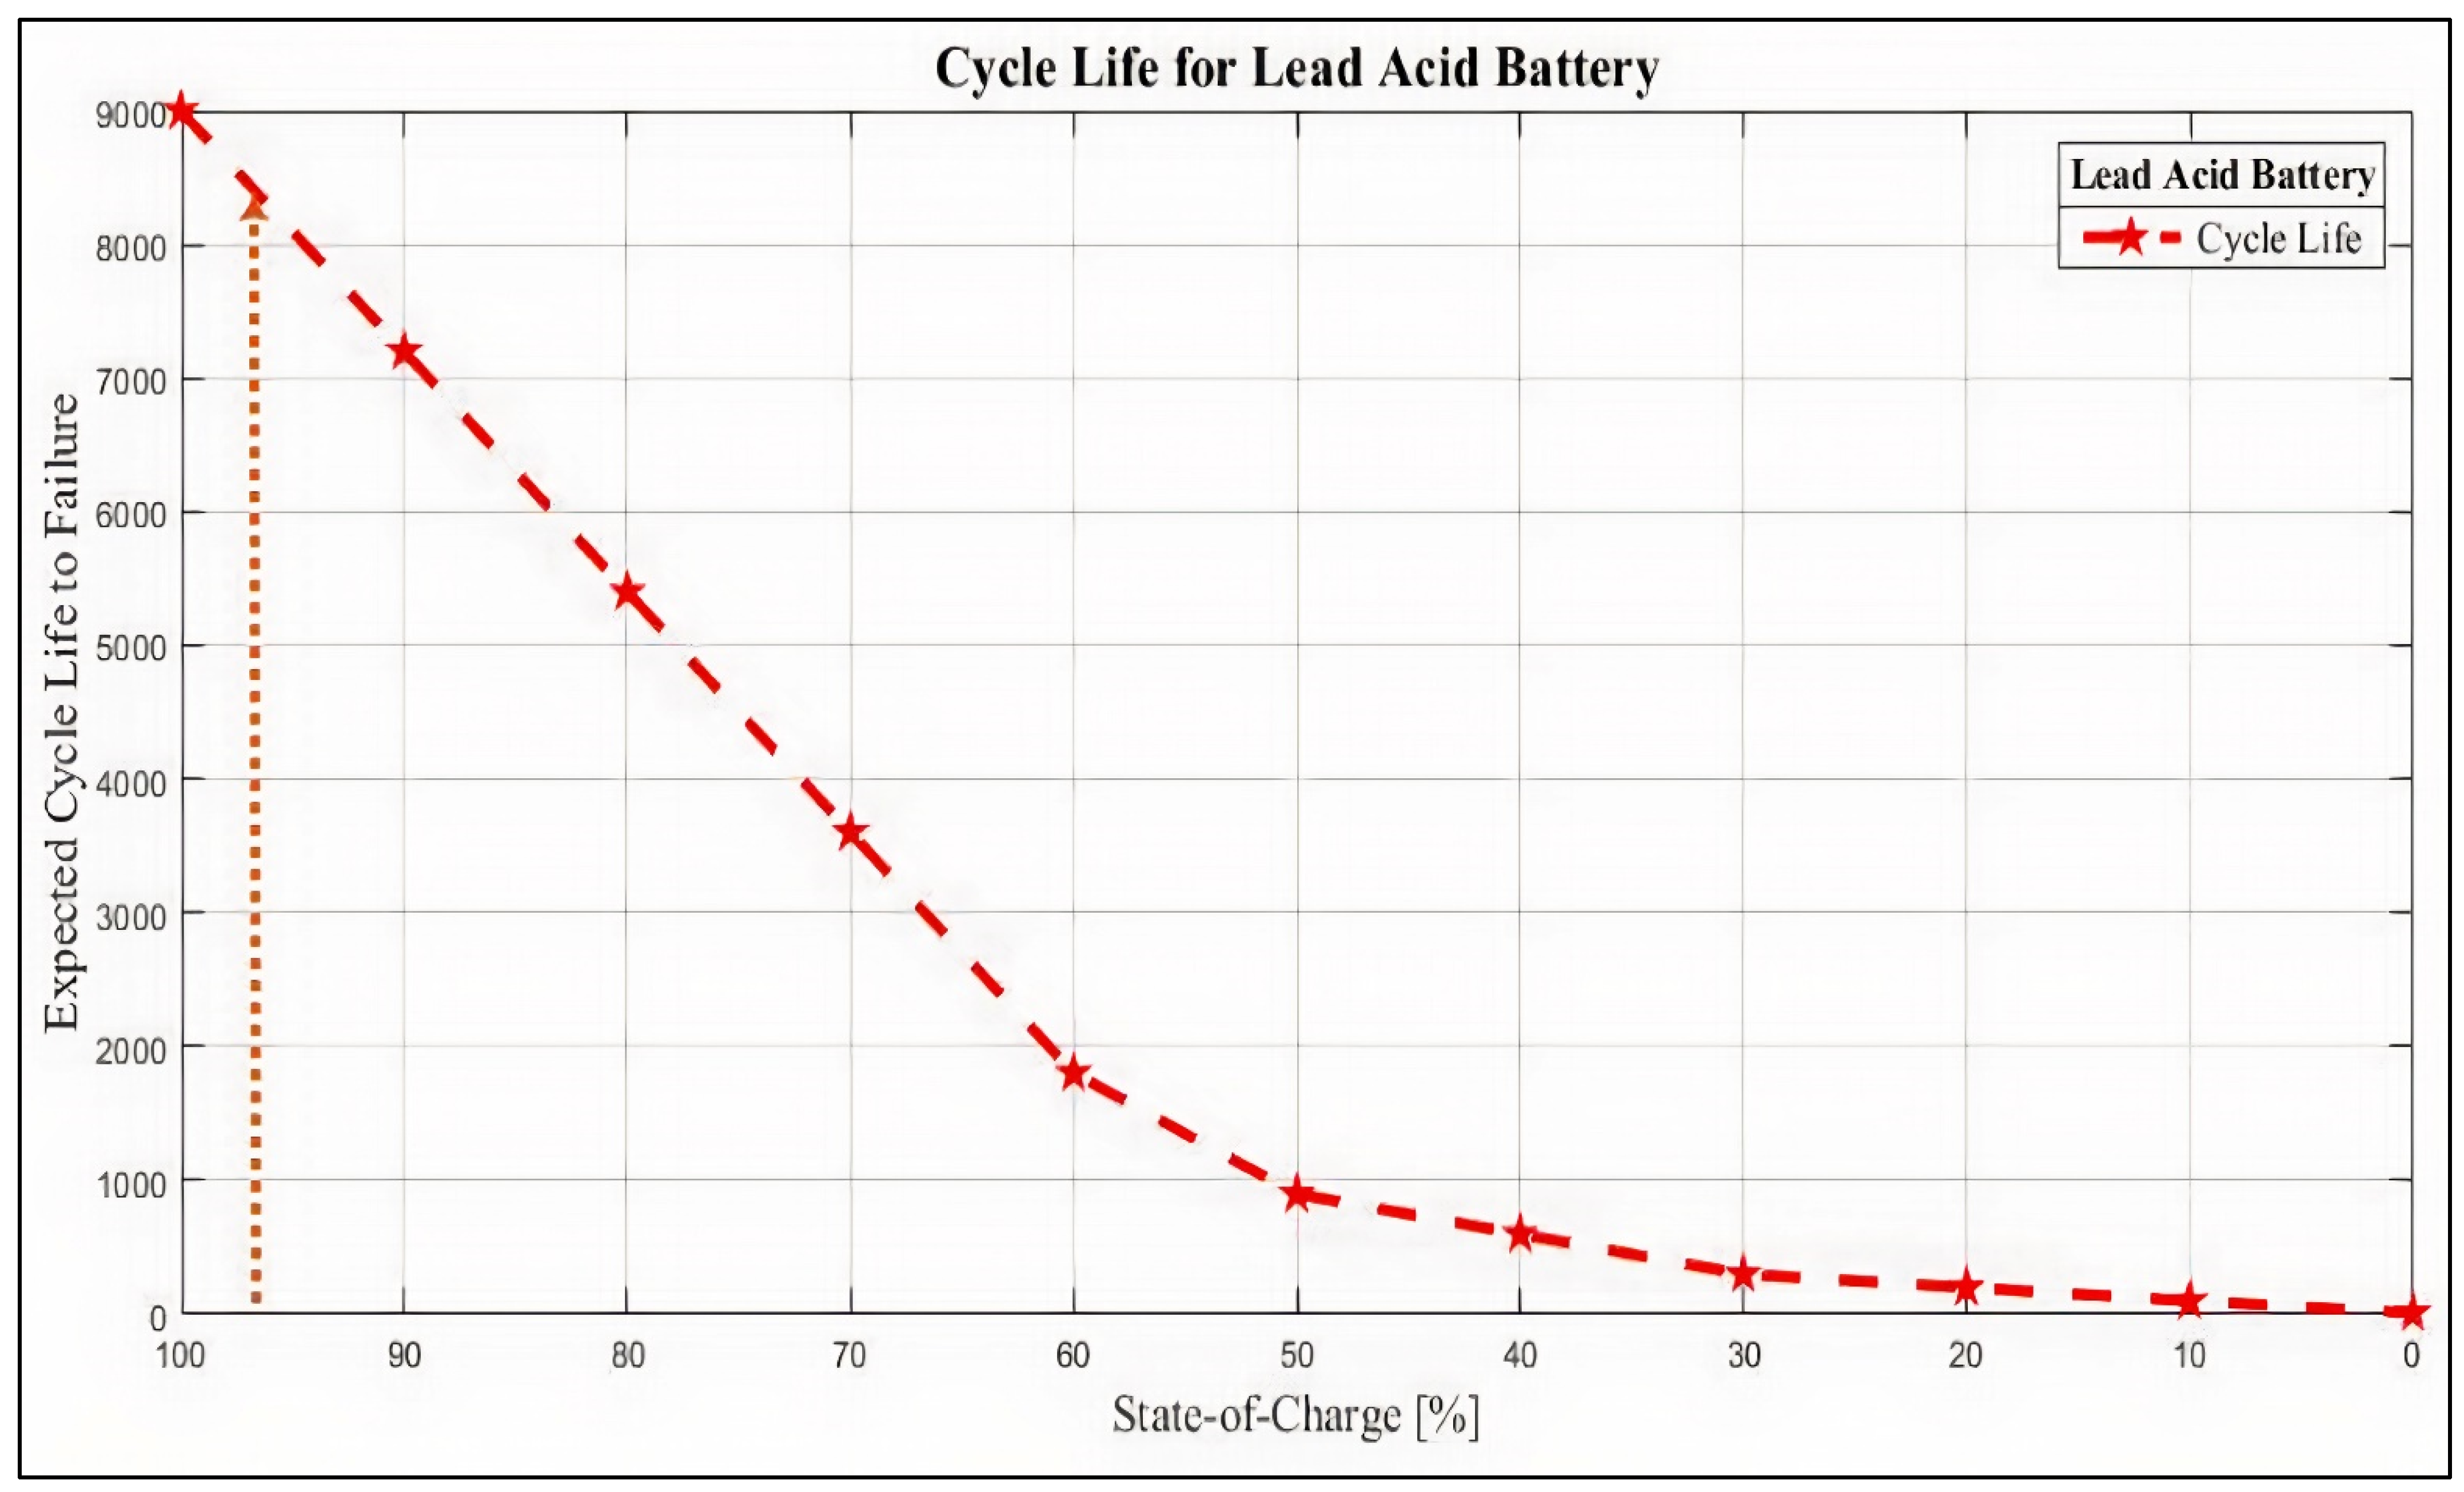
  • It maintains the battery SoC at the highest level (i.e., 90%–95% SoC) to mitigate sulphation and allow at least 4% DCA;
  • It enhances battery-cycling lifespan by 8200 cycles;
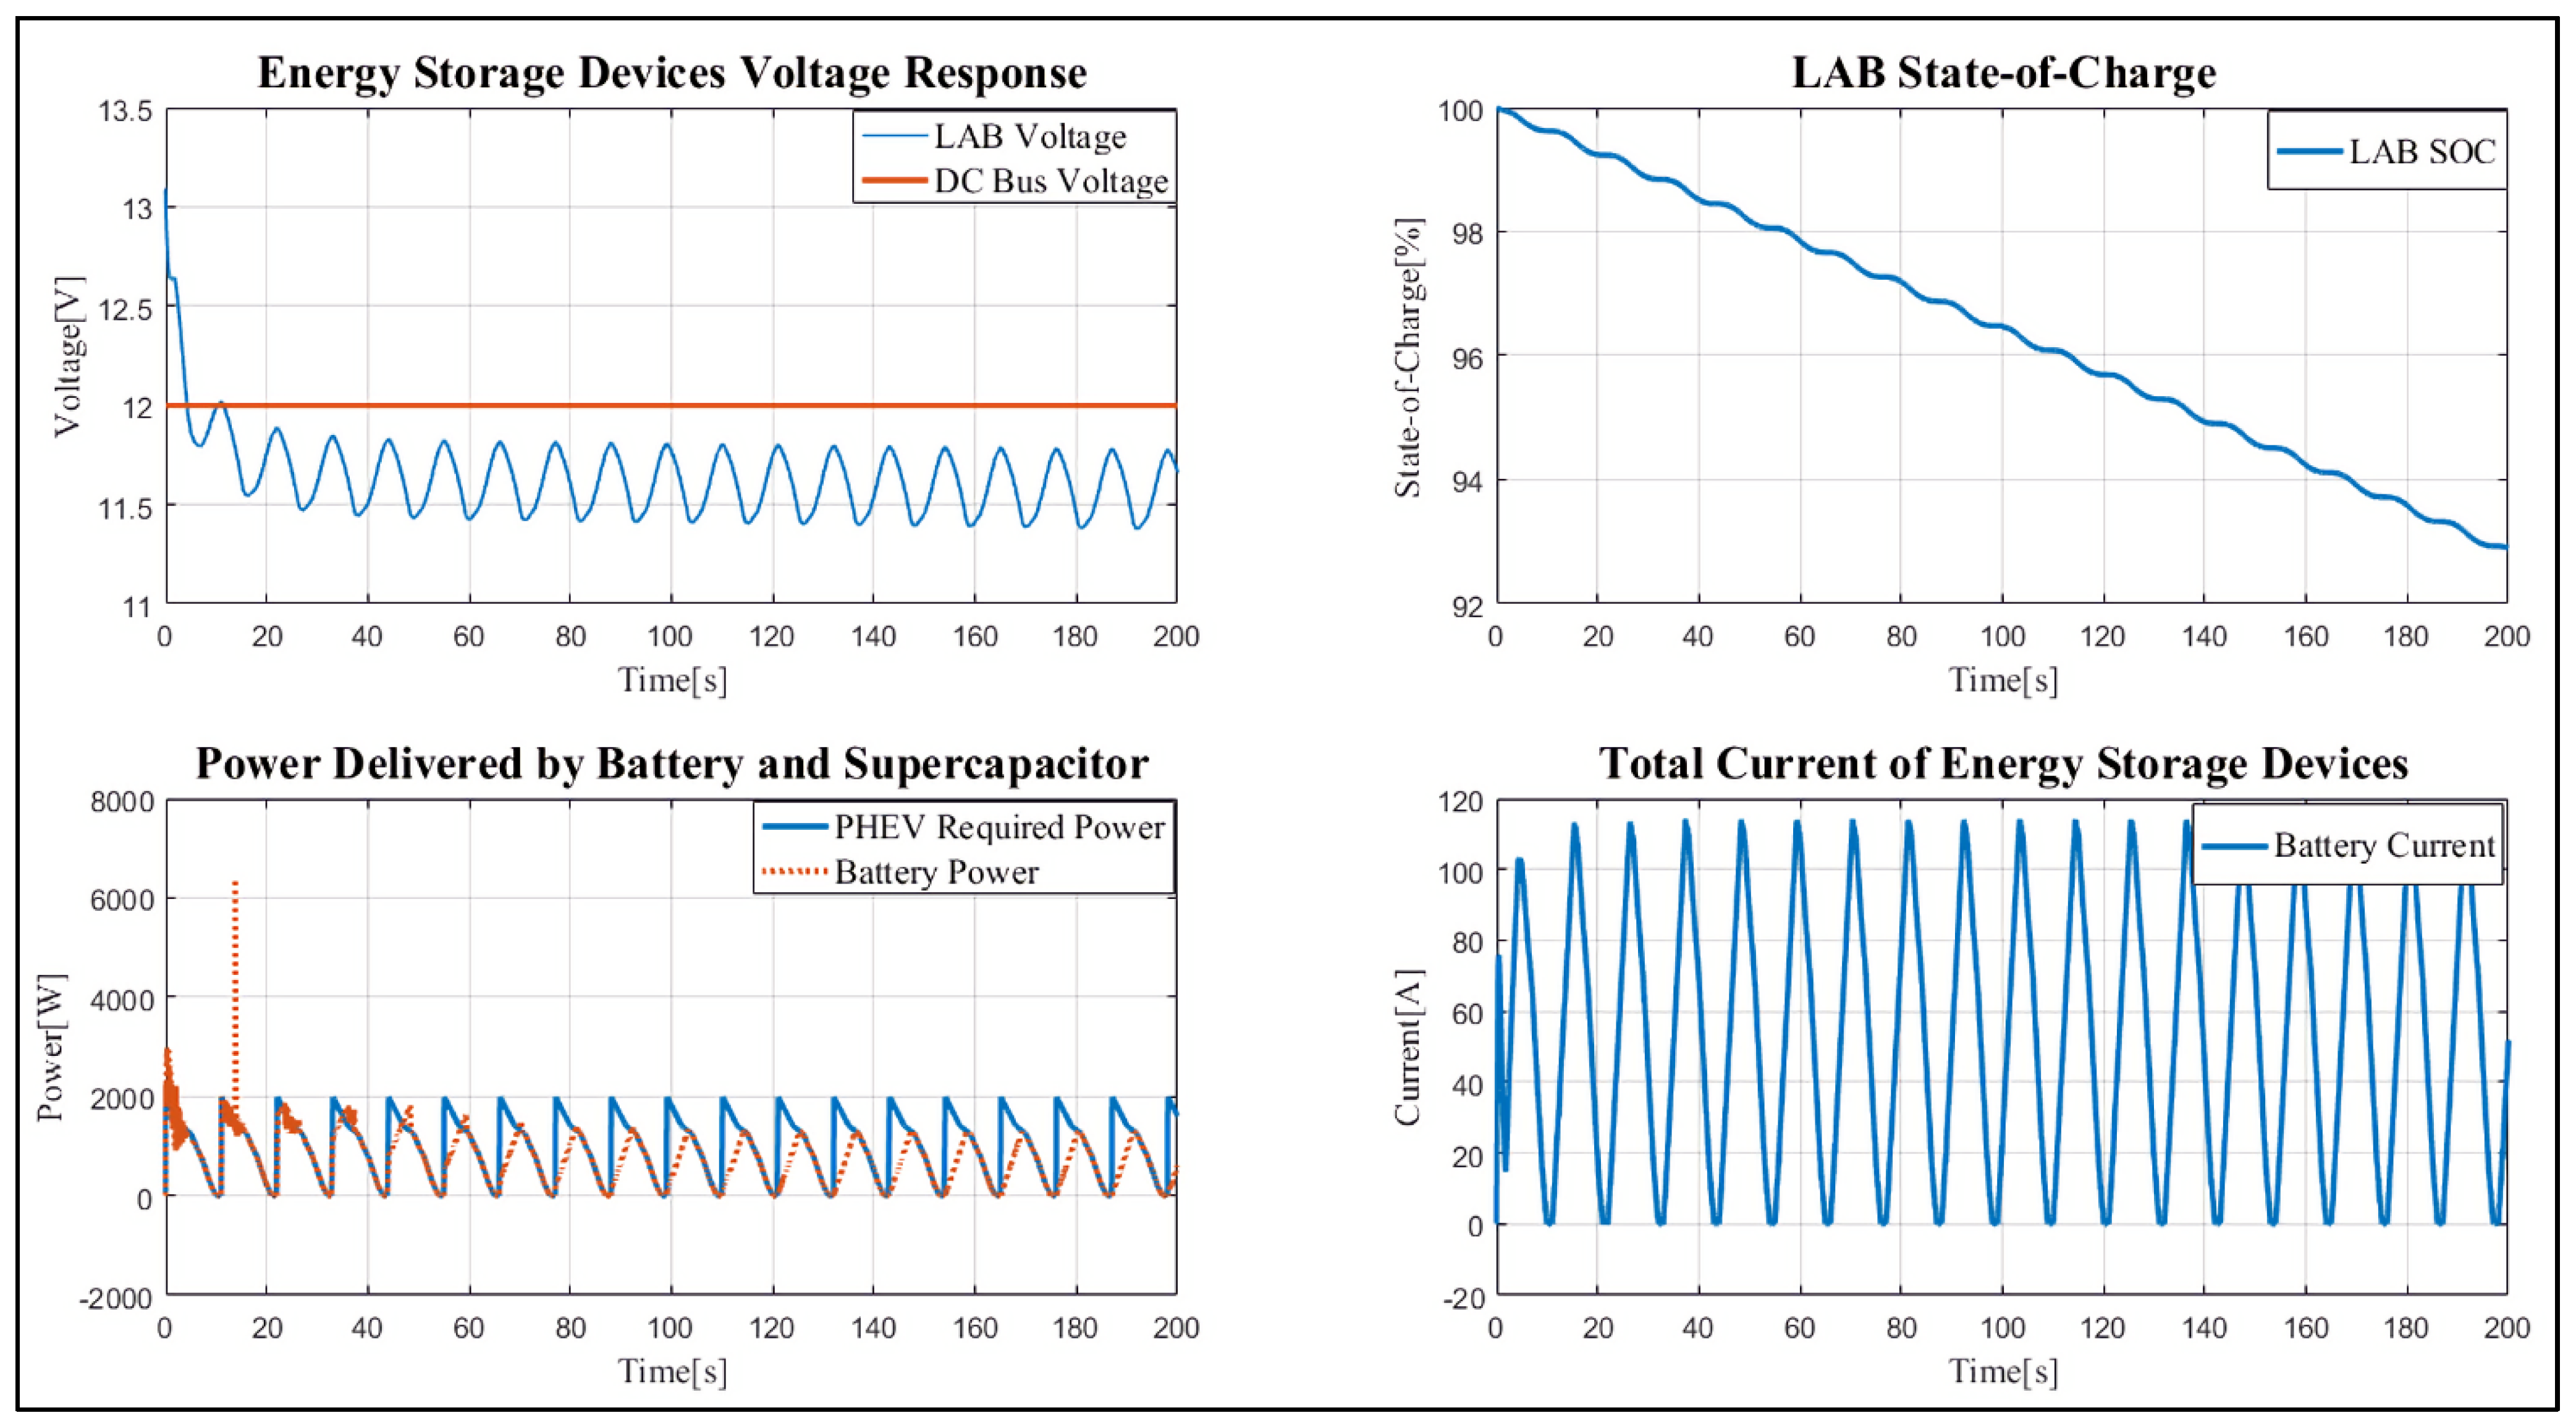
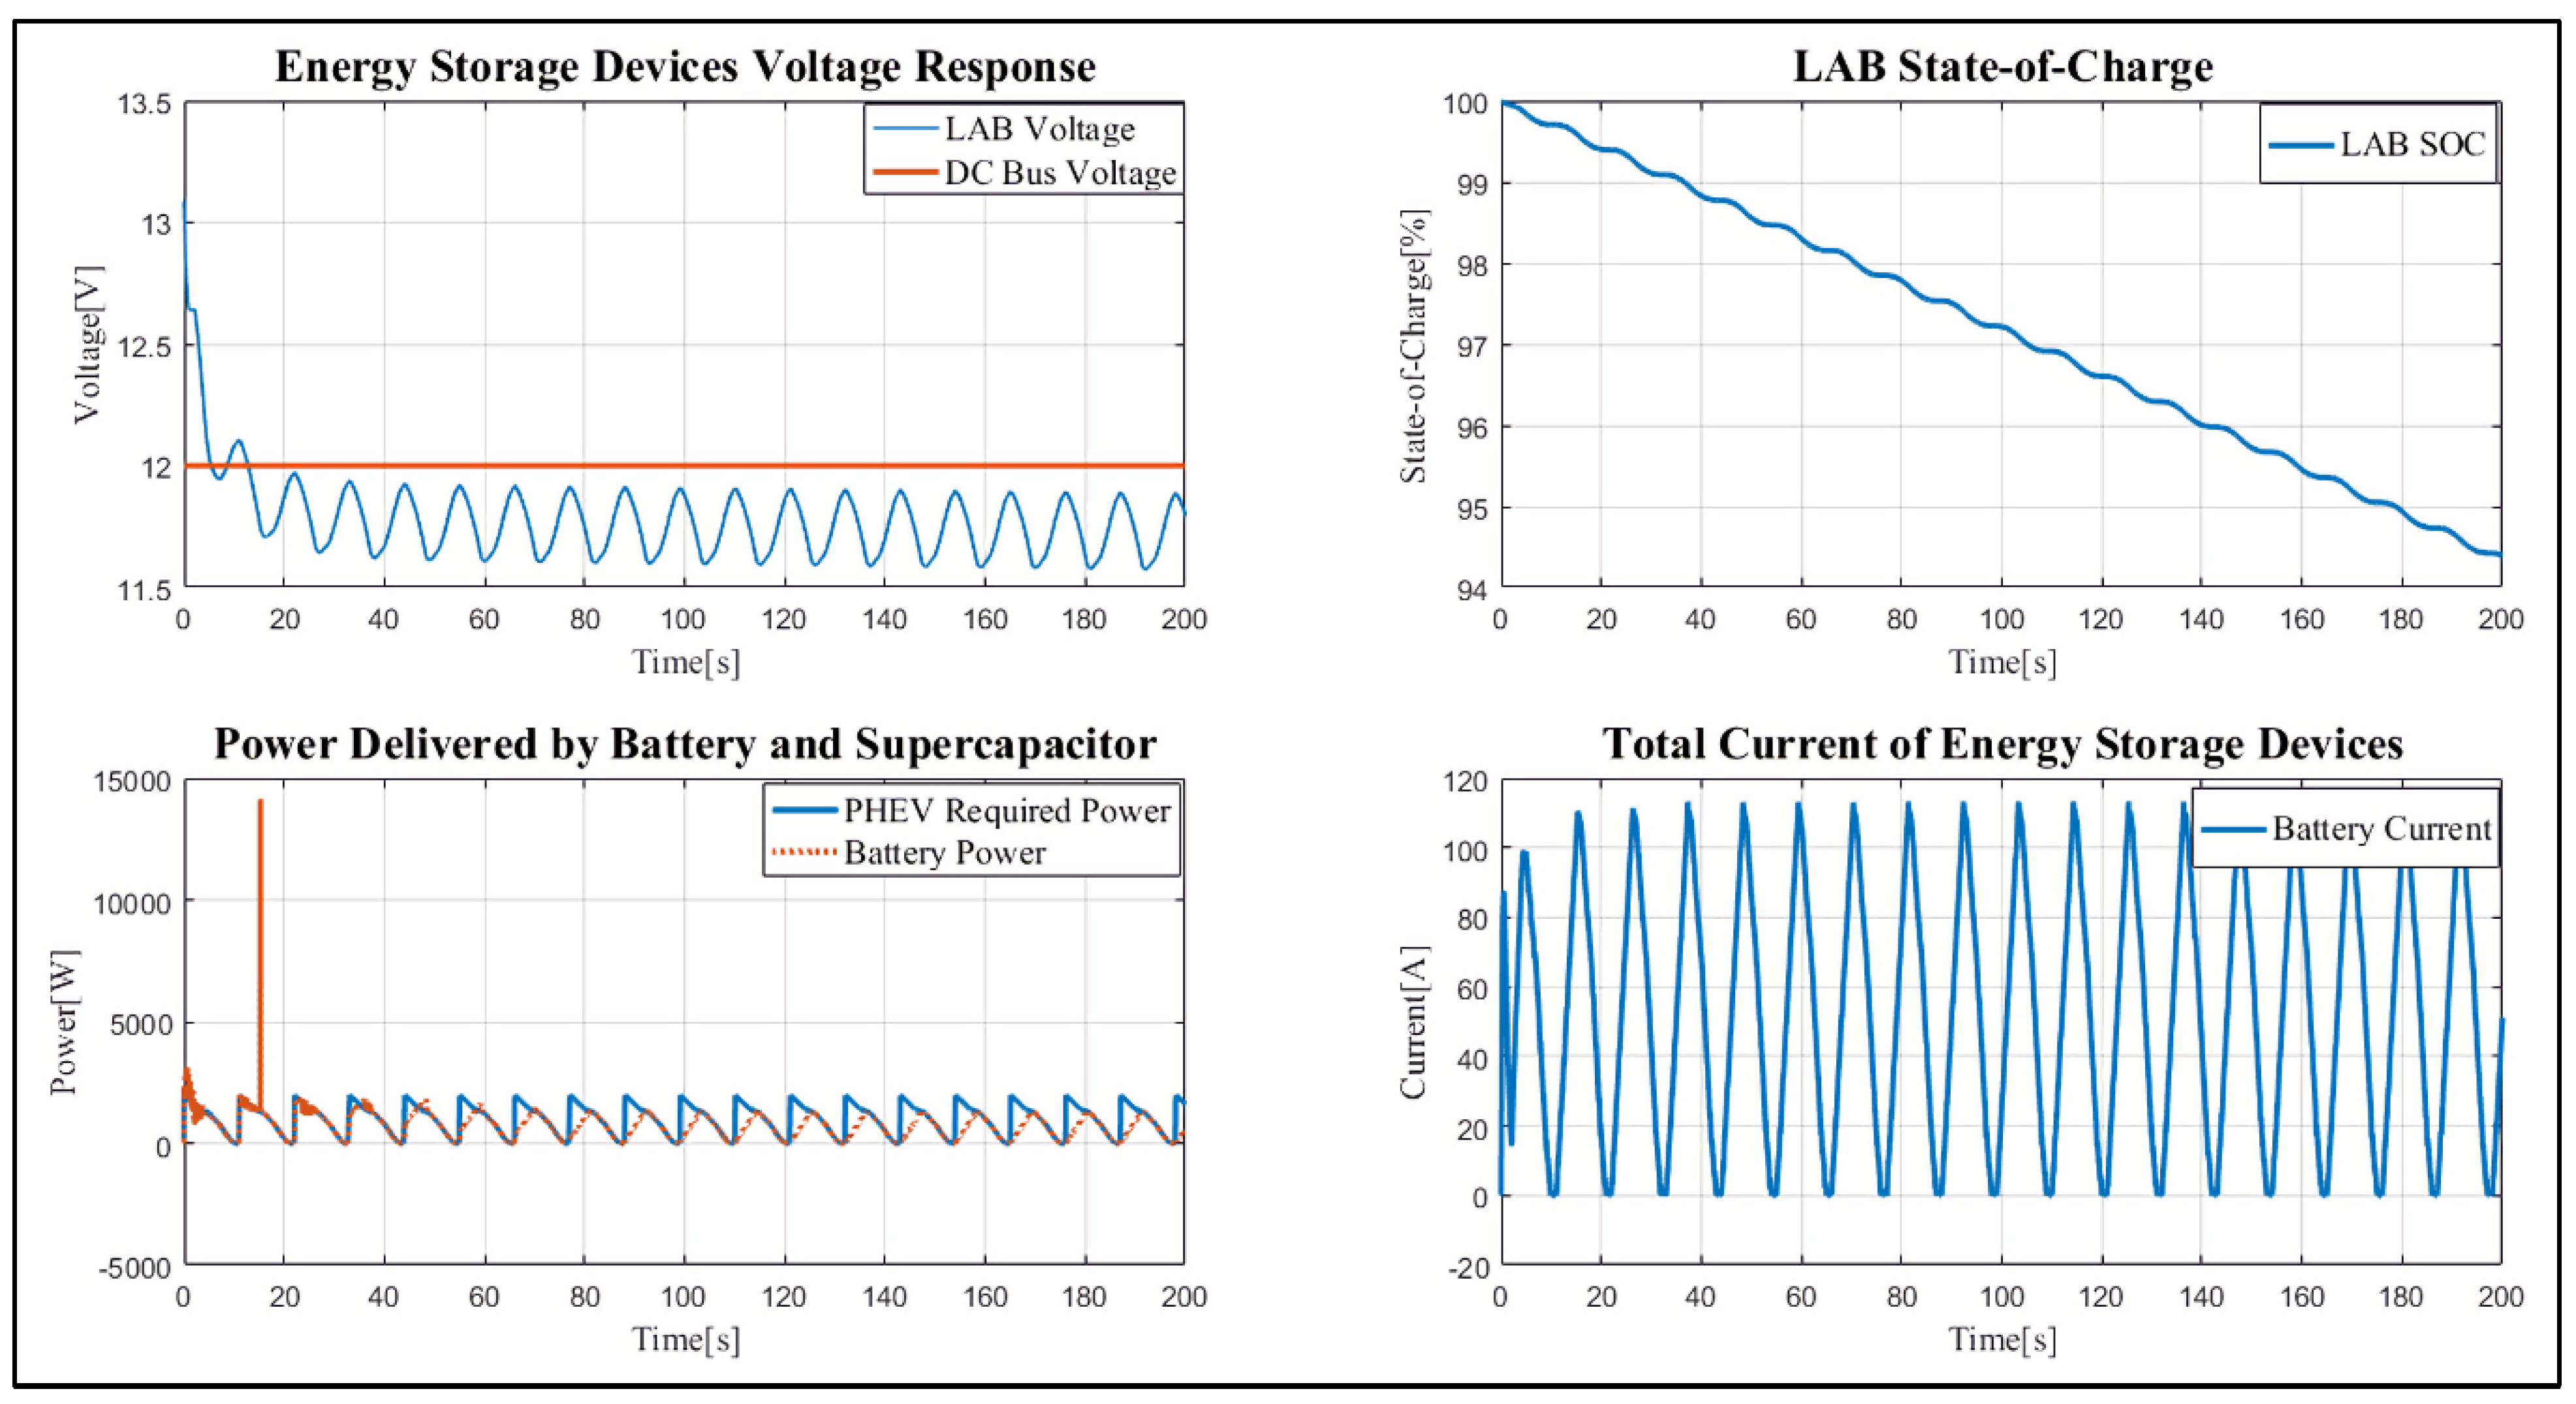
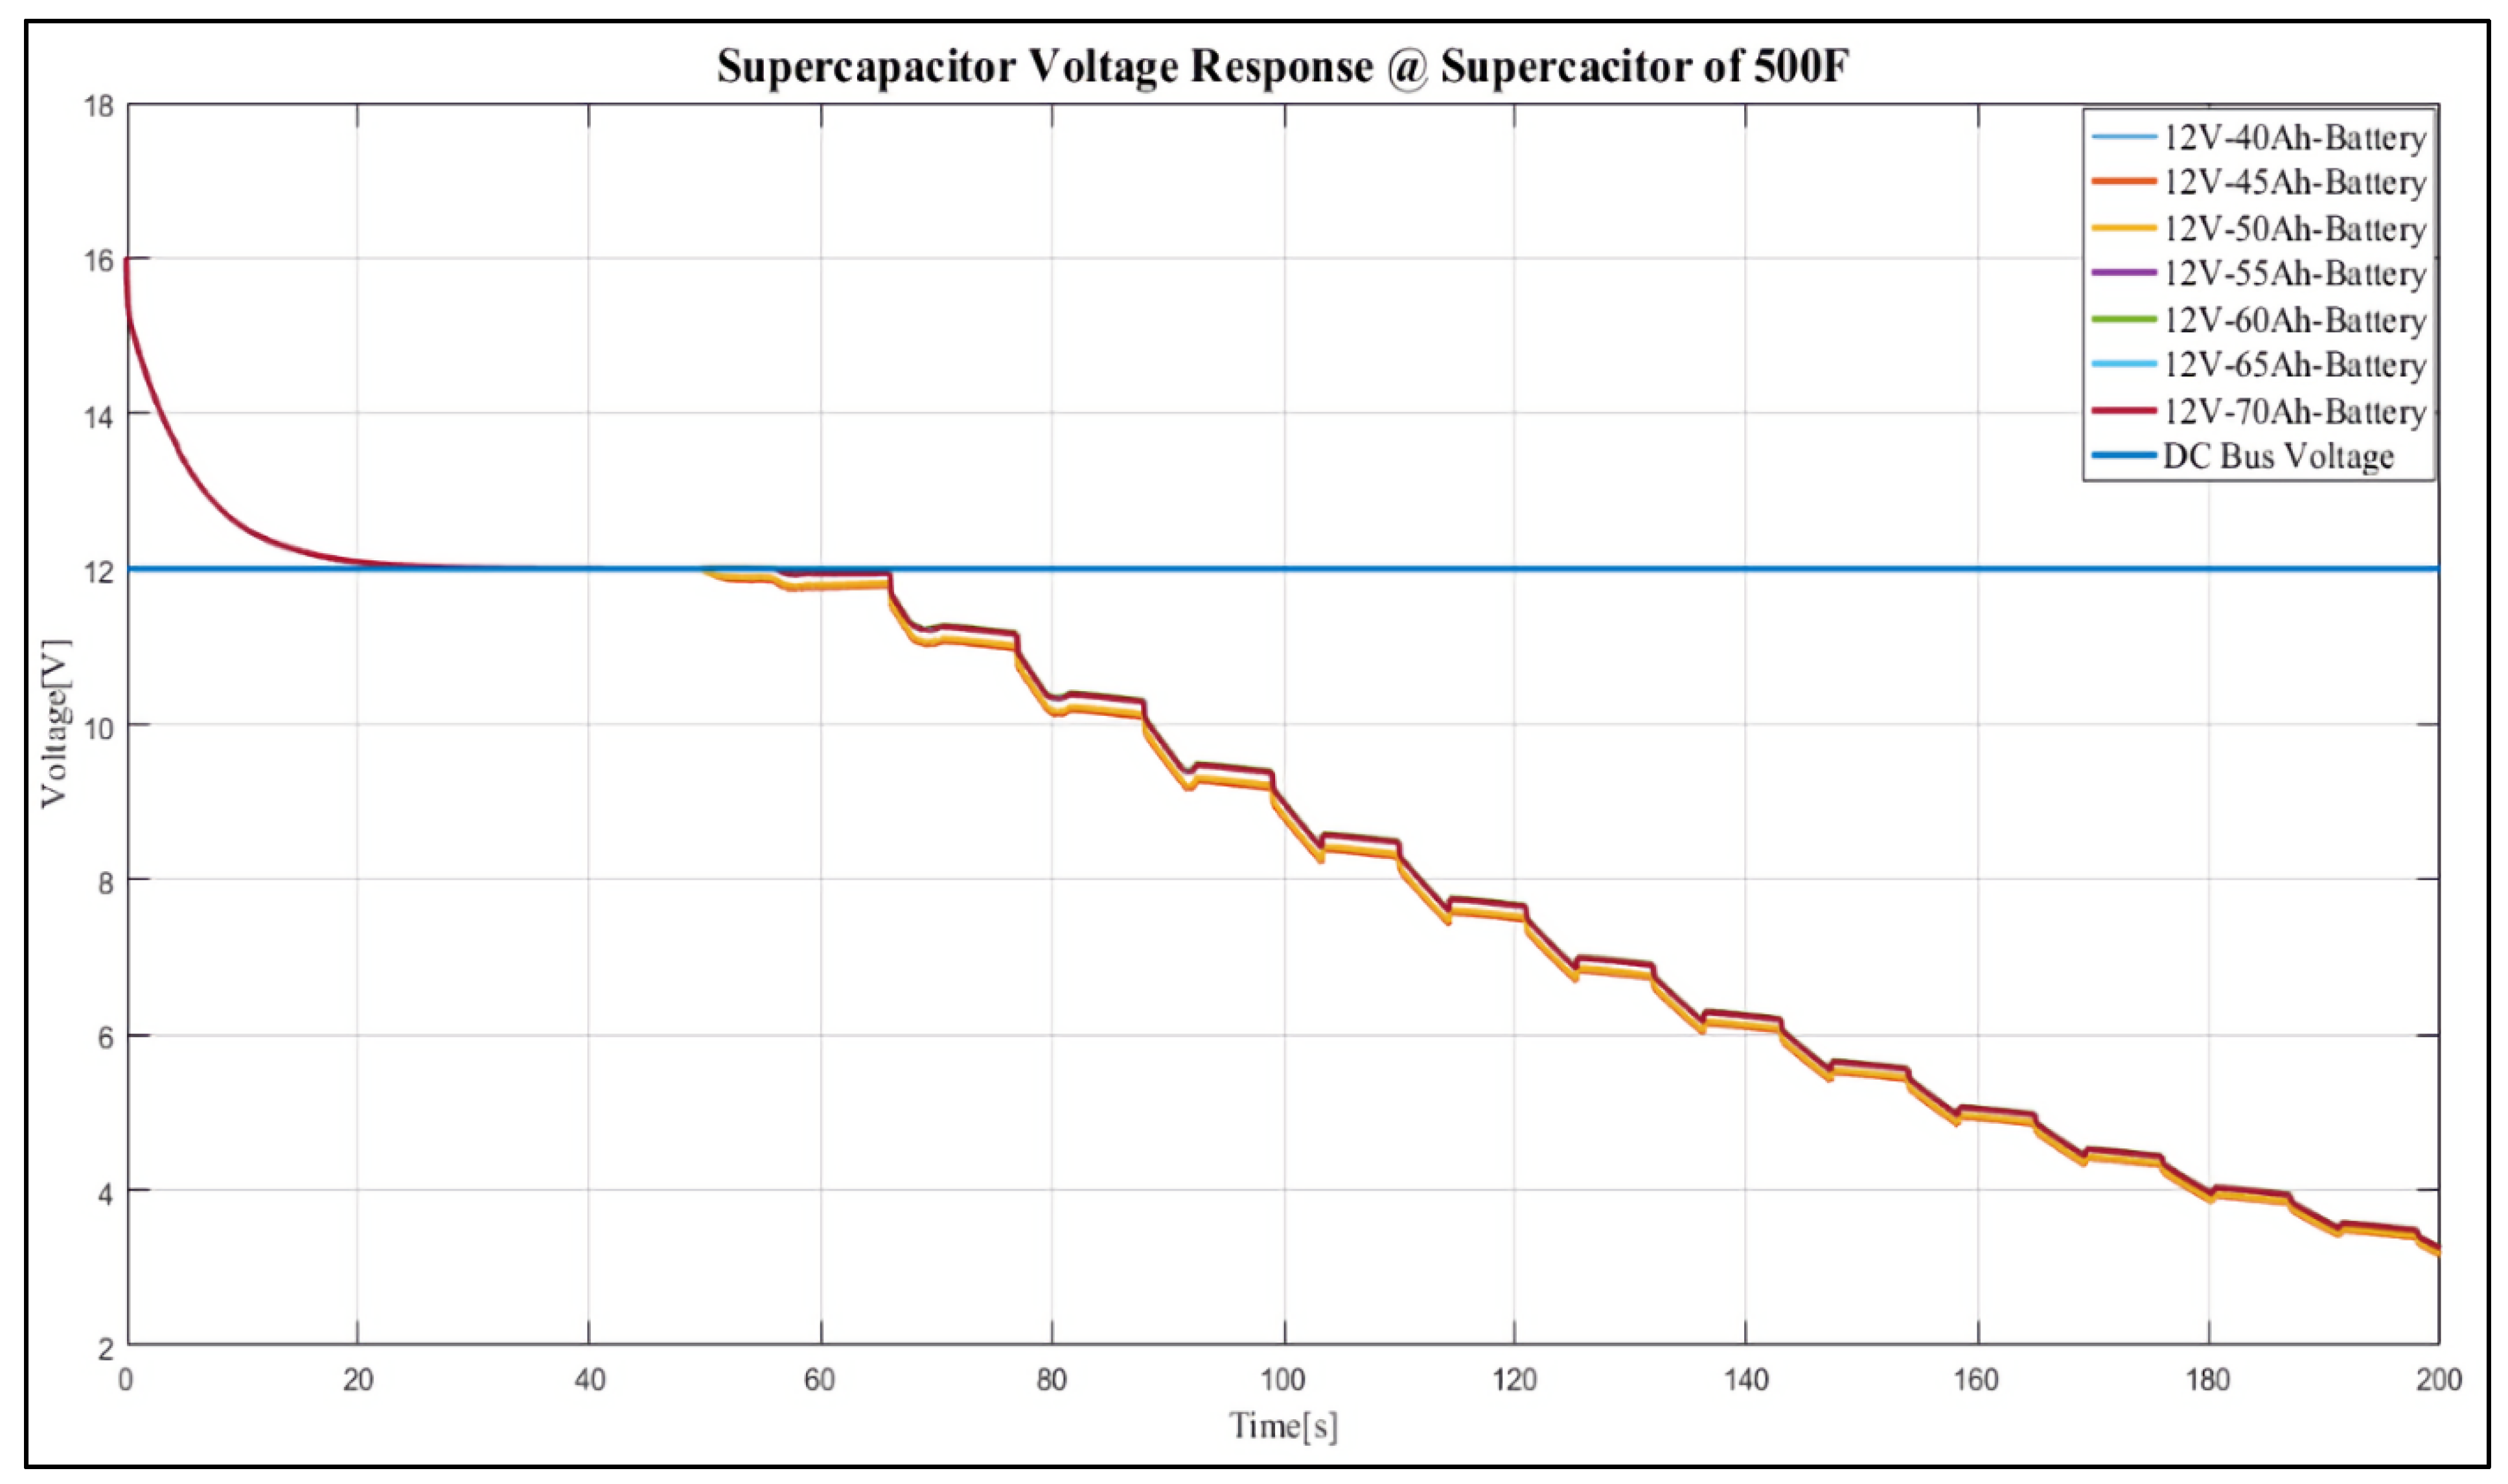
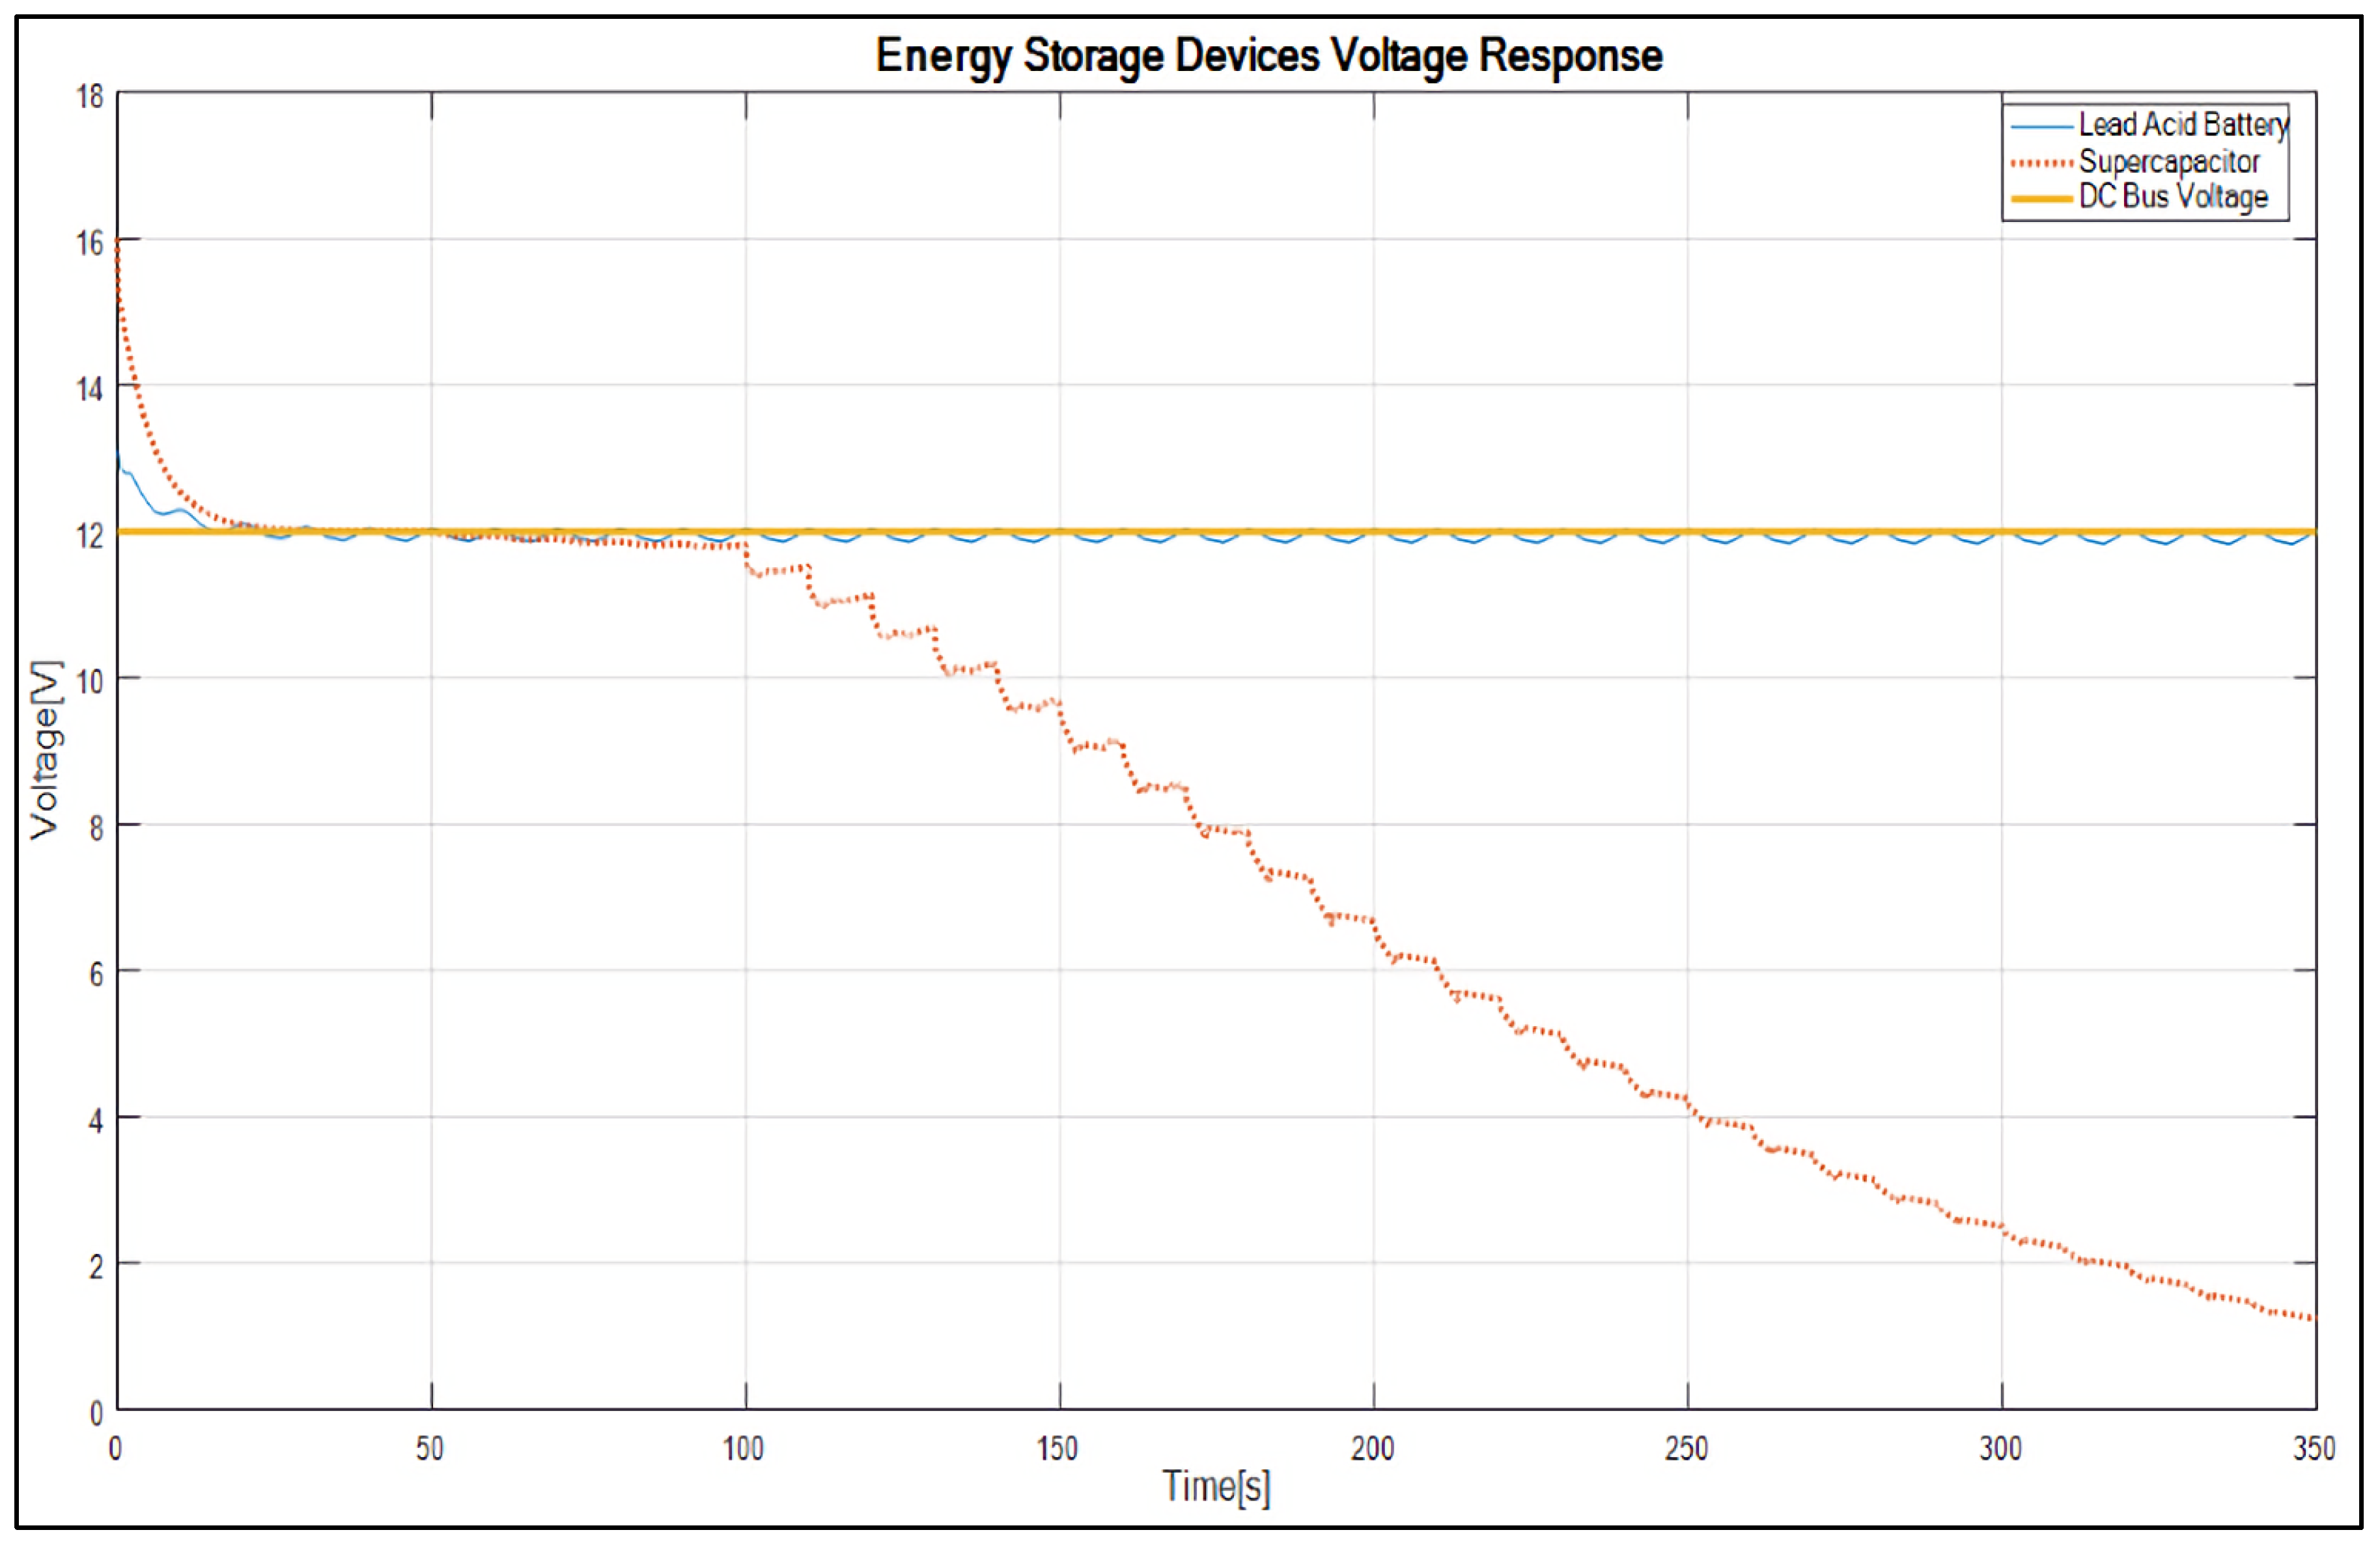
  • It reduces the converter output voltage attenuation and maintains the DC bus voltage link at 12 V.

3. Materials and Methods

This section discusses the materials and methods adopted for the completion of this research study.

3.1. LAB Modelling

A LAB model used in this investigation is attained from a software MATLAB/Simulink means within a power classifications toolbox. The existing energy storage apparatuses include LAB functions. The system provides easy access to the constraints for ease of altering. Consequently, LAB’s regulations are changed to relate to the commercially available battery parameters. Hereafter, battery parameters are determined using Randel’s 2nd-order model as proved in the work of [29]. However, to resolve the shortness of the battery’s lifespan, Randel’s model is improved such that it contains the battery’s self-discharge features, as illustrated in below Figure 2.
Figure 2 presents Randel’s 2nd-order model where the input is the direct-current voltage source and denotes by E m . In this instance, the input source is the battery voltage. The internal series resistance of the battery is denoted by R 0 , the cell plates resistance and capacitance are represented by R 1 ,   C 1 ,   R 2 , and C 2 , respectively. Whereas the battery self-discharge components are denoted by C p and R p . V o Denotes an output voltage or the open-circuit voltage of the battery as in the model. Therefore, Figure 3 illustrates the battery voltage response during the charging and discharging phases.
Figure 3 overhead shows the battery voltage characteristics in the charge and discharge events at an applied current. The battery’s transient response appears for every 5 s of discharge current value. Consequently, the battery voltage is nonlinear compared to the applied current. In addition, a significant variation of temperature causes battery self-discharge. Moreover, the battery voltage hinge on SoC as revealed by Equation (1) [20];
E m = E m 0 K E ( 273 + T ) ( 1 S o C ( t ) ) ;
here E m represent the battery potential, E m 0 stand for open-circuit battery potential, K E represents electric persistent, T represents the temperature in °C, and SoC constitutes battery state of charge.
Hereafter, through a procedure of battery charging, stored charge in the battery is represented by Q s , which is the integral of the current level used to charge the battery. Equation (2) describes the procedure in determining the stored charge as in the work of [20];
Q s ( t ) = i c ( t ) d t ;
here i c Stand for the battery charging current.
Moreover, by using Equation (3), the battery state of charge can be calculated as follows;
S o C ( t ) = Q s ( t ) Q b a t t
here, Q b a t t States an actual charge of the battery when it is measured.
Consequently, the SoC of the battery tracks its active properties as in Equation (4);
S o C ( t ) = i b a t t 3600 Q b a t t
here, i b a t t represent the current that flows into the battery. This current is presumed to have a positive value during the discharge process of the storm and a negative value during the battery charging process, and Equation (2) above defines this process.
Therefore, the battery inner electrical resistance R 0 and V o c , which is the battery open-circuit voltage is determined using uncertain outcomes illustrated by Figure 3. Thus, Equation (5) below calculates the battery internal resistance;
R 0 ( S o C ( t ) ) = v m a x , i v m i n , i i m a x , i i m i n , i ;
E m 0 = E m + K E ( 273 + T ) ( 1 S o C ( t ) ) ;
here, v m a x , i , v m i n , i , i m a x , i , i m i n , i designate the minimum and maximum voltage and current values of the signals obtained from Figure 3.
The simulation results of the model yielded constraints are kept on the MATLAB workspace window and file as a.csv file to process the results supplementary. While attaining the battery model from MATLAB tools, the critical part is to correlate the battery parameters, which include volume (Ah), potential (V), and the charging current (I) that relates to the evaluated batter. A vigorous model of the battery is intricate. It is essential to incorporate many variables into the systems model. The more straightforward way to address this research is to use an embedded design available within the software tool.

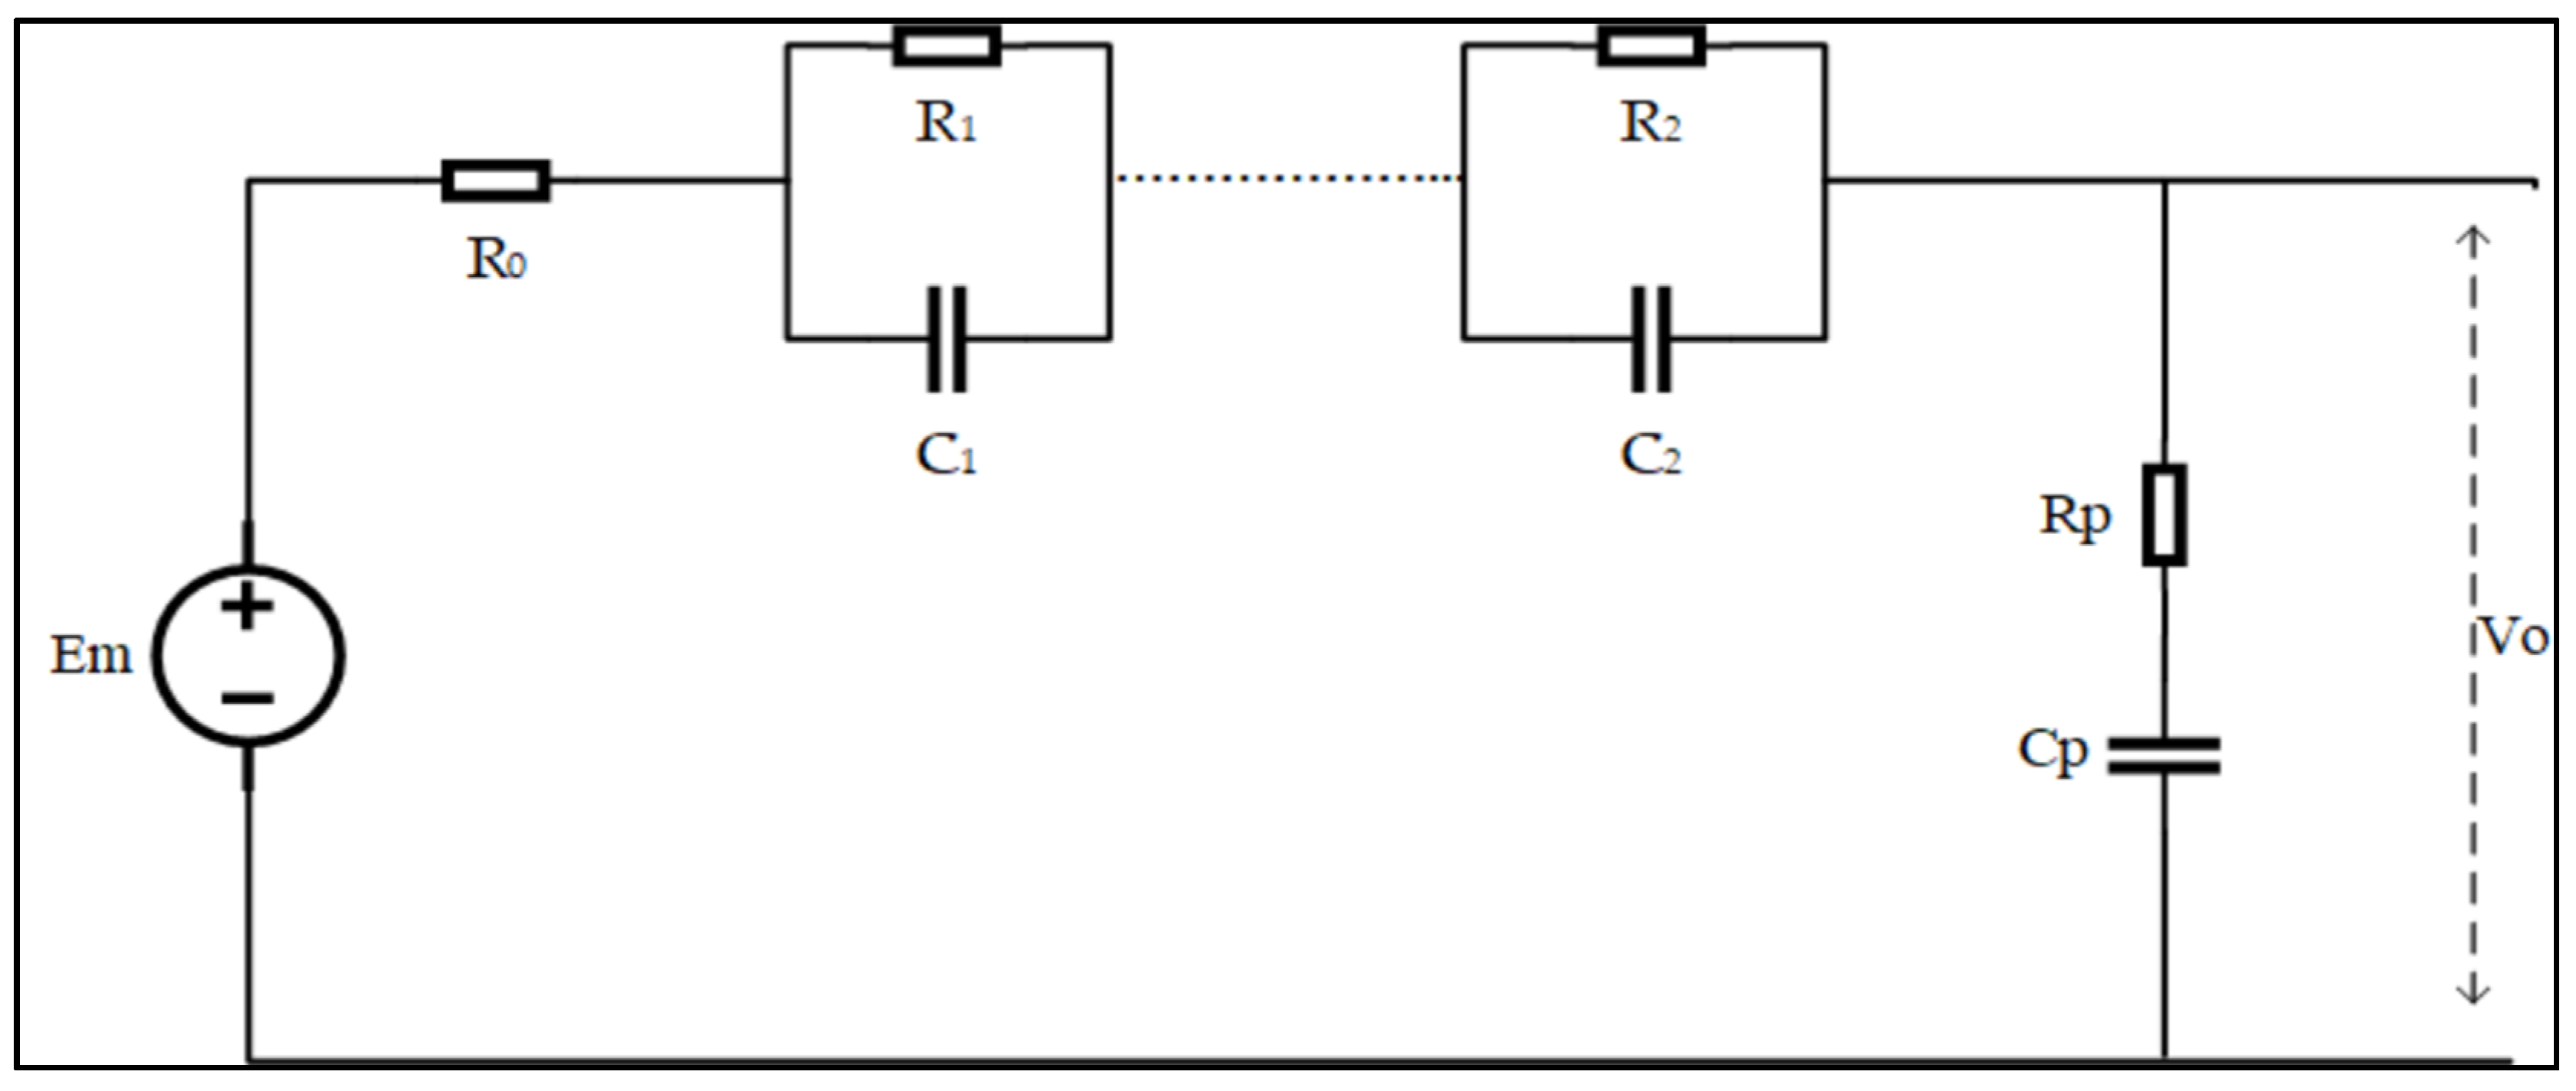
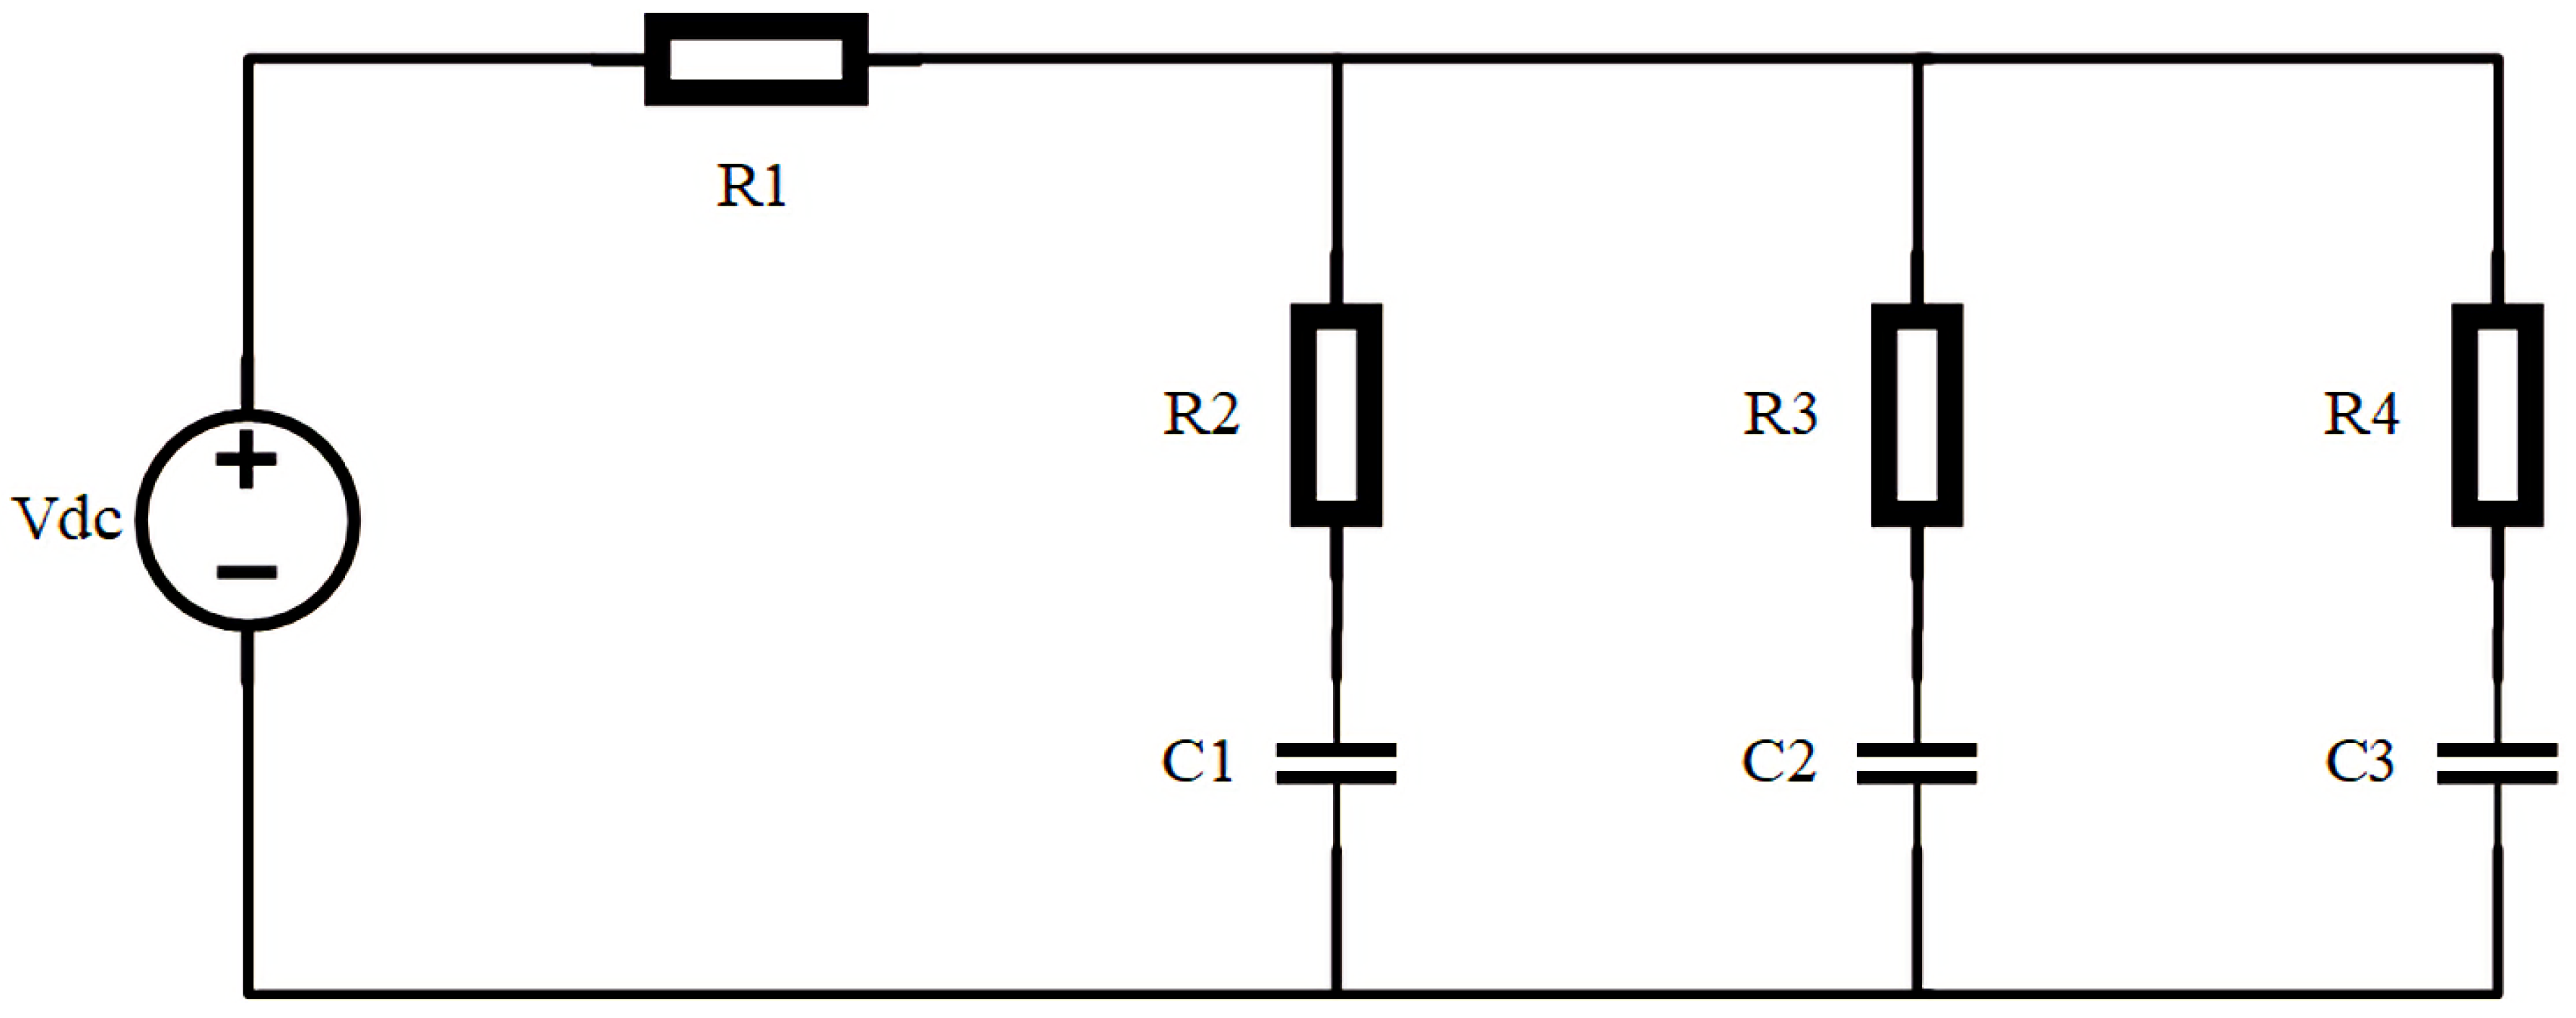
3.2. Modelling of a Supercapacitor

This section models the supercapacitor. A supercapacitor’s equivalent circuit model (i.e., EDLC) is developed as illustrated by Figure 4 and explained in the work of [30]. The supercapacitor model adopted is a 2nd-order model, which consists of resistors and capacitors.
Therefore, Equation (7) defines the capacitor’s potential;
v ˙ R 2 C 1 = 1 C 1 i R 2 C 1
here, i R 2 C 1 present the current going through R 2 C 1 , whereas i R 3 C 2 designate the current that flows through R 3 C 2 in the supercapacitor, and i R 4 C 3 is the current that flows over R 4 C 3 resistor-capacitor branch.
Consequently, by using Equation (8);
i d c ( t ) = i R 2 C 1 ( t ) + i R 3 C 2 ( t ) + i R 4 C 3 ( t ) ;
here, i d c represents the total current that flows through the supercapacitor.
Hereafter, Equation (9) calculates the terminal voltage of the Supercapacitor;
v d c = i d c R E S R + i R 2 R 2 + v C 1 ;
The developed model considers the used constraints. The energy sources work autonomously from each other. Accordingly, the critical part is to advance a power electronic system designed for LAB and supercapacitor energy storage schemes. Moreover, it reduces the control structure effort because LAB and supercapacitor possess diverse distinctive conduct.

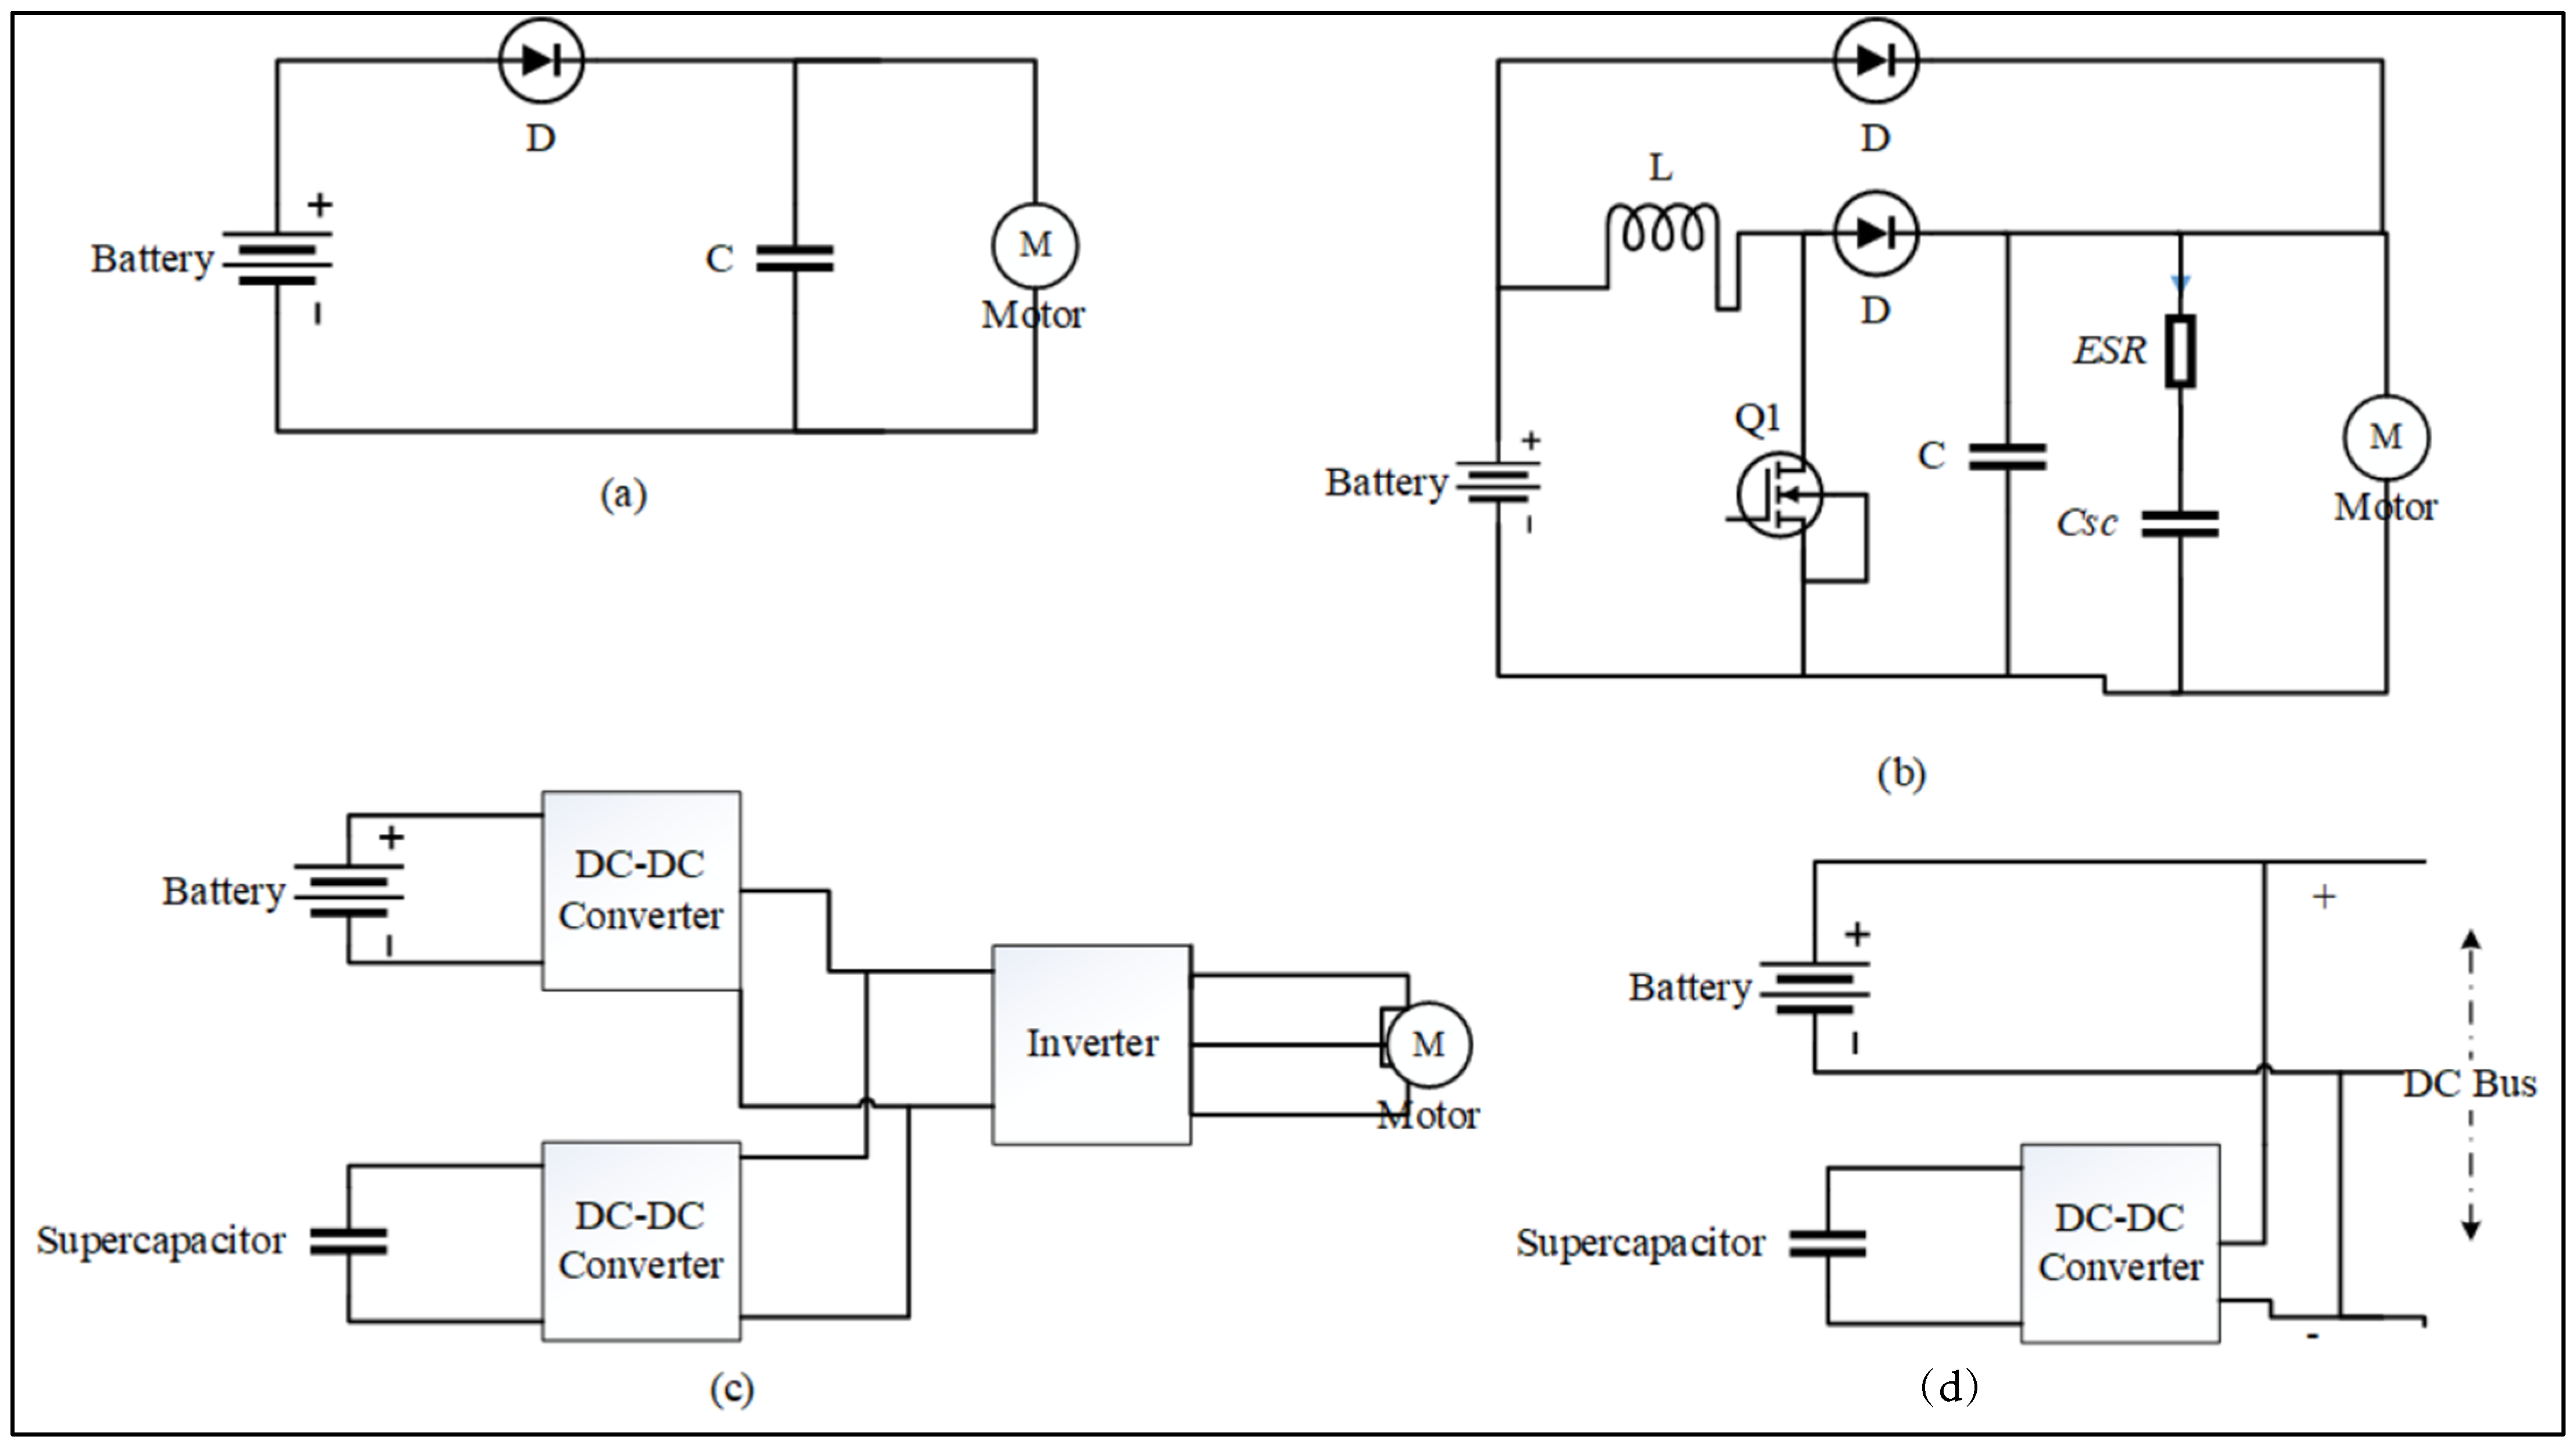
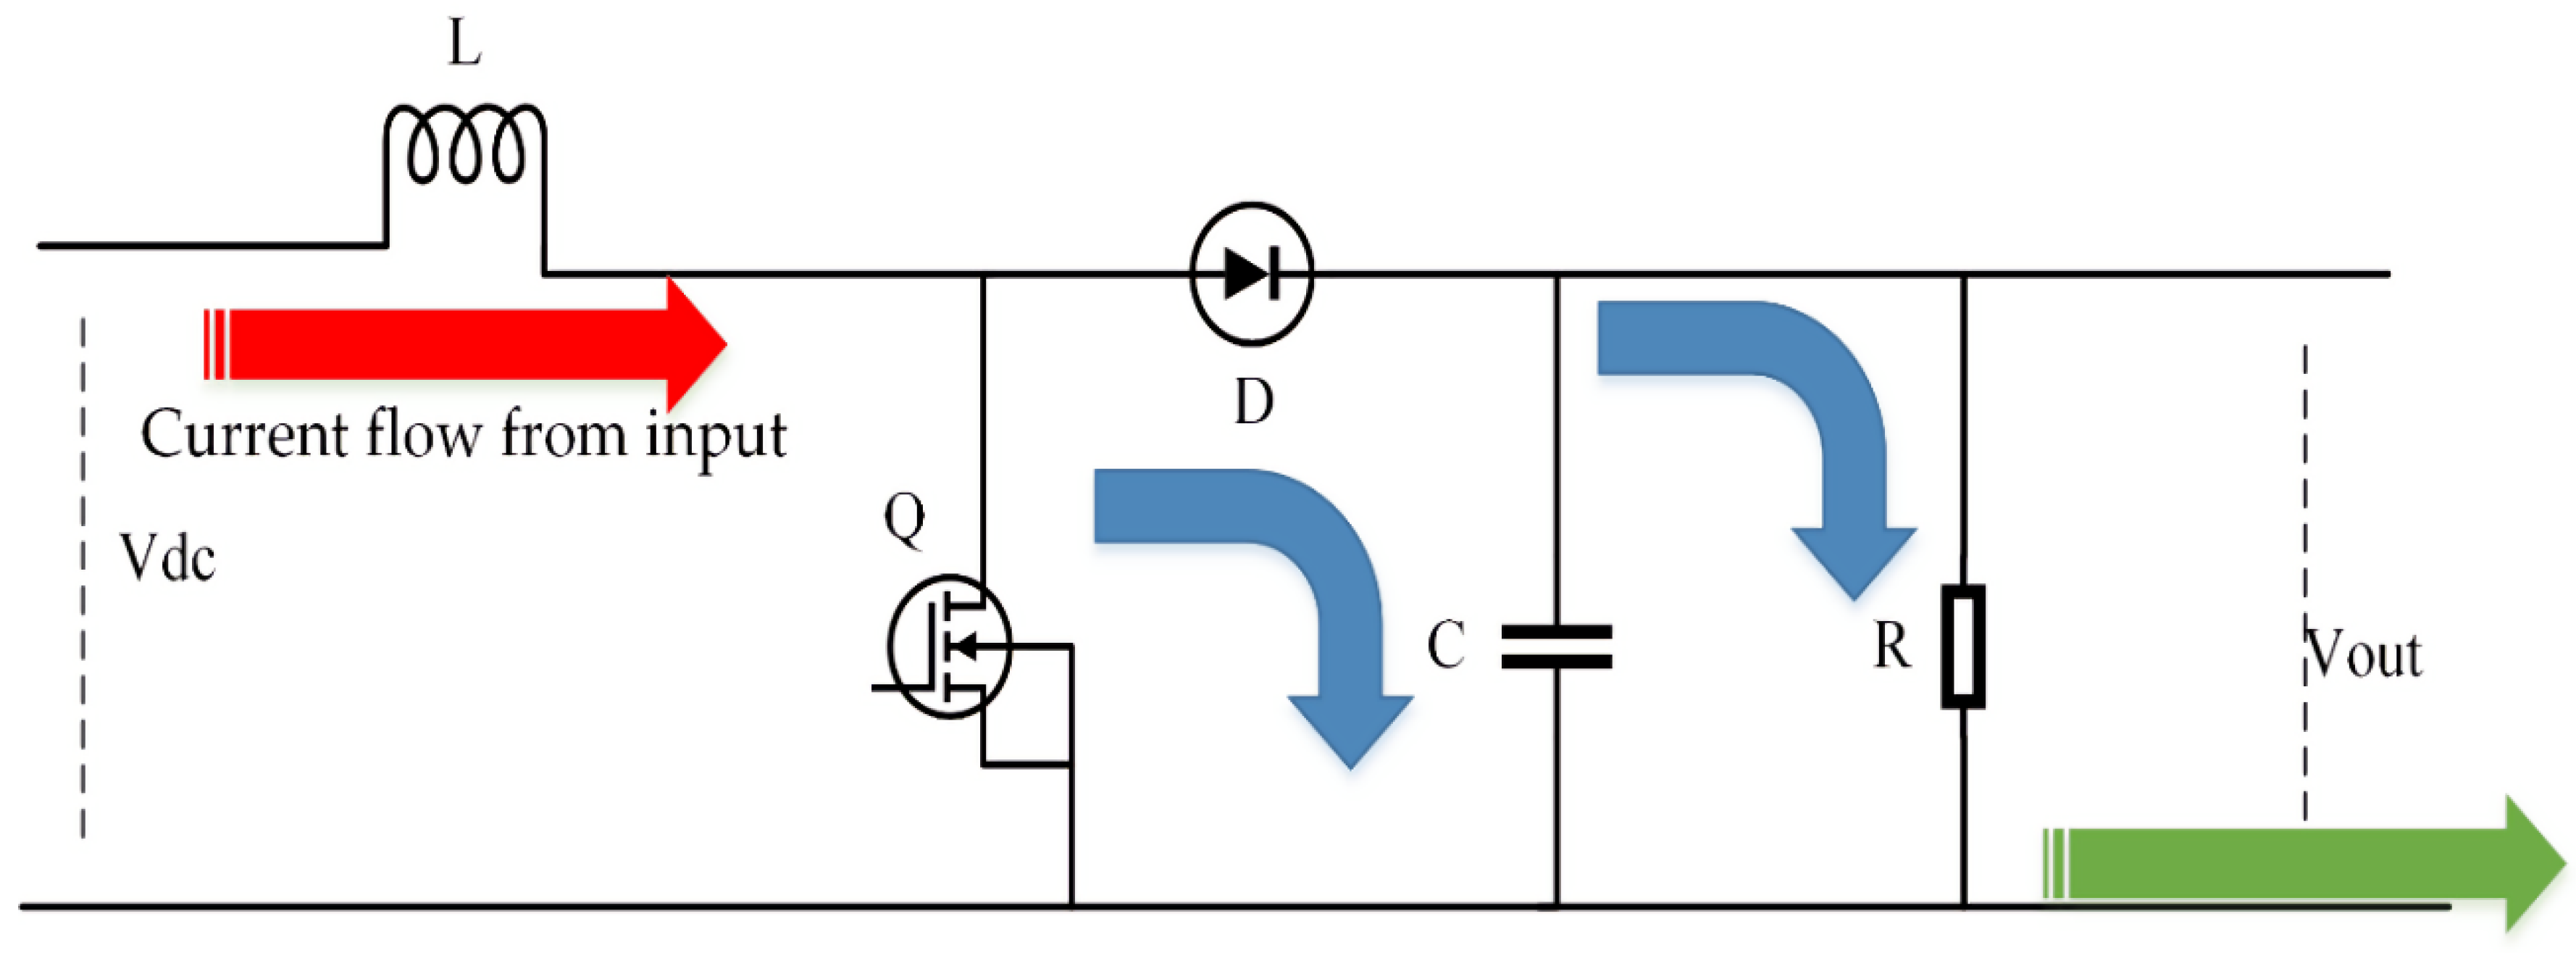
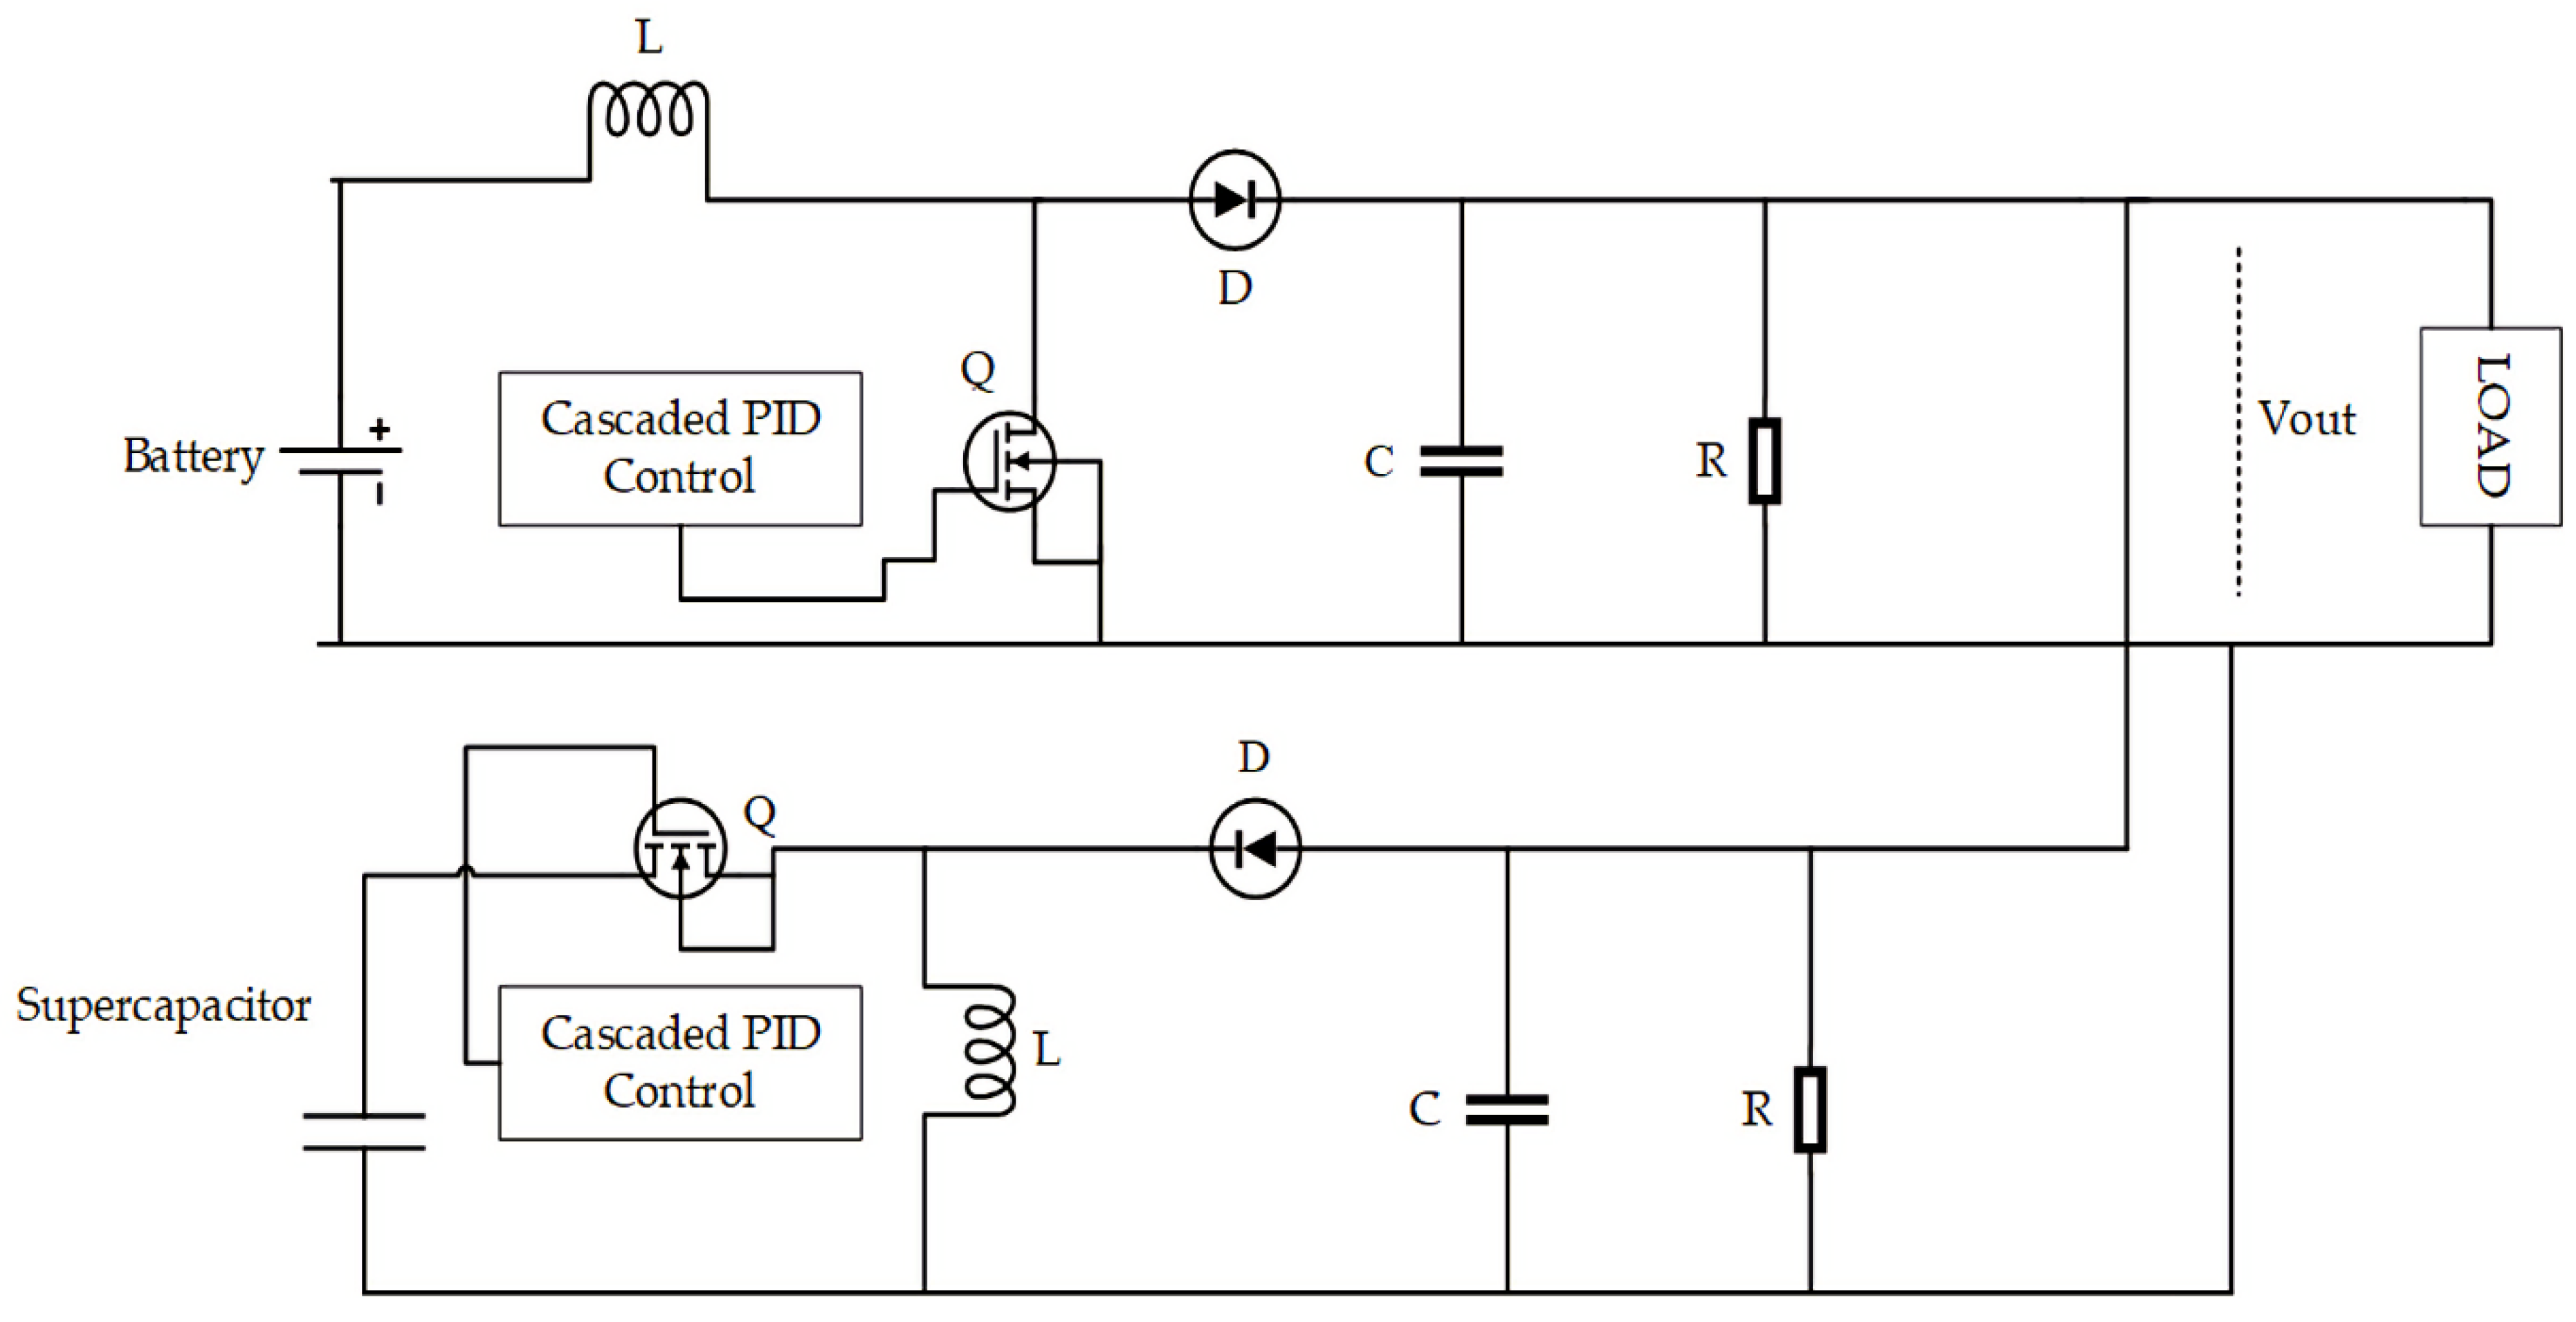
3.3. LAB Boost Converter

This subsection discusses the established DC-to-DC converter (boost). Lead-acid battery used in transport vehicles remains controlled via linking step-up power electronic converter between the input source and the load. This DC-to-DC converter warrants an increased battery output voltage of greater than 12 V. This increased output voltage ensures a constant DC-link bus voltage of 12 V. Therefore, the equivalent circuit of the converter established is grounded by the work of [30,31]. Figure 5 displays a boost converter for LAB.
Equation (10) represents the relationship between the input and output voltage, which defines the average bump-up converter output voltage, and its transfer function is as follows;
V o u t = V d c 1 D ;
here, V o u t is the bump-up converter yielded potential, V d c represents the direct-current input potential of the source, and D is the control duty cycle, respectively.
The essential function of this converter is to increase its input voltage to a more excellent output voltage value; hence, its name is “boost/step-up”. Moreover, it has a continuous input current. This input current has a fluctuating characteristic, which depends on inductance and switching frequency values. Consequently, the transfer ratio determines the duty cycle. Thus, Equation (11) represents the transfer function;
D = t o n T ;
here, t o n It is a switch-on time, and T represent a complete duration of one entire cycle. Additionally, the step-up converter runs in a continuous conduction mode (CCM) since it operates for a more comprehensive varying range of loads, preserving the inductor’s positive current.

3.4. Step-Up/Step-Down Converter for a Supercapacitor

This section establishes a supercapacitor’s step-up/step-down power electronic DC-DC converter. An equivalent circuit model for this converter is used within the Simulink model and is shown below in Figure 6.
Figure 6 illustrates a step-up/step-down converter. This power electronic converter allows absorption of load peak currents by the Supercapacitor. Therefore, to determine the voltage output of the converter, Equation (12) is used and represented as a transfer function;
V o u t = D 1 D V d c
here, V o u t represents the voltage output of the converter, D defines the switching duty cycle, and V d c stands for converter input potential. In this circumstance, an input potential relates to the terminal voltage of the supercapacitor.
Because the converter type is adopted, it allows a wide output voltage variation. This output voltage can either be more/less than the converters’ input voltage. Thus, the power electronic conversion system stands appropriately to regulate its potential and charging current because of the ultracapacitor-attenuating voltage. Moreover, a reversing topology is adopted to distinguish an appropriate level of supplied current via supercapacitor or harnessed current.

3.5. Control Enhancement

This section discusses an enhancement of the control structure to provide efficient energy share between the energy sources. A power width modulation (PWM) method controls the converter switches, which applies a sawtooth indication. In contrast, a cascaded proportional, integral, and derivative controller (PID) manages the battery voltage, which helps regulate battery SoC. Thus, the PID parameter variables representing the controllers’ transfer function are tuned using a PID tuner to achieve an appropriate control. A cascaded PID utilises a continuous time-domain procedure.
Similarly, the inside supply defines the corrected recompense feature. Moreover, the PWM saw tooth signal producer engendered and obtained from the measurement library of the specialised technology toolbox of control and on the group of generators for mixed signals. The PWM produces a sawtooth waveform. It generates the highest, which ranges among positive and negative ones. A time-domain call represents the generator’s output as coupled for imitation. Therefore, the study has realised a proportional-integration-derivative regulator by way of an uninterrupted-time state. Moreover, it uses a PID to attain a quicker response in TV applications. Hence, Equation (13) calculates the PID controller mathematical purpose;
M j = R p + R i j + R p j ;
Yet, to develop the precise PID for quicker response, Equation (13) is swotted, and Equation (14) establishes the control parameters as the new transfer function for the identification of the plant model;
δ = K T ω 2 s 2 + 2 T ω s + 1 ;
here, K is a factor and was determined to be 1.7028, whereas, ω attained is 3.3328 and obtained is 0.179.
Therefore, Figure 7 shows the overall schematic structure of the fully active-parallel approach of a hybrid battery and supercapacitor ESS.

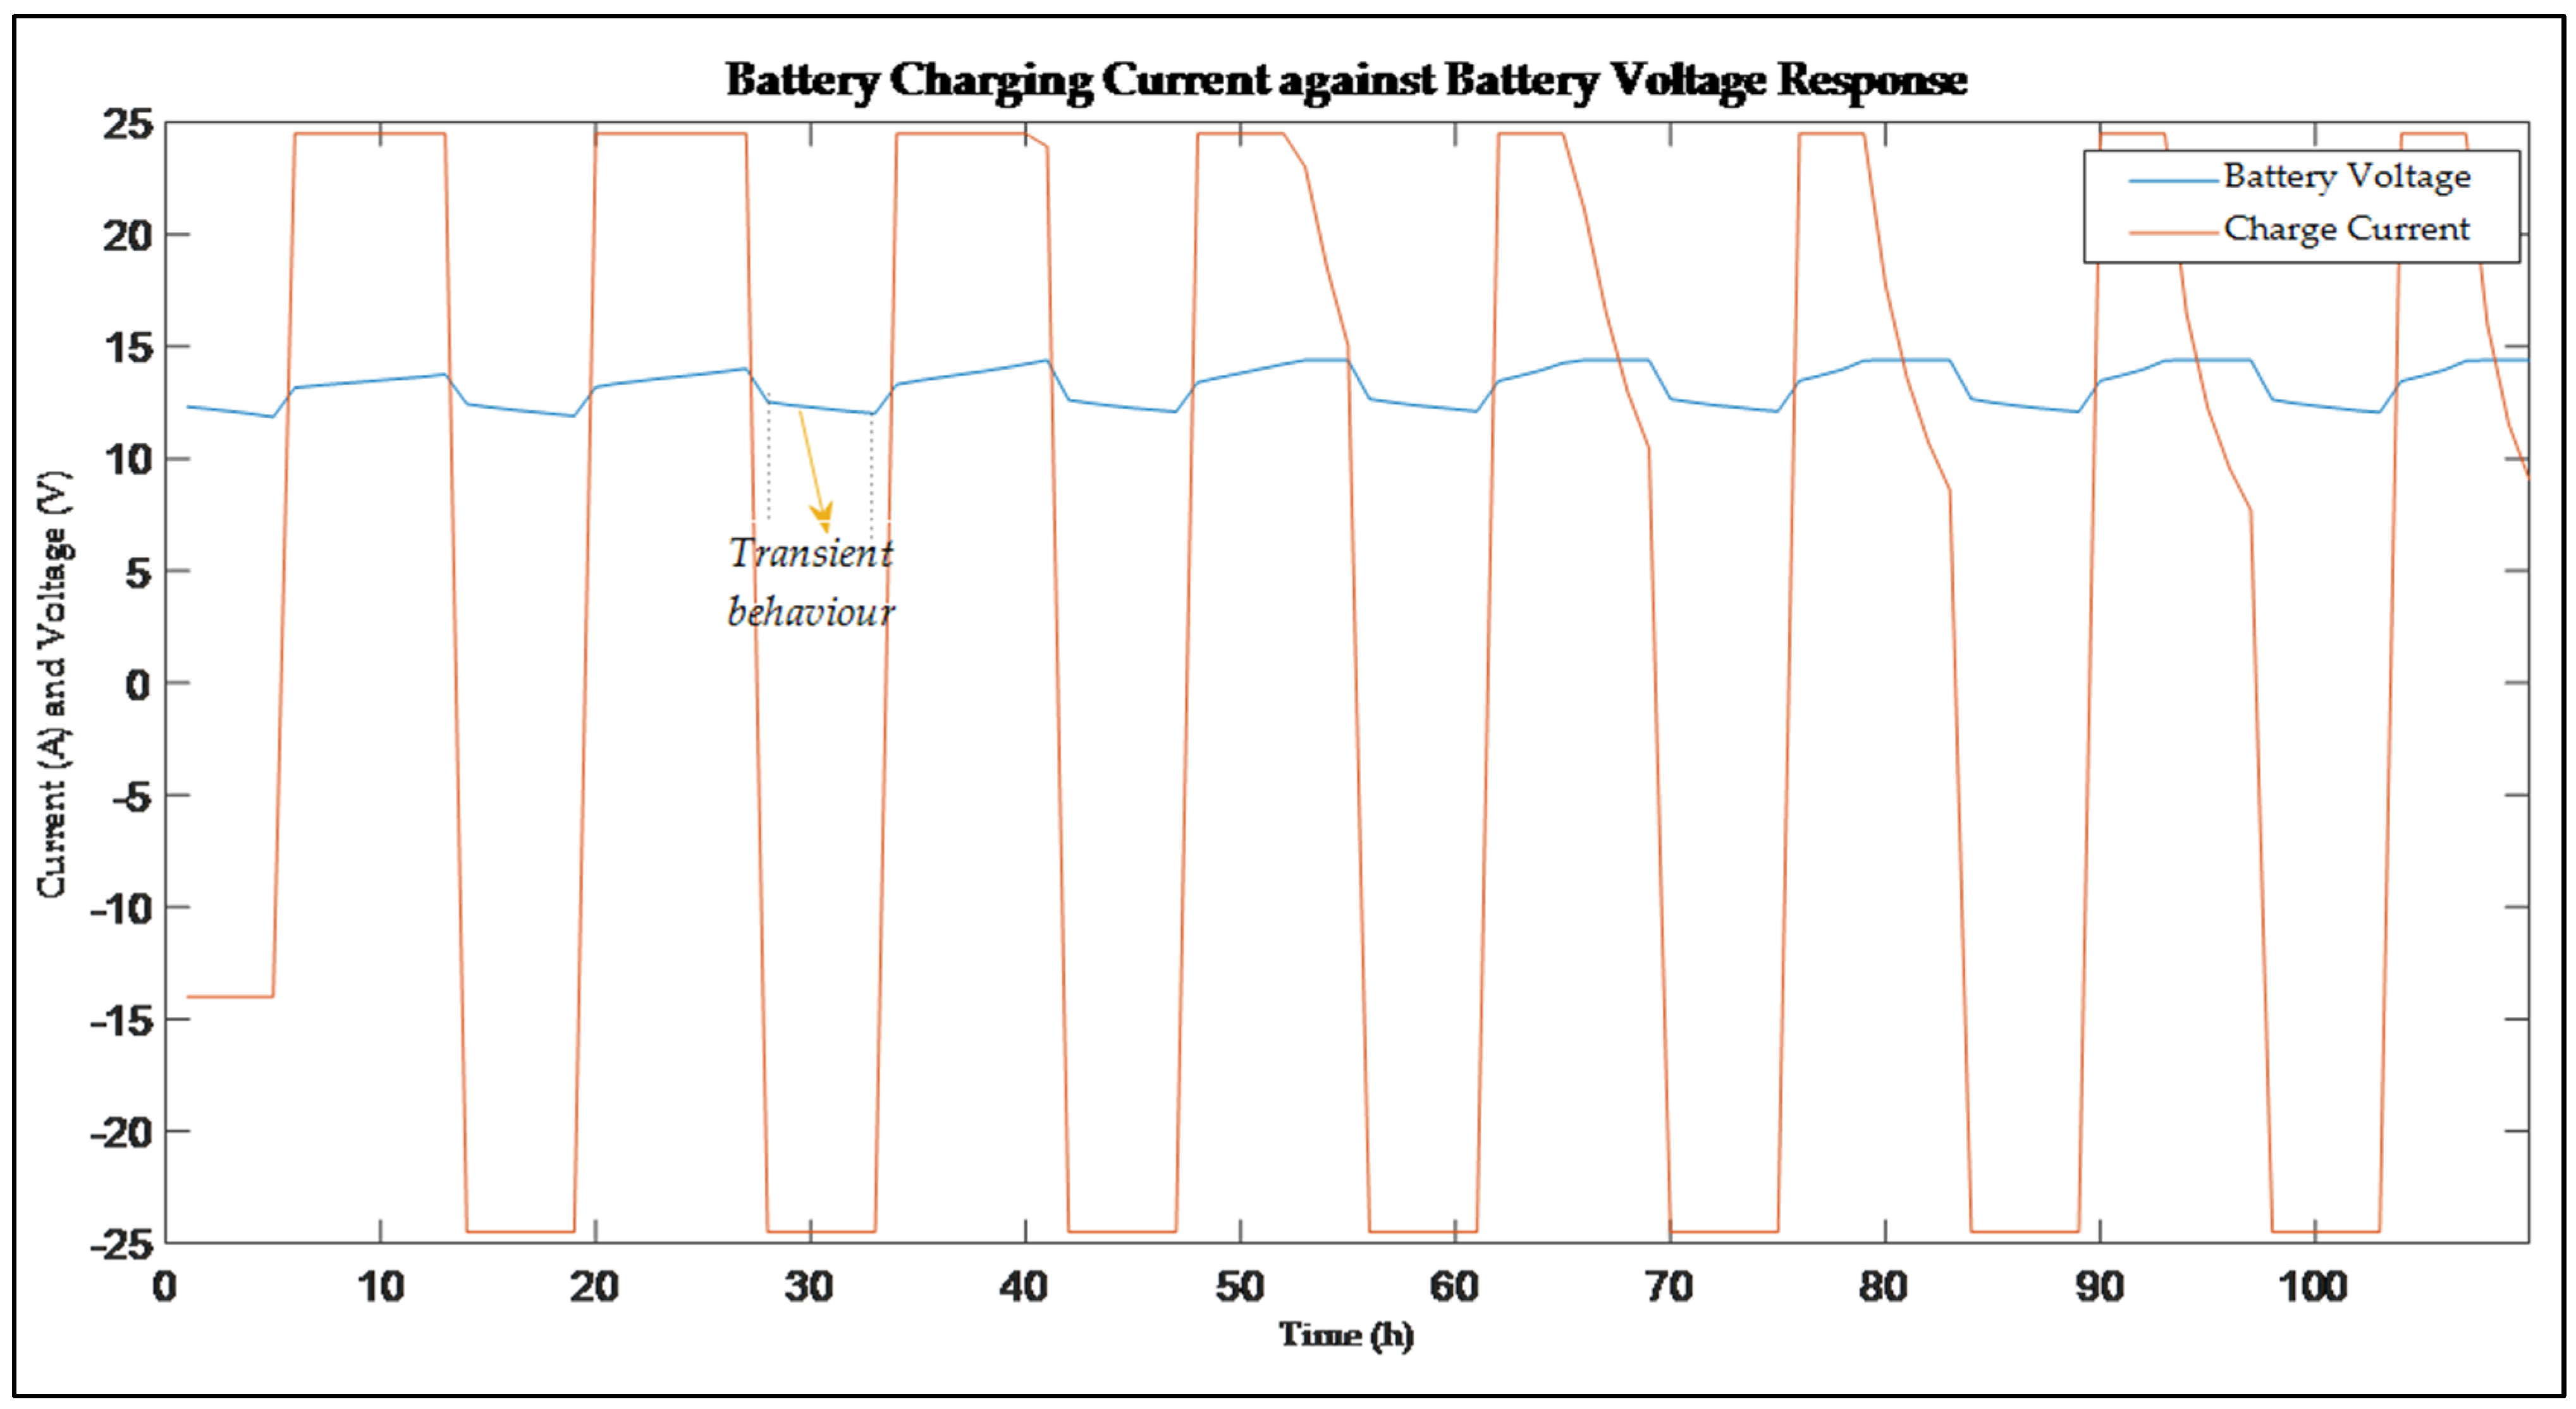
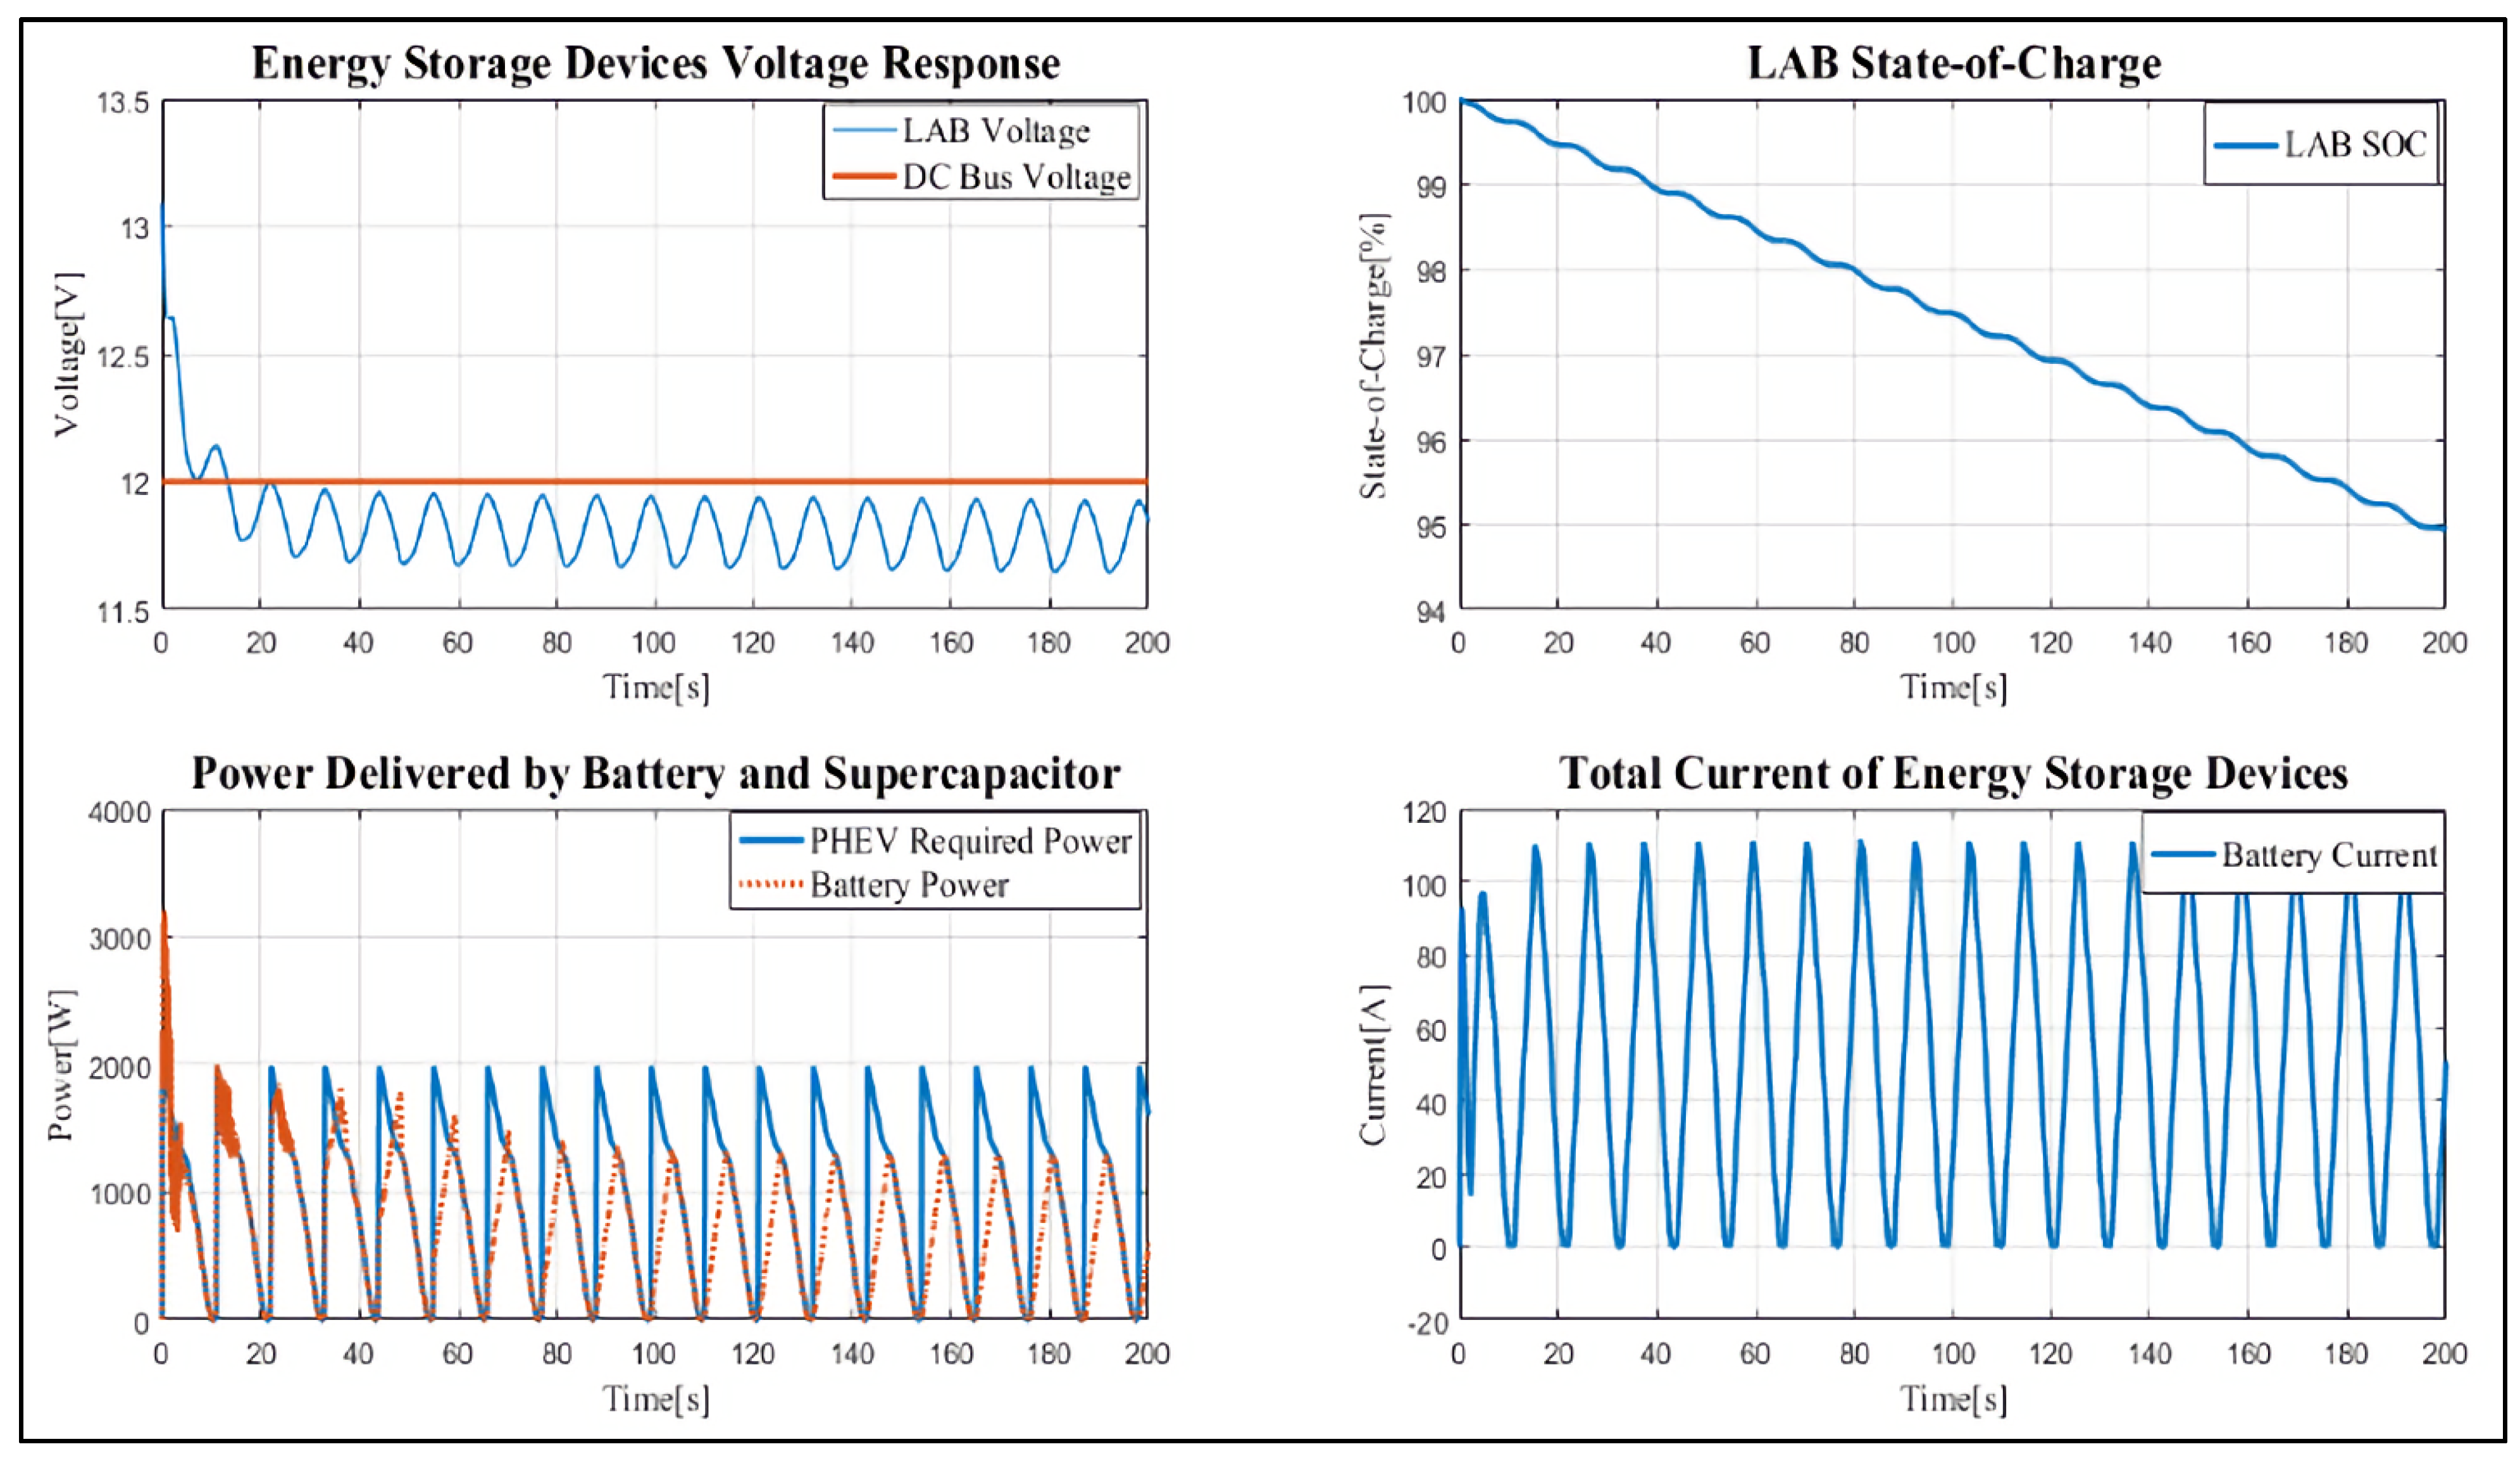
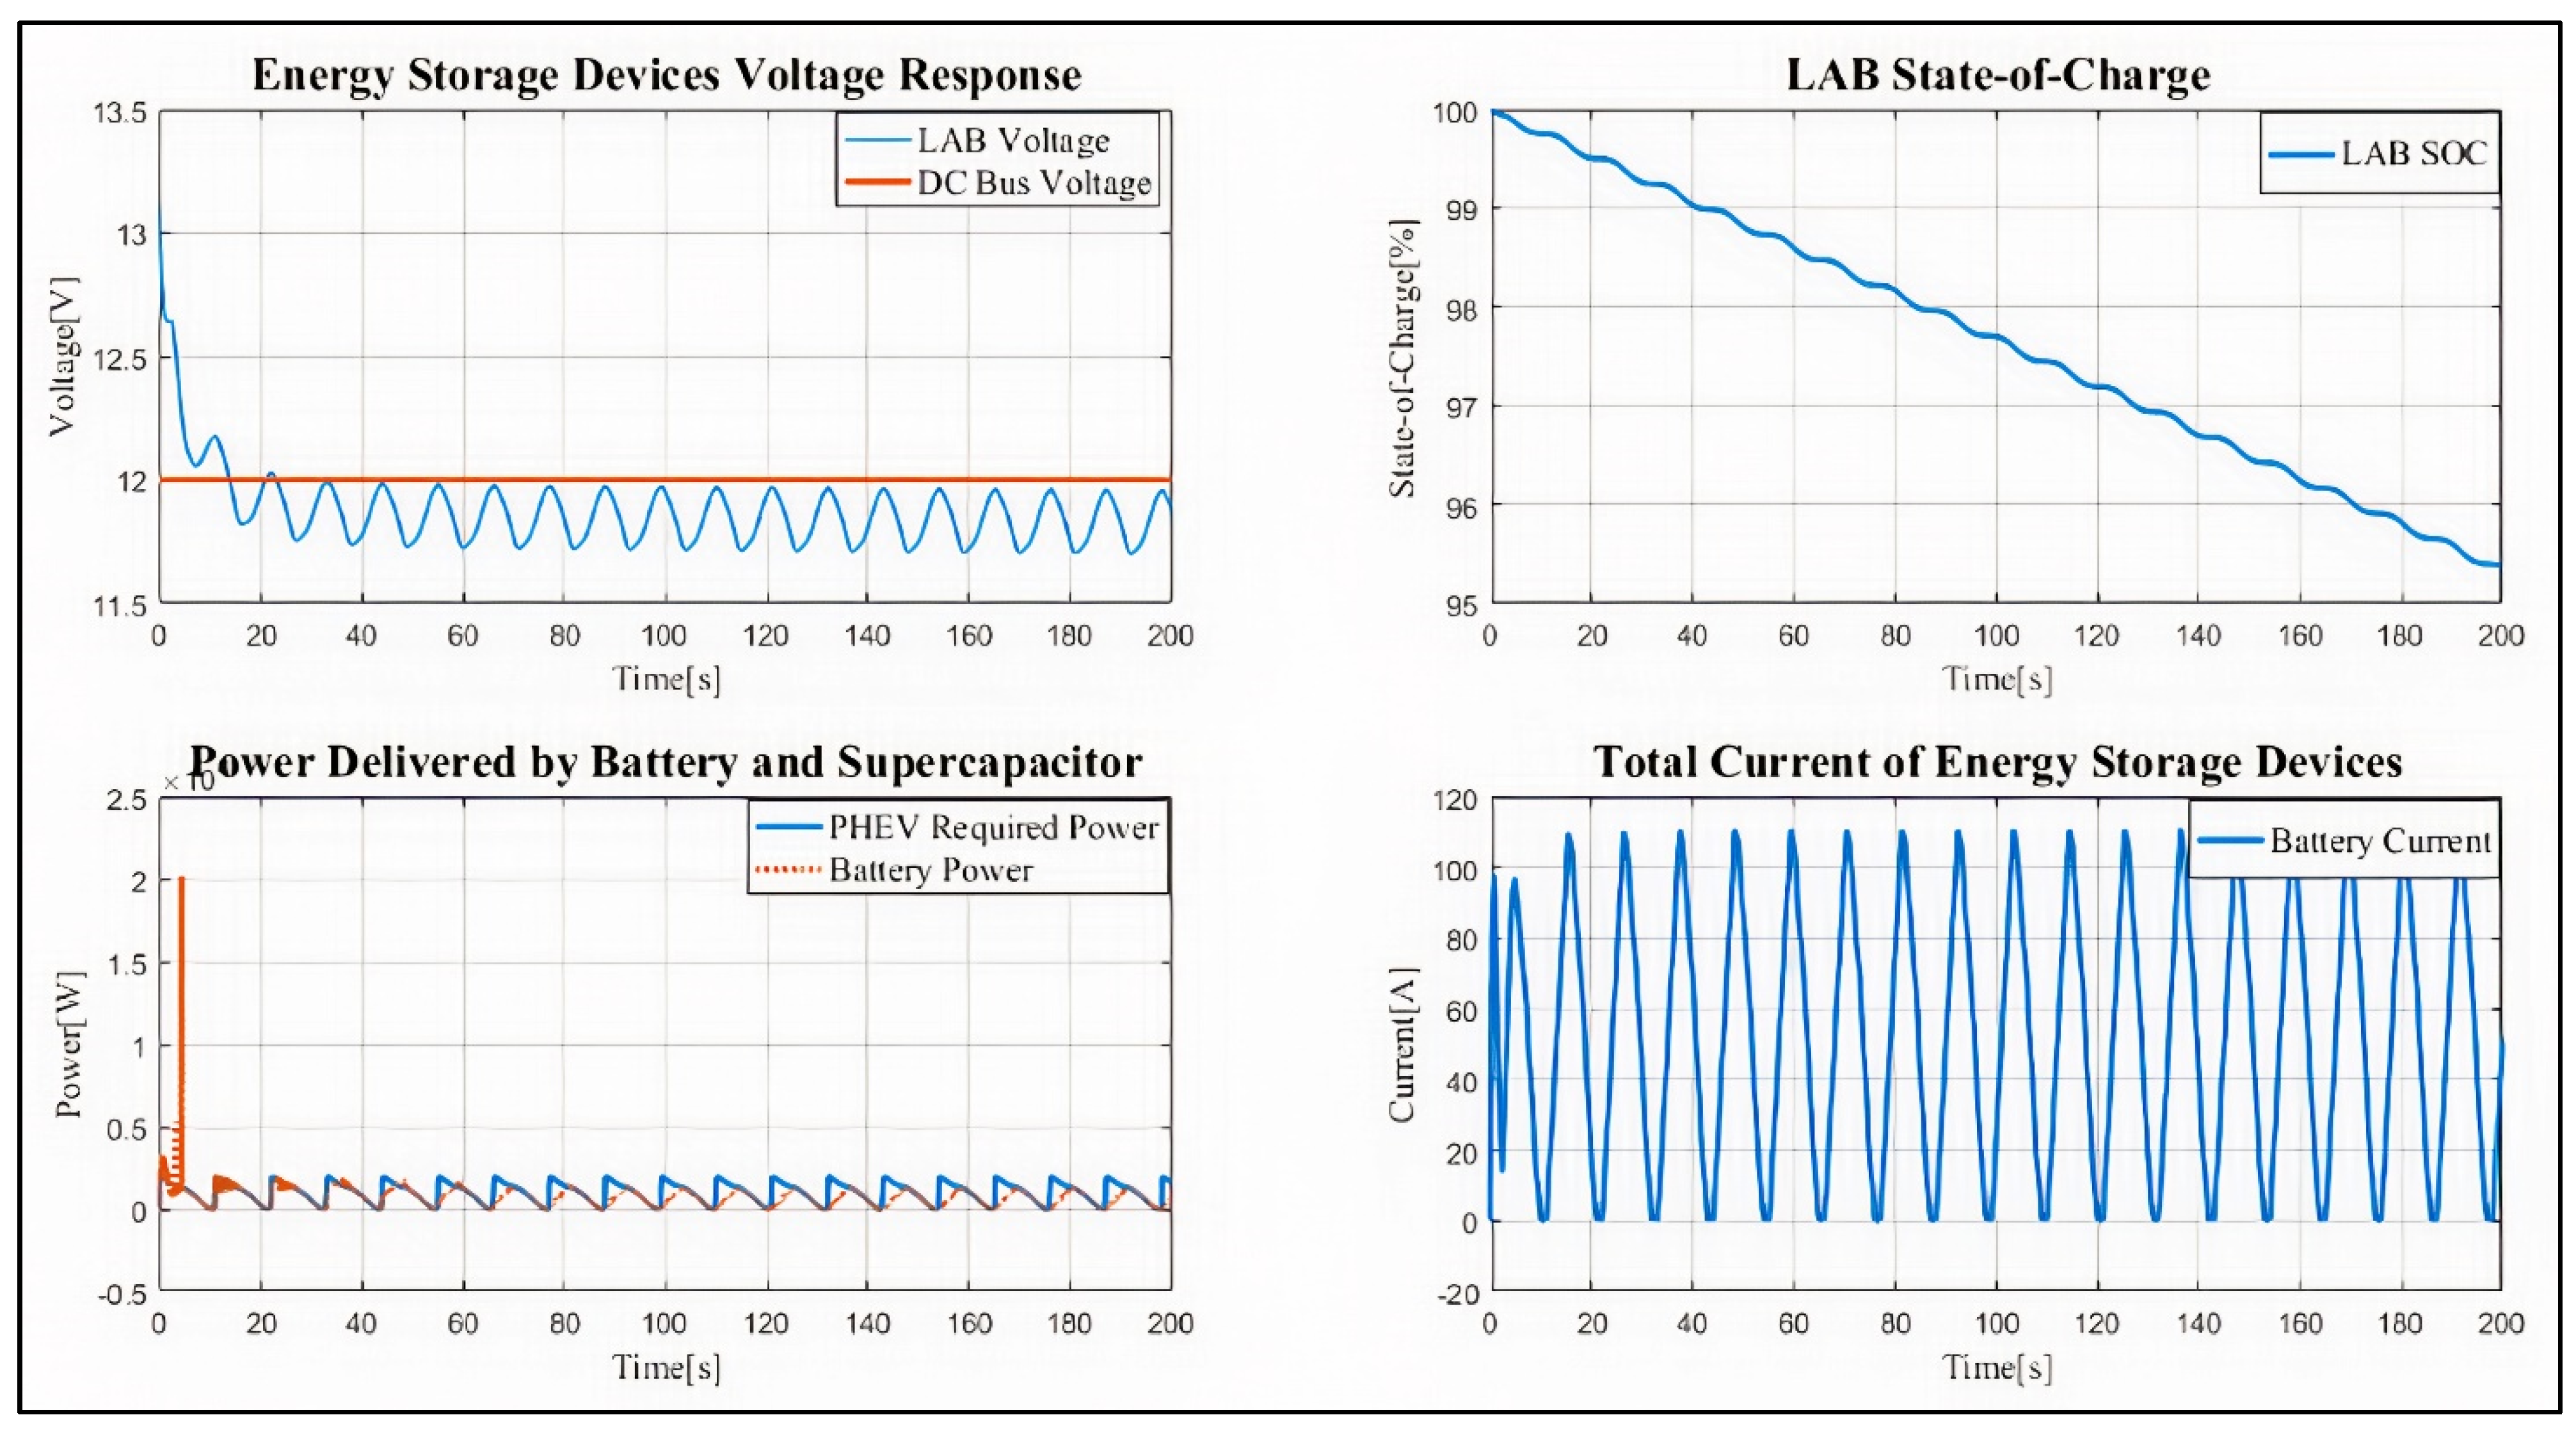
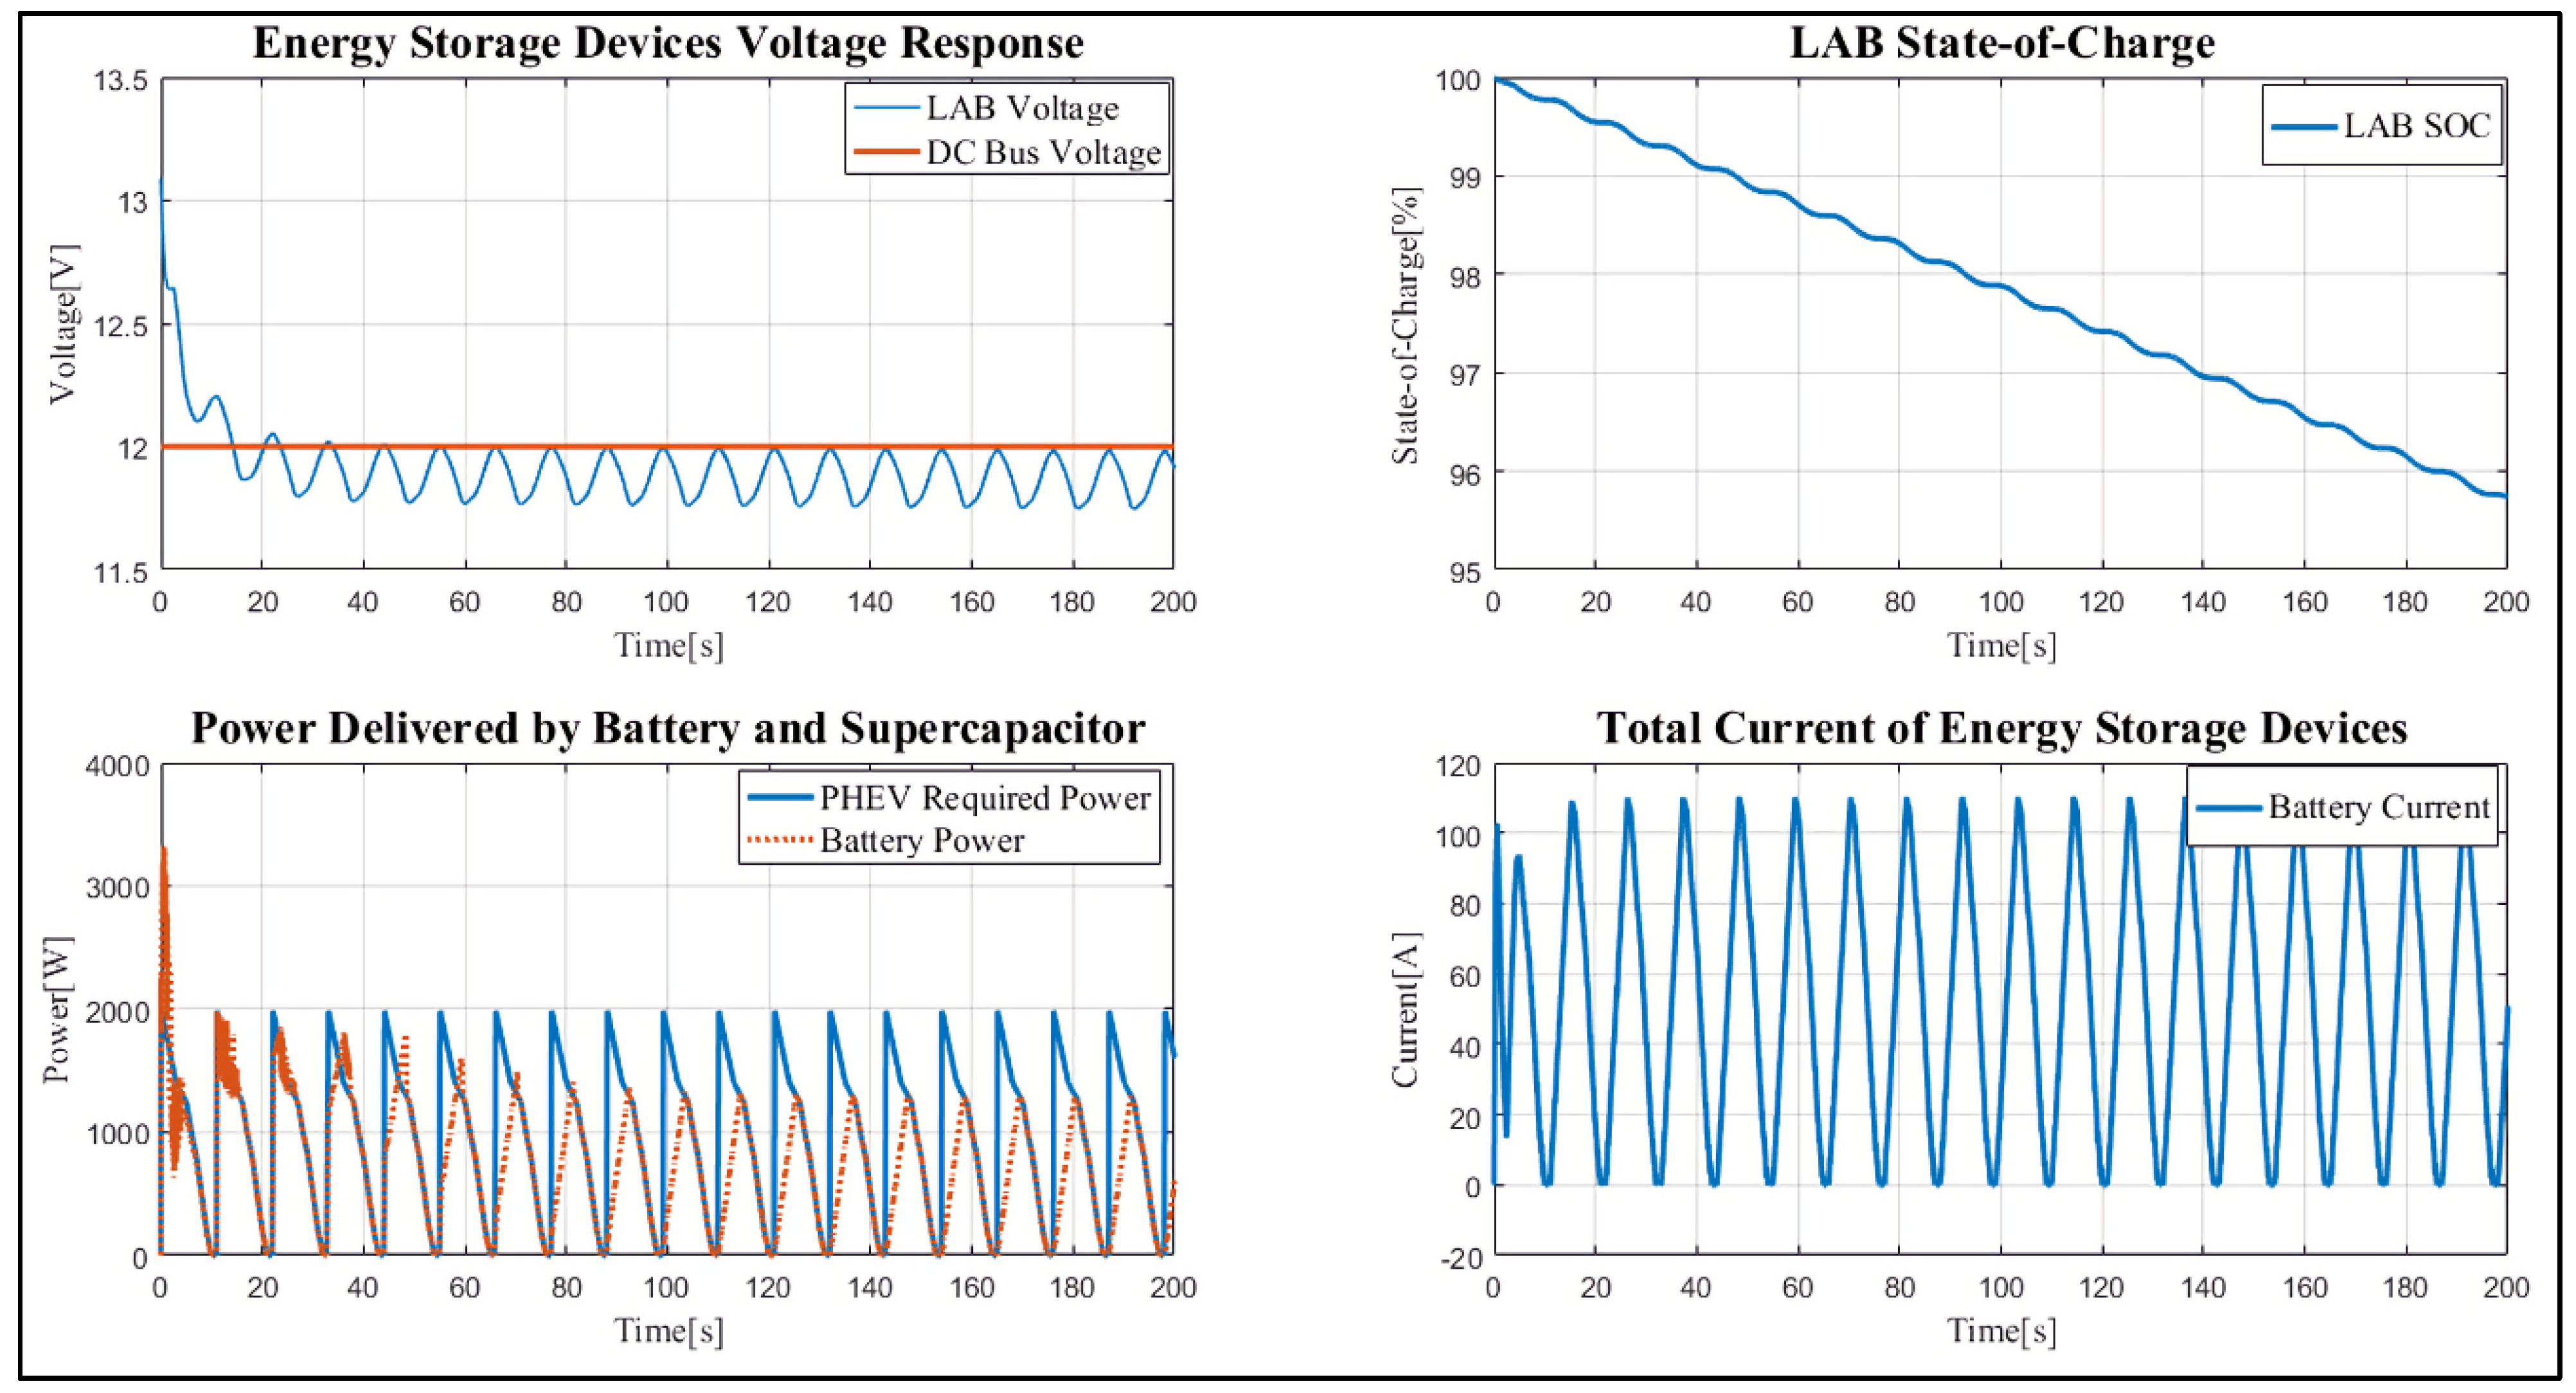
4. Results and Discussion
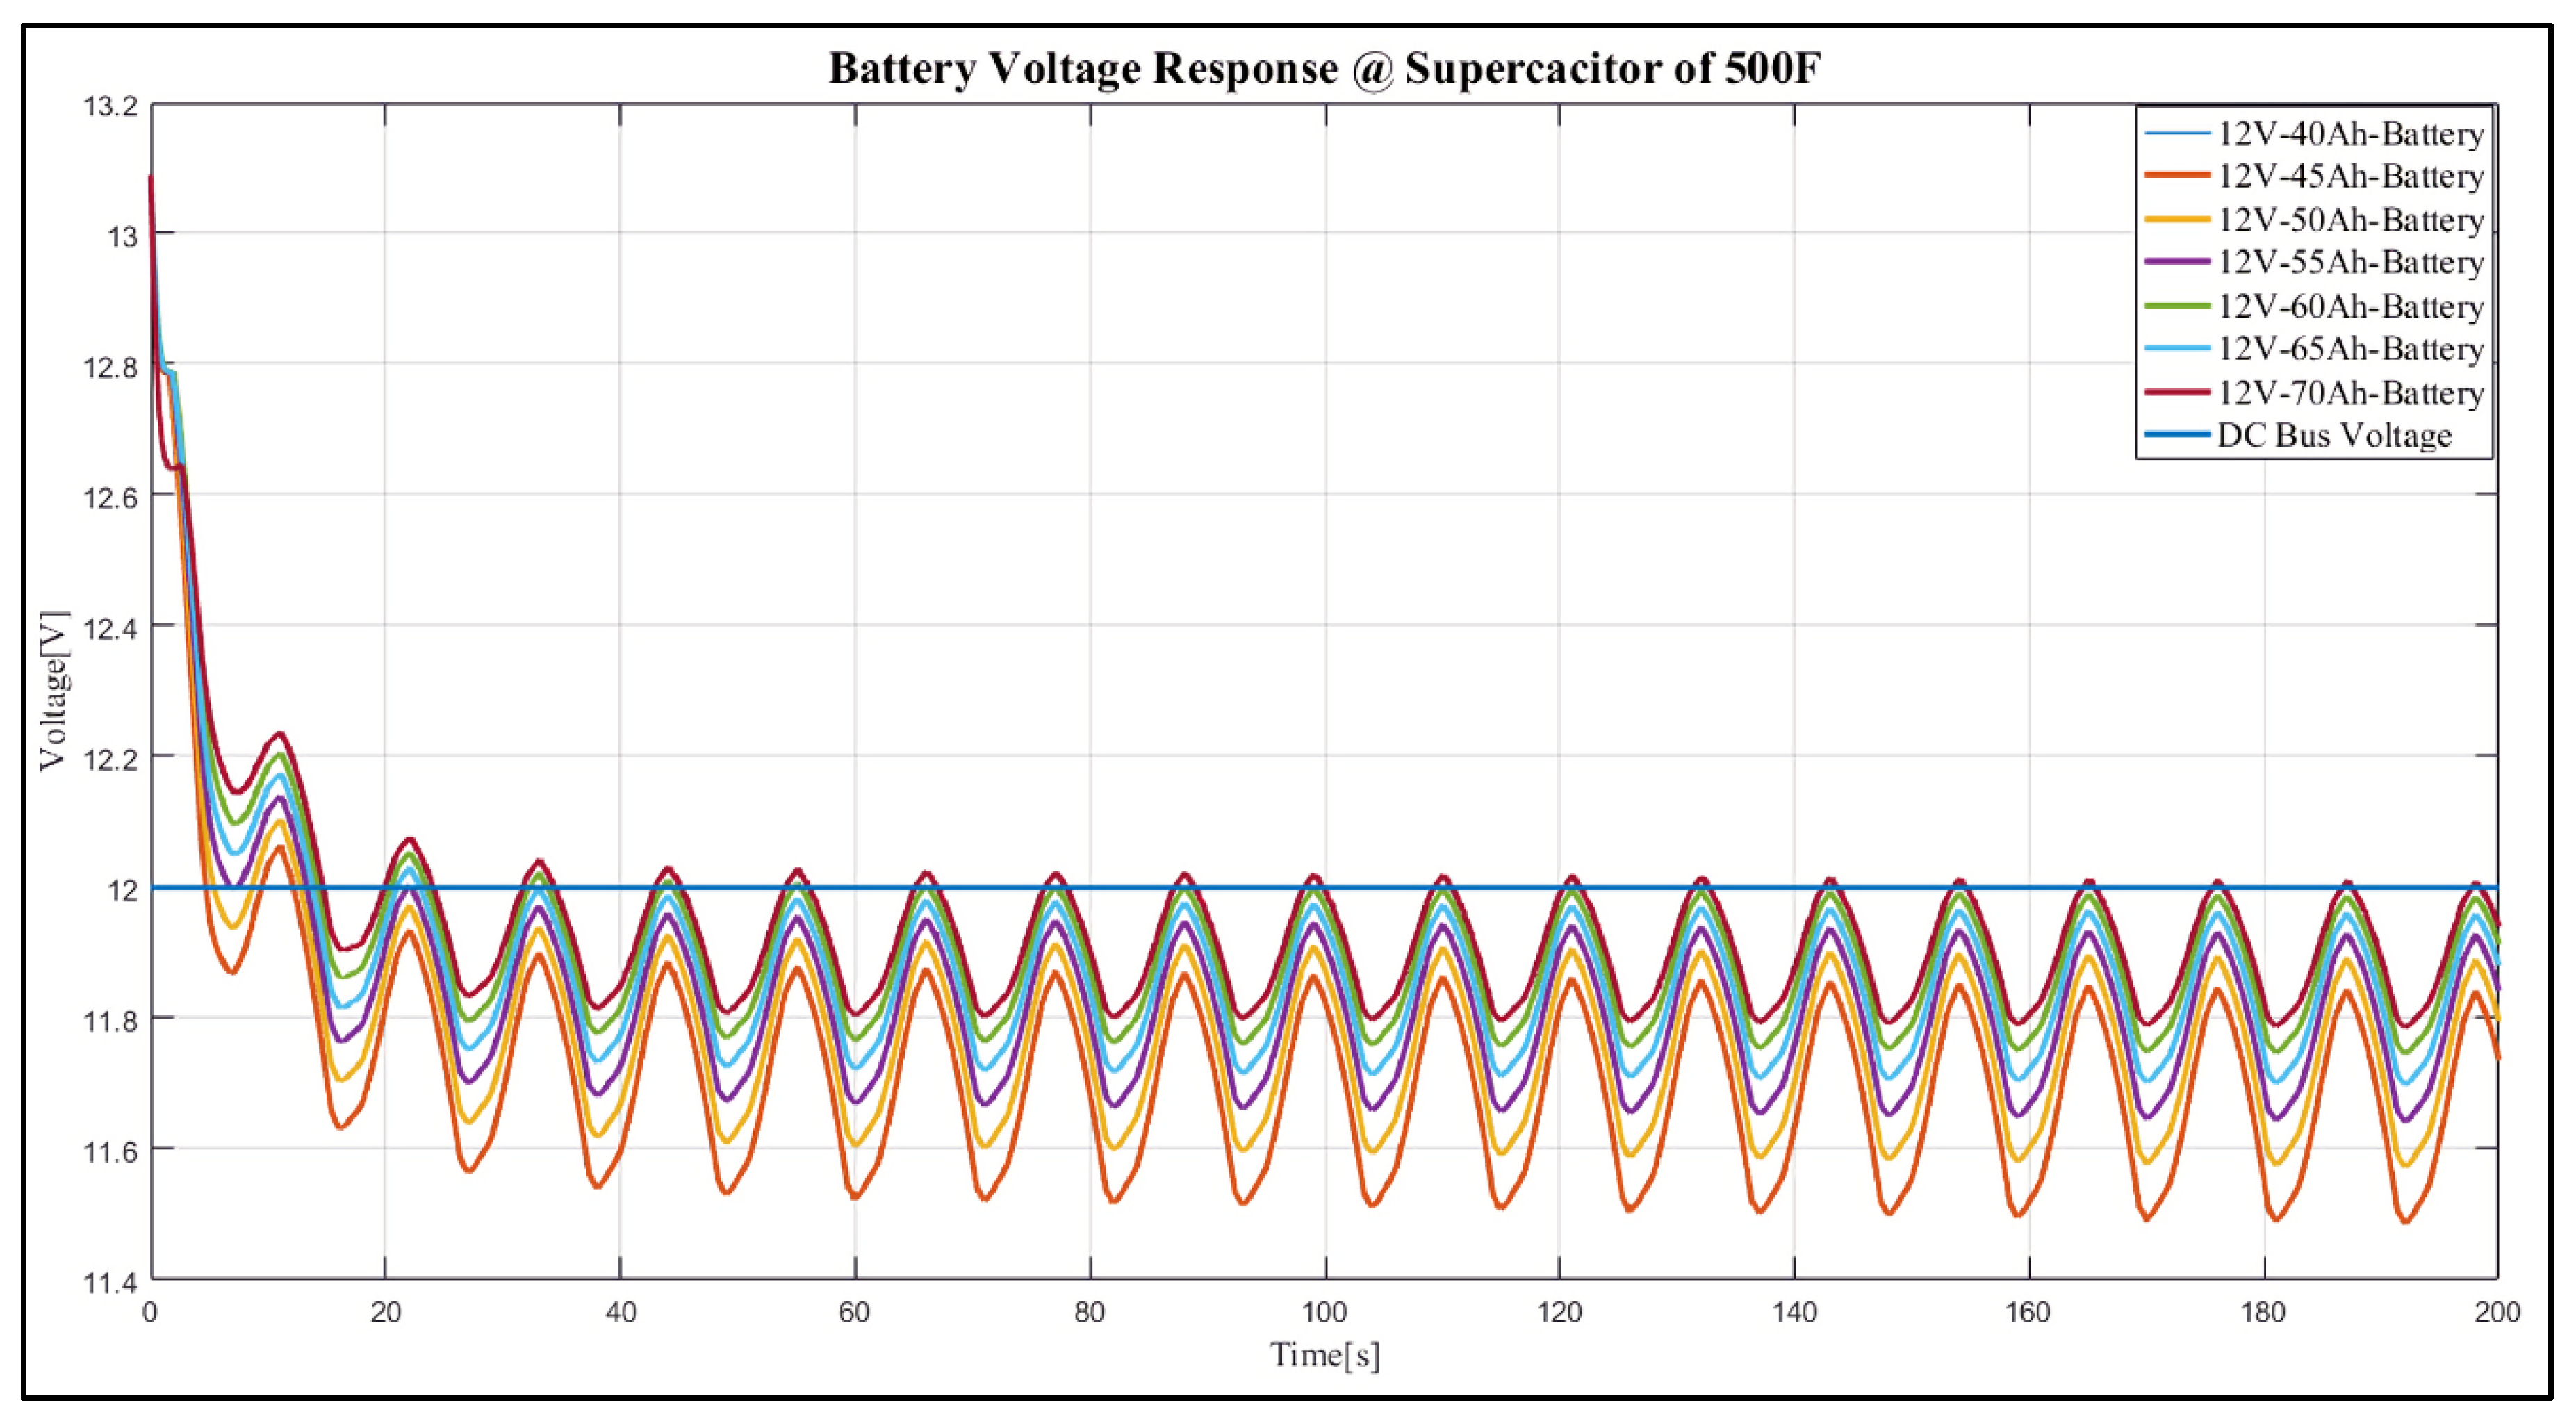
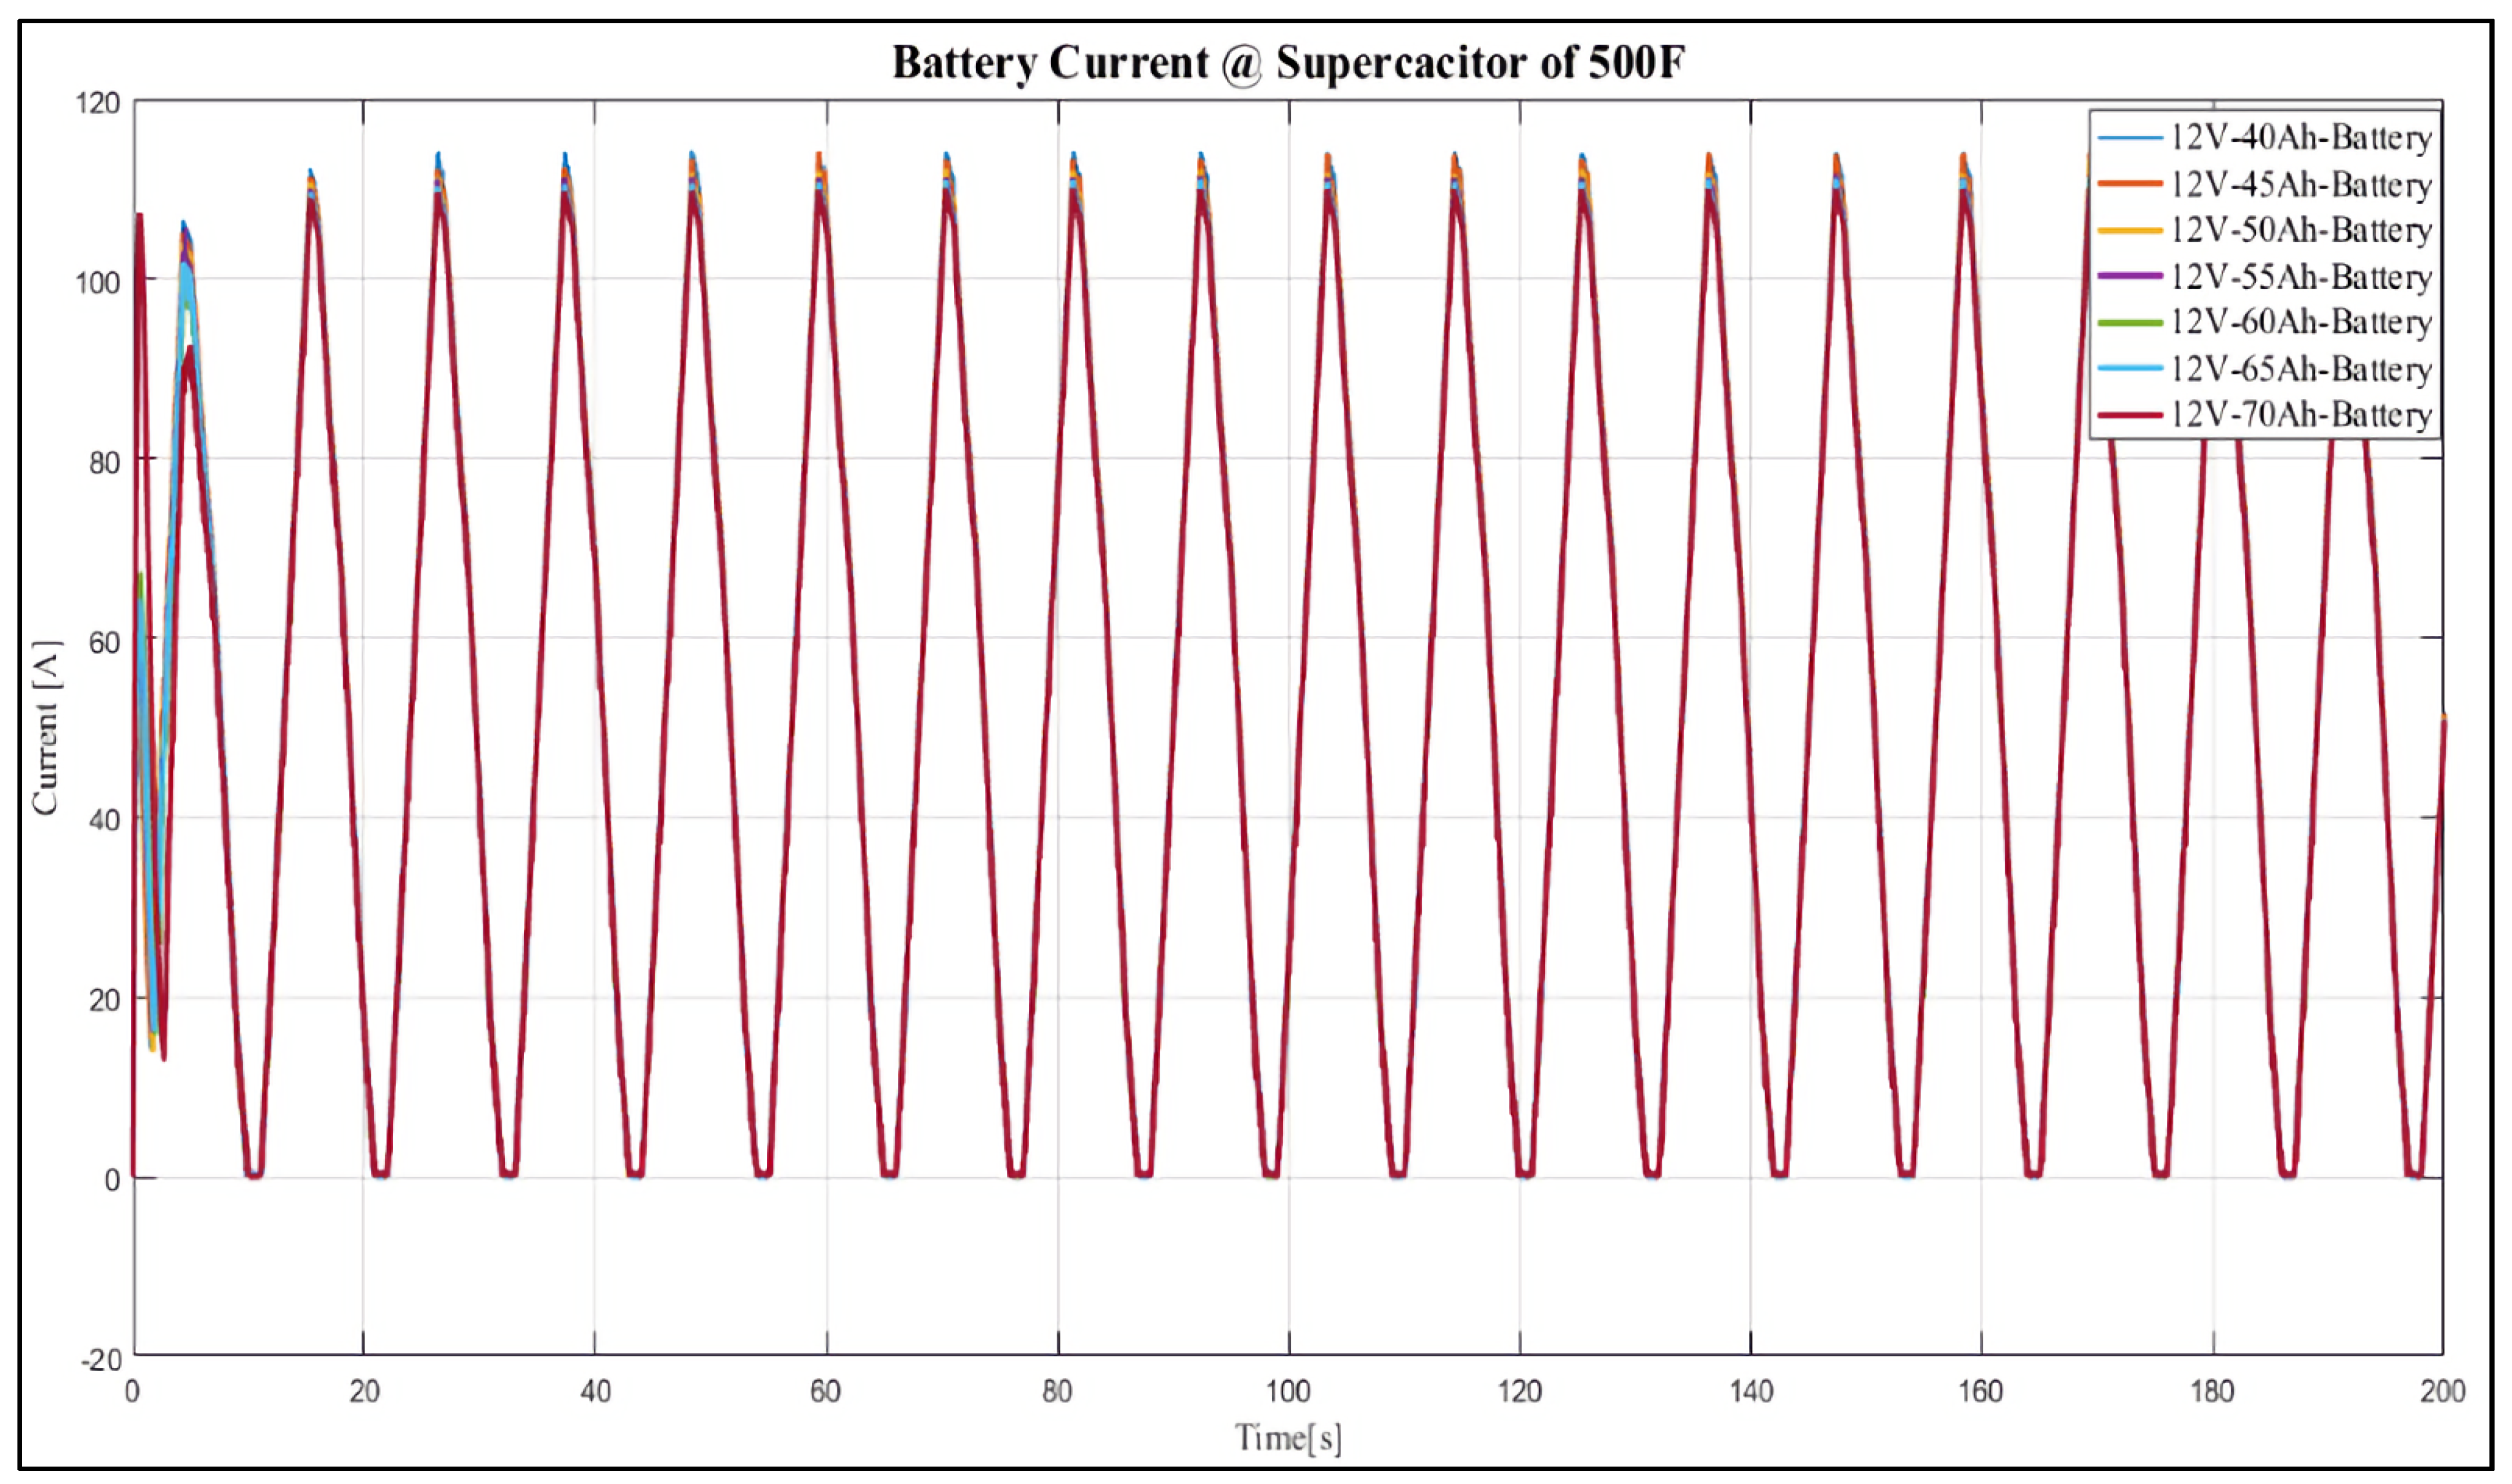
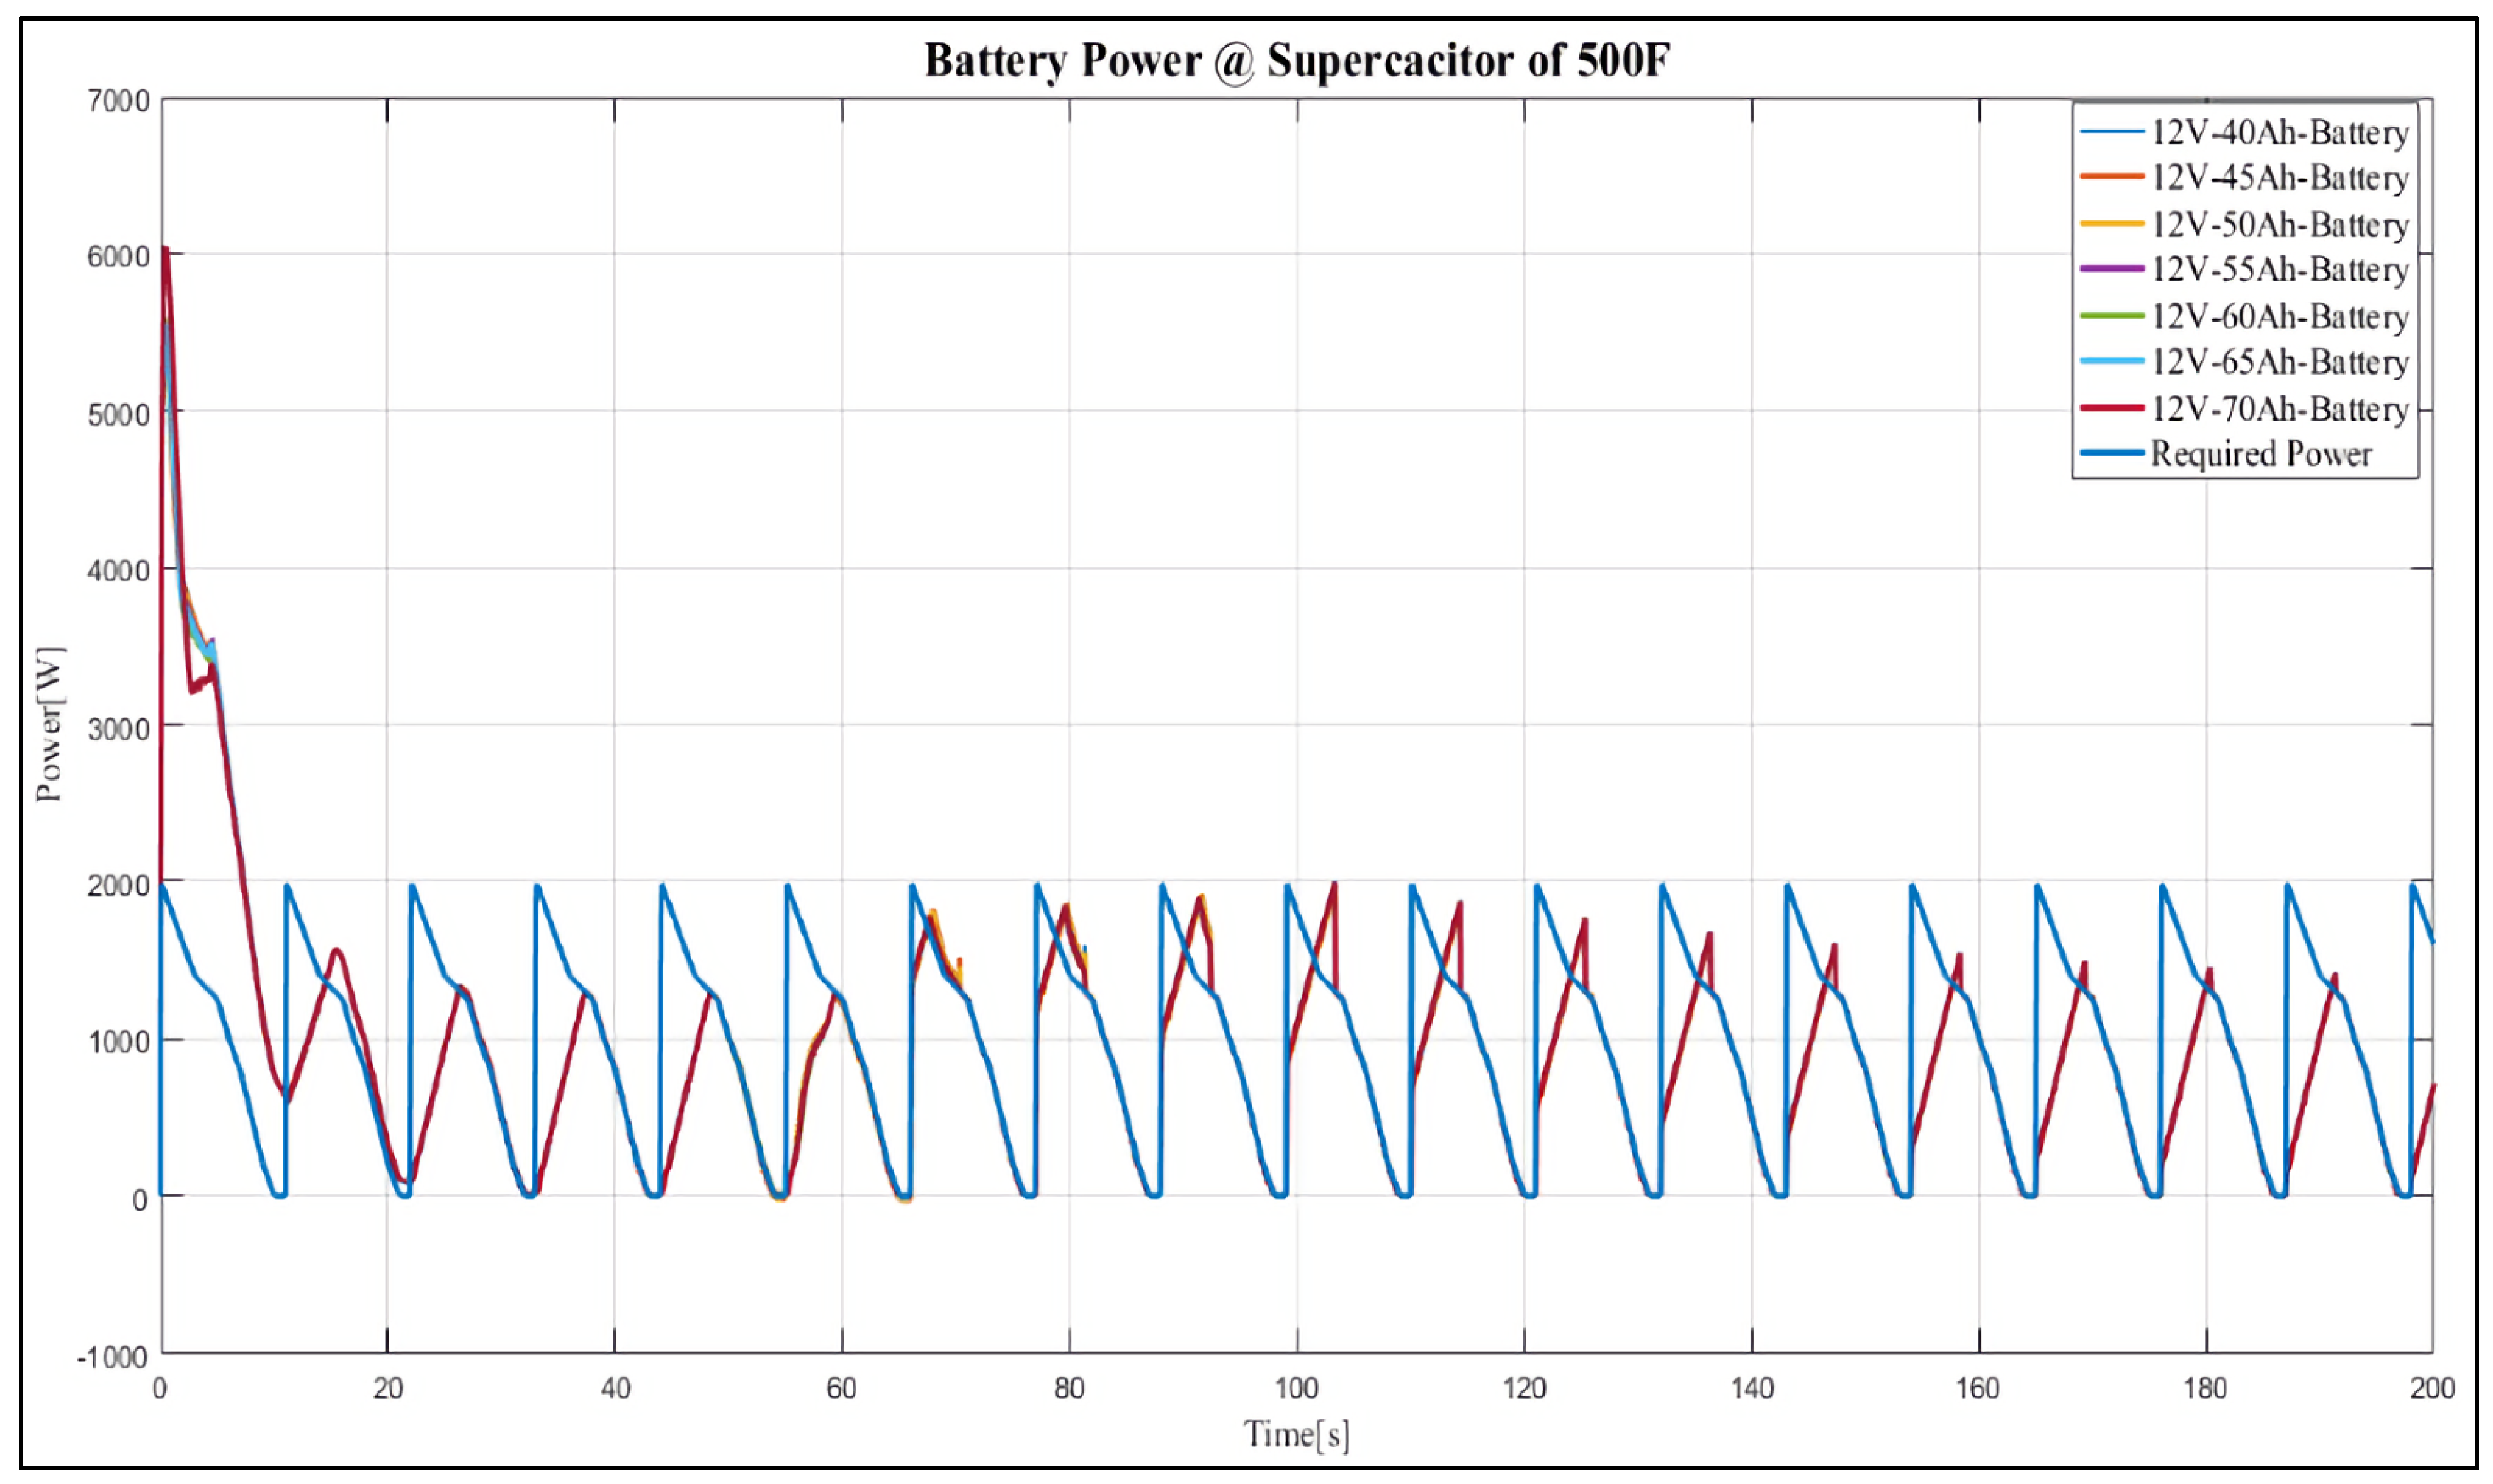
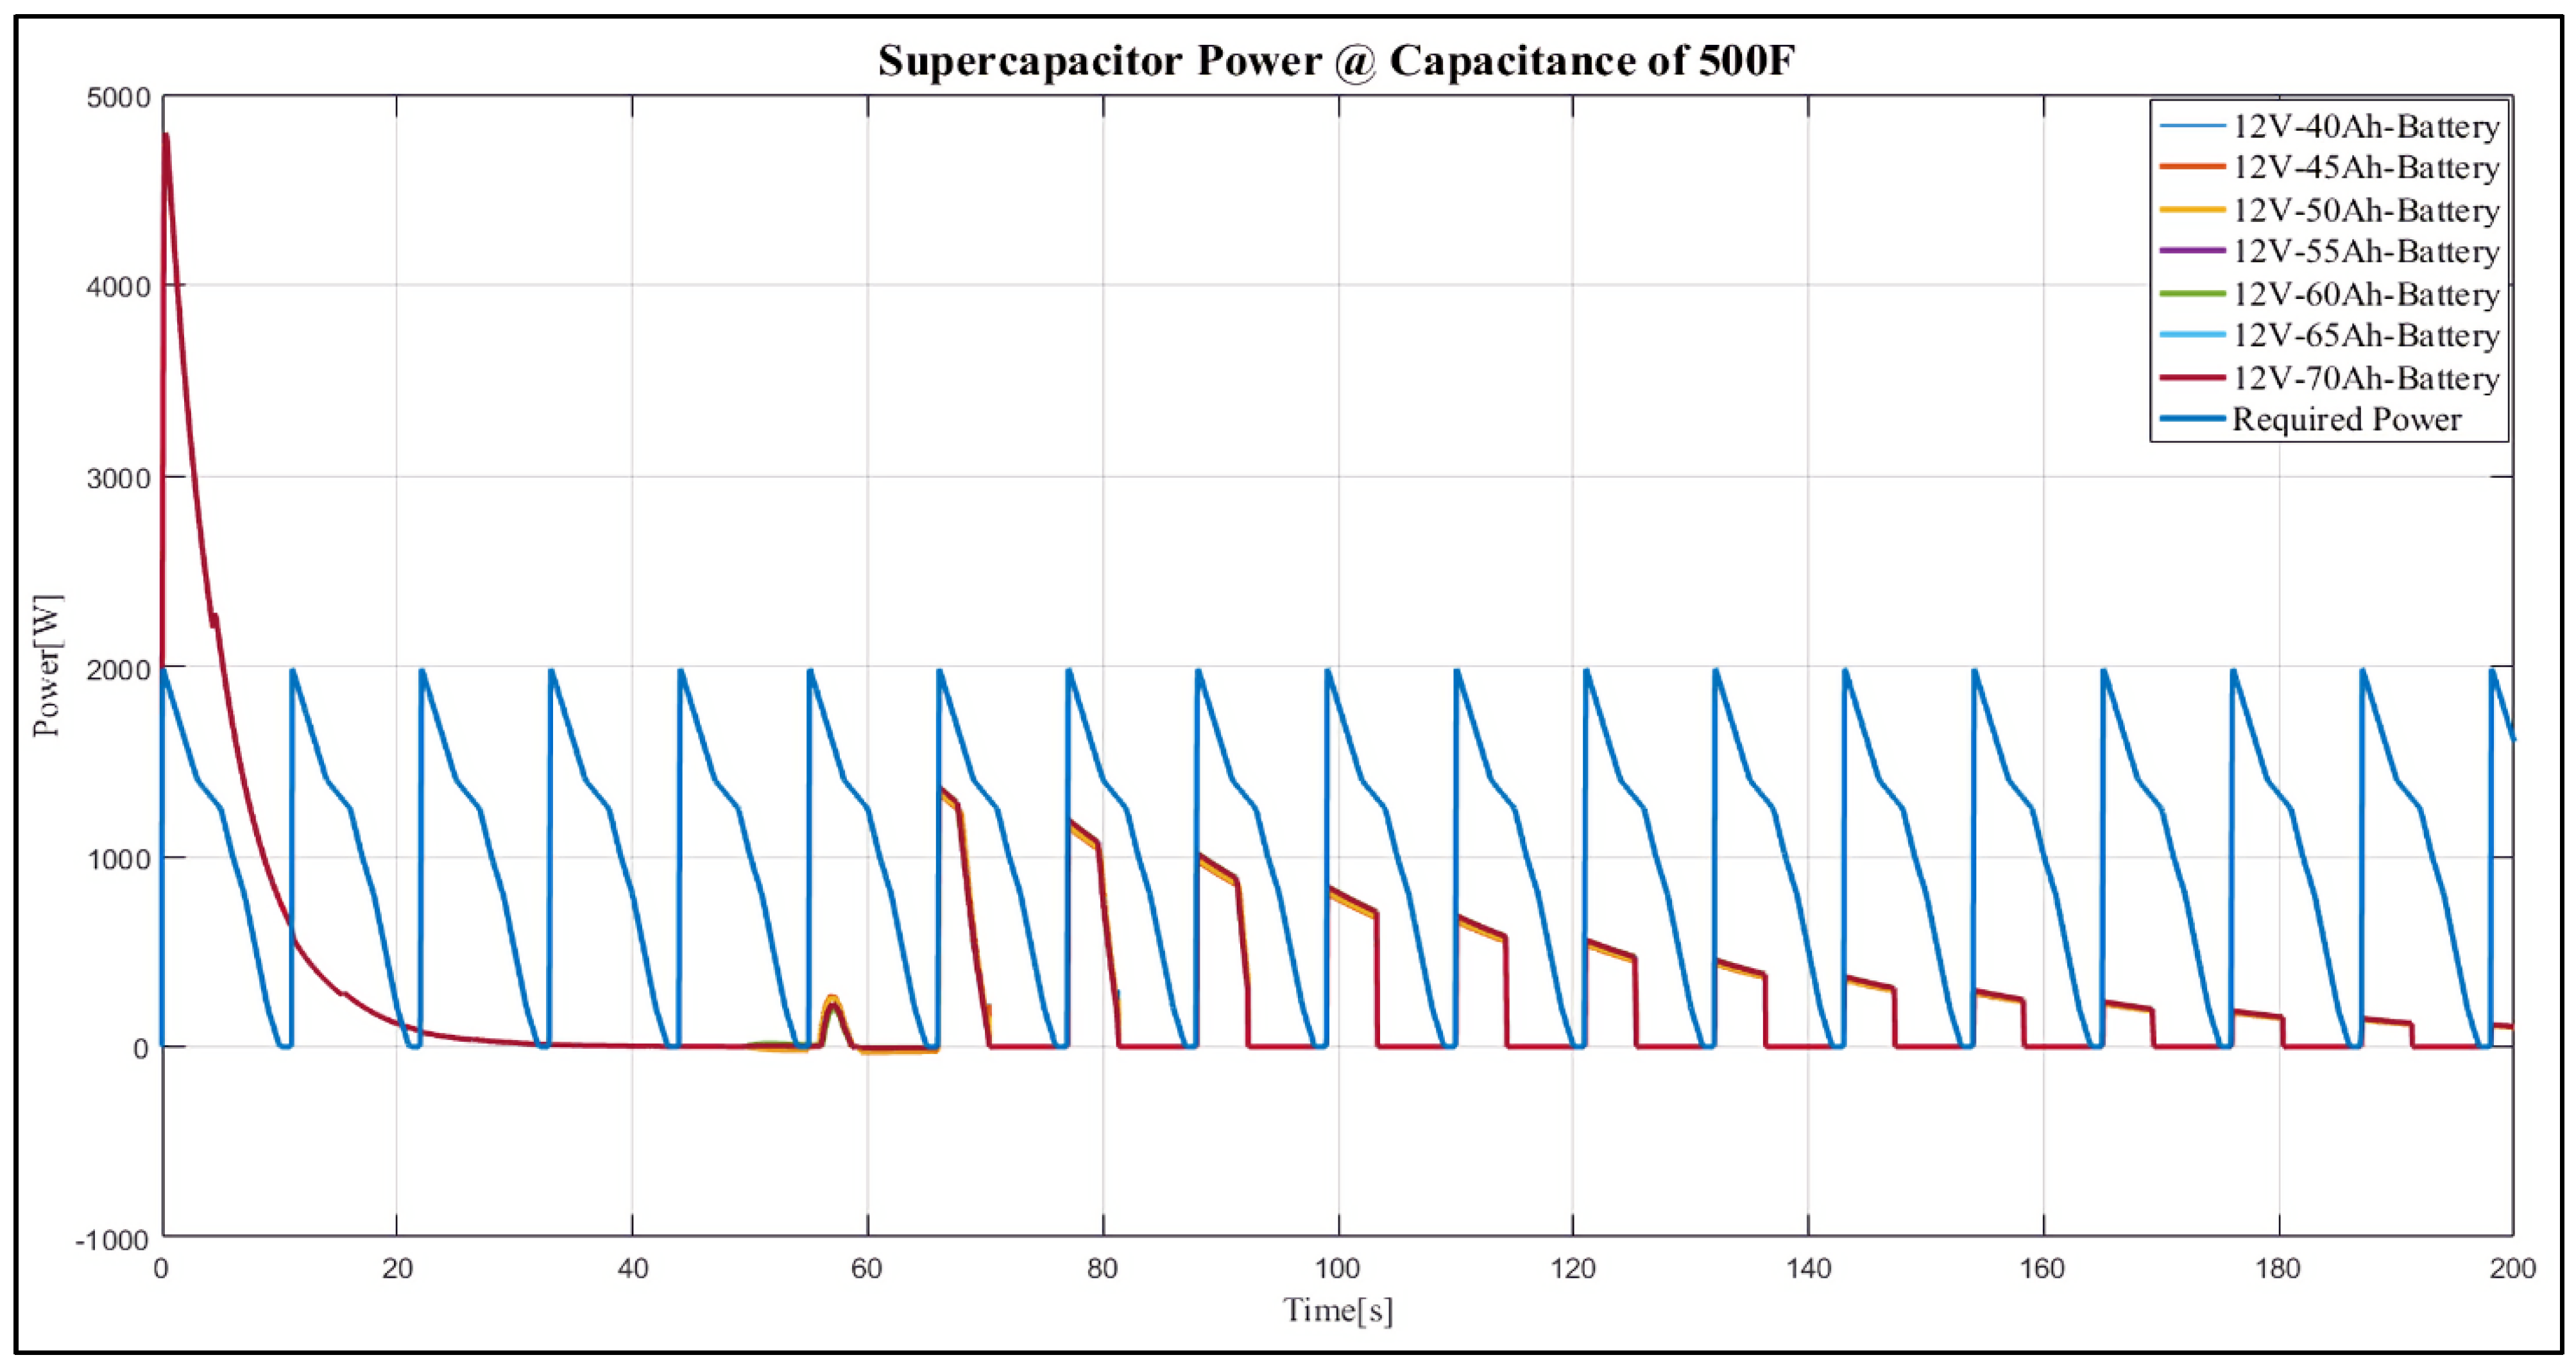
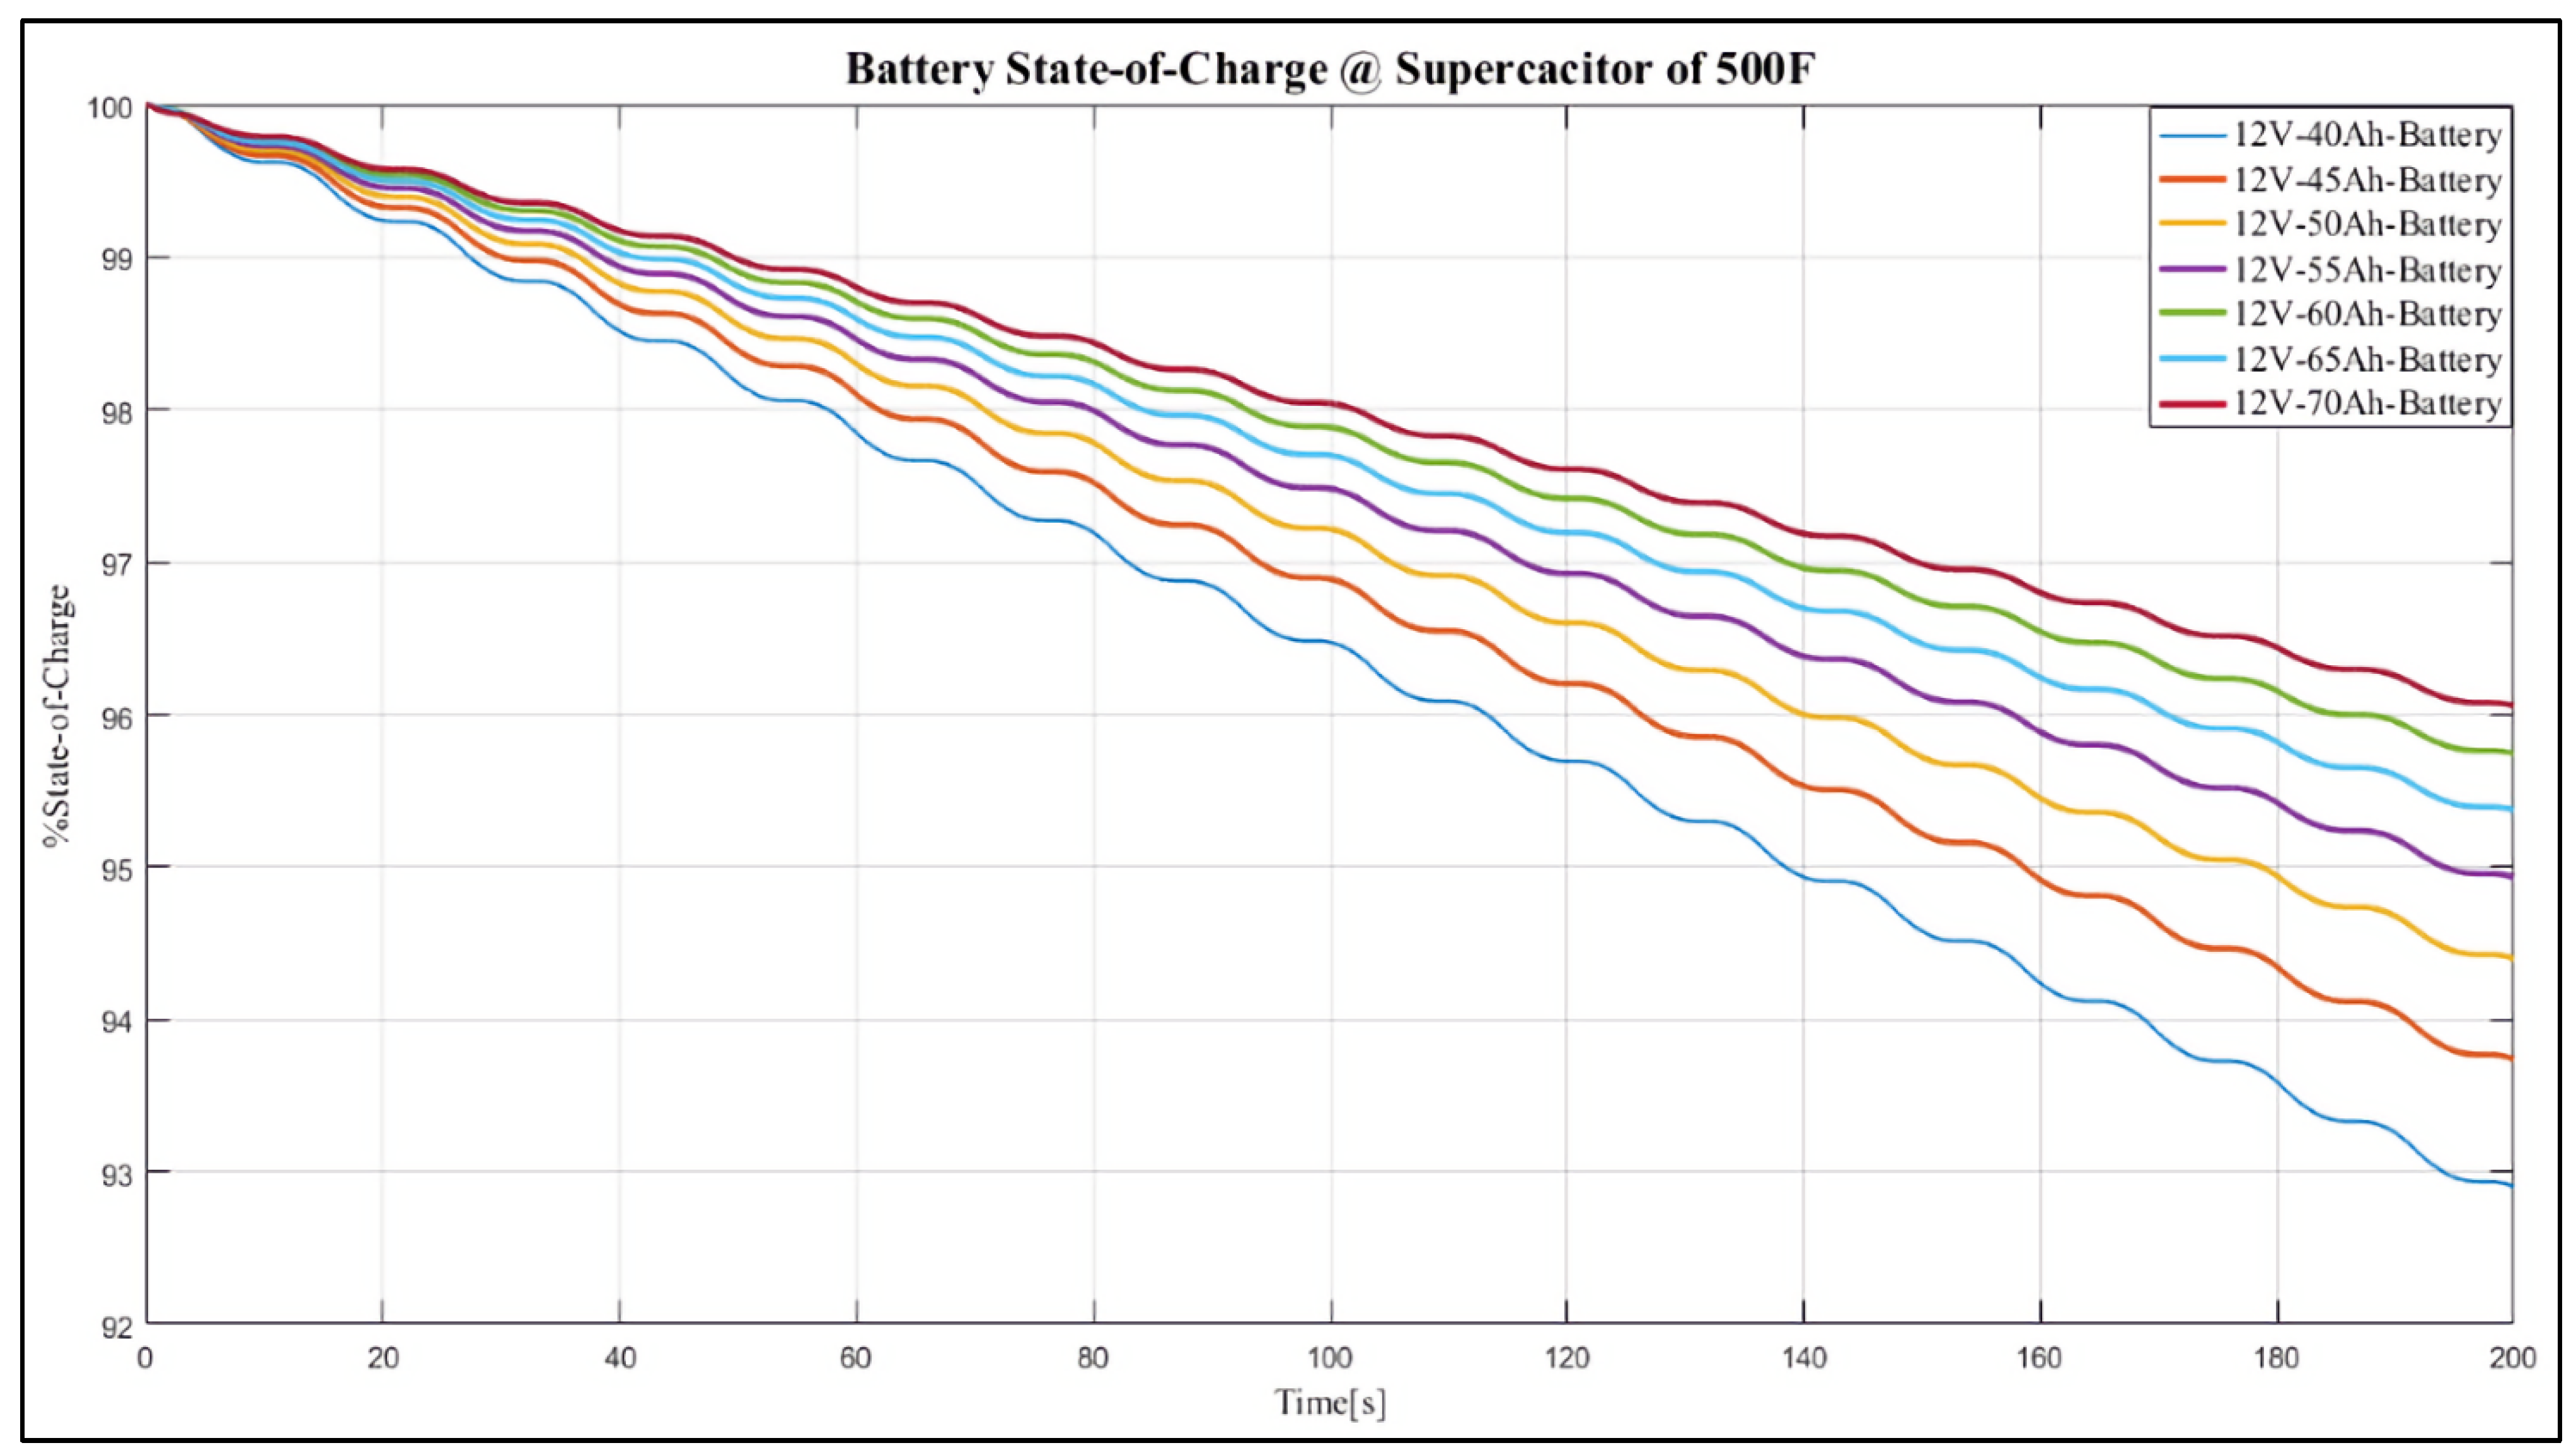
This section presents and discusses the outcomes of the simulated system. Diverse capacity sizes of batteries are selected and tested to optimise the system’s performance. The capacity sizes that are used range from 40 to 75 Ah by incrementing with 5 Ah volume. Consequently, the battery performance testing results without a supercapacitor are represented in Figure 8, Figure 9, Figure 10, Figure 11, Figure 12, Figure 13, Figure 14 and Figure 15, as shown and discussed below.
In Figure 8, the response of the battery voltage resonates under the essential DC-link bus voltage of 12 V to operate effectively. Subsequently, in terms of the battery SoC, it decreases expressively, and it dramatically affects the battery’s lifetime, respectively. Moreover, during the first 10 s of the simulation, the battery’s power output reaches the required power demand. However, this power consists of peak undulations. Abruptly during the simulation, a 6.1 kW greater crest of output power exists, deemed undesirable. Consequently, the outcomes show that a battery magnitude used solely cannot serve a distinctive automobile demand. The 45 Ah sole battery results are shown in Figure 9.
Figure 9 displays a potential battery value, which remains below desired direct-current-link potential, 12 volts. Therefore, signifying that there exists a below-charging phenomenon of the battery. This below-charging harms LABs because it creates sulphation and reduces battery lifetime expressively. Moreover, the battery SoC decreases to below 94%. In addition, the battery alone cannot meet the required vehicle power.
Similarly, the result indicates that the desired boosted battery voltage at the DC bus is not attained without a supercapacitor. The supercapacitor capacitor acts as a buffer to stabilise the desired DC bus voltage. Hence, without a supercapacitor, the expected battery voltage does not match the DC bus link voltage. Moreover, integrating LAB and other ESSs such as lithium-ion batteries cannot suffice the modern vehicle requirements. Both LAB and lithium-ion batteries have slow dynamic responses. Therefore, a supercapacitor meets these requirements to satisfy quick acceleration and recapture abrupt regenerative braking energy. Moreover, it has fast charging/discharging capability when needed. Currently, this is the best solution given the state-of-the-art analysis because supercapacitor adds little weight to the vehicle. In addition, LABs are mature, have no thermal issues, and cost less as compared to lithium-ion batteries. In terms of the battery current, it is below the obligatory, needed current of a distinctive automobile. Therefore, Figure 10 shows a 50 Ah capacity battery as tested.
In Figure 10, the battery voltage response changes nearer towards the DC-link bus voltage. However, there is no advancement in the results even when the battery capacity increases. During 10 s of the simulation, the battery power exceeds a peak rate of roughly 14 kW. This battery power is an intolerable reach that peak value while producing less current. Overall, the performance analysis model does not provide the expected results in this respect. Hence, a 55 Ah battery capacity could improve the performance analysis, and Figure 11 represents the results.
In Figure 11, the battery SoC displays substantial enhancement. However, the battery output voltage remains under the 12 V DC-link bus voltage as needed. Additionally, this battery cannot serve the specific vehicle’s required power. Figure 12 shows the results of the simulation for a 60 Ah battery capacity.
In Figure 12, there is a minor battery voltage enhancement in matching the DC-link bus voltage during the first 20 s of the simulation. As observed, the battery SoC improves slightly; the SoC resonates at around 95.1% and below this threshold during the simulation. However, the power produced by the battery alone does not match the typical power required of the automobile: Figure 13 displays battery voltage, SoC, energy, and current of a 65 Ah battery capacity.
Based on the results indicated in Figure 13, there is a substantial development in battery SoC. However, the power of the battery is not tying with the demanded typical vehicle’s ability. Consequently, the battery’s voltage improves relative to the increase in battery capacity; however, this voltage is still below the needed DC-link bus voltage of 12 V and with significant ripples. Figure 14 shows the 70 Ah battery performance evaluation.
In Figure 14, the battery potential resonates beneath the direct-current-link bus potential. In addition, the battery output power is not enough to suffice the typically required capacity of the automobile. Although the battery SoC has improved to almost 96%, not all parameters are satisfied. Figure 15 shows the 75 Ah battery performance characteristics.
In Figure 15, there is an improvement in the battery’s voltage as it almost matches the DC-link bus voltage. However, the ripple is high. Moreover, battery SoC has improved significantly and resonates at 96%. Although there is a substantial enhancement in battery SoC and voltage, battery power is needed to match the required capacity of the typical vehicle under study. Moreover, the current is still not enough to suffice the car.
Case study one uses diverse battery capacity sizes, which range from 40 to 75 Ah with increments of 5 Ah. It tests these batteries to assess their influence on the development of the battery management approach. Nevertheless, the results show that the sole battery is inappropriate and cannot serve a distinctive automobile demand. Hereafter, because the battery voltage is under the desired 12 V, this under-voltage portrays the result of under-charging, which influences battery lifespan expressively. This under-charging procedure decreases battery lifespan because it creates a miracle identified as “sulphation”. This phenomenon produces a high concentration of sulphuric acid located at the lively battery solids’ lowest area. Henceforth, it concedes the dispersal of this sulphuric acid inside the battery.

Case Study

The study performs an additional case to the main results. This investigation evaluates various capacities sizes for battery and supercapacitor to offer a complete integrated hybrid ESS. The test is to provide a compact system yet can deliver unprecedented TV power and energy demands. Additionally, while guaranteeing a stable 12 V battery voltage and the SoC of 90%–96% statistical limit. Moreover, the system should not compromise the dynamic charge acceptance ability of the battery. All evaluated battery capacities have an initial 100% SoC. Selected capacities of the batteries for evaluation are as follows;
  • 12 V, 40 Ah;
  • 12 V, 45 Ah;
  • 12 V, 50 Ah;
  • 12 V, 55 Ah;
  • 12 V, 60 Ah;
  • 12 V, 65 Ah;
  • 12 V, 70 Ah.
Accordingly, capacitance values of the supercapacitor range from 50 to 750 F, with 50 F increases, to hybridise different battery capacities. The study evaluates a maximum battery capacity of 70 Ah because a 75 Ah battery capacity denotes the study’s primary outcomes. The 75 Ah battery capacity is the minor battery to employ because it offers a slight, nonetheless, full hybrid ESS for use in TVs. Thus, Figure 16 displays a battery voltage response with a 500 F supercapacitor.
The voltage is within 12 V and not below this threshold by using a 75 Ah battery with a 500 F supercapacitor. Figure 16 illustrates the voltage response of the supercapacitor and compares it to TV DC bus voltage. In Figure 16, the outcomes of the battery voltage compared to DC bus voltage remained under 12 V. This under-voltage does not guarantee the condition of being inside 12 V. Yet, these outcomes relate to the critical results described in the work of [32].
Figure 16 shows a comparison of the battery potential response results and the direct-current-link bus potential. The battery potentials are under the desired 12 Volts limit. This low voltage indicates that the batteries do not provide voltage stability conditions as expected by the automobile. Comparison of critical outcomes as existing in the work of [31], the potential is kept at 12 V while using a 75 Ah battery capacity with a 500 F supercapacitor. Figure 17 compares and displays a supercapacitor response in terms of potential to the direct-current-link bus potential of a typical automobile.
As illustrated in Figure 17, the voltage of the supercapacitor stabilises at 12 V for 40 s duration of the imitation. The dynamic behaviour of the supercapacitor causes this loss of voltage stability because it continues charging/discharging depending on the TV operation, thus; varying voltage. Additionally, Figure 18 shows the evaluated battery current for diverse batteries.
In Figure 18, the battery currents of different capacities were recorded and linked. The extreme amperes recorded was 110 A. This current is insufficient to gratify a typical TV. Even though the required ampere is inadequate, a 75 Ah capacity battery offers the necessary energy and power for an ordinary TV, as deliberated in the key outcomes of the study. Figure 19 displays the current results of the supercapacitor with diverse battery capacities.
Figure 19 displays a gradual decrease in supercapacitor current. This decrease in current is the result of dynamic charging and discharging through TV functioning mode. The supercapacitor current reached an extreme of 105 A. Therefore, if the supercapacitor cannot deliver the required current for a typical TV, the battery supplies the additional ampere is to meet the vehicle demanded current. Figure 20 displays the given battery power versus the needed vehicle power.
As illustrated in Figure 20, a sole battery ESS cannot deliver the needed power for a distinctive TV. Throughout the simulation, the battery provides the necessary energy for only 60 s. Thus, when the battery cannot deliver the required power, the supercapacitor’s purpose is to serve this need and vice versa. Figure 21 displays the given supercapacitor power compared to the needed TV power.
In Figure 21, the results show that the supercapacitor cannot deliver sufficient power needed to meet the demanded typical TV power. Consequently, combining a battery and a supercapacitor in a hybrid system can serve the required strength of an ordinary TV. Here, the study uses a specific TV. The higher capacity provides a conducive system to meet a typical vehicle requirement. It allows a wide voltage range for the supercapacitor, thus directing high peak currents to the supercapacitor. Consequently, the sole battery-operating peak currents are reduced significantly and provide reduced battery cycling. Figure 22 displays the SoC of the battery.
While the battery maintains its SoC within the rigid numerical boundary, the work of [22] states the outcomes of a 75 Ah battery. Consequently, grounded on case study outcomes, a hybrid 75 Ah battery and a 500 F supercapacitor can suit a specific transport vehicles’ demand. In addition, it provides the minimum capacity of the battery magnitude, which is combinable to serve transport vehicles’ space. Therefore, in the work of [22], the study presented the main results of the 75 Ah battery voltage response, SoC. Figure 22 shows an improved battery SoC with a statistical limit of 90%–96% when the capacity of the battery increases. However, Figure 23 and Figure 24 show the main results of a 75 Ah battery voltage response, SoC, and its lifespan determined using the reliability criterion. The study presents these results to minimise frequent referring to the published paper.
In Figure 23, between 0 and 30 s, a supercapacitor displays a declining fluctuating voltage response when connected to the DC bus. Consequently, the battery voltage remains at the 12 V constant region for the simulation period. At the same time, the voltage of the supercapacitor reduces to almost zero at more than 350 s. The results show that lead-acid battery voltage oscillates at 12 V. This voltage stability defines that the system improves battery behaviour as conferred in the work of [32]. When comparing the battery voltage response with supercapacitor, the outcome of the simulation shows a declining behaviour at the start of the simulation. The supercapacitor voltage response met the battery voltage after 30 s. A supercapacitor cannot hold an electric charge for a prolonged period. Because of this drawback, the attained minimum voltage of 2 V is prevalent from a maximum voltage of 15.5 V within 350 s of the simulation period. In terms of the battery voltage, there is a 0.9% change. It indicates that the system improves scheme performance compared to other demonstrated hybrid topology approaches in the work of [33,34]. Therefore, Table 2 shows the summarised results of this case. The supercapacitance varied between 50 and 750 F in increments of 50 F.
In Table 2, the study evaluates a 12 V battery, 70 Ah, with an initial 100% SoC. Therefore, to assess the supercapacitance influence, its capacitance varies between 50 and 750 F. This variation allows for performance assessment of the hybrid LAB and supercapacitor. The outcome indicates that the higher capacities provide a conducive hybrid system that can serve a typical vehicle. There is a significant increase in the battery current, high SoC battery performance, increase in supercapacitor current and SoC. While the 70 Ah battery could be suitable, increasing its capacity within a safe margin is essential. Therefore, in this case, a 75 Ah battery capacity with a 500 F supercapacitor is chosen to serve typical vehicle requirements, as shown in green in Table 2. Figure 24 displays SoC performance for a hybrid battery and supercapacitor.
In Figure 24, the SoC performance of a lead-acid battery decreases to up to 95%, and it retains oscillating within 96%. The attained SoC performance is an indication that the lead-acid battery has a great SoC limit. Thus, ensuring that it does not decrease to less than 50%. If the battery SoC reduces to less than 50% and extra, it can cause sulphation and reduce its lifespan expressively. Subsequently, in terms of the supercapacitor, for 100 s, its SoC is kept within 90%–100%. Thus, its steadiness deteriorates because it releases energy/power. In nature, Supercapacitors cannot withhold energy/power for an extended period. Hence, the decrease in its SoC, as indicated in Figure 24, is evident.
Moreover, the supercapacitor SoC shows that the supercapacitor receives charge because of regenerative braking events. However, its SoC steadiness keeps deteriorating. Then, during the operation, the supercapacitor discharges all the stored energy and revitalises for the following sequence of operation.
The cascaded PID control algorithm of the converter ensures that the battery SoC ranges within 90%–96%. Maintaining the battery SoC at 90%–96% ensures that the battery does not undergo deep discharges during cycling. Consequently, the battery voltage is maintained at 12 V to ensure that all equipment load required source is satisfied, such as the wiper blates motor, entertainment systems, etc. Moreover, these also guarantee minimised battery stress while creating available space for current to flow into the battery during the charging phase. Compared with a supercapacitor, the supercapacitor can absorb and deliver peak currents. Moreover, Supercapacitors have advantages, including 10,000 cycles of charge and discharge, preventing deep cycling of the battery, and allowing the battery to have an improved life cycle, respectively.
The anticipated hybrid ESS offers an improved battery terminal voltage steadiness for a long time and an enhanced SoC. In contrast, maintaining a high battery SoC grounds a little battery dynamic charge reception (DCR). Therefore, during the regenerative braking or charging phase, the supercapacitor absorbs all extra energy. A hybrid battery and supercapacitor increase the operating lifetime of the battery expressively. To achieve an improved battery lifetime, battery terminal voltage and SoC controls are necessary. Thus, allowing high numerical voltage and SoC constraints of 12 V and 90%–96%. Therefore, the top results [22] determine the battery lifespan using the reliability criterion as shown in Figure 25.
In Figure 25, 8200 battery life cycles are attained at SoC constrain of 90%–96%. Hence, maintaining battery SoC at 90%–96% is necessary during regenerative braking phases to allow a considerable battery DCR. Because during regenerative braking, the battery requires having the capacity to accept a significant amount of charge. Therefore, based on the result illustrated in Figure 4, only 4% of CA is allowed for the battery to take electronic charge particles. Moreover, Equation (15) describes the battery life estimation model;
L i f e e x p e c t e d = % S o C i n i t i a l B D C A ;
where % S O C i n i t i a l represent the battery state-of-charge at full charge, in this case, is 100% and B D C A represents the allowed battery charge acceptance.
Therefore, based on the estimation model used in Equation (15), the battery’s expected life was determined to be 8200 cycles (additional 1.1 years, hence, 3.6 years total lifespan) at the actual battery SoC of 96%.

5. Conclusions

Two case studies are conducted, including a sole battery and a hybrid LAB and supercapacitor for a typical TV application. In case study one, the study evaluates diverse battery sizes from 40 to 75 Ah to assess their influence on the development of the management approach. The results show that the sole battery is not appropriate and cannot serve a specific automobile application. Hereafter, the single battery application result indicates that its lifetime can be expressively affected because the output potential of the battery response stands under the desired potential of 12 volts, which is an outcome of under-charging. This under-charging phenomenon can harm the battery life because of sulphation. Sulphation grounds a battery (especially LABs) to accumulate a greater sulphuric-acid concentration, located beneath the lively battery solid. Henceforth, the sulphuric-acid dispersal in the interior of the operated battery stays conceded. The charging/discharging process negatively and strongly impacts LAB’s lifetime.
Case study two presents a hybrid LAB and supercapacitor using a fully active-parallel topology approach consisting of power electronic DC-to-DC converters. This scheme allows easy development of charging/discharging procedure for LAB through the power electronic converter. The results showed that maintaining the SoC of the battery higher than 50% could undoubtedly raise the battery lifetime. The system utilises a cascaded PID algorithm to control the DC/DC converters for the hybrid LAB and supercapacitor DC/DC to address the study hypotheses fully. The cascaded PID algorithm allows an effective energy share between energy sources to reduce the stress on the battery, thus allowing the supercapacitor to absorb high peak current values. PID regulators are suitable because they do not need complex behavioural studies and are practically applicable. Therefore, by ensuring appropriate control and maintaining the battery SoC at the statistical limits of 90%–96%, the battery lifespan is increased to 8200 cycles. Moreover, the battery’s voltage needs to be maintained at 12 V simultaneously, as described in the work of [22]. The study uses a Matlab/Simulink simulation software tool platform to produce these results. Based on the results, a typical automobile can use a hybrid LAB and supercapacitor integrated through a DC-to-DC converter to ease energy control and management. LAB lifetime could increase when combined with a supercapacitor, while the fully active topology approach control energy sharing. Furthermore, maintaining a low LAB’s dynamic charge acceptance allows all the peak current from the load to be transferred to the supercapacitor and, hence, decreases battery stress. Reduction in these high current peaks to the battery reduces battery stress, and as a result, it improves the battery’s lifespan.
In the future, it will be in a thrilling position to supplement this study by evaluating the mature progression of lead-acid batteries while operated by transport vehicles. Implementing an investigational approach to authenticate the system’s performance for use in modern transport vehicles will be highly required. It further recommends that a cost study be needed to further this research to evaluate the overall price of vehicle proprietorship to customers for a long time. Moreover, the study will investigate the hybrid system under very harsh conditions (i.e., −150 to +150 °C) in the future.

Author Contributions

Conceptualisation, M.J.L., S.P.D.C. and T.O.O.; methodology, M.J.L., S.P.D.C. and T.O.O.; software, M.J.L., S.P.D.C. and T.O.O.; validation, M.J.L., S.P.D.C. and T.O.O.; formal analysis, M.J.L., S.P.D.C. and T.O.O.; investigation, M.J.L.; resources, M.J.L. and S.P.D.C.; data curation, M.J.L., S.P.D.C. and T.O.O.; writing—original draft preparation, M.J.L.; writing—review and editing, M.J.L., S.P.D.C. and T.O.O.; visualisation, M.J.L., S.P.D.C. and T.O.O.; project administration, M.J.L. All authors have read and agreed to the published version of the manuscript.

Funding

This research received no external funding.

Data Availability Statement

Not applicable.

Acknowledgments

Manuscript writers take this opportunity to grant the Tshwane University of Technology and battery manufacturing organisation “Auto-X”, South Africa, for affording us the essential study structure to perform this exploration.

Conflicts of Interest

The authors declare no conflict of interest.

Glossary

AAmperes
ACAlternating Current
AhAmpere-hours
BEVBattery Electric Vehicle
BMSBattery Management System
CACharge Acceptance
DCDirect-Current
DC/DCDirect-Current/Direct-Current
DCADynamic Charge Acceptance
ESSEnergy Storage System
FFarad
FOPIDFractional Order Proportional Integrate-Derivative
FPGAField-Programmable Generic Array
HEVThe Hybrid Electric Vehicle
ICEThe Internal Combustion Engine
ICEEThe Internal Combustion Engine Energy
LALead-Acid
LAB/sLead-Acid Battery/ies
MATLAB/SimulinkMathematical Laboratory/Simulation-link
PHEVA Plug-in Hybrid Electric Vehicle
PIDProportional-Integrate-Derivative
PSoCThe Partial State-of-Charge
PWMPulse width modulation
SoCState-of-Charge
TV/sTransport Vehicle/s
USAThe United States of America
DControl Duty Cycle
E m Battery Voltage
E m 0 Battery open-circuit voltage
K E Electronic constant
M j PID control compensation factor
i m a x , i Maximum battery charge current
i m i n , i Minimum battery charge current
v m a x , i Maximum battery voltage response
v m i n , i Minimum battery voltage response
i b a t t Current flowing into the battery
Q b a t t Actual battery charge
Q s Battery stored charge
i c Battery charging current
S o C State-of-Charge
i d c The total ampere flows through a supercapacitor
i R 2 C 1 Amperes going through R 2 C 1 branch in the equivalent circuit of supercapacitor
V d c Supercapacitor voltage/Converter input voltage
V o u t Converter output voltage
t o n Converter switching-on time
T The temperature in °C
v R 2 C 1 Voltage across R 2 C 1 branch of the supercapacitor
R p The proportional term
R i The integrate the term
R p j The derivative term
δ The compensation tuning factor
R 0 Battery internal resistance

References

  1. Lencwe, M.J.; Chowdhury, S.D.; Olwal, T.O. Towards performance enhancement of lead-acid battery for modern transport vehicles. In Proceedings of the 2020 IEEE PES/IAS PowerAfrica, Nairobi, Kenya, 25–28 August 2020; pp. 1–5. [Google Scholar]
  2. Kurzweil, P.; Garche, J. 2-Overview of batteries for future automobiles. In Lead-Acid Batteries for Future Automobiles; Garche, J., Karden, E., Moseley, P.T., Rand, D.A.J., Eds.; Elsevier: Amsterdam, The Netherlands, 2017; pp. 27–96. ISBN 978-0-444-63700-0. [Google Scholar]
  3. Ariza Chacón, H.E.; Banguero, E.; Correcher, A.; Pérez-Navarro, Á.; Morant, F. Modelling, parameter identification, and experimental validation of a lead acid battery bank using evolutionary algorithms. Energies 2018, 11, 2361. [Google Scholar] [CrossRef]
  4. Cheng, C.-S.; Lau, R.W.-H.; Rathi, N.K.; Chung, H.S.-H. Extraction of intrinsic parameters of lead–acid batteries using energy recycling technique. IEEE Trans. Power Electron. 2019, 34, 4765–4779. [Google Scholar] [CrossRef]
  5. Garche, J.; Karden, E.; Moseley, P.T.; Rand, D.A.J. Lead-Acid Batteries for Future Automobiles; Elsevier: Amsterdam, The Netherlands, 2017; ISBN 978-0-444-63703-1. [Google Scholar]
  6. Badeda, J.; Huck, M.; Sauer, D.U.; Kabzinski, J.; Wirth, J. 16-Basics of lead-acid battery modelling and simulation. In Lead-Acid Batteries for Future Automobiles; Garche, J., Karden, E., Moseley, P.T., Rand, D.A.J., Eds.; Elsevier: Amsterdam, The Netherlands, 2017; pp. 463–507. ISBN 978-0-444-63700-0. [Google Scholar]
  7. Singh, A.; Karandikar, P.B.; Kulkarni, N.R. Mitigation of sulfation in lead acid battery towards life time extension using ultra capacitor in hybrid electric vehicle. J. Energy Storage 2021, 34, 102219. [Google Scholar] [CrossRef]
  8. Ibrahim, N.M.P.A.; Rahman, R.A.M.M.; Yassin, A.M.E.A.; Aziz, M.H. Parameters observation of restoration capacity of industrial lead acid battery using high current pulses. Int. J. Power Electron. Drive Syst. 2020, 11, 1596–1602. [Google Scholar] [CrossRef]
  9. Kwiecien, M.; Badeda, J.; Huck, M.; Komut, K.; Duman, D.; Sauer, D.U. Determination of SoH of lead-acid batteries by electrochemical impedance spectroscopy. Appl. Sci. 2018, 8, 873. [Google Scholar] [CrossRef]
  10. Yang, S.; Li, R.; Cai, X.; Xue, K.; Yang, B.; Hu, X.; Dai, C. Enhanced cycle performance and lifetime estimation of lead-acid batteries. New J. Chem. 2018, 42, 8900–8904. [Google Scholar] [CrossRef]
  11. Mekonnen, Y.; Aburbu, H.; Sarwat, A. Life cycle prediction of sealed lead acid batteries based on a weibull model. J. Energy Storage 2018, 18, 467–475. [Google Scholar] [CrossRef]
  12. Kumar, B.; Khare, N.; Chaturvedi, P.K. Advanced Battery Management System Using MATLAB/Simulink. In Proceedings of the 2015 IEEE International Telecommunications Energy Conference (IN℡EC), Osaka, Japan, 18–22 October 2015; pp. 1–6. [Google Scholar]
  13. Mahmoudzadeh Andwari, A.; Pesiridis, A.; Rajoo, S.; Martinez-Botas, R.; Esfahanian, V. A Review of battery electric vehicle technology and readiness levels. Renew. Sustain. Energy Rev. 2017, 78, 414–430. [Google Scholar] [CrossRef]
  14. Manzetti, S.; Mariasiu, F. Electric vehicle battery technologies: From present state to future systems. Renew. Sustain. Energy Rev. 2015, 51, 1004–1012. [Google Scholar] [CrossRef]
  15. Ogura, K.; Kolhe, M.L. 4-Battery technologies for electric vehicles. In Electric Vehicles: Prospects and Challenges; Muneer, T., Kolhe, M.L., Doyle, A., Eds.; Elsevier: Amsterdam, The Netherlands, 2017; pp. 139–167. ISBN 978-0-12-803021-9. [Google Scholar]
  16. Rabalais, A. Drive down to electric avenue: Taking electric vehicle incentives higher. LSU J. Energy Law Resour. 2017, 5, 427. [Google Scholar]
  17. Albers, J.; Meissner, E. 6-Automotive absorptive glass-mat lead-acid batteries: State of the art. In Lead-Acid Batteries for Future Automobiles; Garche, J., Karden, E., Moseley, P.T., Rand, D.A.J., Eds.; Elsevier: Amsterdam, The Netherlands, 2017; pp. 185–211. ISBN 978-0-444-63700-0. [Google Scholar]
  18. Farjah, A.; Ghanbari, T.; Seifi, A.R. Contribution management of lead-acid battery, li-ion battery, and supercapacitor to handle different functions in EVs. Int. Trans. Electr. Energy Syst. 2020, 30, e12155. [Google Scholar] [CrossRef]
  19. Jankowska, E.; Kopciuch, K.; Błażejczak, M.; Majchrzycki, W.; Piórkowski, P.; Chmielewski, A.; Bogdziński, K. Hybrid Energy Storage Based on Ultracapacitor and Lead Acid Battery: Case Study. In Proceedings of the Automation 2018, Warsaw, Poland, 21–23 March 2018; Springer: Cham, Switzerland, 2018; pp. 339–349. [Google Scholar]
  20. Smith, M.J.; Gladwin, D.T.; Stone, D.A. An analysis of the influence of high-frequency ripple currents on dynamic charge acceptance in lead-acid batteries. J. Energy Storage 2019, 22, 27–35. [Google Scholar] [CrossRef]
  21. Lencwe, M.J.; Chowdhury, S.P.D.; Olwal, T.O. Performance Studies of Lead Acid Batteries for Transport Vehicles. In Proceedings of the 2017 IEEE PES PowerAfrica, Accra, Ghana, 27–30 June 2017; pp. 528–532. [Google Scholar]
  22. Lencwe, M.J.; Chowdhury, S.P.; Olwal, T.O. A multi-stage approach to a hybrid lead acid battery and supercapacitor system for transport vehicles. Energies 2018, 11, 2888. [Google Scholar] [CrossRef]
  23. Kumar, B.; Khare, N.; Chaturvedi, P.K. FPGA-based design of advanced BMS implementing SoC/SoH estimators. Microelectron. Reliab. 2018, 84, 66–74. [Google Scholar] [CrossRef]
  24. Hannan, M.A.; Hoque, M.M.; Mohamed, A.; Ayob, A. Review of energy storage systems for electric vehicle applications: Issues and challenges. Renew. Sustain. Energy Rev. 2017, 69, 771–789. [Google Scholar] [CrossRef]
  25. Sreedhar, S.; Siegel, J.B.; Choi, S. Topology Comparison for 48V Battery-Supercapacitor Hybrid Energy Storage System. IFAC-Pap. 2017, 50, 4733–4738. [Google Scholar] [CrossRef]
  26. Song, Z.; Hou, J.; Hofmann, H.; Li, J.; Ouyang, M. Sliding-mode and lyapunov function-based control for battery/supercapacitor hybrid energy storage system used in electric vehicles. Energy 2017, 122, 601–612. [Google Scholar] [CrossRef]
  27. Bai, Z.; Yan, Z.; Wu, X.; Xu, J.; Cao, B.H. Control for battery/supercapacitor hybrid energy storage system used in electric vehicles. Int. J. Automot. Technol. 2019, 20, 1287–1296. [Google Scholar] [CrossRef]
  28. Ferg, E.E.; Mgangato, S. The performance of Pb-acid cells linked to supercapacitors under partial state of capacity cycling onditions. J. Energy Storage 2017, 14, 49–55. [Google Scholar] [CrossRef]
  29. Benabdelaziz, K.; Maaroufi, M. Battery dynamic energy model for use in electric vehicle simulation. Int. J. Hydrog. Energy 2017, 42, 19496–19503. [Google Scholar] [CrossRef]
  30. Fiorenti, S.; Guanetti, J.; Onori, S.; Guezennec, Y.; Madella, N.; Saletti, A.; Bovo, S. Modeling and experimental validation of PbA battery-supercapacitor energy storage system. In Proceedings of the 7th IFAC Symposium on Advances in Automotive Control, Tokyo, Japan, 4–7 September 2013; Volume 46, pp. 307–312. [Google Scholar] [CrossRef]
  31. Dos Santos, E.; da Silva, E.R. Control Strategies for Power Converters. In Advanced Power Electronics Converters: PWM Converters Processing AC Voltages; IEEE: Piscataway, NJ, USA, 2014; pp. 264–294. ISBN 978-1-118-96822-2. [Google Scholar]
  32. Daowd, M.; Omar, N.; Van Den Bossche, P.; Van Mierlo, J. Passive and active battery balancing comparison based on MATLAB simulation. In Proceedings of the 2011 IEEE Vehicle Power and Propulsion Conference, Chicago, IL, USA, 6–9 September 2011; pp. 1–7. [Google Scholar]
  33. Seim, L.H. Modeling, Control and Experimental Testing of a Supercapacitor/Battery Hybrid System: Passive and Semi-Active Topologies. Master’s Thesis, Nowergian University of Life Sciences, As, Norway, 2012; pp. 1–133. [Google Scholar]
  34. Bopche, L.M.; Deosant, A.A.; Ahmad, M. Combination of Parallel Connected Supercapacitor Amp; Amp; Battery for Enhancing Battery Life. In Proceedings of the 2016 International Conference on Automatic Control and Dynamic Optimization Techniques (ICACDOT), Pune, India, 9–10 September 2016; pp. 77–82. [Google Scholar]
Figure 1. (a) Passive-parallel topology for hybrid systems, (b) LAB connected-converter parallel topology for hybrid systems, (c) fully connected-parallel topology for hybrid systems, and (d) supercapacitor semi-connected topology for hybrid systems [26,27,28].
Sustainability 13 13971 g001
Figure 2. Equivalent circuit model of LAB.
Sustainability 13 13971 g002
Figure 3. LAB charge and discharge featured signals during testing. Courtesy: Lencwe et al. [1].
Sustainability 13 13971 g003
Figure 4. Second-order supercapacitor electrical equivalent circuit model.
Sustainability 13 13971 g004
Figure 5. An electrical equivalent circuit model of a bump-up DC-to-DC converter.
Sustainability 13 13971 g005
Figure 6. An electrical equivalent circuit model of a step-up/step-down DC-to-DC converter for a supercapacitor.
Sustainability 13 13971 g006
Figure 7. The overall schematic structure of hybrid LAB-supercapacitor.
Sustainability 13 13971 g007
Figure 8. Lead-acid battery performance analysis for a 40 Ah. Courtesy: Lencwe et al. [1].
Sustainability 13 13971 g008
Figure 9. Lead-acid battery performance for 45 Ah capacity. Courtesy: Lencwe et al. [1].
Sustainability 13 13971 g009
Figure 10. Lead-acid battery performance analysis using 50 Ah capacity. Courtesy: Lencwe et al. [1].
Sustainability 13 13971 g010
Figure 11. A 55 Ah lead-acid battery evaluation. Courtesy: Lencwe et al. [1].
Sustainability 13 13971 g011
Figure 12. Performance analysis of a 60 Ah LAB capacity.
Sustainability 13 13971 g012
Figure 13. A 65 Ah lead-acid battery under test.
Sustainability 13 13971 g013
Figure 14. A 70 Ah LAB capacity performance evaluation.
Sustainability 13 13971 g014
Figure 15. A 75 Ah lead-acid battery performance evaluation.
Sustainability 13 13971 g015
Figure 16. Diverse responses of battery potential using 500 F capacitance.
Sustainability 13 13971 g016
Figure 17. The voltage response of the supercapacitor.
Sustainability 13 13971 g017
Figure 18. The battery output current-amperes for diverse battery sizes.
Sustainability 13 13971 g018
Figure 19. The current-amperes of the supercapacitor with diverse battery capacities.
Sustainability 13 13971 g019
Figure 20. The delivered power of the battery against the needed energy for a typical TV.
Sustainability 13 13971 g020
Figure 21. The delivered supercapacitor power with diverse capacities of batteries.
Sustainability 13 13971 g021
Figure 22. Battery SoC for different battery capacities.
Sustainability 13 13971 g022
Figure 23. LAB (75 Ah) and supercapacitor (500 F) voltage response against DC bus voltage [22].
Sustainability 13 13971 g023
Figure 24. The SoC performance of a lead-acid battery and a supercapacitor [22].
Sustainability 13 13971 g024
Figure 25. Battery expected life before failure.
Sustainability 13 13971 g025
Table 1. Summary of the advantages and disadvantages for different LABs used in the automobile industry [17].
LABsProsCons
Flooded/Vented It does not require additional water.
There is no acid leakage.
There are no insignificant acid smokes.
Simple for carriage.
It does not require special airing.
Horizontal placement is possible.
Staking on top of each other is feasible.
It has a small phenomenon of acid stratification.
At 25 °C, it needs fewer overcharges.
Virtuous capability for high-rate discharge.
Cautious charging is required.
Careful temperature supervision is needed.
It has enormous top-of-charge voltage variations.
At high temperatures, it needs amplified over-charge.
Poorer lifecycle at deep discharge.
Explicit enormity is not measured.
Unreachable dry-charge state.
Shelf life is two years.
AGM and Gel Provide compact cyclical damage.
Oxygen re-mixture conquers hydrogen re-mixture.
There is no acid leakage.
No water loss.
It is vigorous.
It has lessened operational volume.
It releases gases.
It cannot withstand rapid charging.
Table 2. Mean results of a 12 V LAB, 70 Ah capacity with 100% initial SoC.
Supercap. Capacitance (F)LAB Current (A)LAB Power (W)LAB_SOC (%)LAB Voltage (V)SC Current (A)SC_SOC (%)SC Voltage (V)SC Power (W)
5057.0209685.942198.056211.92521.75605.23611.06648.5347
10054.9272681.282398.091211.91944.678314.89882.256629.0278
15056.9789728.335597.959311.91307.850819.39162.795451.7433
20057.3473753.934698.002211.912010.633428.72864.016373.0338
25058.0500783.655197.960011.910513.452834.64464.822794.4330
30057.7716802.597397.976711.910815.979642.42625.8717116.6760
35056.7324811.384897.992811.912617.769549.47596.8000137.7858
40058.6096857.310297.959711.909120.230453.81757.3648161.4549
45055.9299828.665197.943111.911020.002459.39988.0830164.8698
50056.1081842.843697.931011.910520.782662.63878.4954176.9535
55055.4630850.463097.925211.911621.536966.76989.0169191.8746
60056.318877.016398.120111.912921.381874.40379.9738205.8309
65056.5564893.368797.928211.909523.054173.63309.8771222.1349
70056.6487906.079198.052611.911522.929178.482810.4829233.6138
75055.6472894.652497.916111.916123.063877.621310.3763234.2114
Publisher’s Note: MDPI stays neutral with regard to jurisdictional claims in published maps and institutional affiliations.

