1. Introduction
Kenya is a water-scarce country with an estimated freshwater supply of 647 cubic meters per capita per year, in contrast to the United Nation’s recommended benchmark of 1000 cubic meters per capita per year. In terms of accessibility to clean water, Kenya ranks as the 21st worst, globally [
1]. Approximately 41% of the Kenyan population does not have access to clean water, which contributes to 10% of deaths. These national figures trickle down to the villages. Therefore, there is a need for an improvement in accessibility to clean water.
The town of Eldoret, the capital of Uasin Gishu County, is in the western part of Kenya. It has a population of about 300,000, with a water demand of approximately 55,000 m
3/day. The Eldoret Water and Sanitation (ELDOWAS) company is the sole supplier of water, with an approximate capacity of 36,400 m
3/day [
1]. The huge gap between demand and supply of clean water has made the commodity scarce and, hence, is a limiting factor towards sustainable development in the region. This situation has been made dire due to the little appreciation and efforts made towards the management of this important resource. ELDOWAS has been continuously poorly funded, hence weakening its capacity, while the population has been continuously ballooning. The result is an inaccessibility to clean water, especially by the residents of the informal settlements in the urban area.
Apart from the current gap between the water required and that supplied, land use, land cover, and climate variability have also impacted the water resources of the region. Forest cover in the catchment has greatly diminished because of human activities, resulting in a change in rainfall–runoff response. The rapid change in land cover of the Kaptagat catchment from natural and planted forests to settlements and small-scale agricultural farms has greatly altered the catchment hydrologic response, as also observed by [
2]. This has resulted in high flows during the wet seasons and extremely low flows during the dry seasons, greatly impacting the water levels of the Elegirini and Two Rivers water storage reservoirs and, hence, inadequate water supply to Eldoret. Furthermore, climate variability, with increased rainfall intensities during the wet seasons—resulting in increased surface runoff—and extremely dry seasons causing low flows, has contributed to change in flow regimes [
3]. While several studies have researched the impact of extreme weather [
4] and watershed disturbance [
5] on catchment hydrologic response, this study does not attempt to separate the two but notes a tendency of increased vegetation cover to offset the effects of climatic variability.
Changes of forest land to agricultural and settlement usage often impact the integrity of the soil, and its nutrients and profile. The results of these changes are alterations in interception, infiltration, evapotranspiration, and groundwater recharge. This, in turn, changes the timing and amount of surface runoff and river flows [
3], as is already being experienced at the Kaptagat catchment [
6], complementing this observation by noting that the clearing of forests for land use that compacts the soil and exposes it to erosion results in decreased infiltration and percolation to groundwater. However, [
7] argues that forest cover reduces baseflow due to increased evapotranspiration because of increasing temperatures and, subsequently, groundwater recharge is reduced.
Groundwater is an important resource throughout rural Kenya, with approximately 80% of the population relying on it as the primary source and, in some cases, as the only source of water. Groundwater has, for a long time, been a reliable source of water, even in arid areas where rivers dry up during the dry seasons. This is because groundwater storage has always been greater than the annual recharge [
6,
8]. In catchments such as Kaptagat forest, with natural springs and river sources, groundwater and streamflow are linked, so that changes impacting the surface flow will have significant consequences on groundwater (and vice versa), changing the hydrologic response of the river and potentially affecting its ecology and the human population depending on it.
The Kaptagat catchment is the source of the Sosiani River. Along the river are two reservoirs, Elegirini and Two Rivers, which are abstraction points for two of the ELDOWAS water supply treatment plants. Over the years, decreasing forest cover has been a major cause of concern, with the government at one point introducing “Nyayo tea zones” along its borders to protect it from encroachment. However, a sizeable portion has been converted to small-scale agricultural farms, settlements, and institutions serving the community. Whereas there have been efforts to restore forest land through afforestation and resettlement programs, the reduction of forest cover continues. Statistics from the Kaptagat forest station indicate that at least 20% of forest land has been encroached upon. Evidence from field visits had the residents suggesting the timing, duration, and overall discharge of the streams in the forest feeding the Sosiani River have changed, and therefore, so has the main river. During the past few years, very low flows have been experienced during the dry season, with the reservoirs recording very low storage levels. The quality of water abstracted from the reservoir deteriorated and the water treatment plant almost shut down, precipitating an acute water shortage in Eldoret in 2017.
This study, therefore, seeks to understand the impact of land-use change and climate variability on the Kaptagat catchment hydrologic response through modeling, using the Soil and Water Assessment Tool (SWAT). SWAT was selected because it has already been applied successfully to various water quality and quantity issues regionally and globally, such as those specified in [
9,
10,
11,
12,
13,
14,
15,
16]. Flexibility is a key strength of SWAT, allowing for the simulation of a wide variety of soil and water conservation practices [
17]. Although there are few long-term datasets for river flows, this study uses the available land use data, rainfall, and temperatures to simulate flows for various scenarios in the catchment and suggests various management measures to improve water yield in the catchment.
2. Materials and Methods
2.1. Study Area
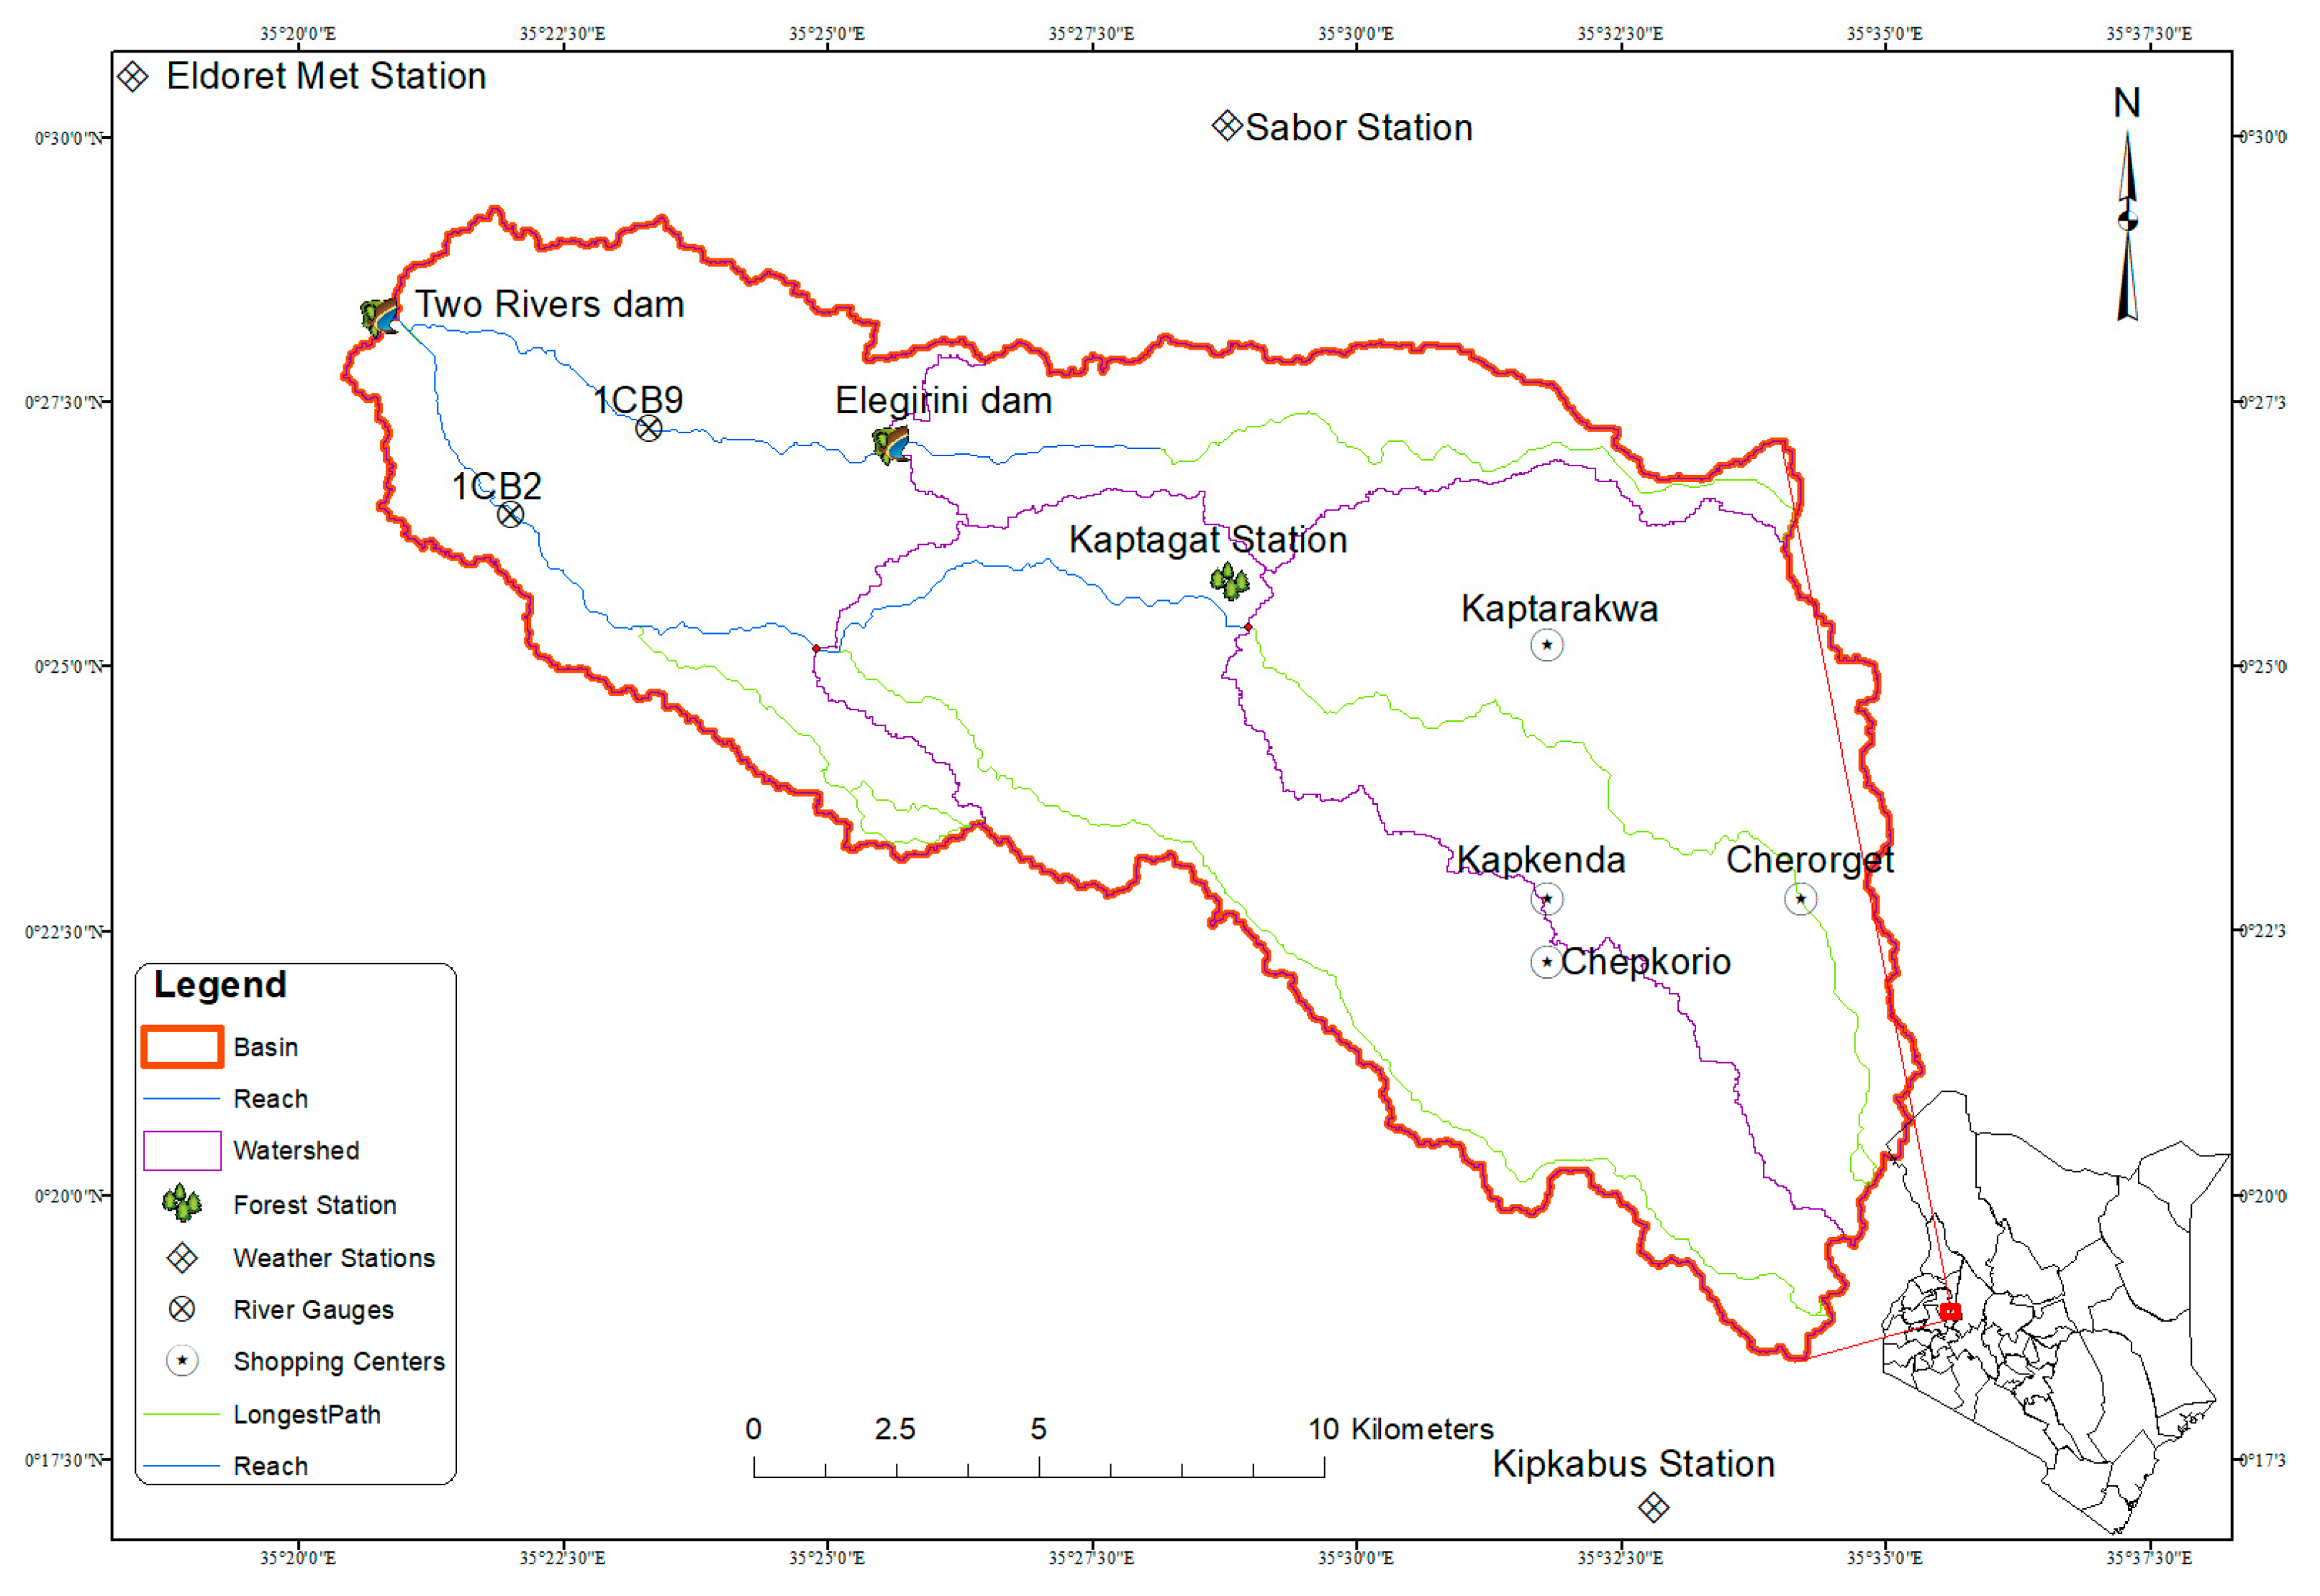
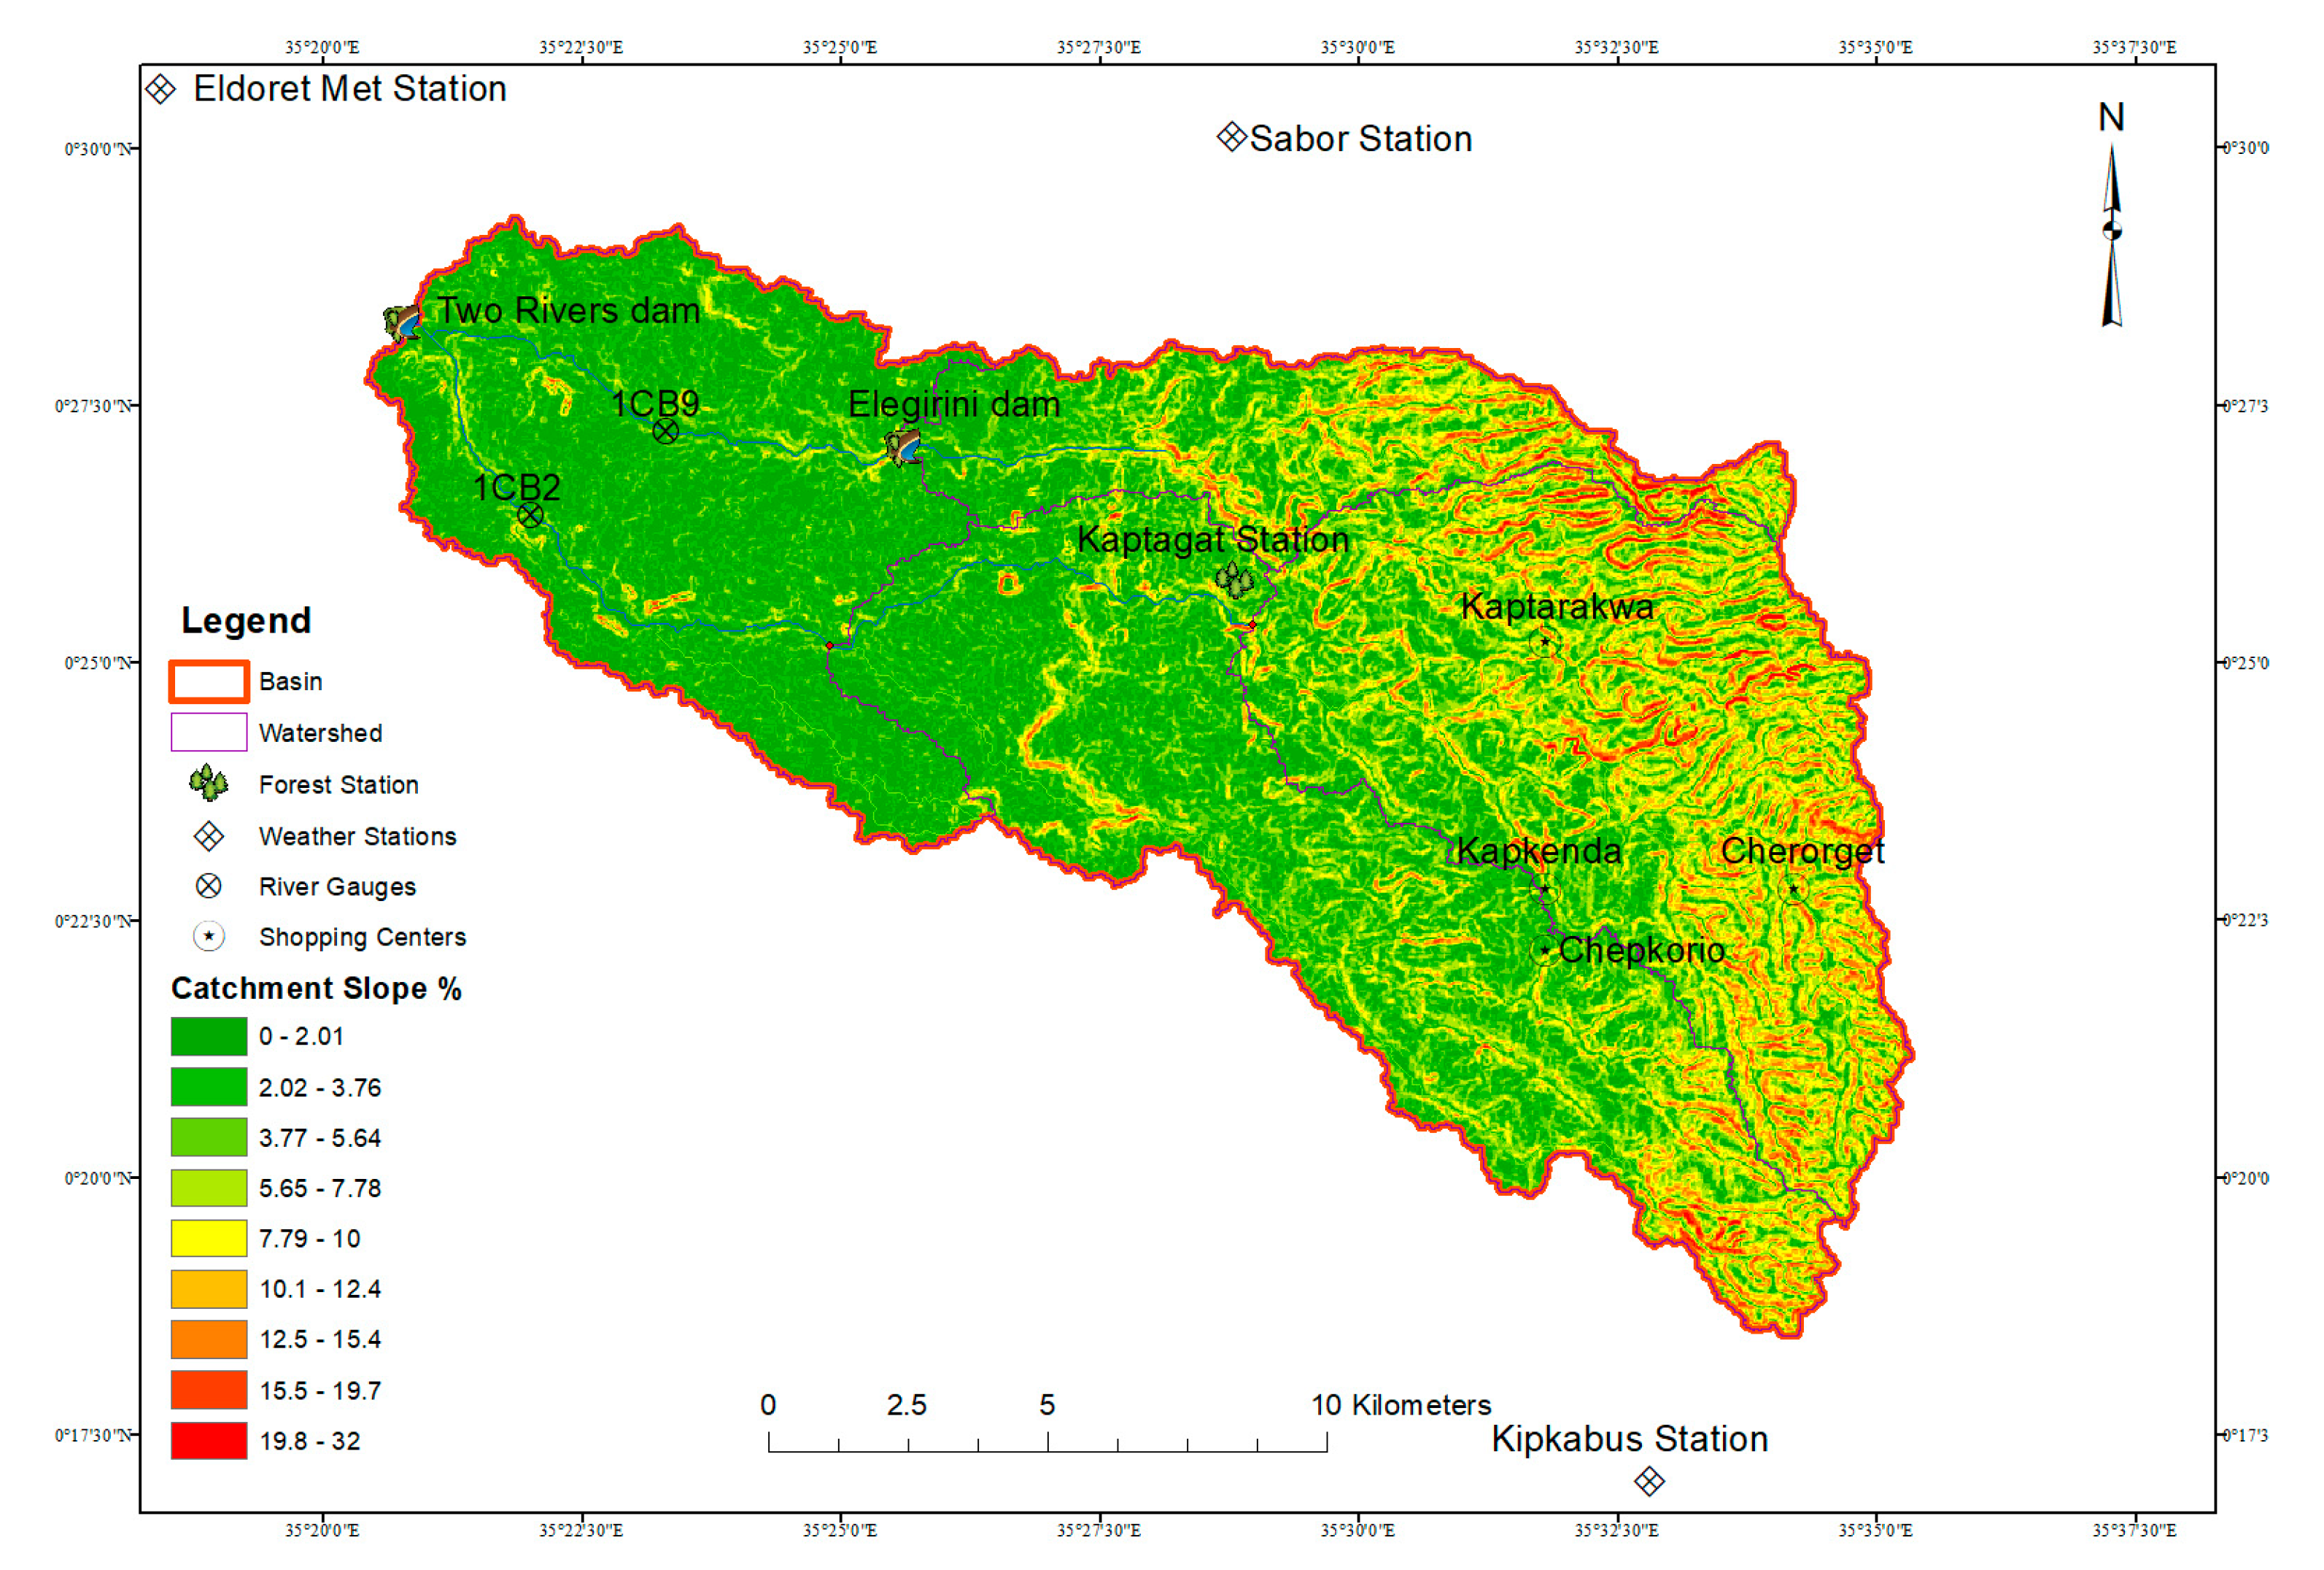
The Kaptagat forest catchment is in the Eastern part of the town of Eldoret. It is the source of the Sosiani River, which is important for supplying water to Eldoret. The river is fed by two main tributaries, the Elegerini and the Endoroto. The Kaptagat catchment lies between latitude 00°17′ N and 00°30′ N and longitude 35°20′ E and 35°37′ E and has an area of about 269 km
2 (
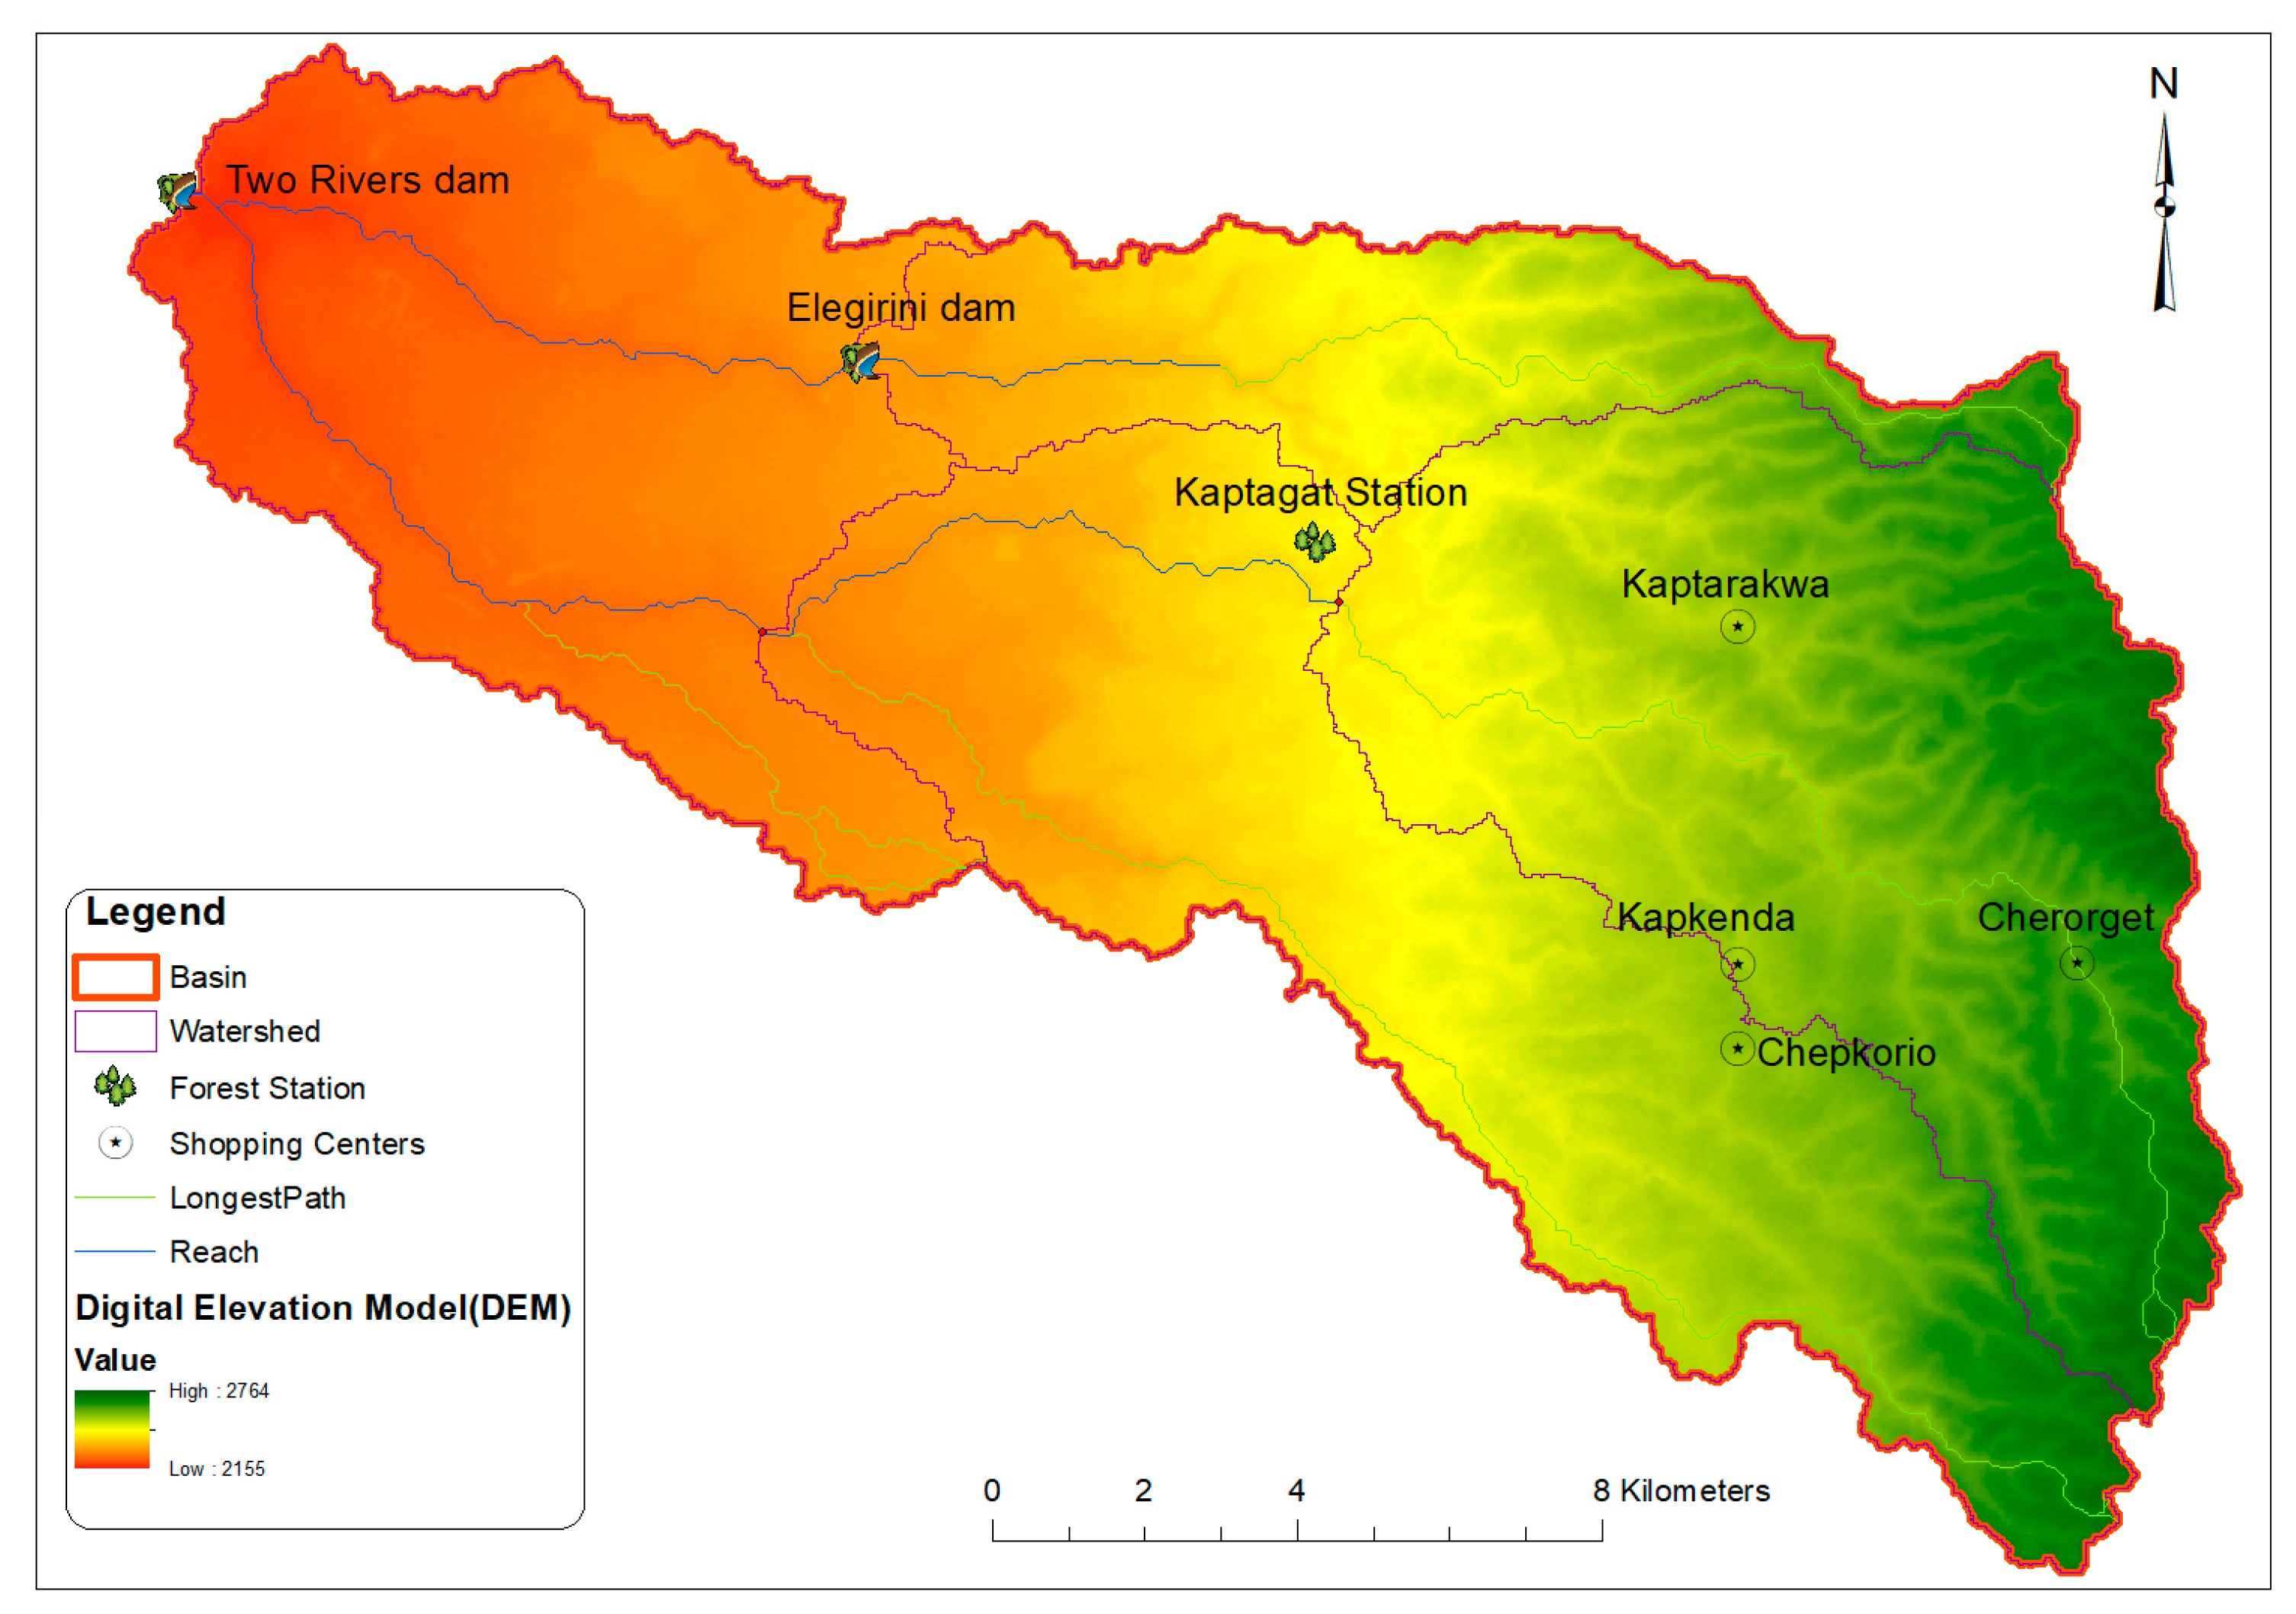
Figure 1). The altitude of the catchment varies between 2600 m and 2184 m above mean sea level (
Figure 2).
The Kaptagat forest catchment receives heavy precipitation in the form of rainfall. The average annual rainfall ranges from 624.9 mm to 1560.4 mm, with two distinct peaks occurring in March–June and August–September; temperatures range between 7 °C and 29 °C [
18]. According to [
18], the catchment has a dominant (60%) land use of farming (both livestock and crop cultivation). Forest covers 30%, and grassland and urban development cover the remaining (10%) sections. The soils comprise loam soils, red clay soils, and brown loam soils which support farming.
Streamflow in the catchment has been changing due to climate variability and land-use change, having significant consequences for the water management of the reservoirs in the catchment [
19]. Environmental factors, such as pollution from agricultural activities and erosion, also influence the quality and quantity of streamflow. To propose adequate management measures to improve the water yield in the catchment, it is important to model the hydrological cycle for the catchment. SWAT has been shown to be a useful tool for achieving this goal from various studies. The SWAT model was set up for the Kaptagat catchment, with 4 subbasins and 32 hydrologic response units and flow simulated for the past 40 years, starting from 1980.
2.2. SWAT Model
The SWAT model is a comprehensive, time-continuous, semi-distributed, process-based model developed by the Agricultural Research Service of the United States Department of Agriculture [
20]. SWAT can model changes in the hydrologic response of the catchment, water quality, and erosion, and is also good at estimating the effects of land use changes and climate variability on a catchment [
21]. The model works by dividing the catchment into subbasins and further into Hydrologic Response Units (HRUs). These subdivisions are characterized by the different combinations of land use, soil characteristics, slope, and the different catchment management practices applied. The SWAT model uses a hydrological cycle based on the water balance approach [
16]. The hydrological cycle is controlled by climatic variables such as rainfall, temperature, wind speed, solar radiation, and relative humidity. SWAT uses daily time series inputs from climatic variables to simulate daily, monthly, and annual catchment hydrologic responses. SWAT documentation gives detailed literature on how the model works [
22].
2.3. Model Setup
ArcSWAT (Arc GIS-SWAT) is the latest available version used as an interface between ArcGIS and the SWAT model. Arc SWAT version 10.5.24, an extension of ArcMap 10.5, was used in this study. Spatial data (Digital Elevation Model (DEM), soil, and land use), used in the processing phase, were fed into the SWAT model through the interface. Soil and land cover made important responding units, which the SWAT model used in subdividing the catchment into HRUs, having unique land use–soil combinations during the process of runoff generation. For the model setup and watershed simulations, SWAT requires an assortment of input data layers. The Digital Elevation Model (DEM) defines the topography of the watershed. It is used to calculate sub-basin parameters, such as slope, and to define the stream network. The soil data define soil characteristics while the land use data provide vegetation information. The climatic data and streamflow data were sourced according to SWAT input requirements.
2.3.1. Digital Elevation Model (DEM)
An ASTERDEM of 30 m resolution was downloaded from the United States Geological Survey (USGS) website, projected, clipped, and used to extract flow direction, flow accumulation, and generation of the stream network. This provided the delineation of the watershed and subbasins, as illustrated in
Figure 2. Topographic parameters, such as terrain slope and channel slope, were also derived from the DEM.
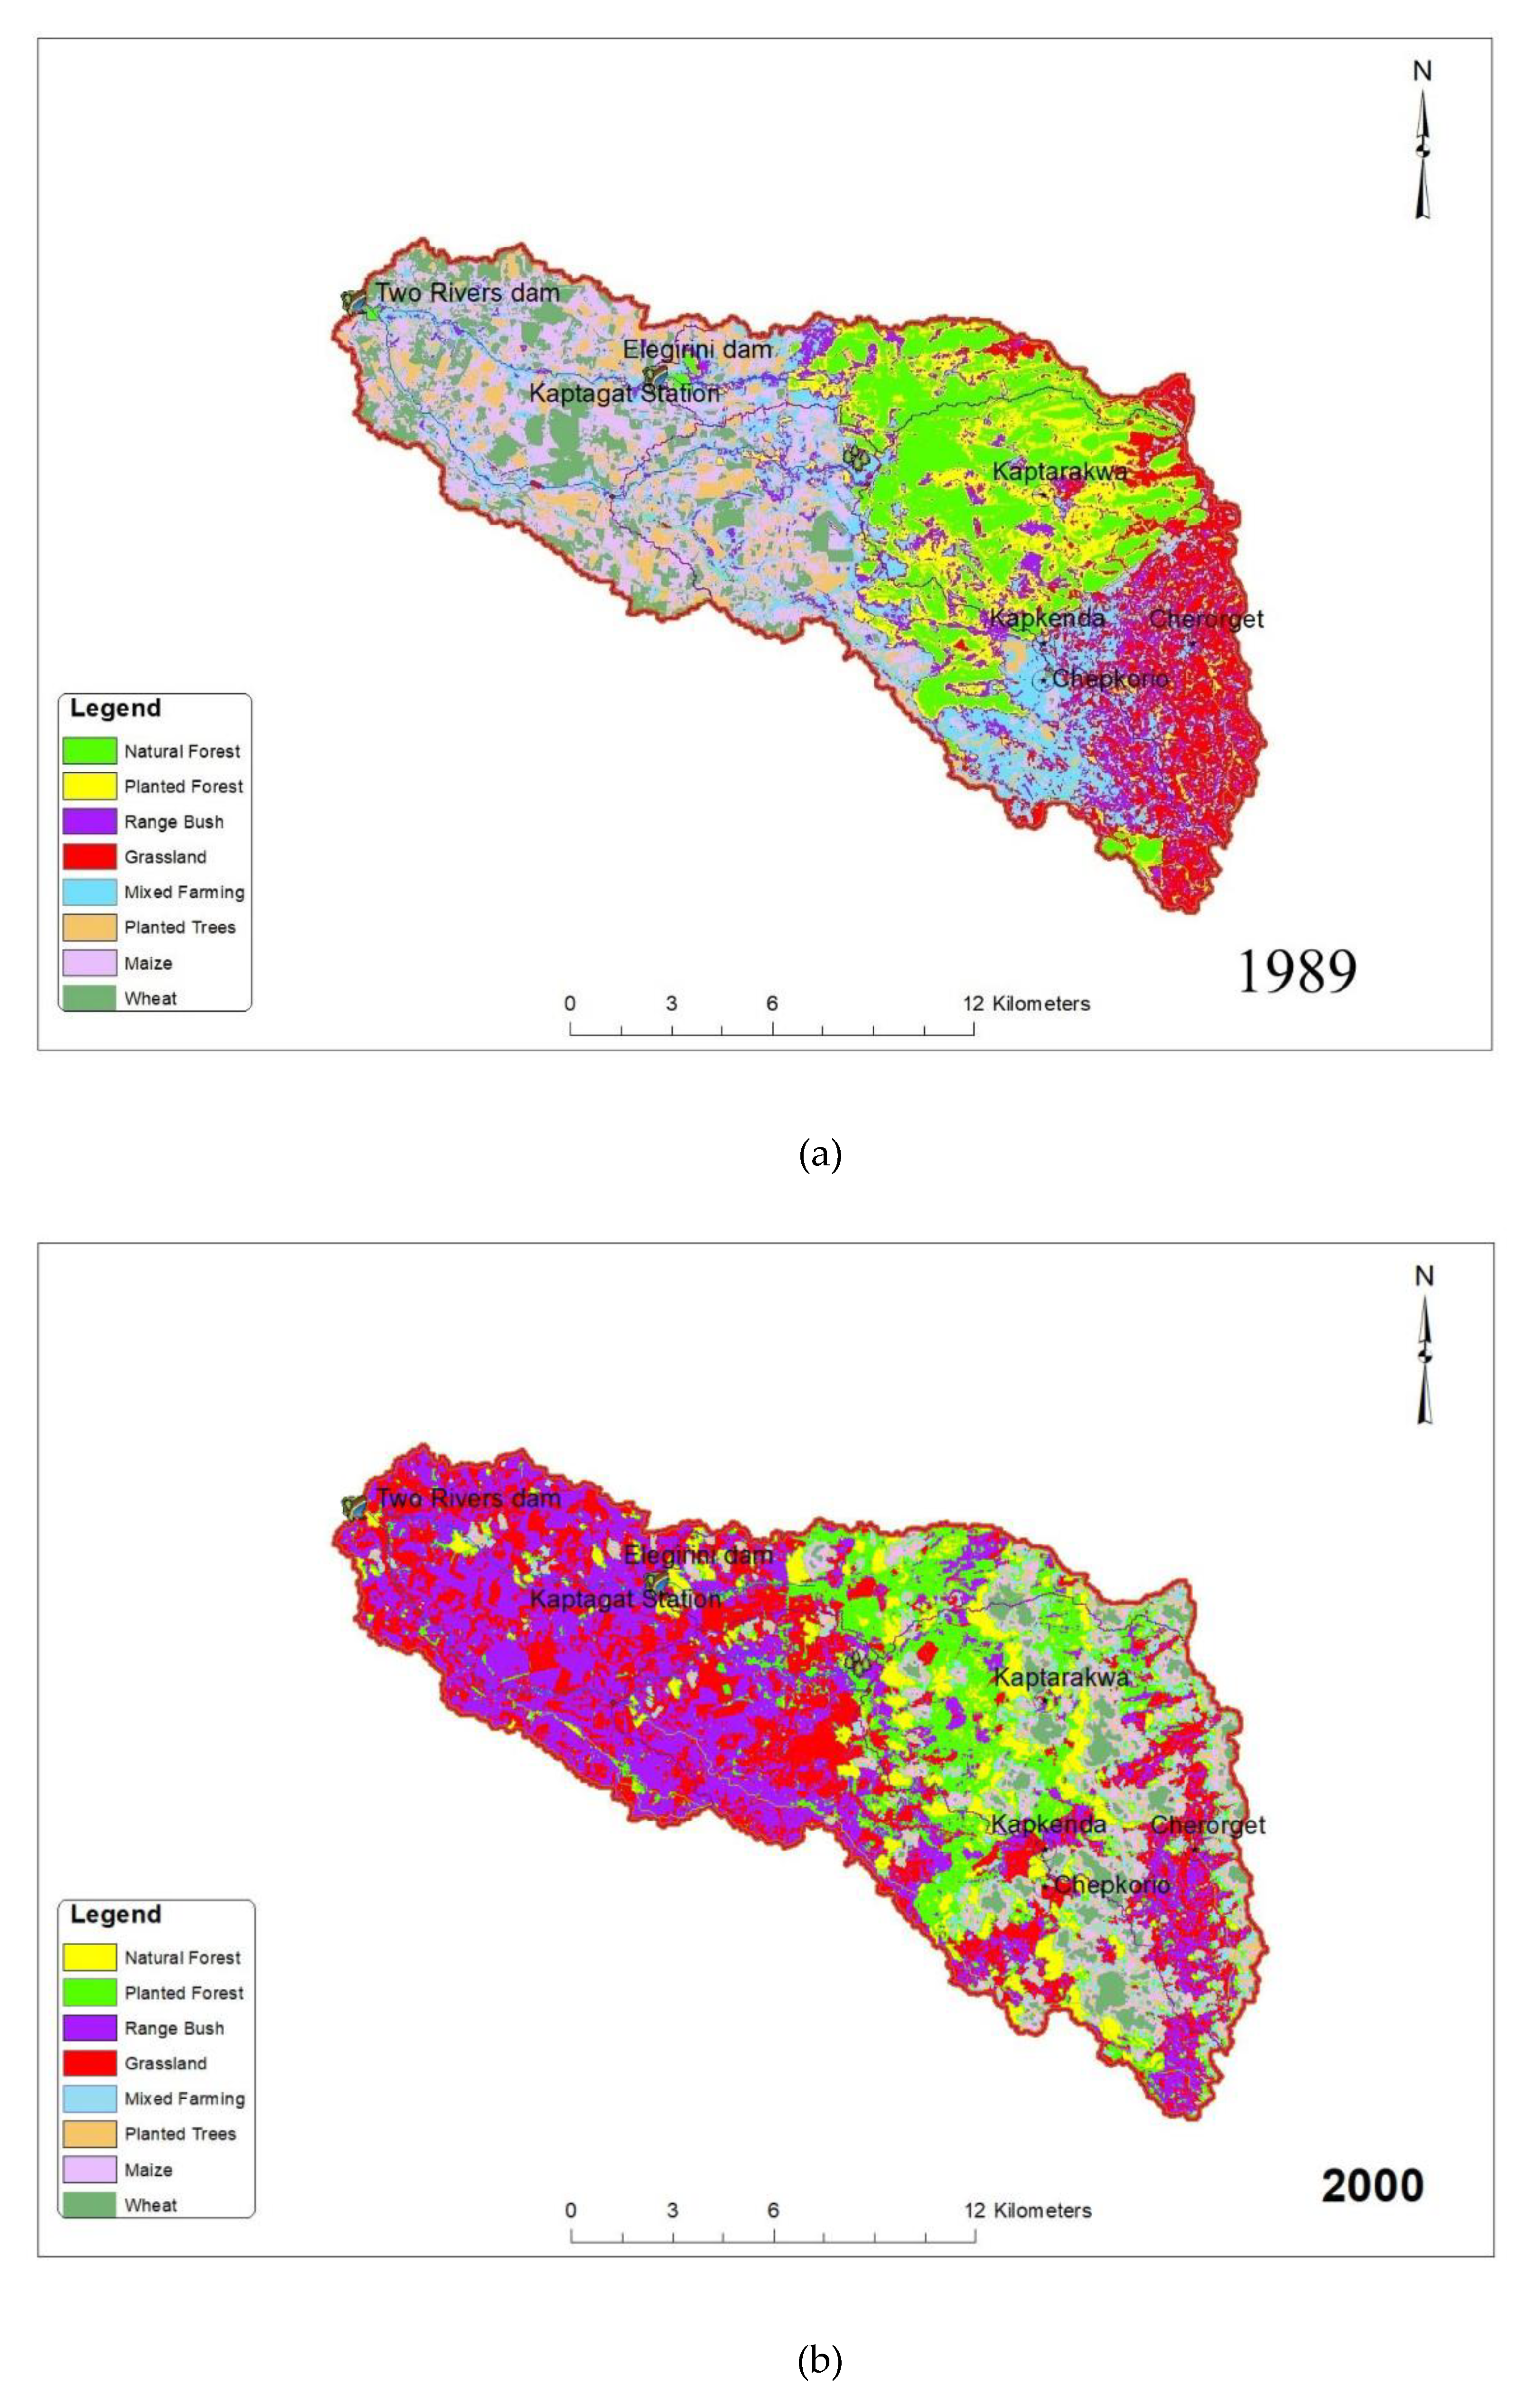
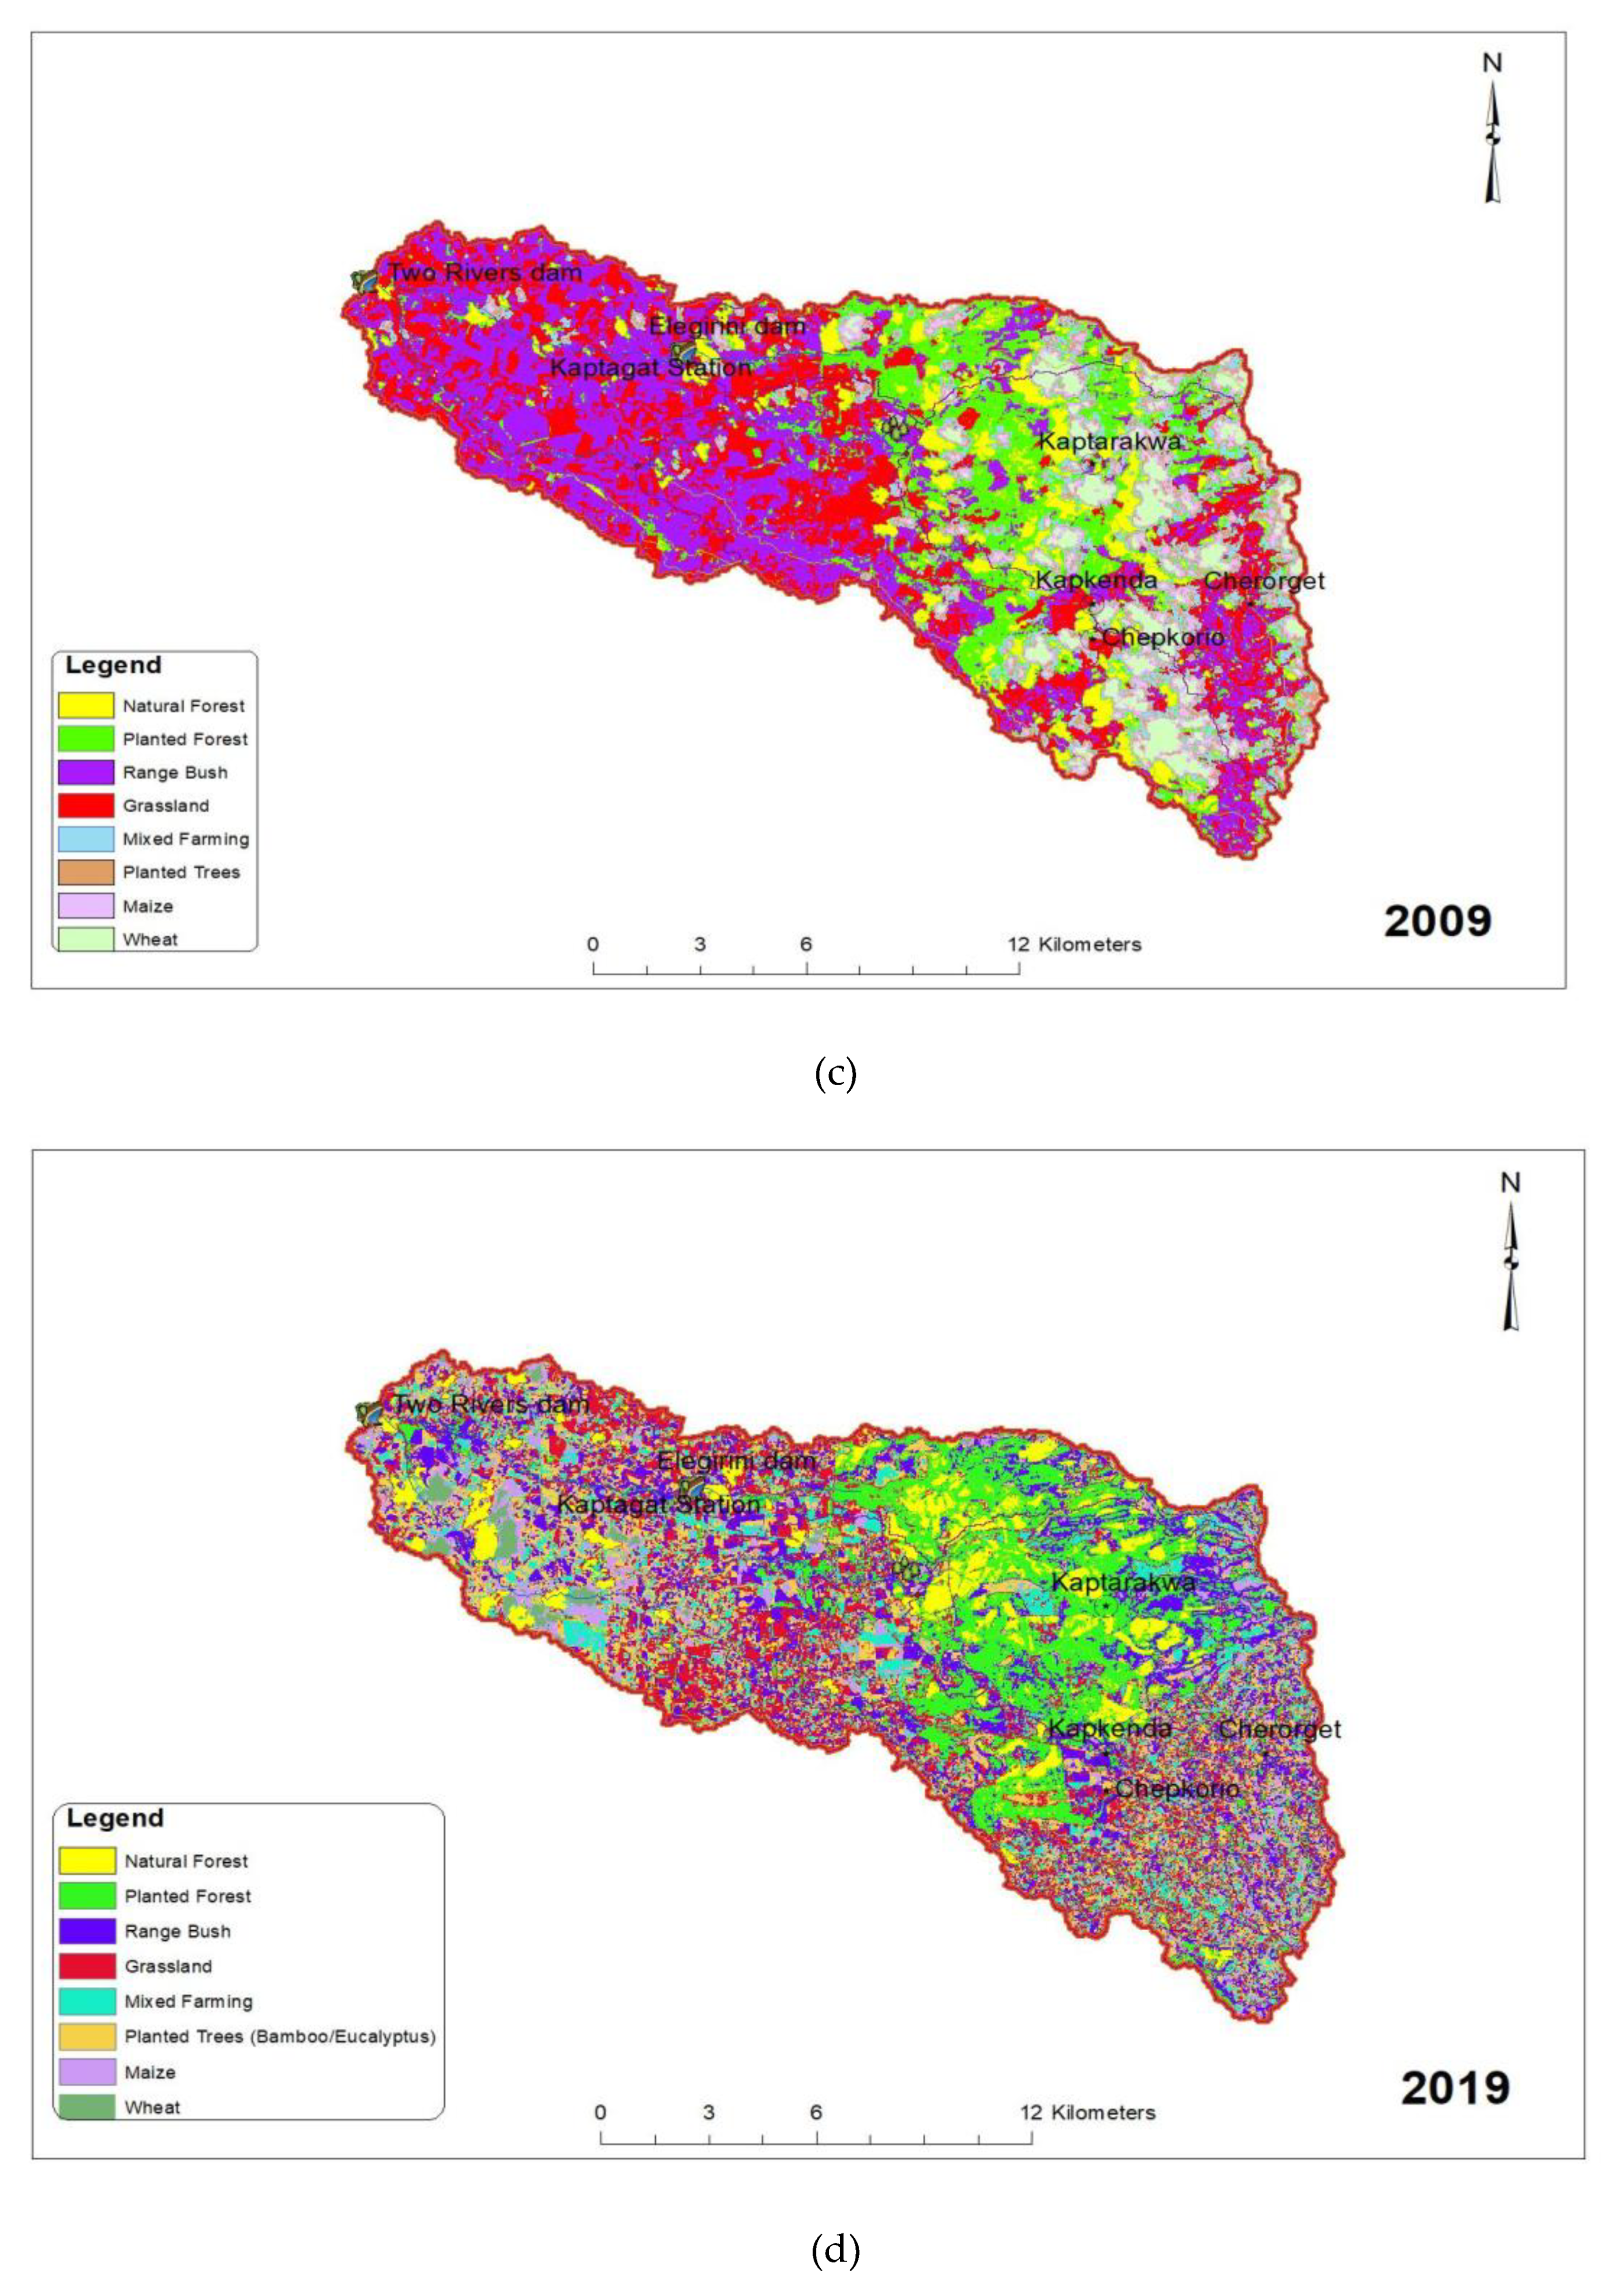
2.3.2. Land Use/Land Cover Maps
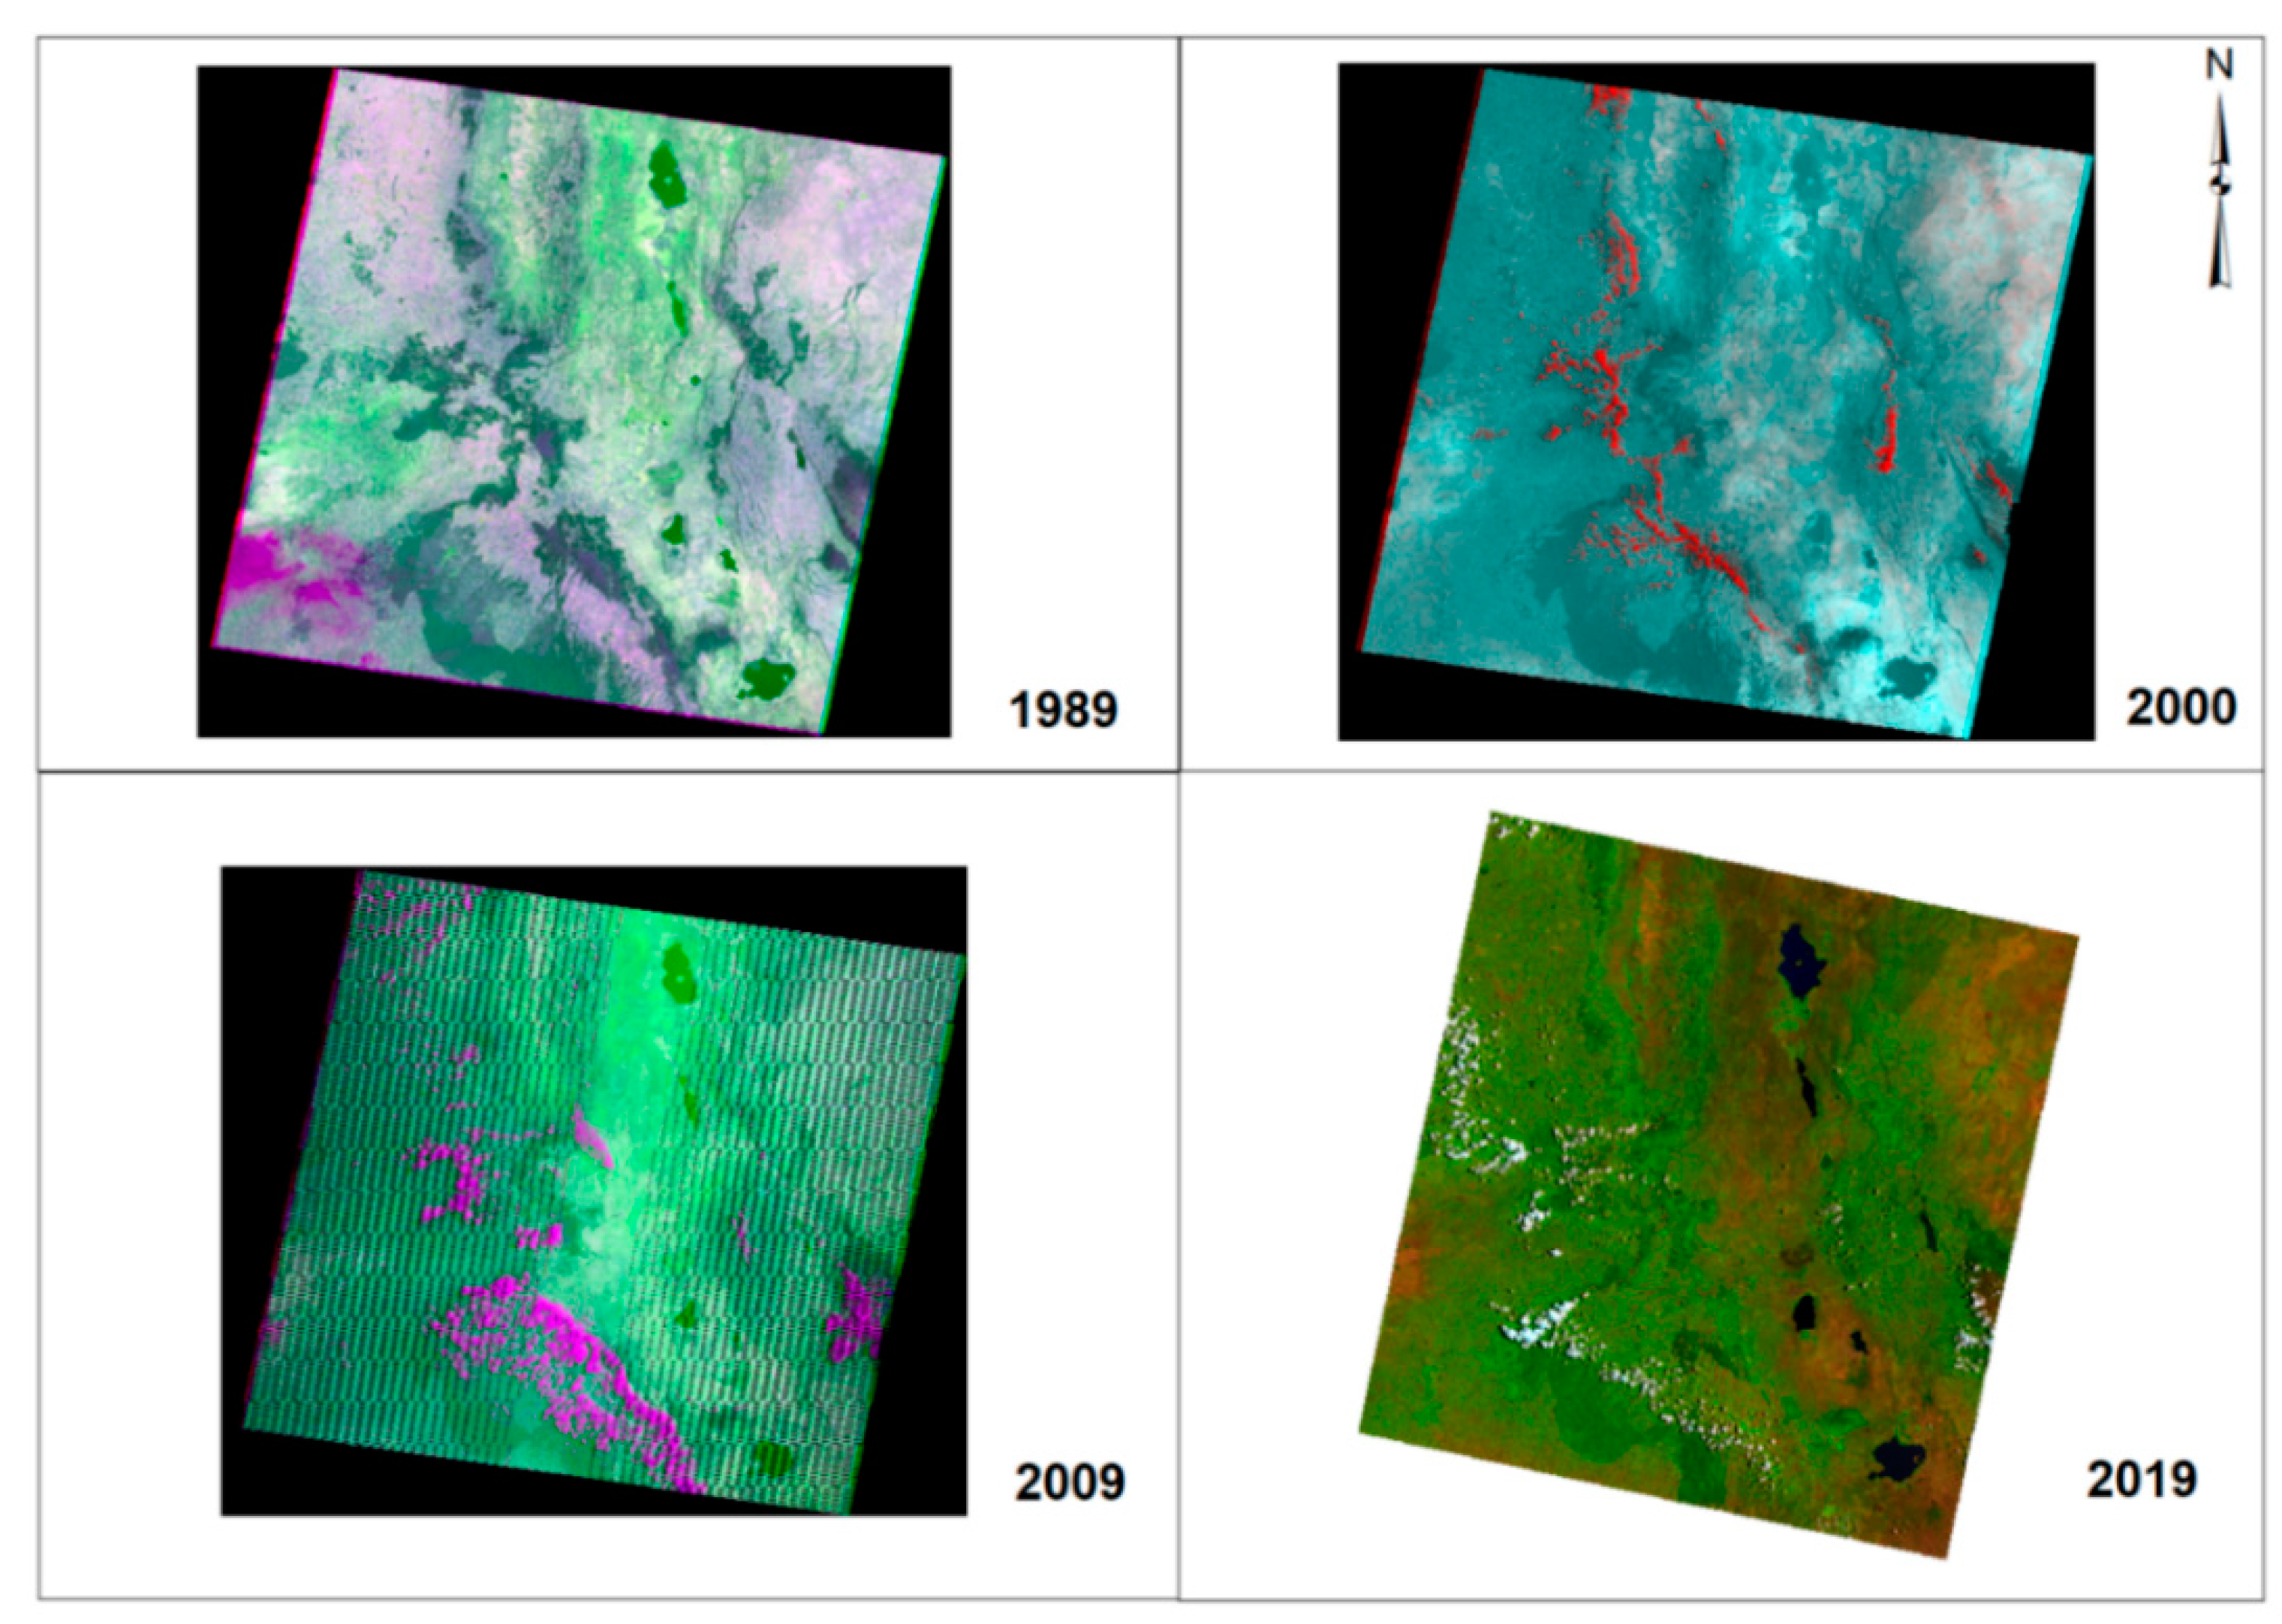
A Sentinel land use map (2016) from the Regional Centre for Mapping and Resources for Development (RCMRD) geoportal and Landsat images (1989, 2000, 2009, and 2019) from the USGS website were downloaded (
Figure 3). The 2016 Sentinel land use map was used in training for the supervised land use classification of the Landsat images. The classified land use images were thereafter projected, clipped, and overlayed on the catchment. Eight main land use categories were identified, and ground-truthing was conducted, resulting in three main classes: agricultural lands, forest, and grassland. Settlements, water, and riverine land cover formed small pockets of land cover in the study area.
2.3.3. Soil Map
A Kensorter soil map was downloaded from the United Nations Food and Agriculture Organization (FAO) website. The map was projected, clipped, and overlayed on the catchment. Three main soils, KE69, KE95, and KE97, were found to be dominant. A database on Microsoft Access was developed to define the soil parameters, such as texture, hydrologic soil group, available water content, soil depth, and so forth, that were necessary to run the SWAT model.
2.3.4. Meteorological Data
Precipitation and temperature data required to run the SWAT were obtained from the Kenya Meteorological Department (KMD), Eldoret. The rainfall observation stations used were the Kaptagat Forest Station, the Sabor Forest Station, the Kipkabus Forest Station, and the Eldoret Meteorological Station (
Figure 1). The daily rainfall data obtained were from the years 1970–2019. Data quality analysis (gross error checking, tolerance tests, and an internal consistency test) was performed, expunging anomalous values, and identifying gaps, which were then filled using CHIRPS datasets, a combination of satellite and observed rainfall data. Temperature data (max and min) from the Eldoret Meteorological Station for the same period were used. To mitigate the effects of initial conditions, the period of 1970–1980 was used as a warm-up period. A ten-year record of rainfall, 1981–1990, corresponding to the period for which streamflow data was available, was selected for model calibration and validation.
2.3.5. Parameter Sensitivity
Sensitivity analysis was performed as an important step towards understanding the model performance before calibration. Four parameters were chosen to test surface runoff sensitivity; curve number (CN), baseflow recession constant (ALPHA_BF), groundwater delay time (GW_DELAY), and the depth of the shallow aquifer required to return flow (GWQMN). Each parameter was independently increased while observing the response of the direct runoff. It was observed that the baseflow recession constant was very sensitive. However, due to the unavailability of groundwater data, the focus was put on CN, where its modification would result in a non-linear change in the hydrologic response of the catchment. The catchment runoff was observed to be more sensitive to an increase in CN compared to a decrease.
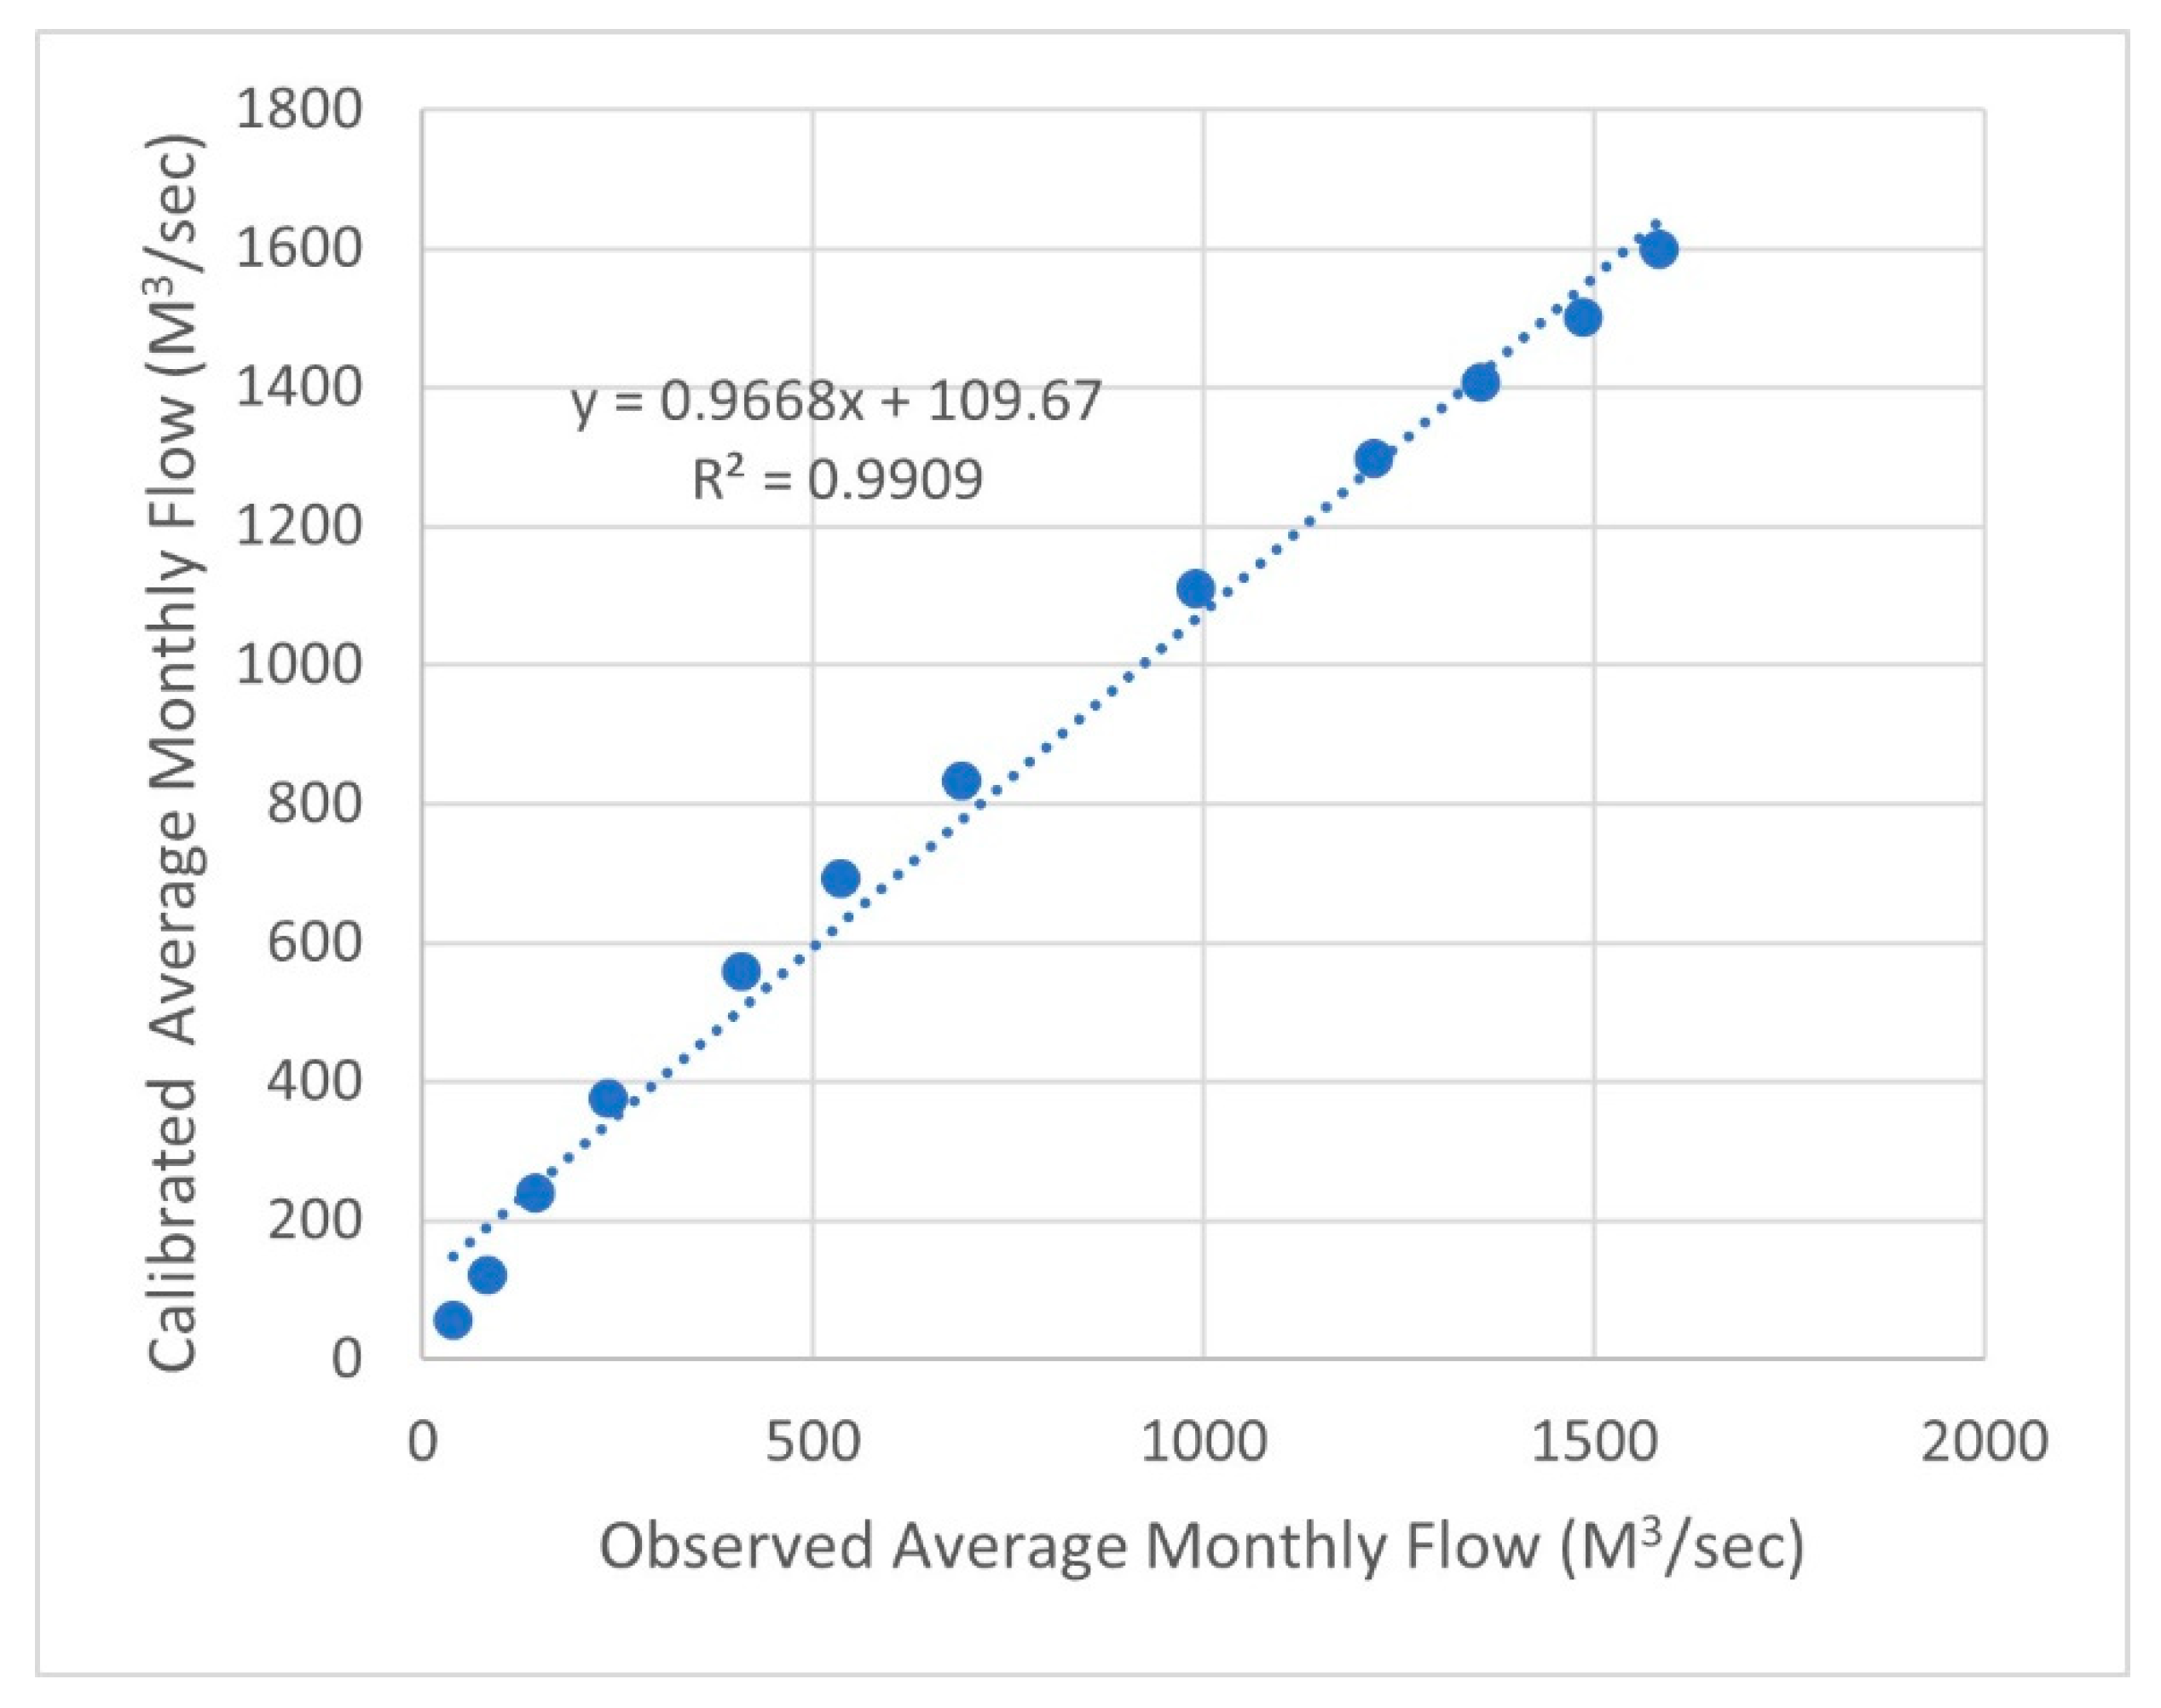
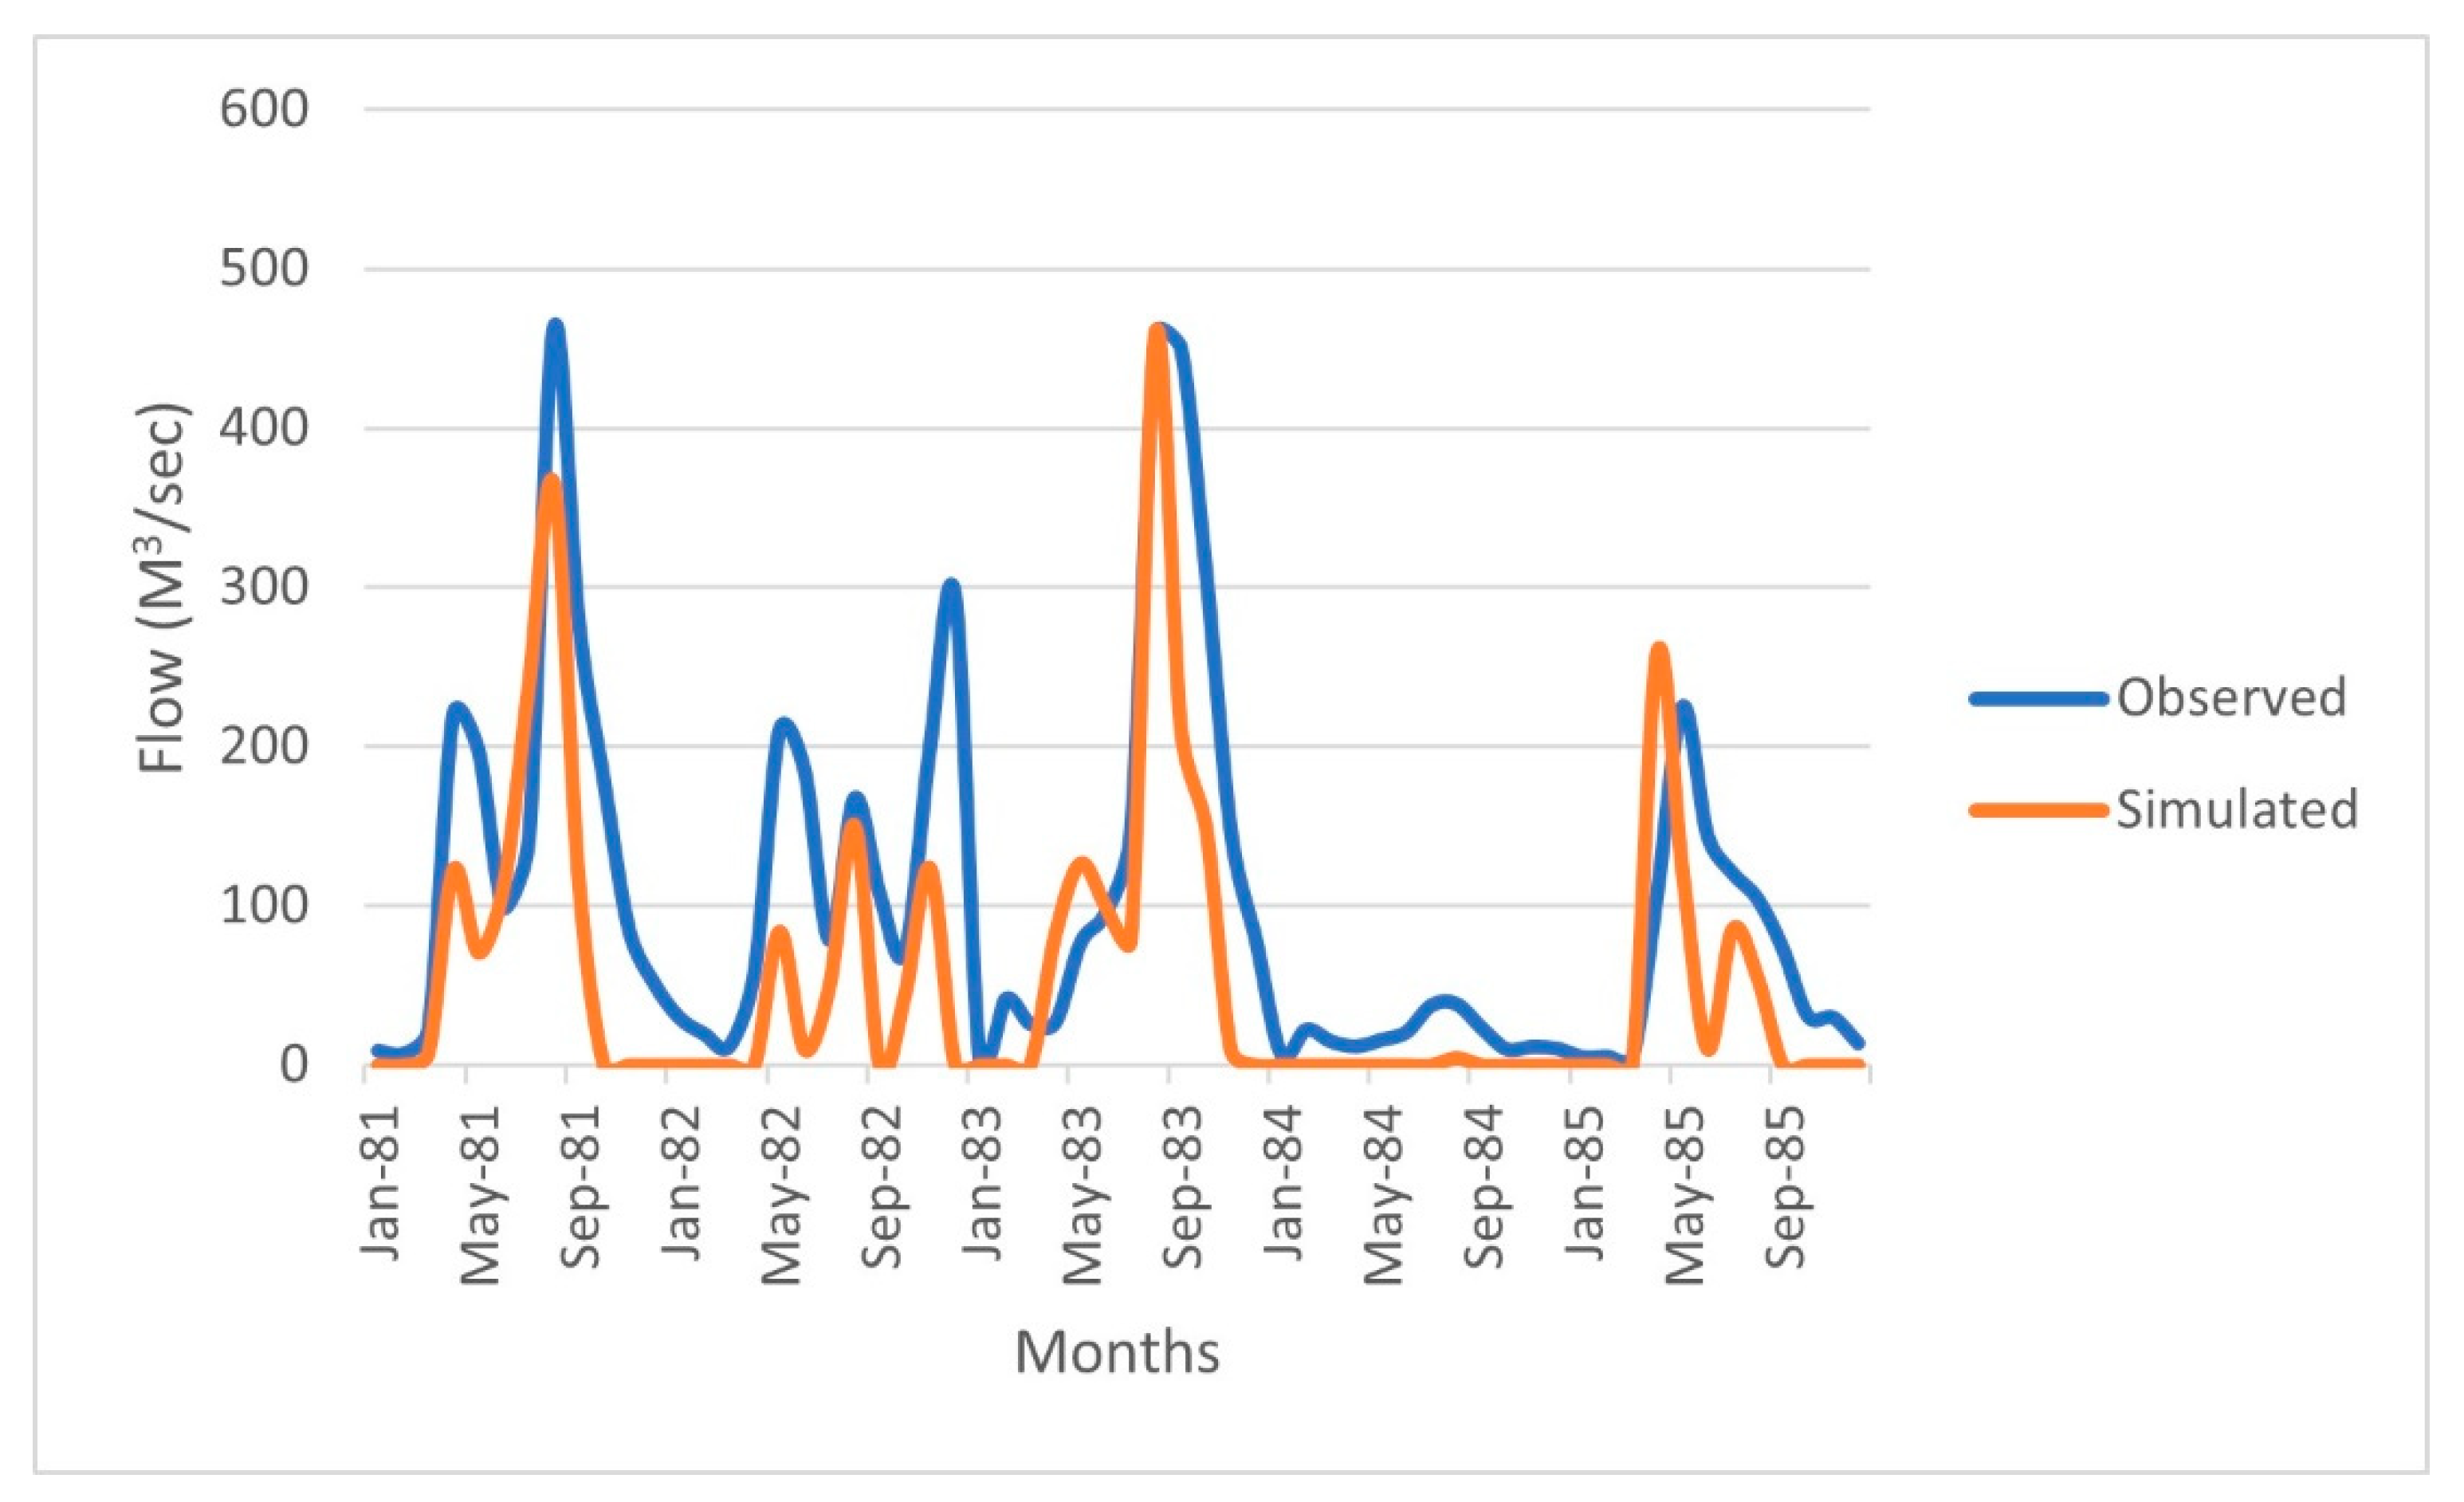
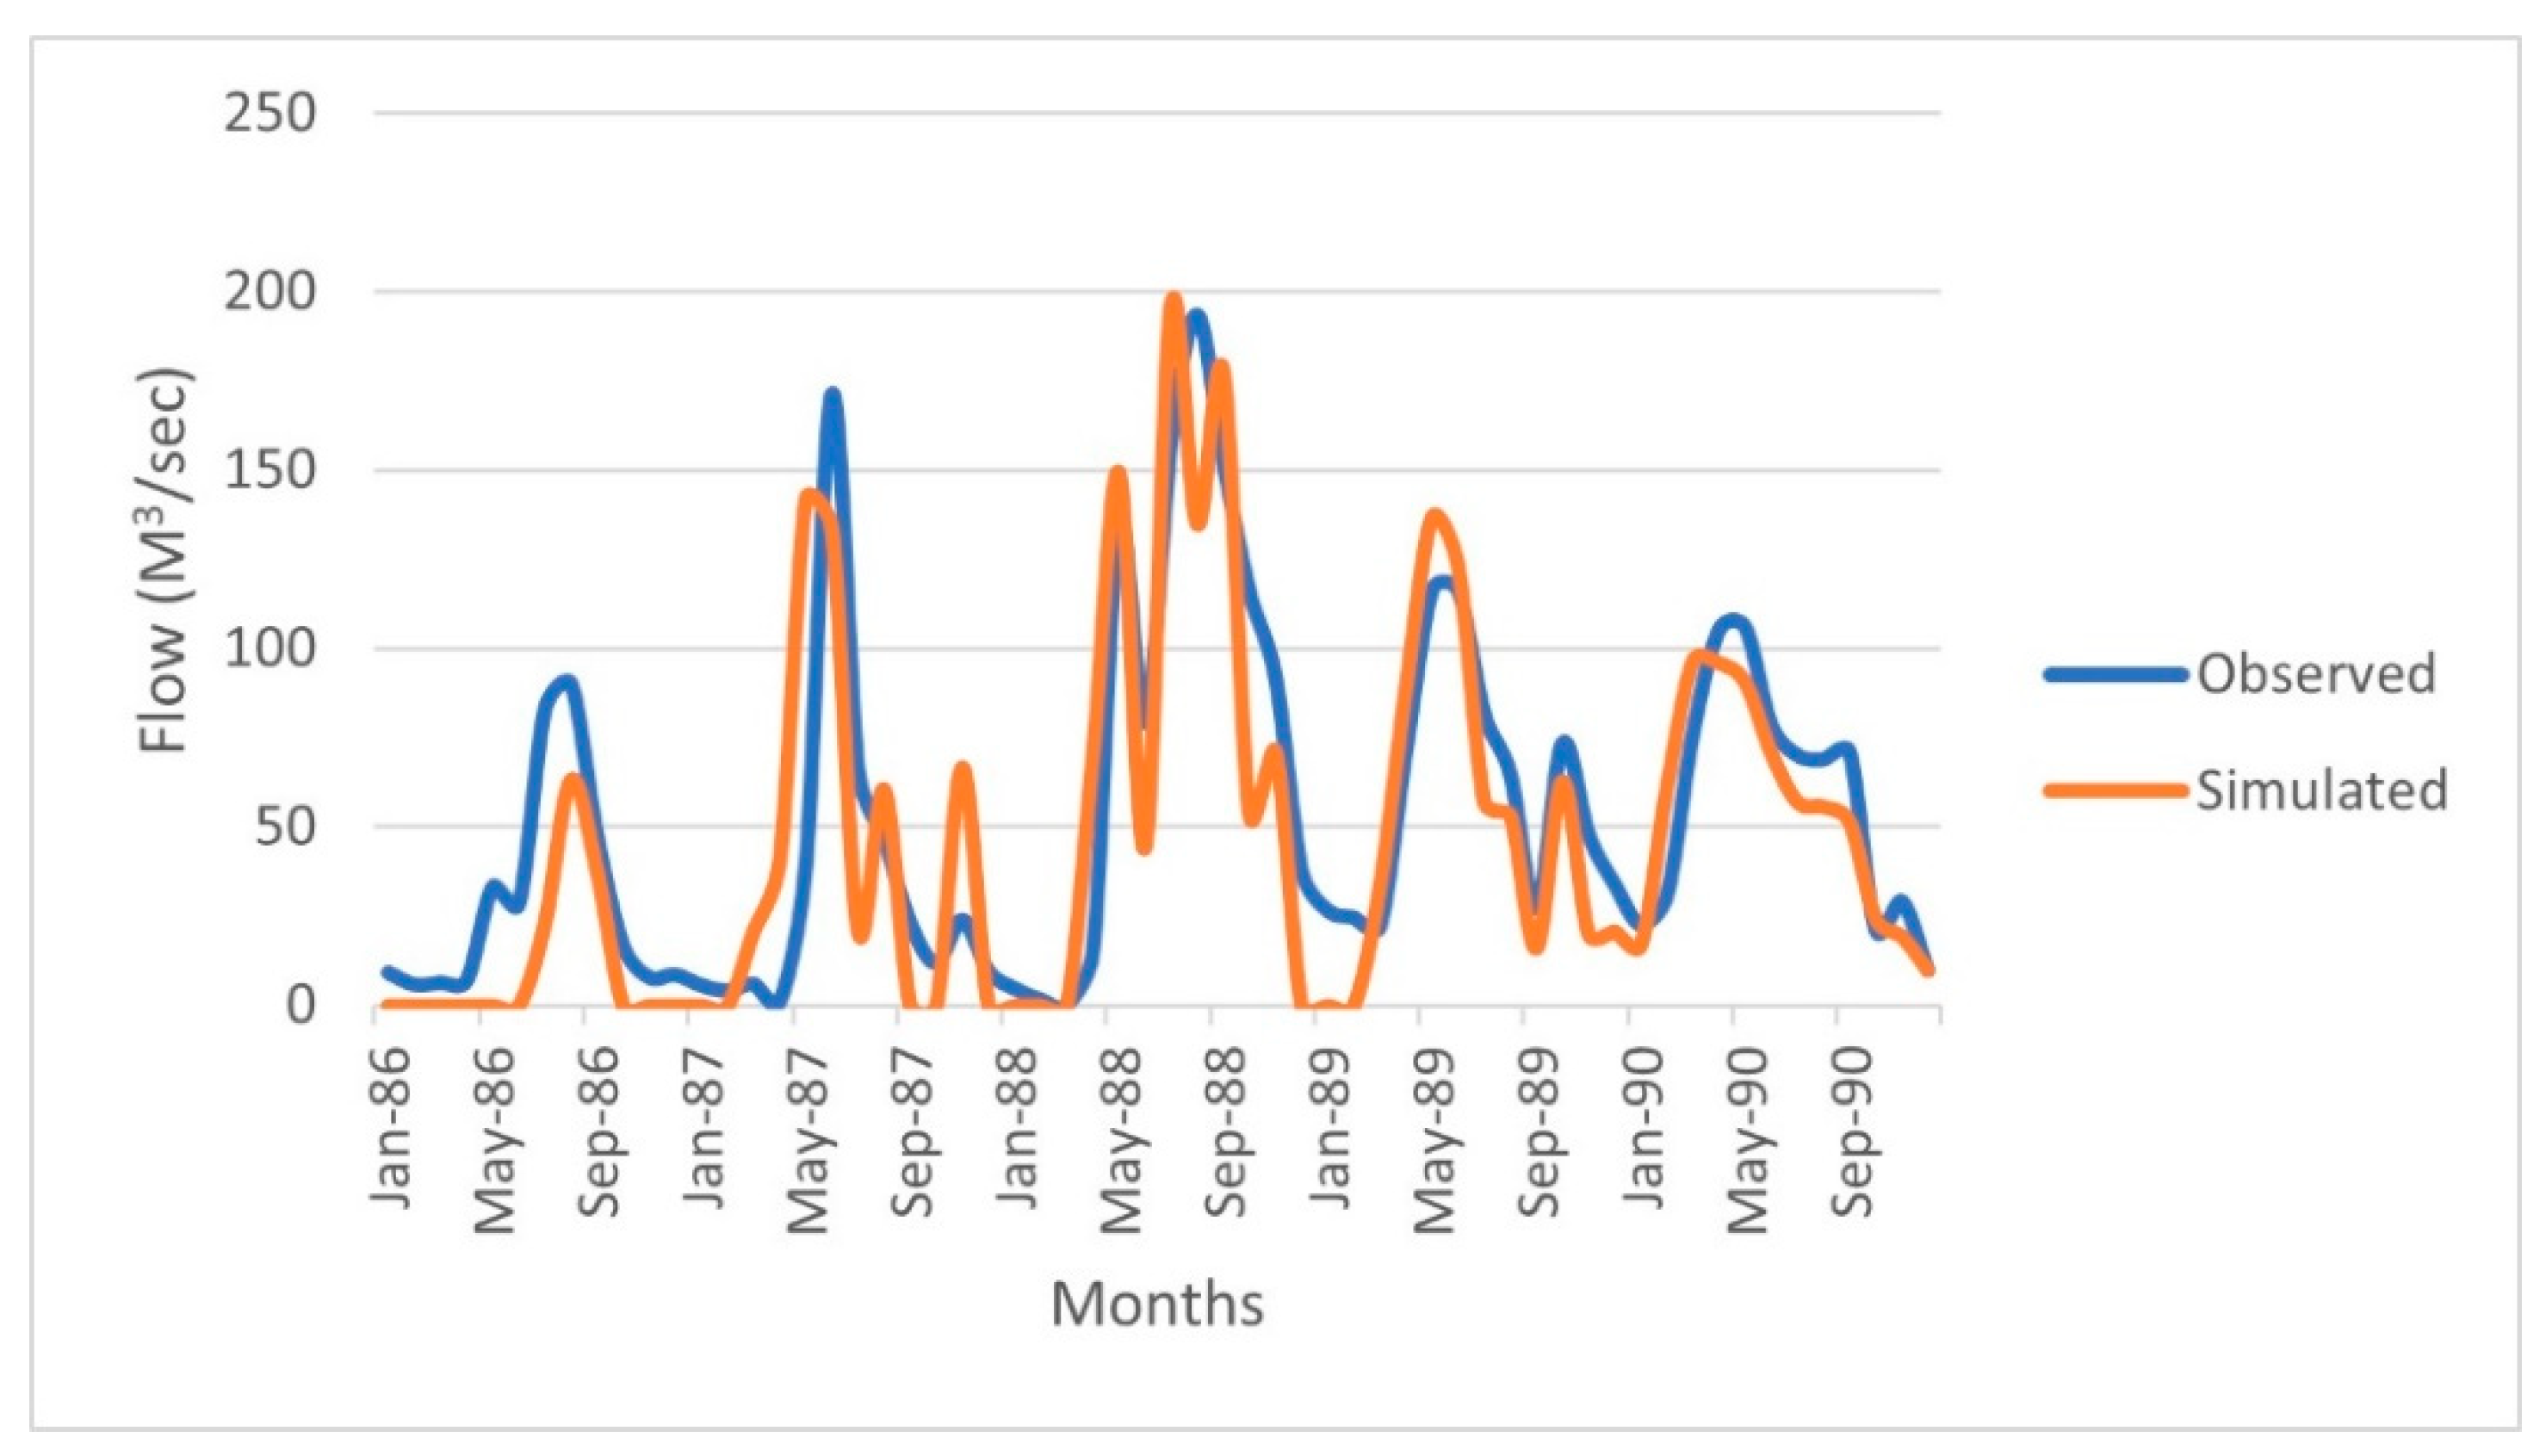
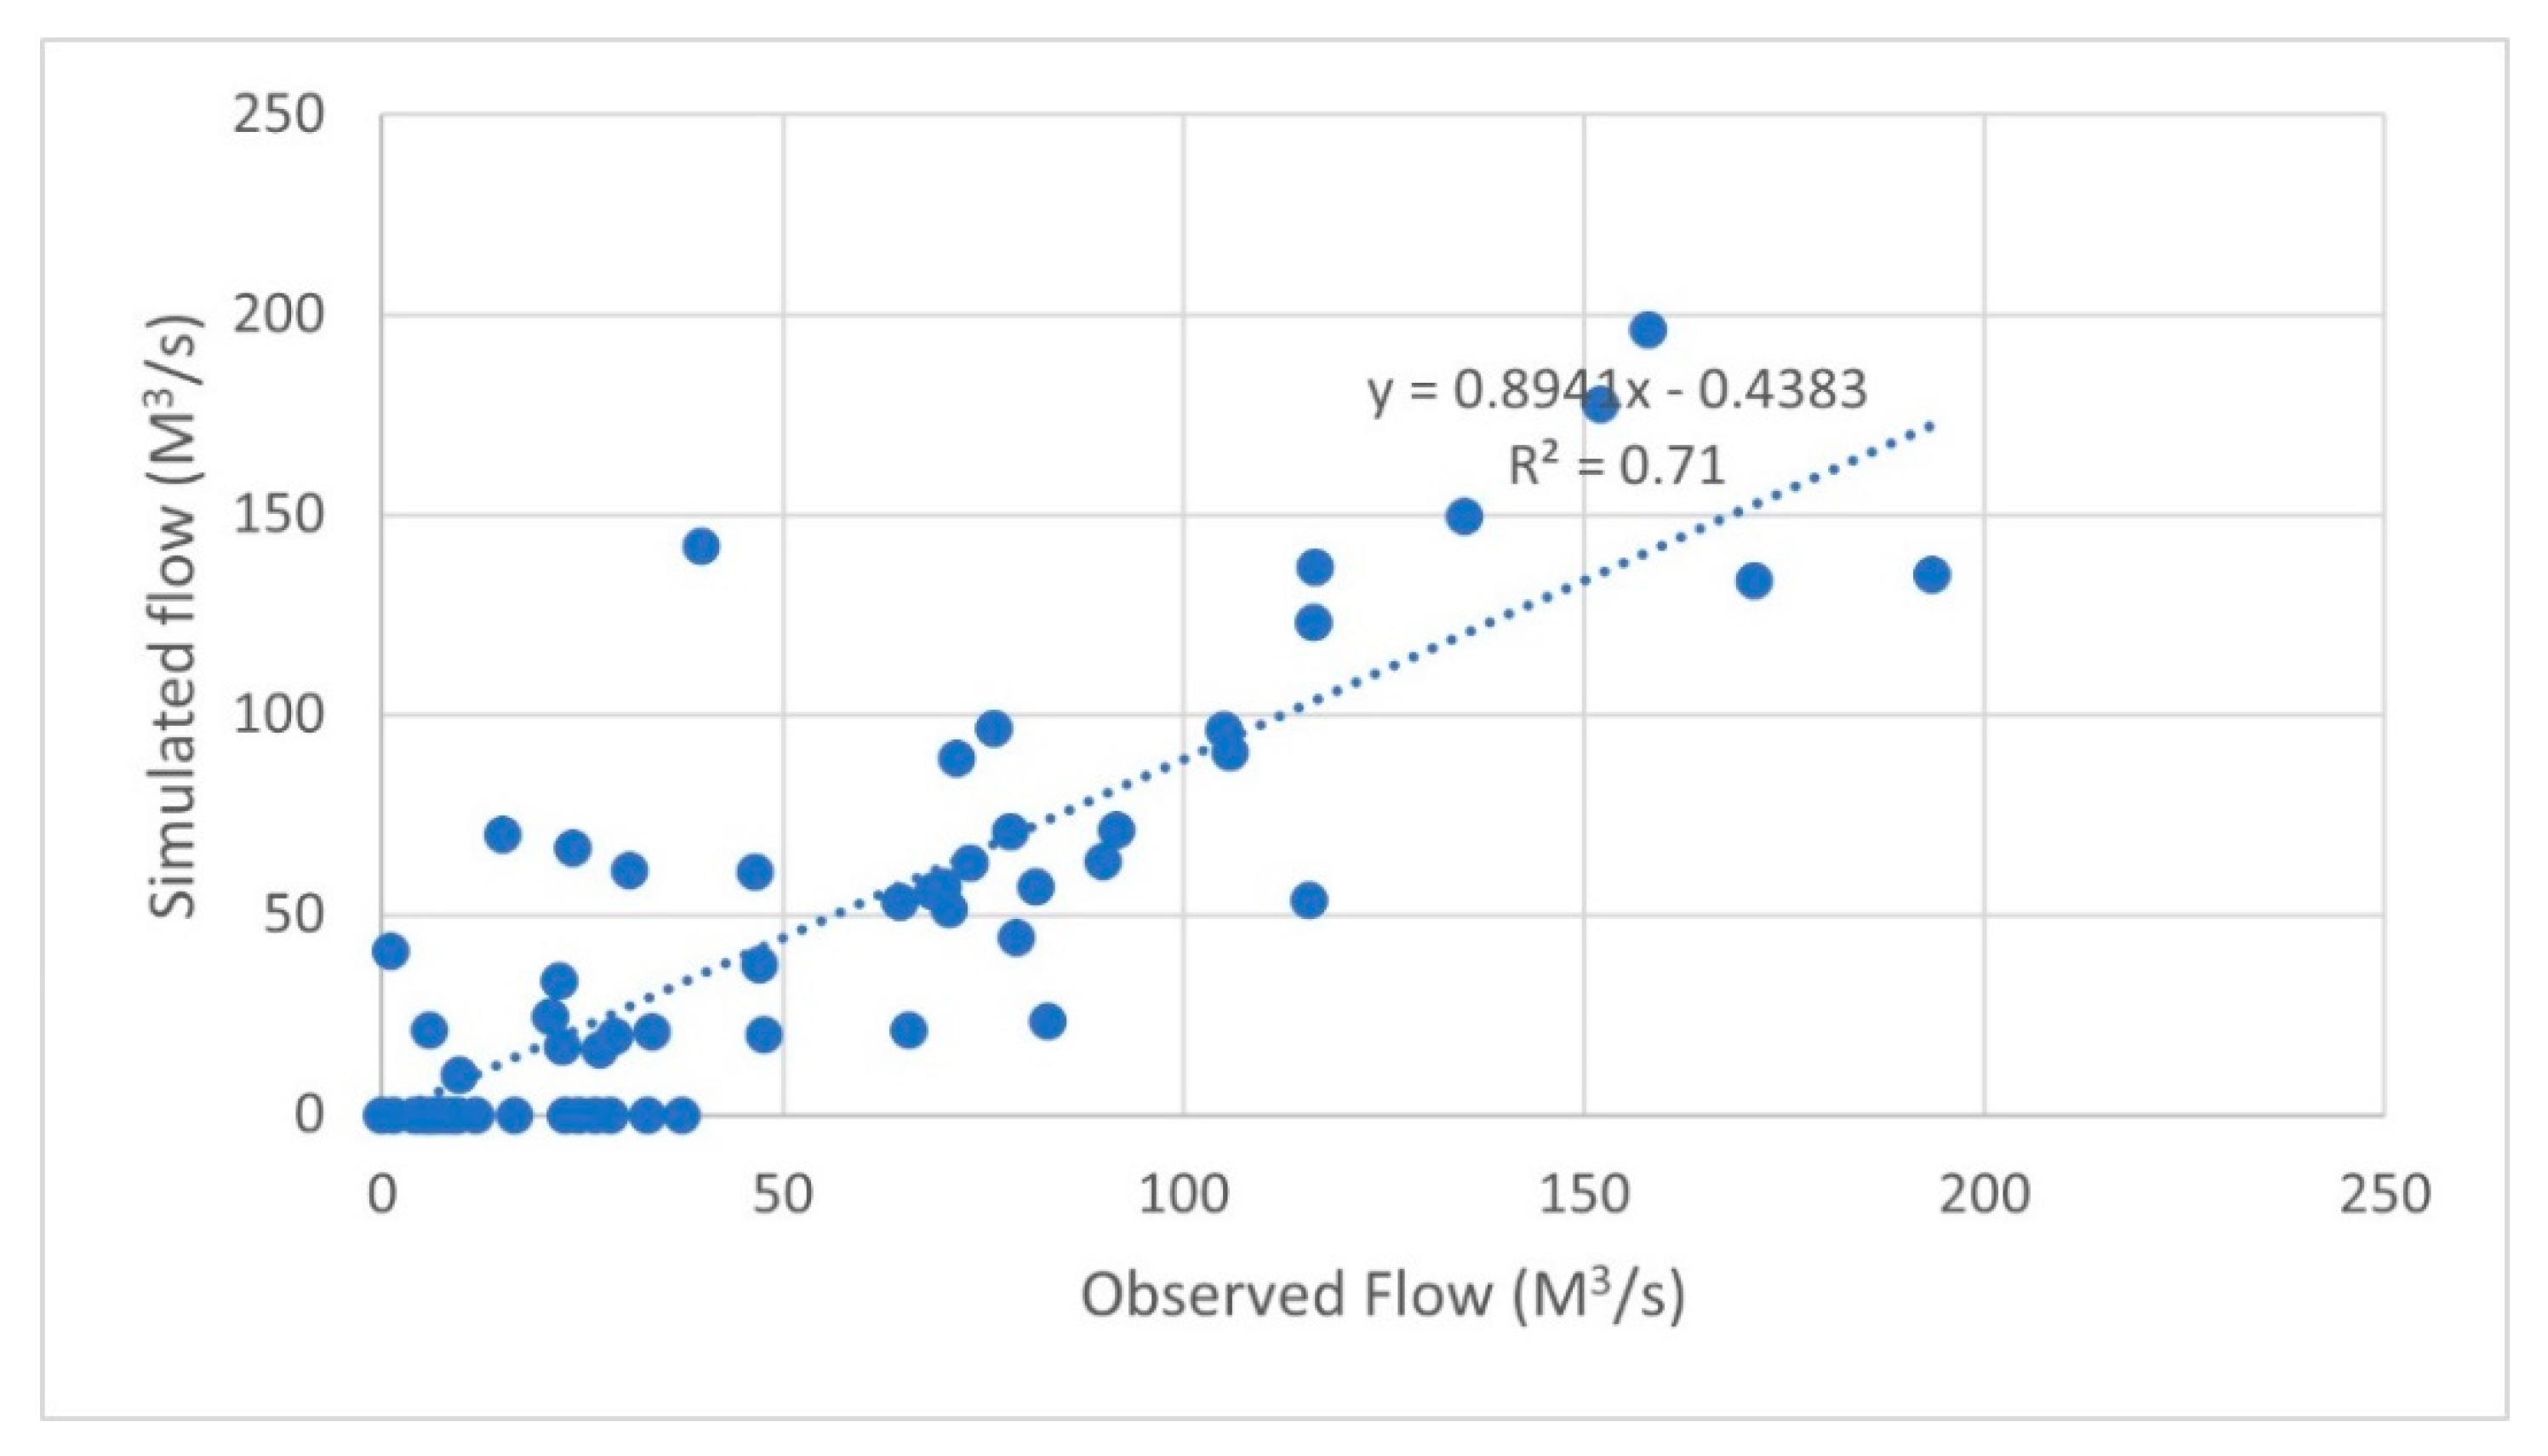
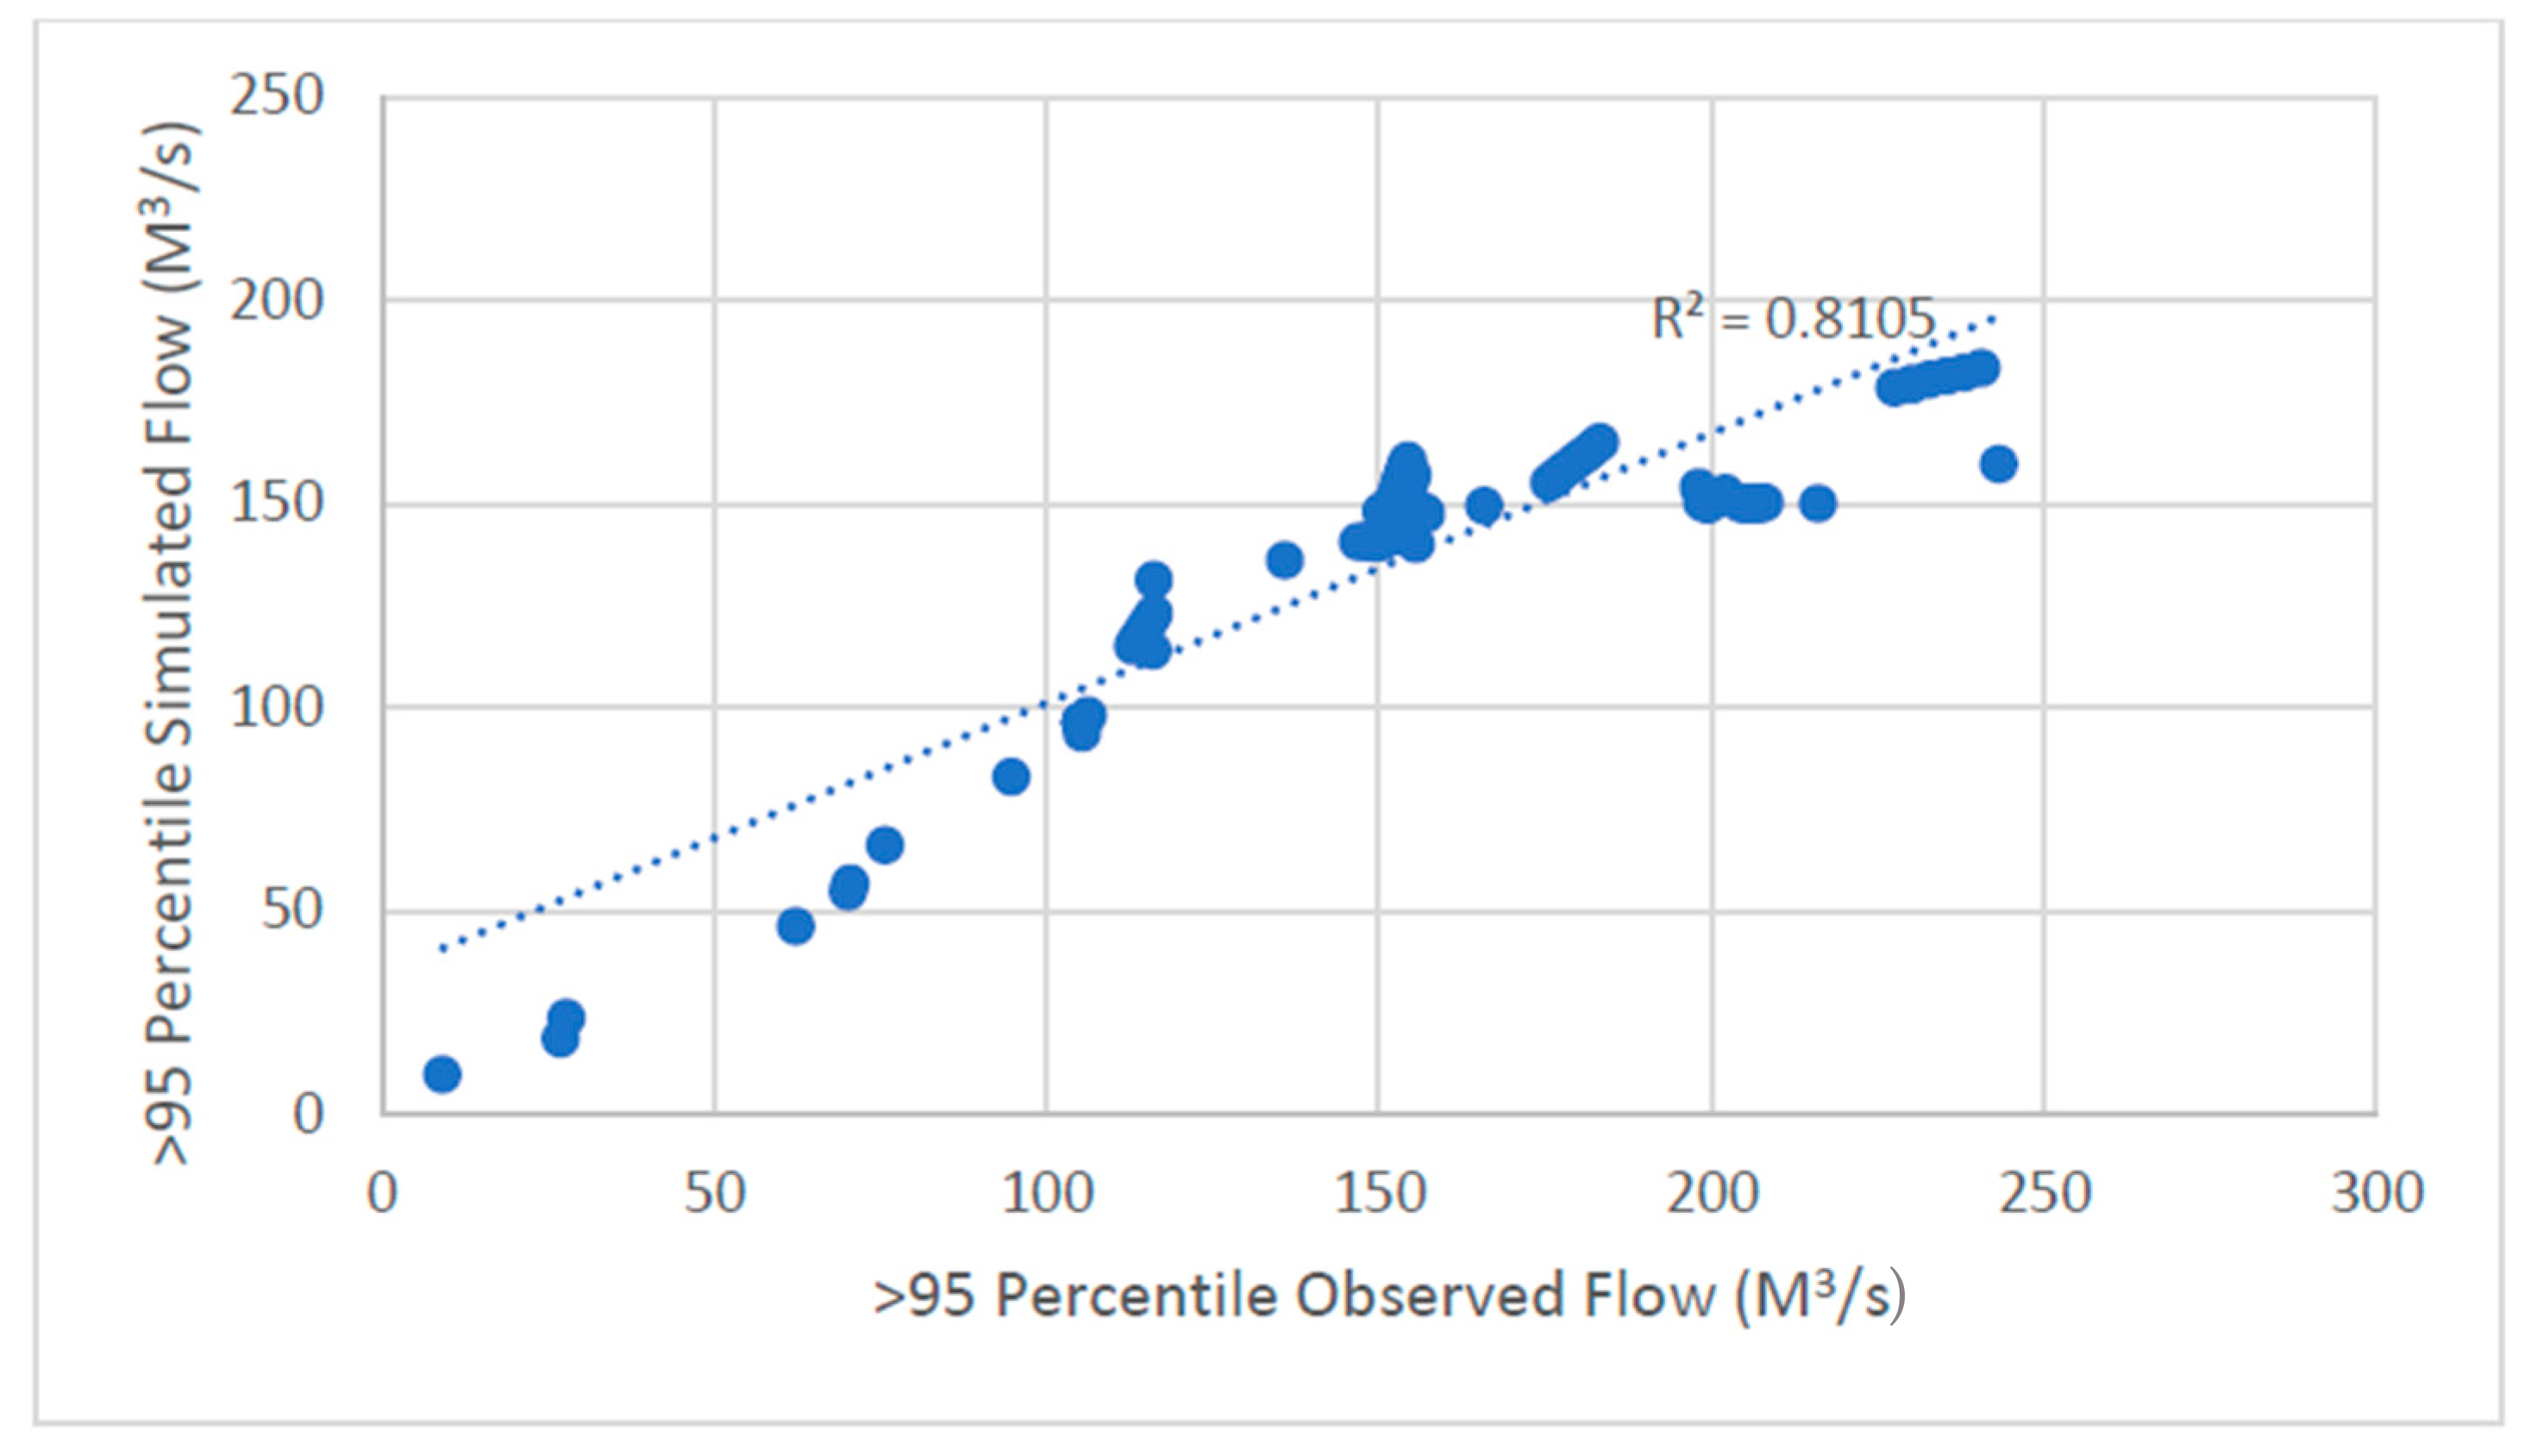
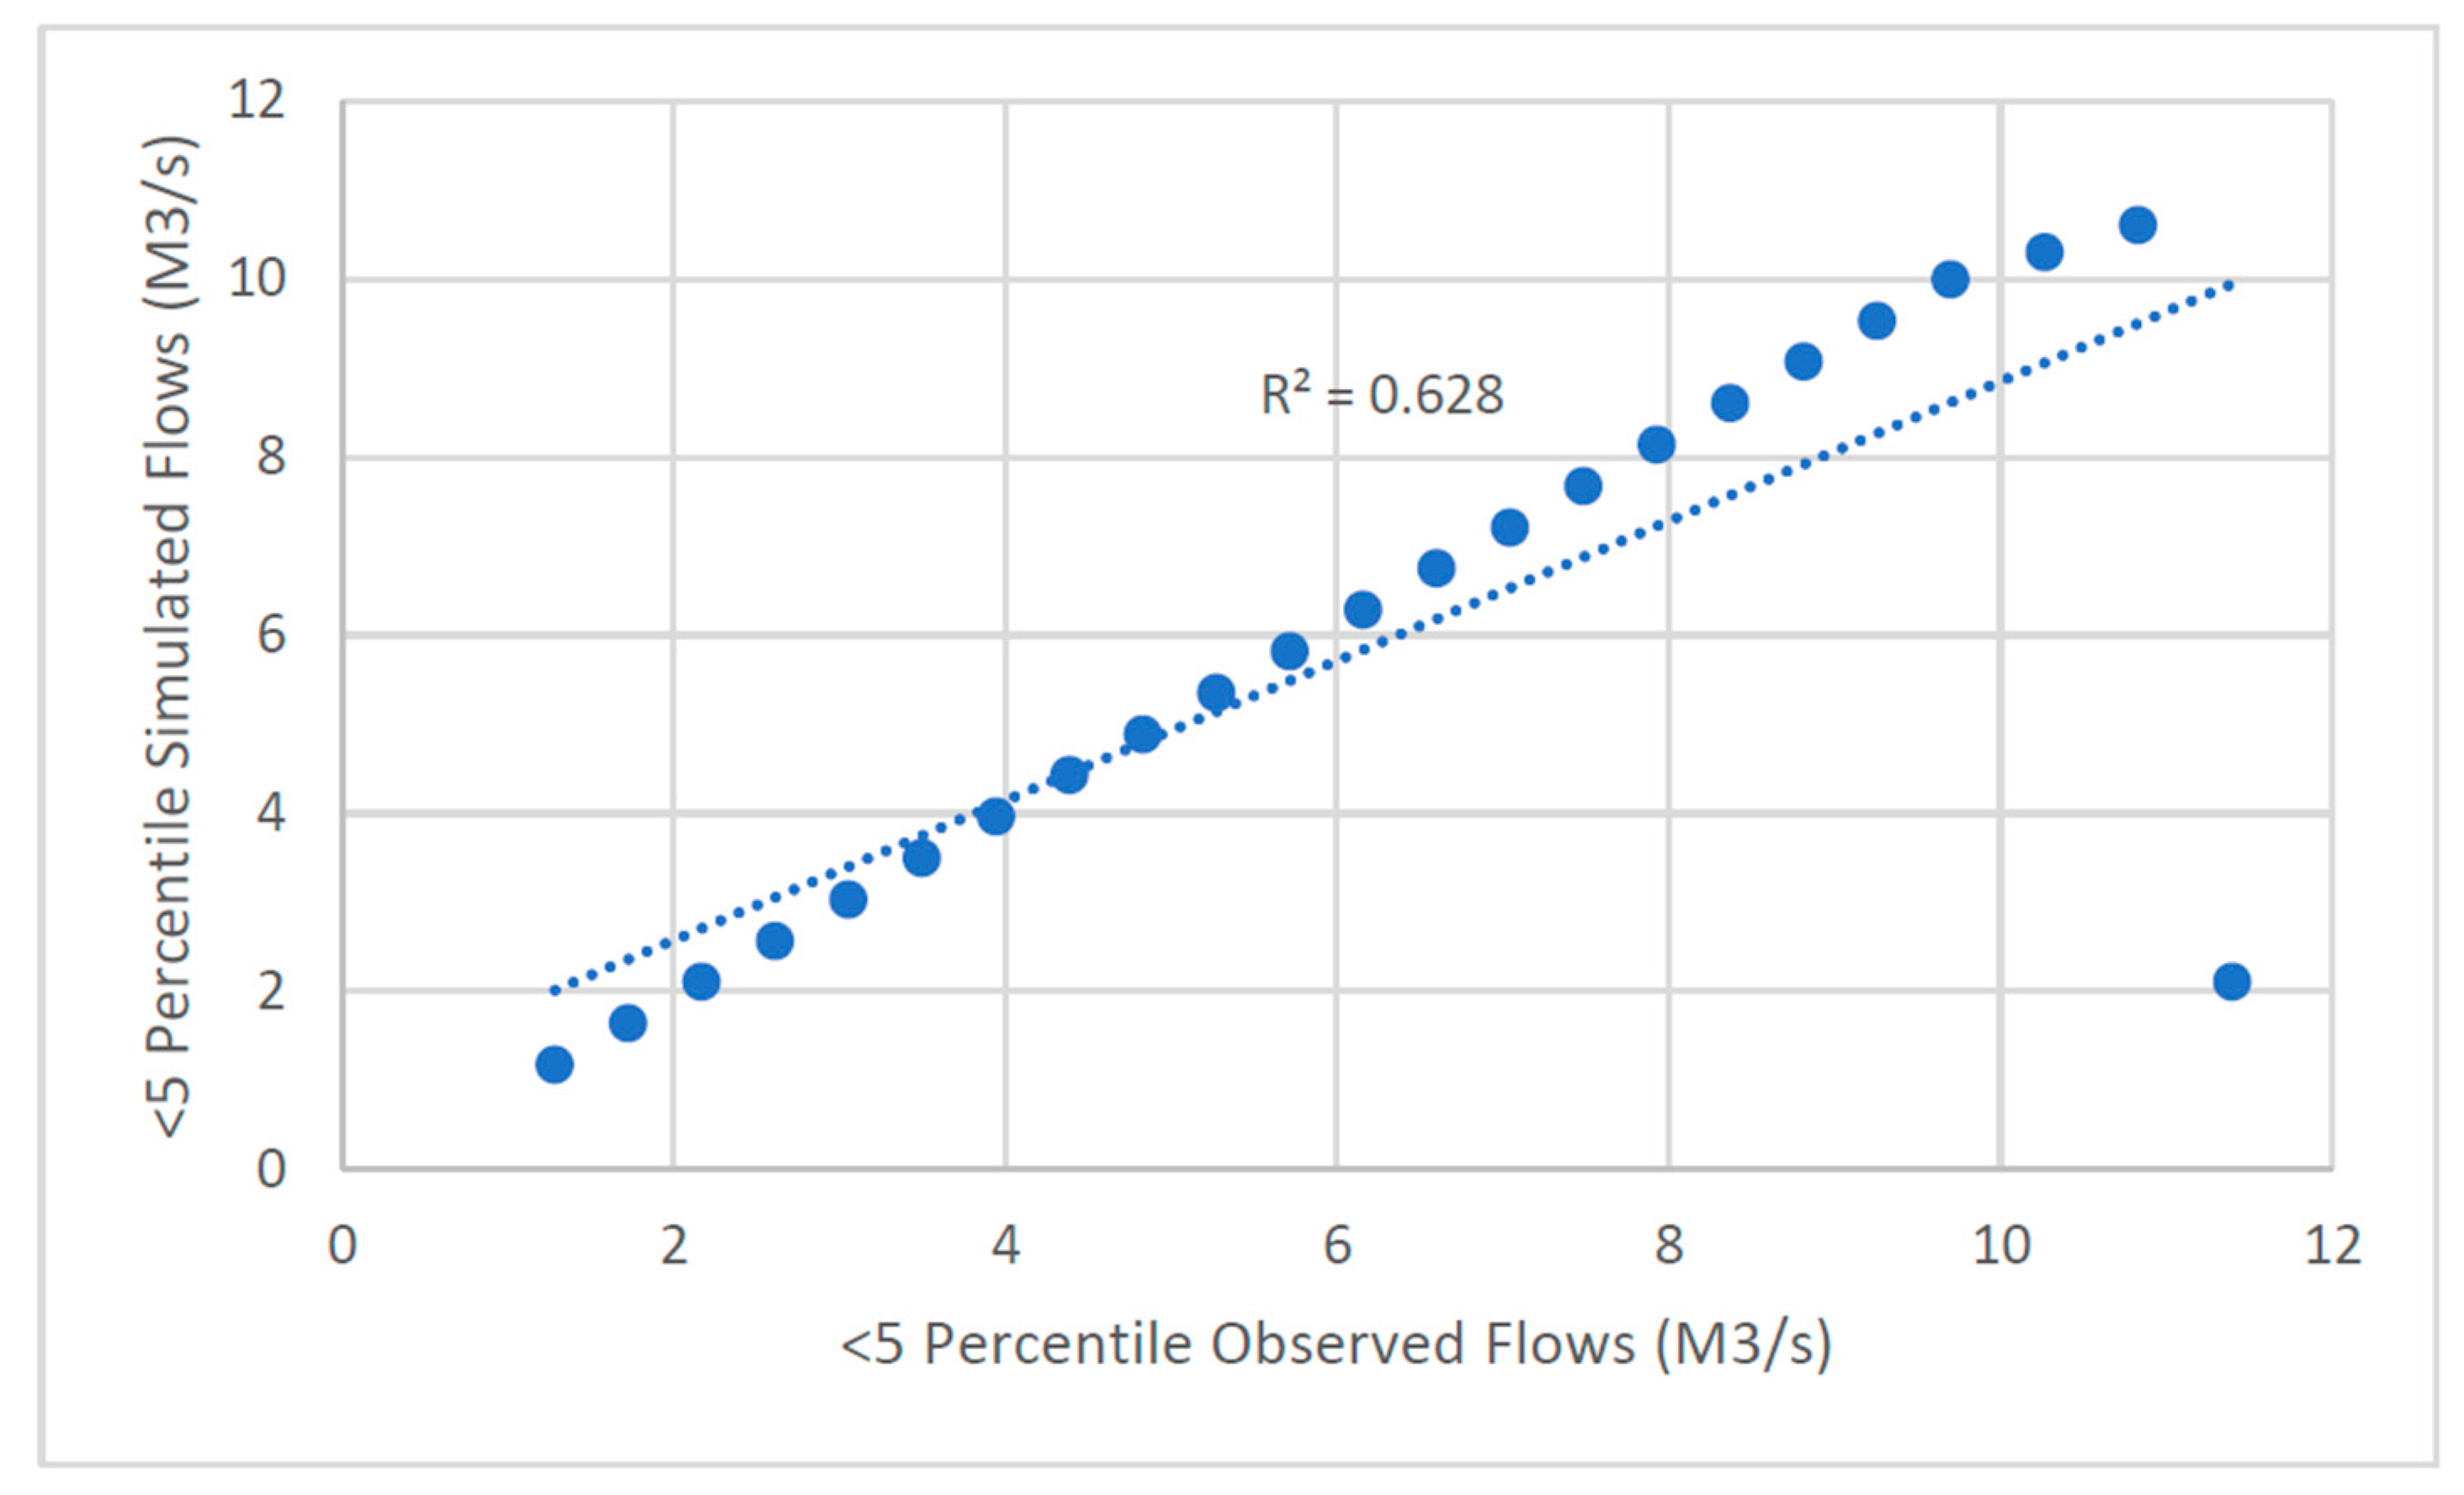
2.3.6. Model Performance
The efficiency of the model and the accuracy of the results produced were carried out based on the line of best fit, to arrive at a coefficient of determination R
2, Bias, and Nash–Sutcliffe Efficiency (NSE). The methods are good at signifying the consistency between observed and simulated streamflow. The R
2, Bias, and NSE have values ranging from 0 to 1. A value of ≥0.5 is acceptable, while ≥0.7 indicates the model to be a good predictor of runoff [
10,
12,
21]. The model was therefore calibrated manually and automatically, using the SWAT CUP, SUFI-2 program, which is linked to SWAT. Several simulation runs were done to achieve a satisfactory R
2 of 0.99 (
Figure 4), a Bias of 0.32, and an NSE of 0.9 for calibrated monthly flows. The calibration period was 1981–1985 and the validation period was 1986–1990.
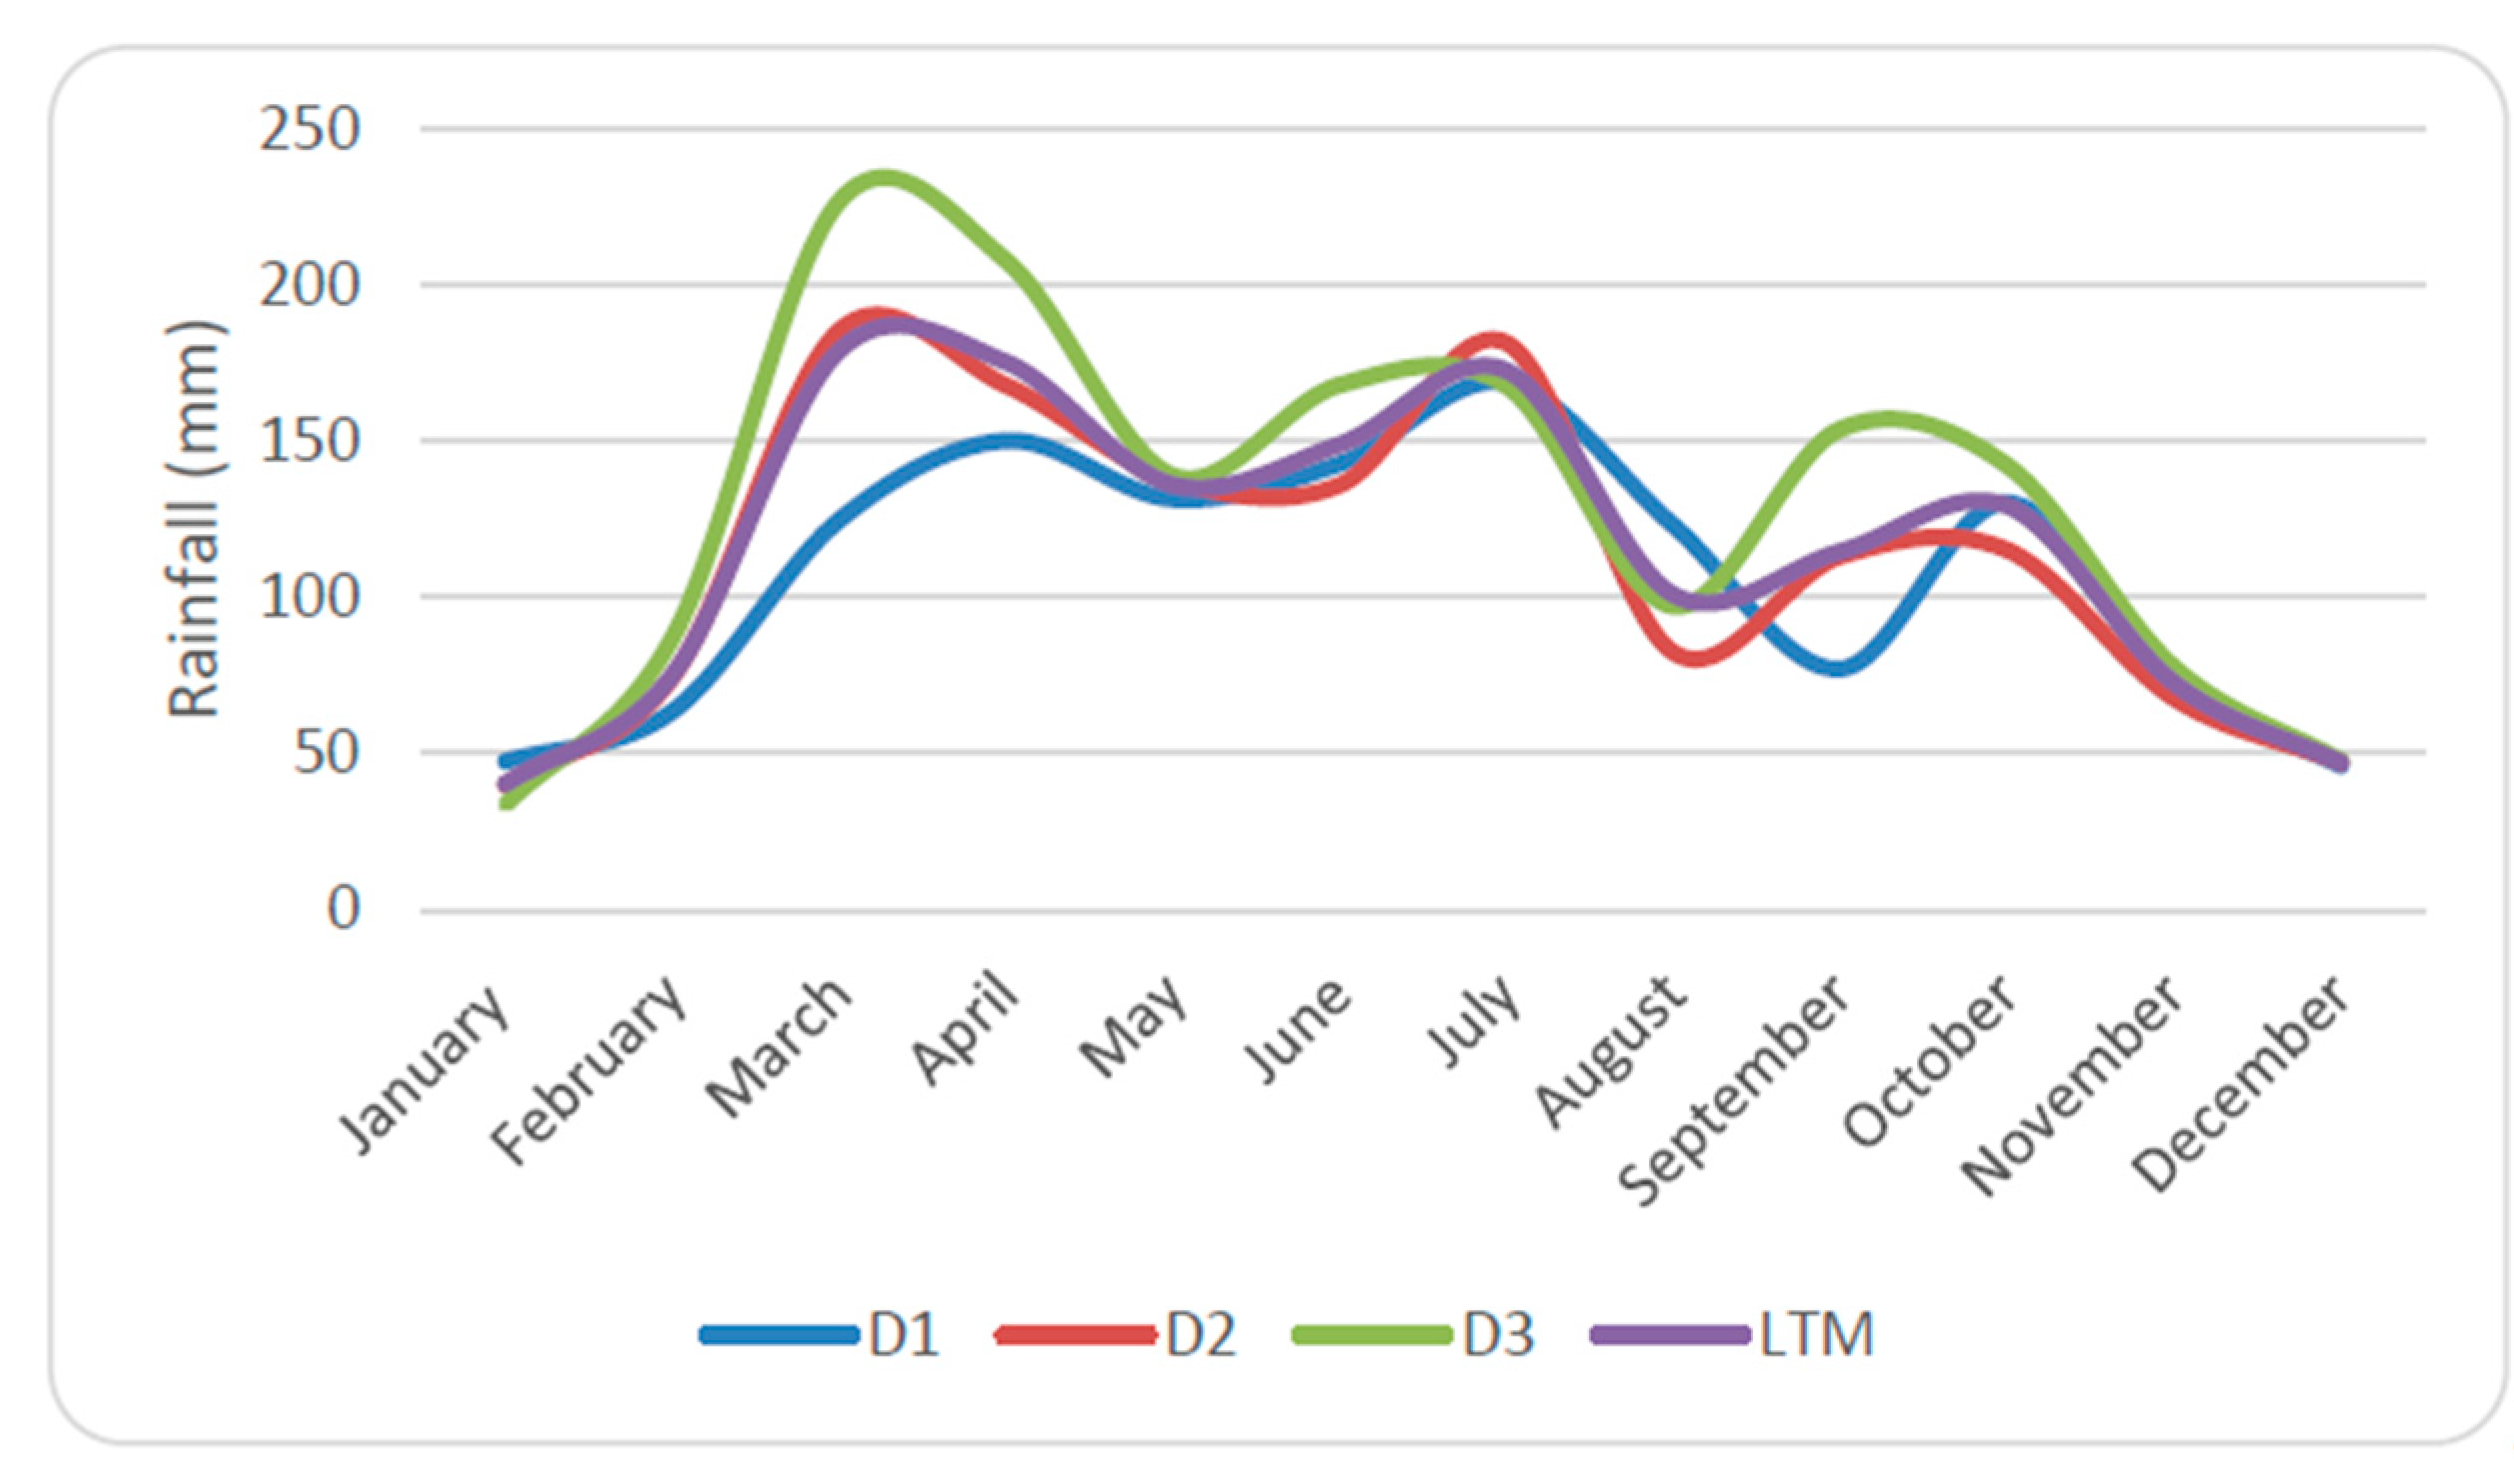
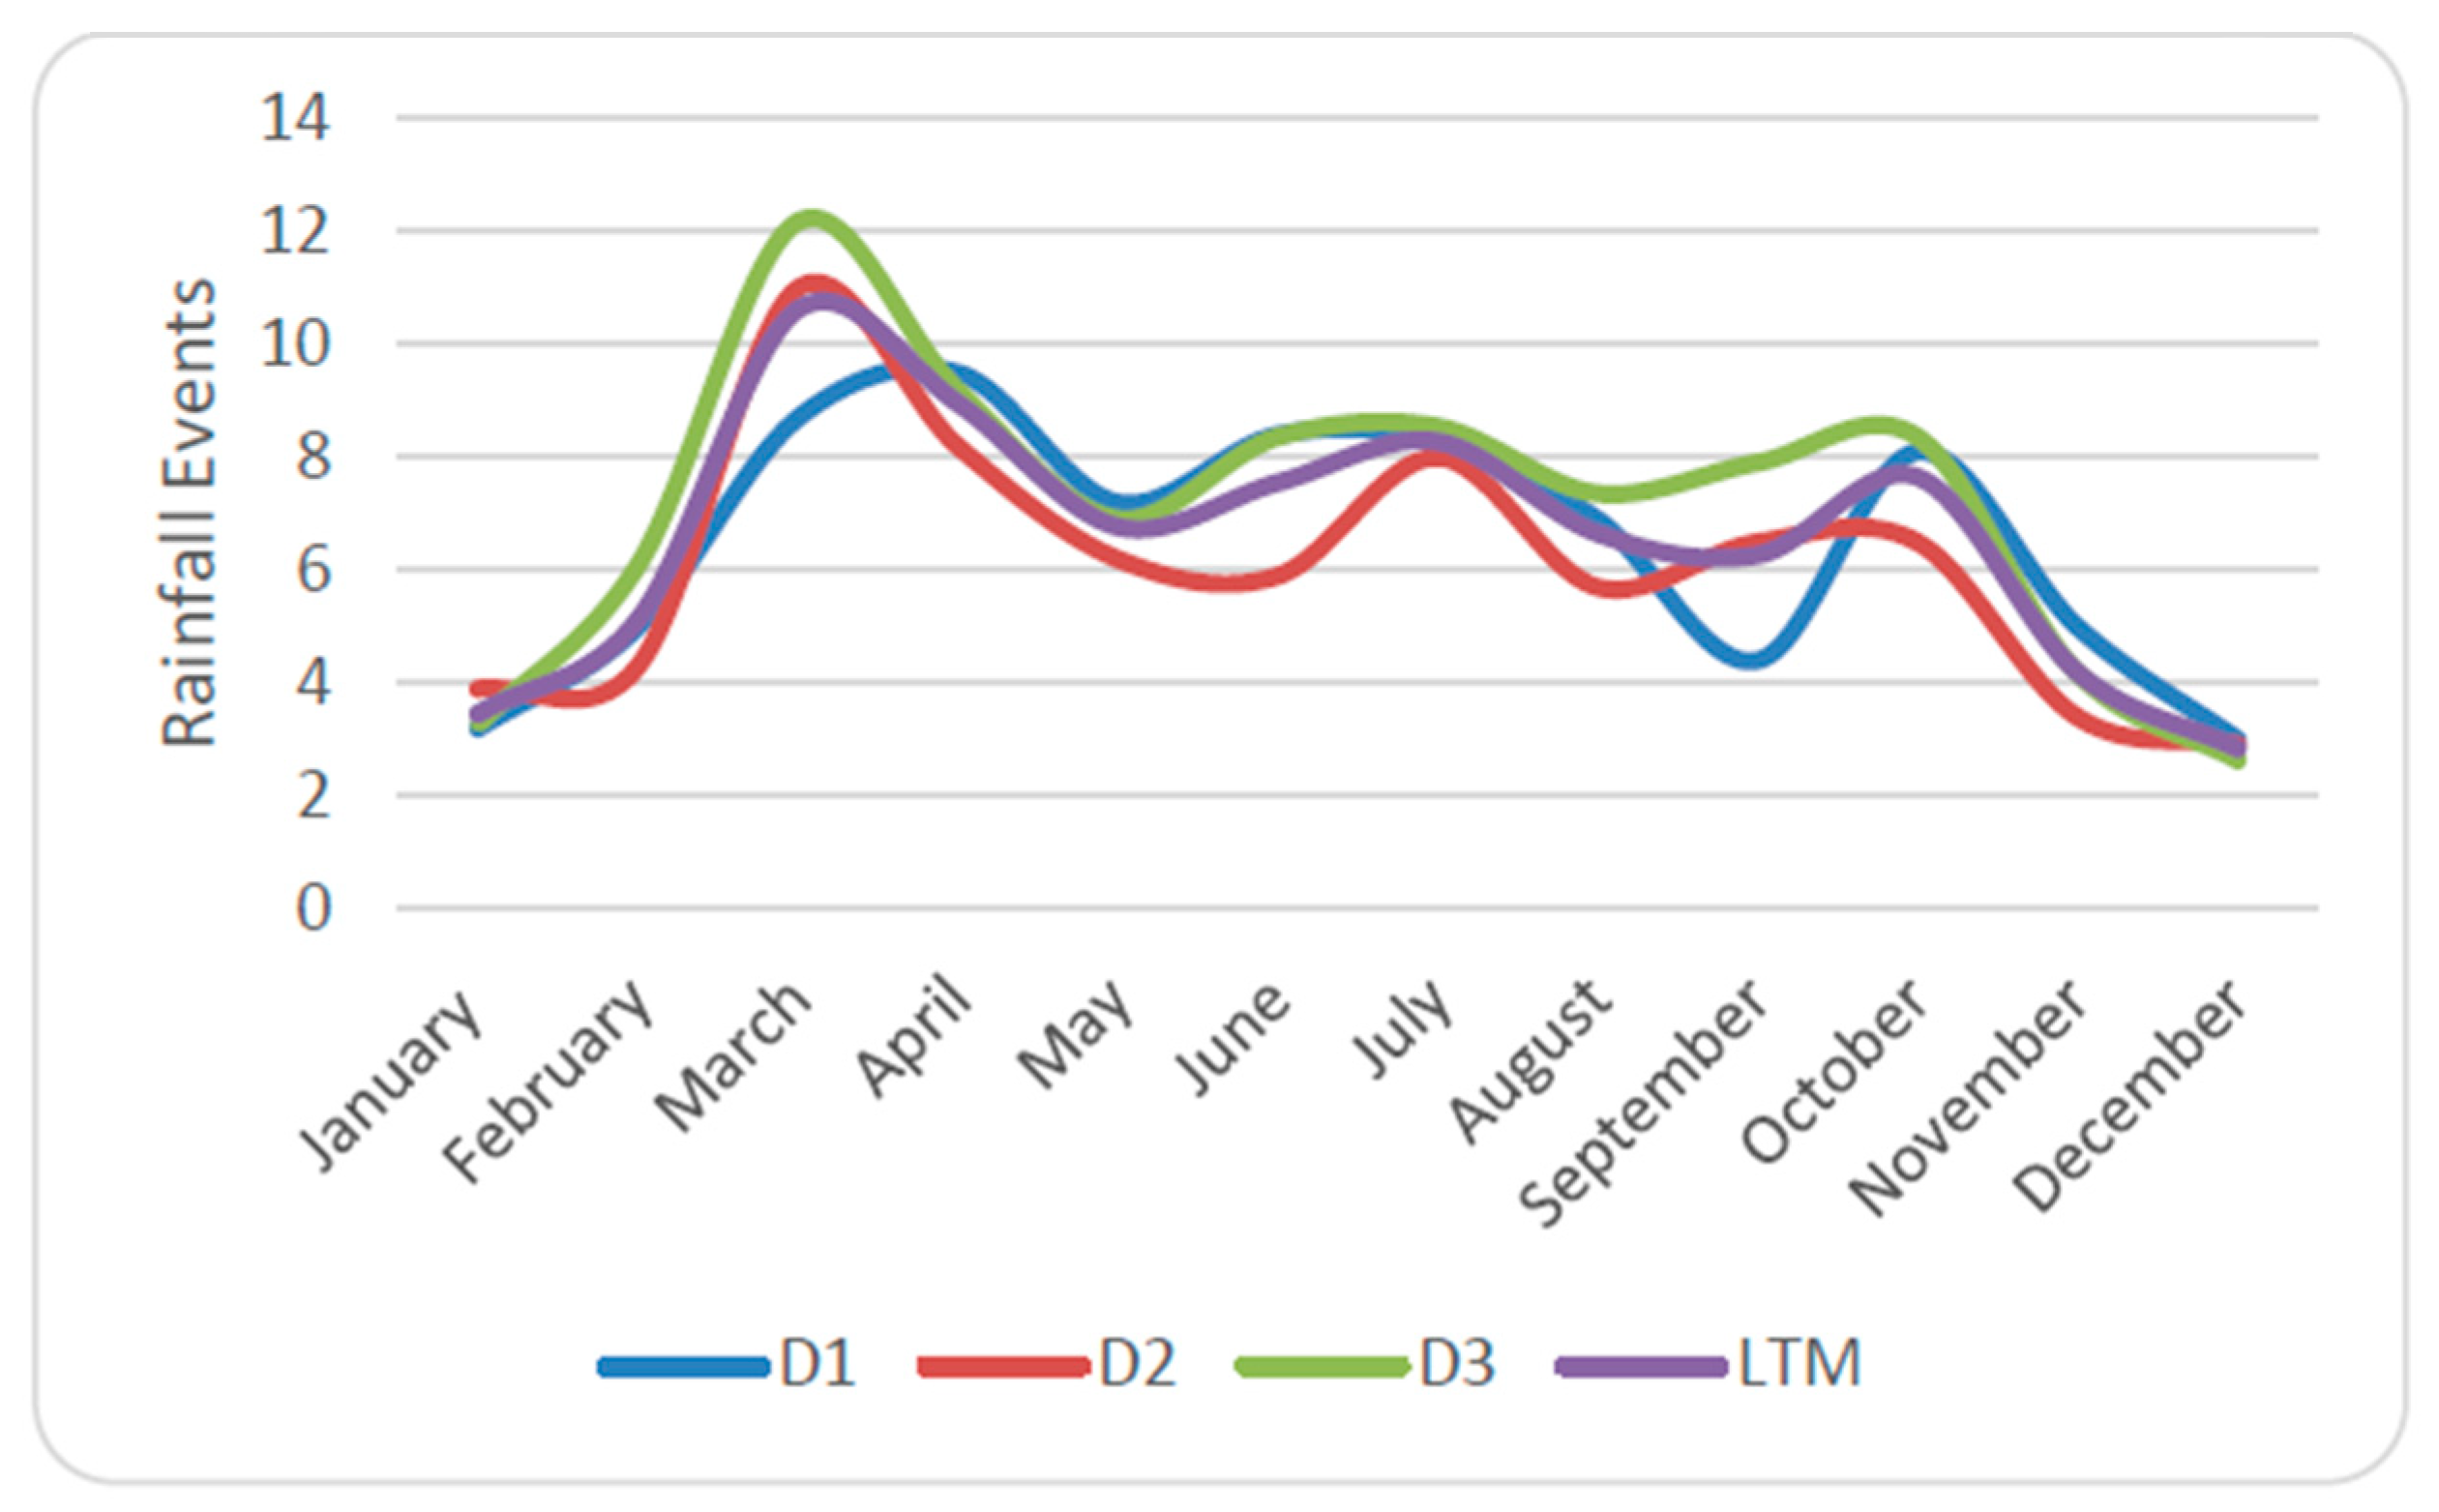
2.4. Analysis of Rainfall Data
The 1970–2019 rainfall data obtained for the stations in the catchment were divided into decades (D1–D5). Statistical analyses, linear trend line distributions, time lag comparison, and moving average analysis were applied to the daily rainfall events and amounts. A rainfall event was defined by rainfall ≥ 1 mm [
18]. Rainfall events were computed at a daily time step and the same statistical analyses were performed. The last 30 years (1989–2019), with available land use maps, formed the critical part of rainfall data analysis.
2.5. Management Practices
The calibrated model was used for scenario analysis. Each scenario was defined based on land use change or management operations, such as land use management, impounding water on agricultural farms, and soil water conservation practices for analysis. The simulation period using rainfall for selected years was maintained and the catchment yield, groundwater, and river flows were observed for comparison purposes.
2.6. Stakeholder Engagement
The main stakeholders in the catchment are Kenya Forest Services (KFS), the Ministry of Agriculture, ELDOWAS, administration (local and county), and the community. The stakeholders were consulted during field visits and it was noted that efforts were being made to conserve the catchment. Some of the initiatives undertaken include athletic competitions (marathons) to raise funds for planting trees and creating awareness of forest conservation, the “shamba/taungya system”, commercial bamboo farming, afforestation, and reafforestation programs, amongst others.
4. Discussion
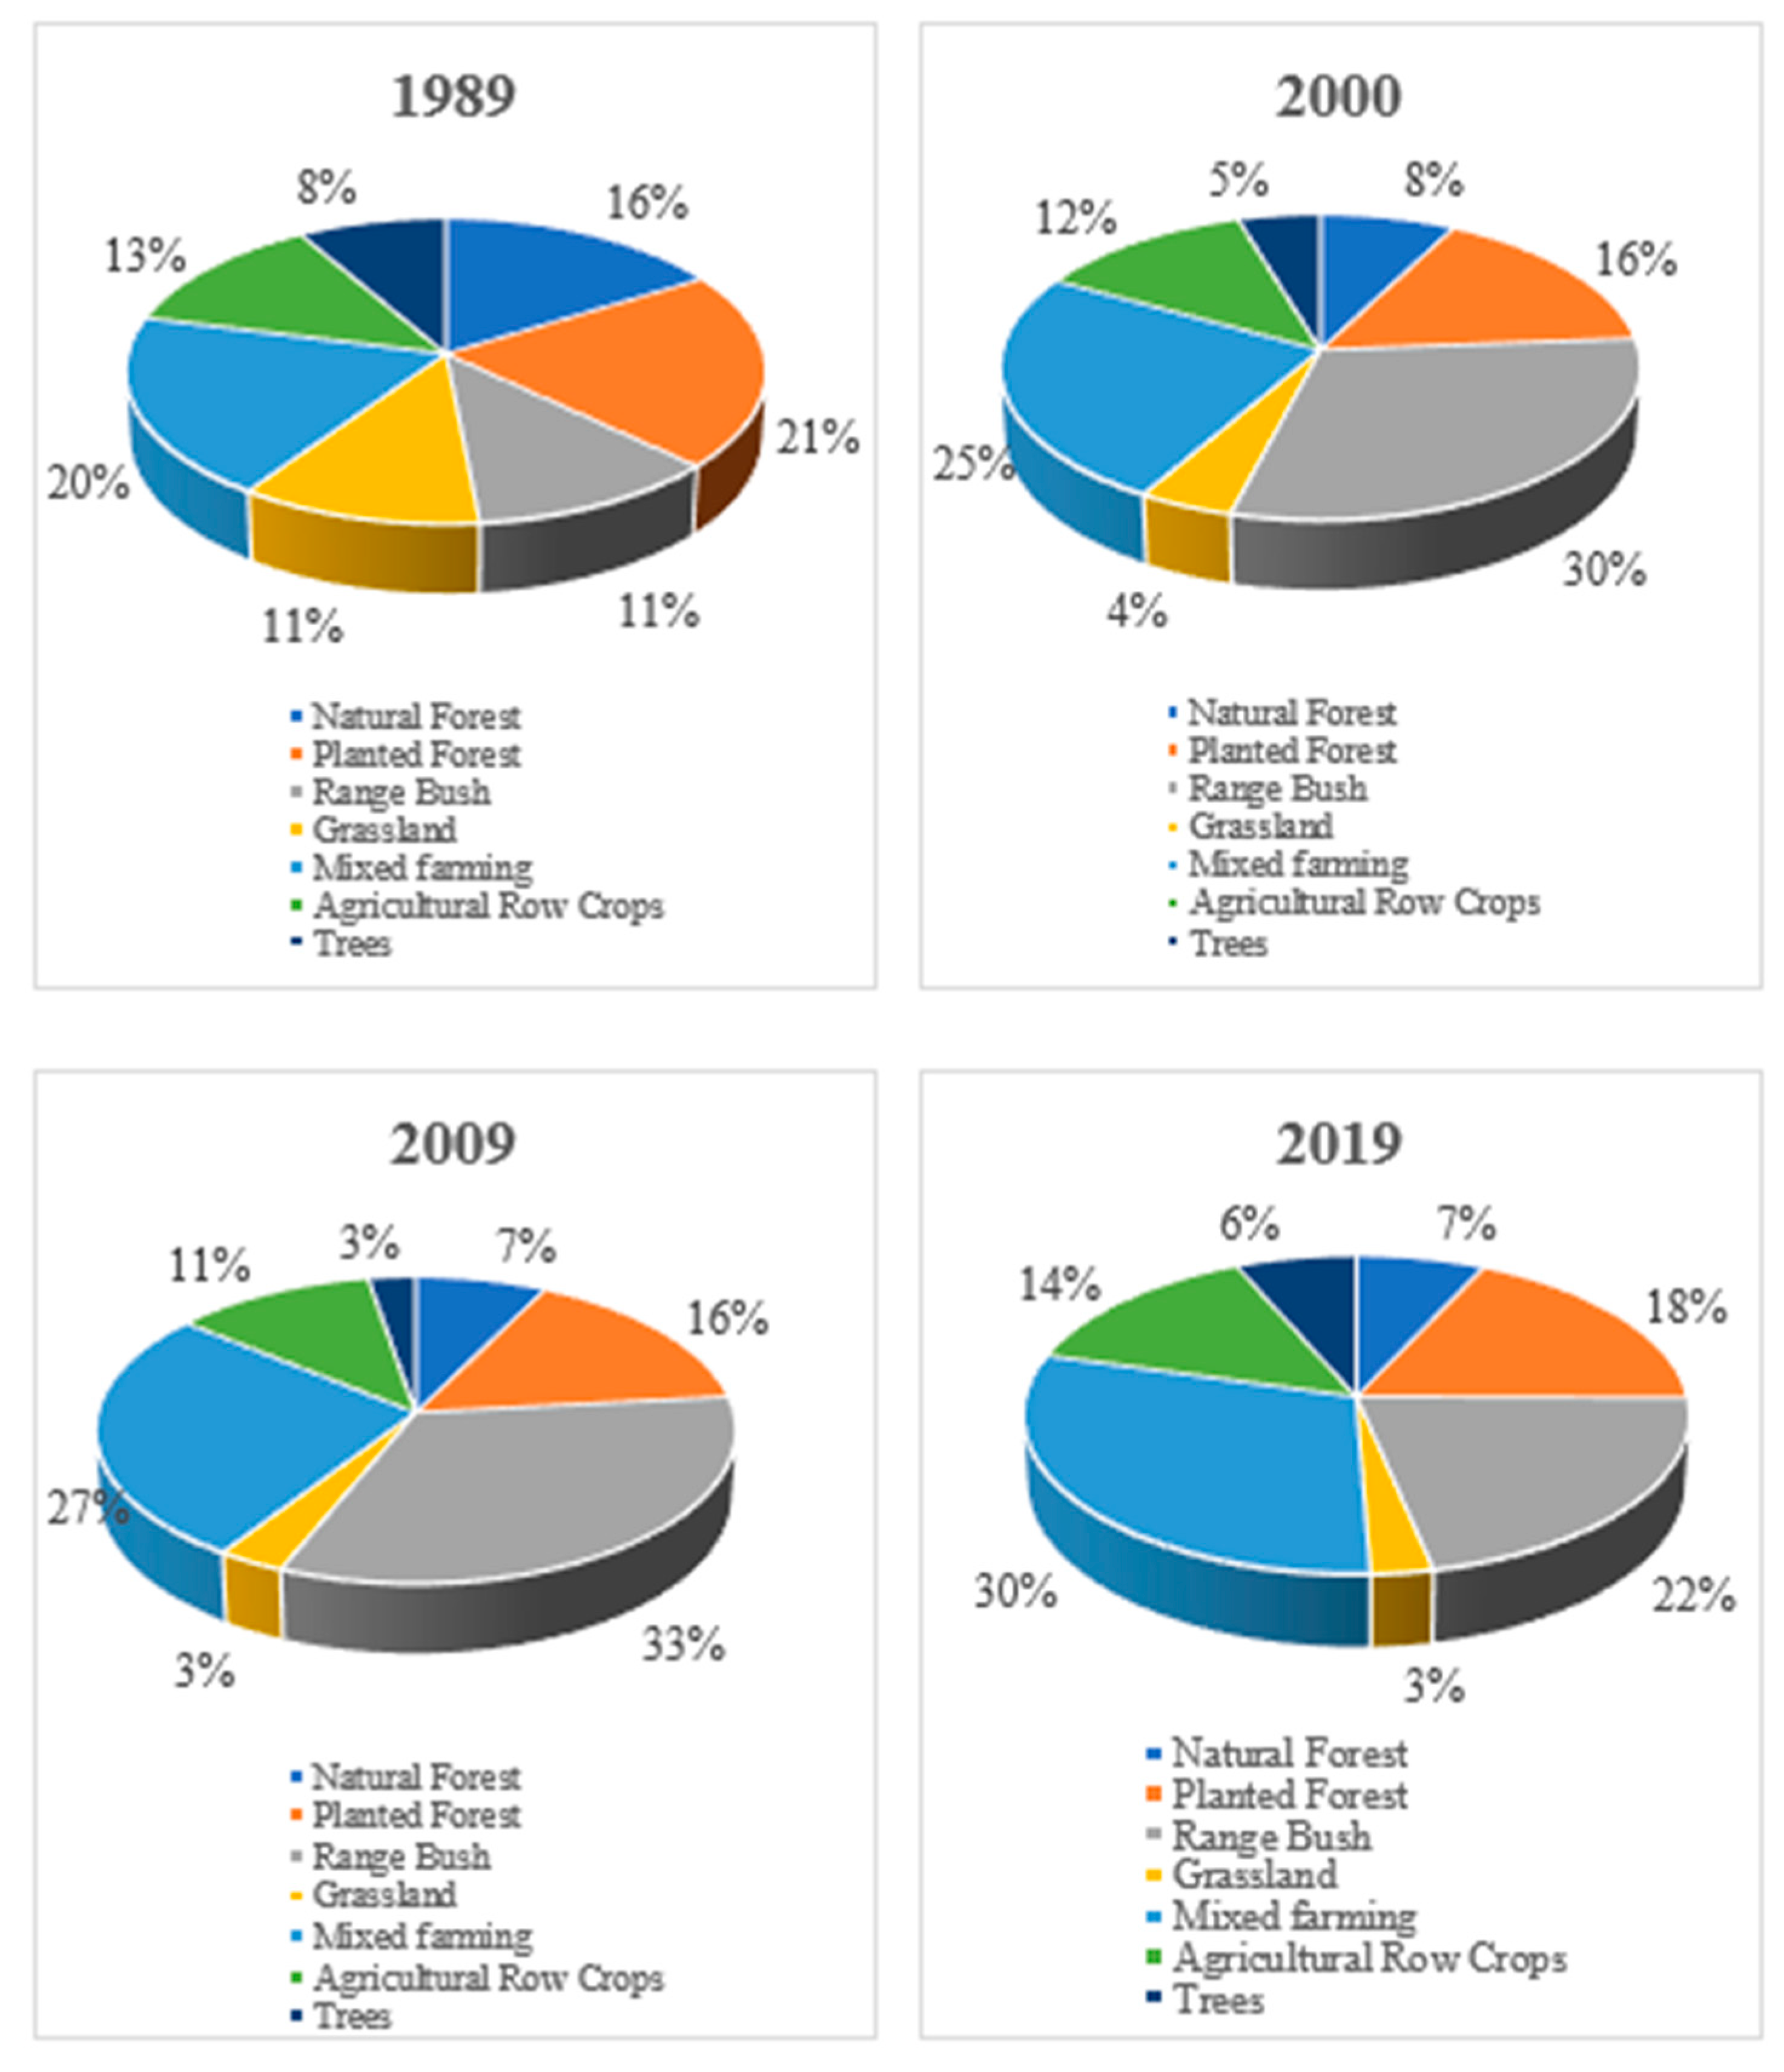
The observed changes in catchment flows and yield are in line with land cover changes where forest cover is converted into agricultural farms and the land is fragmented into smaller sizes for mixed farming (
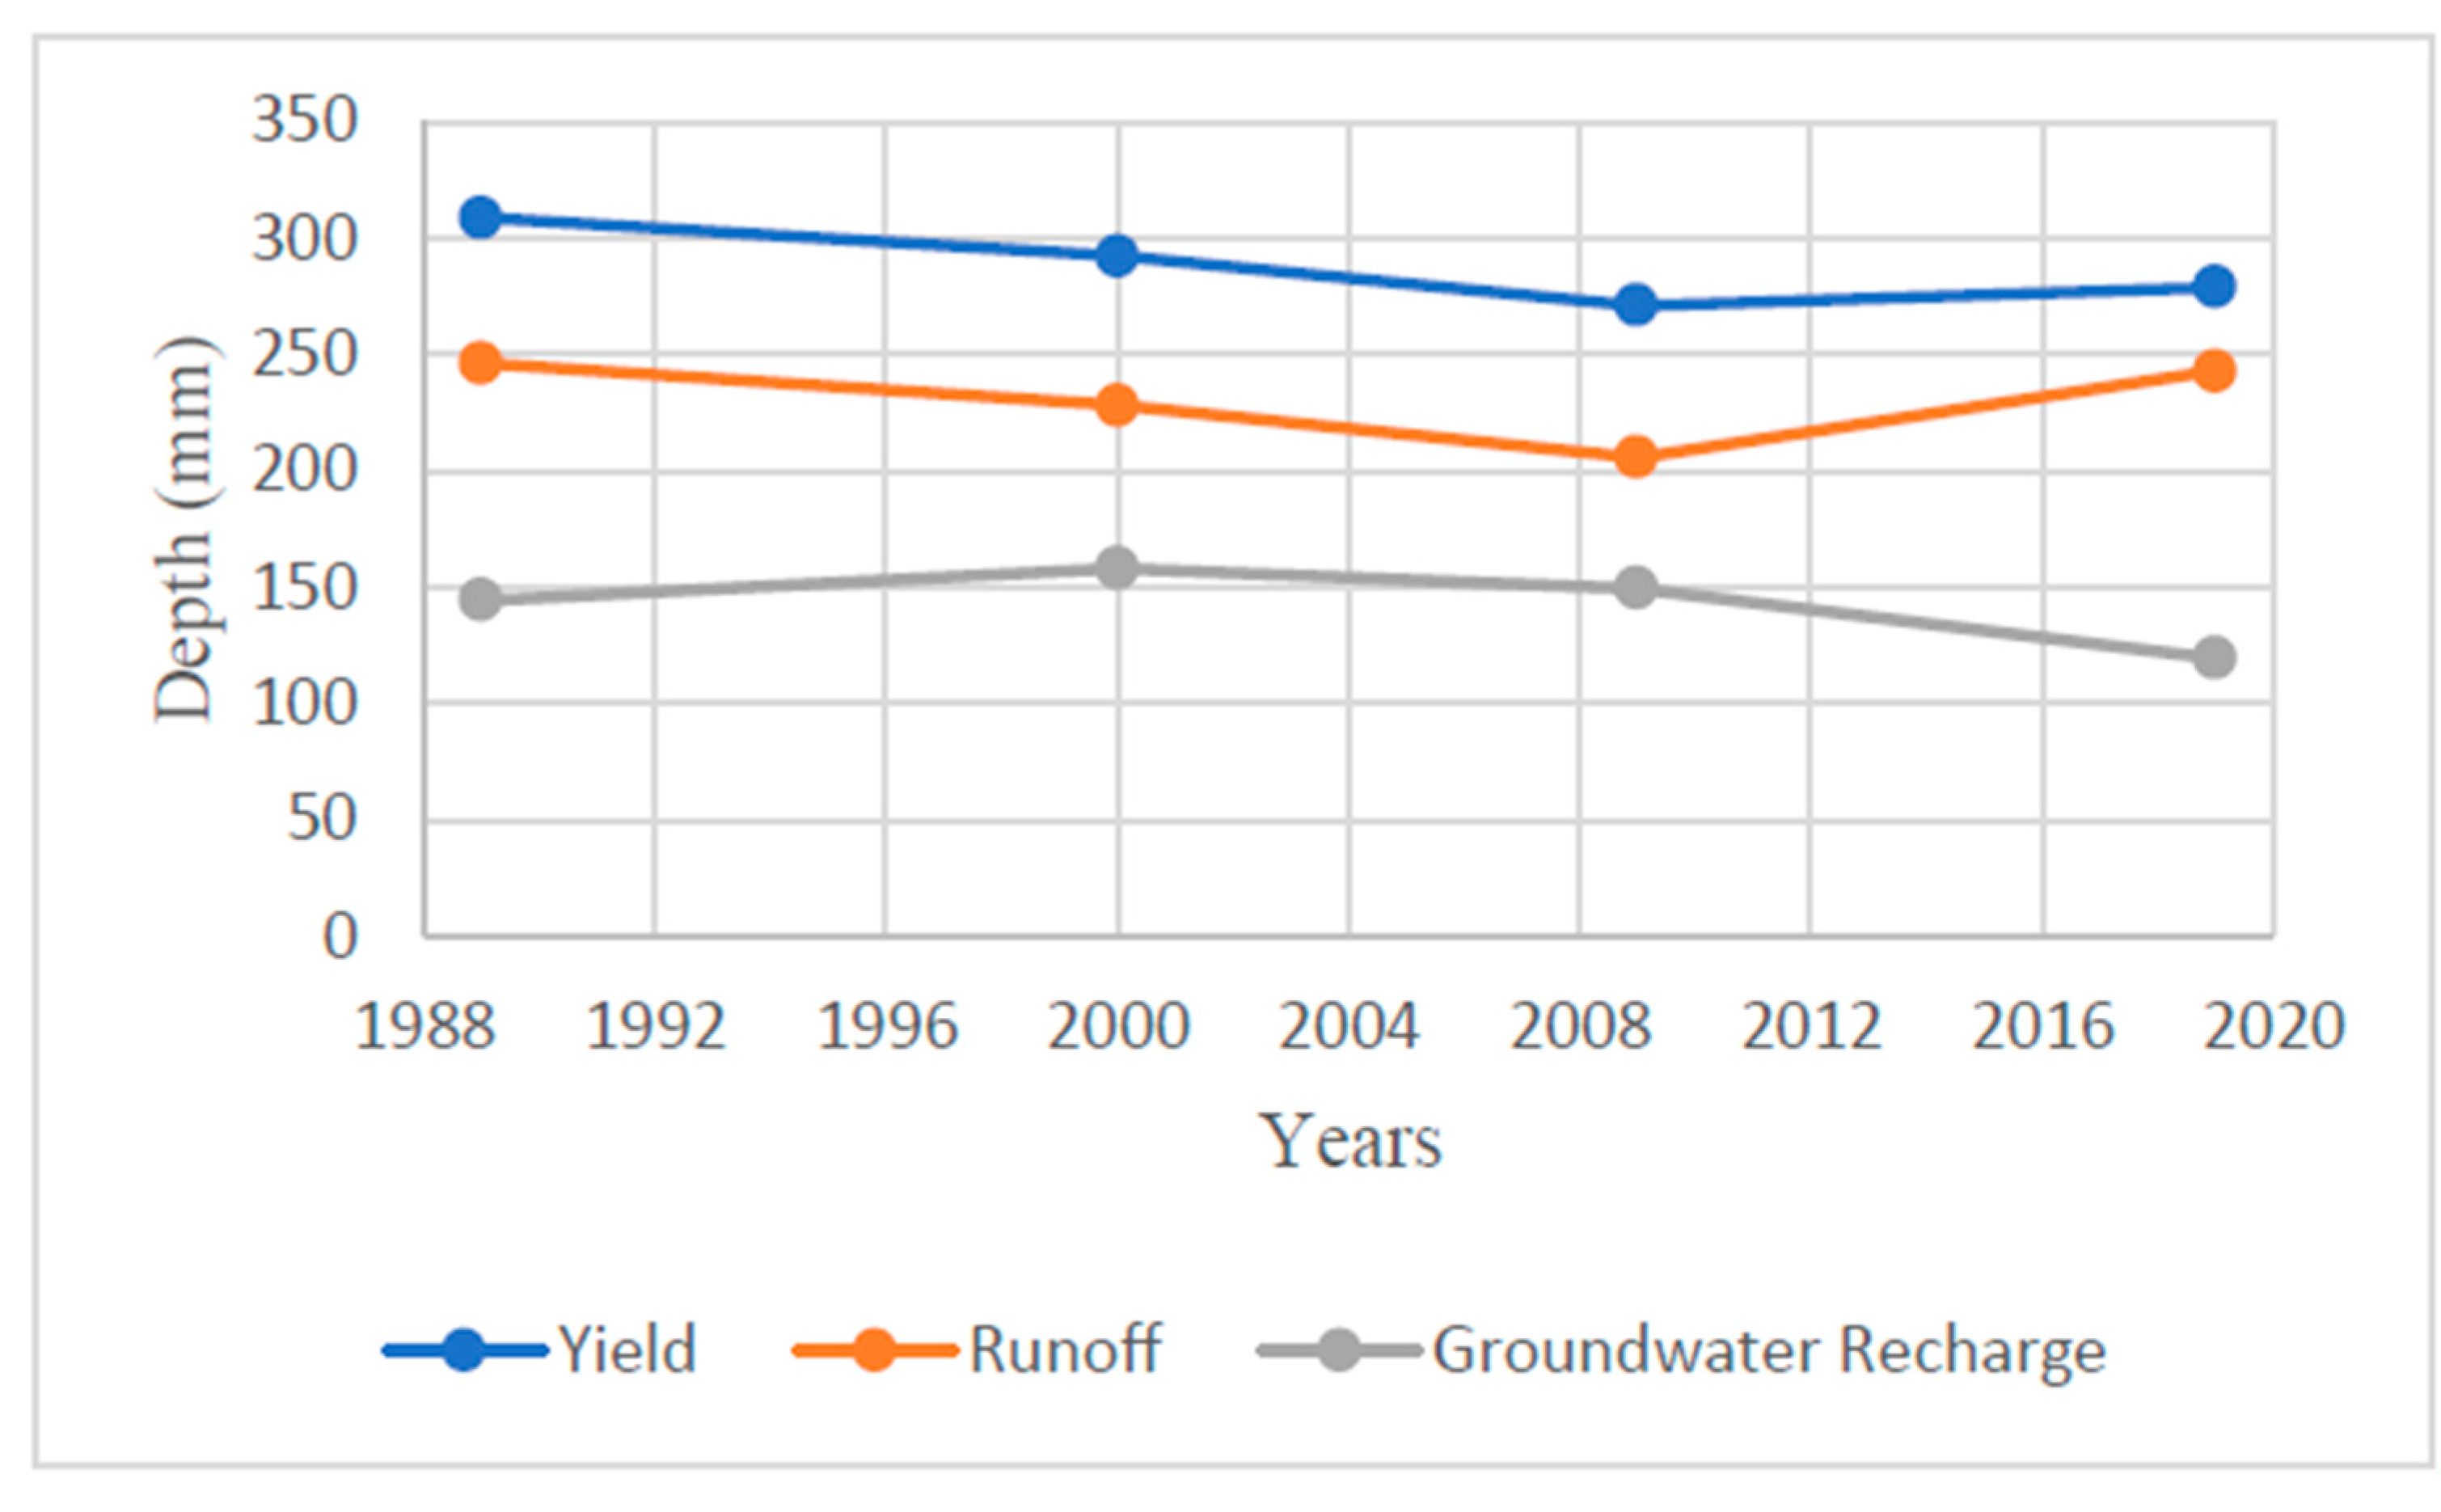
Figure 11). The catchment yield decreases progressively (
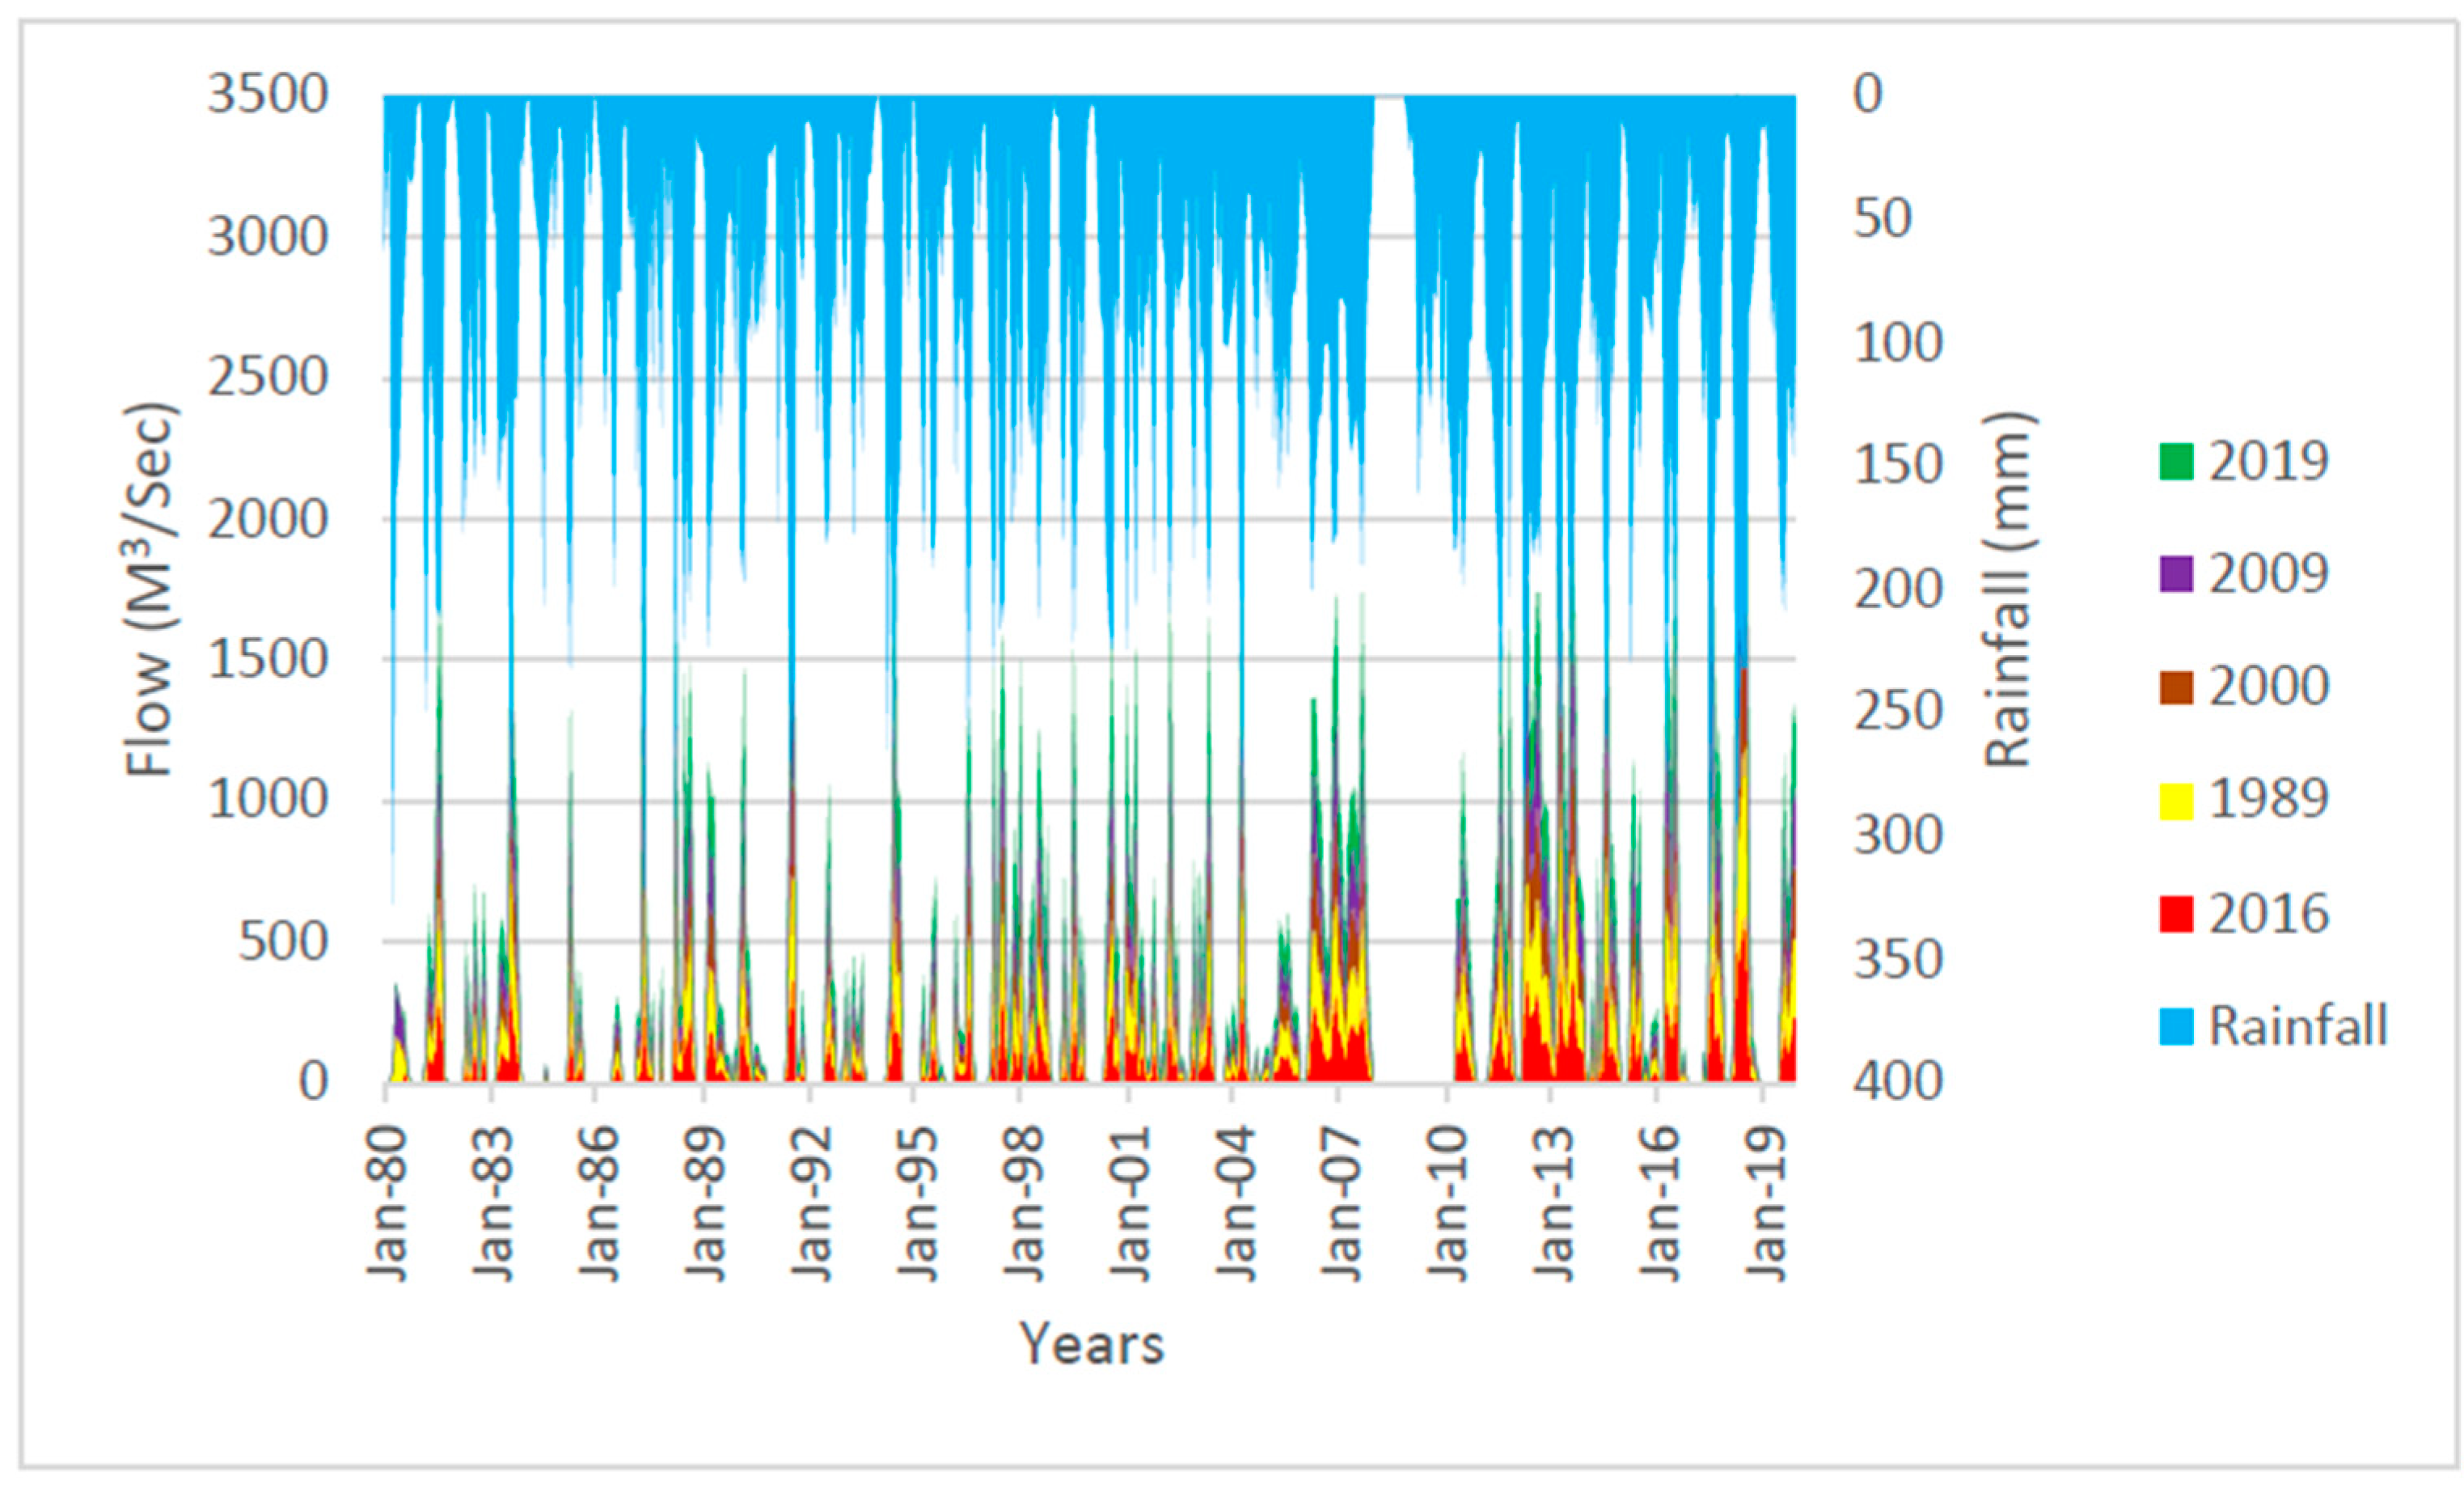
Figure 12). During the early years, the catchment was observed to have a high yield with continuous flows having a little variation. However, this changed with 2019 receiving heavy rains; the yield remained below that of 1989 (
Figure 13). The low flows of 2016 could be observed (
Figure 13), which impacted negatively on the storage of the two reservoirs in the catchment, resulting in water levels dropping below the inlet point for water treatment works. This further occasioned an acute shortage of water in Eldoret in late 2016 through to 2017. The land use for 2019 improved the catchment yield slightly in comparison to the previous years.
The change in hydrologic response of the Kaptagat catchment over time for the period of 1989–2019 can be attributed to the change in forest cover. Decreased forest cover from 1989–2009, because of charcoal burning and illegal logging, is most likely to have led to the decrease in the infiltration and, hence, percolation because of decreased surface roughness. Evapotranspiration also was likely to have been reduced and hence, affected the hydrological cycle of the catchment. Therefore, the effect of these changes was likely a reduction in precipitation, an increased proportion of the rainfall converted to runoff, and decreased groundwater recharge.
The occurrence of the described phenomenon is observed to have been gradual. At first, when the forest cover decreased, groundwater increased due to decreased evapotranspiration, as can be seen in the year 2000 (
Table 3). However, the groundwater continued to replenish streamflow for some time. However, because of the low levels of infiltration and the spaces available in the river networks in the catchment, resulting from subsided flow levels, the replenishment of groundwater was low, and it started to deplete. With little groundwater and variability in rainfall, combined with increased bare land, surface streamflow in the catchment varied greatly, as observed by the community.
The above-observed phenomenon can be summarized to be because of the increased proportion of rainfall being converted to runoff and the decline in evapotranspiration due to reduced forest cover. It was observed that the SWAT model is sensitive to the shallow aquifer threshold level in defining the relationship between streamflow and groundwater, which is in line with the observed phenomenon [
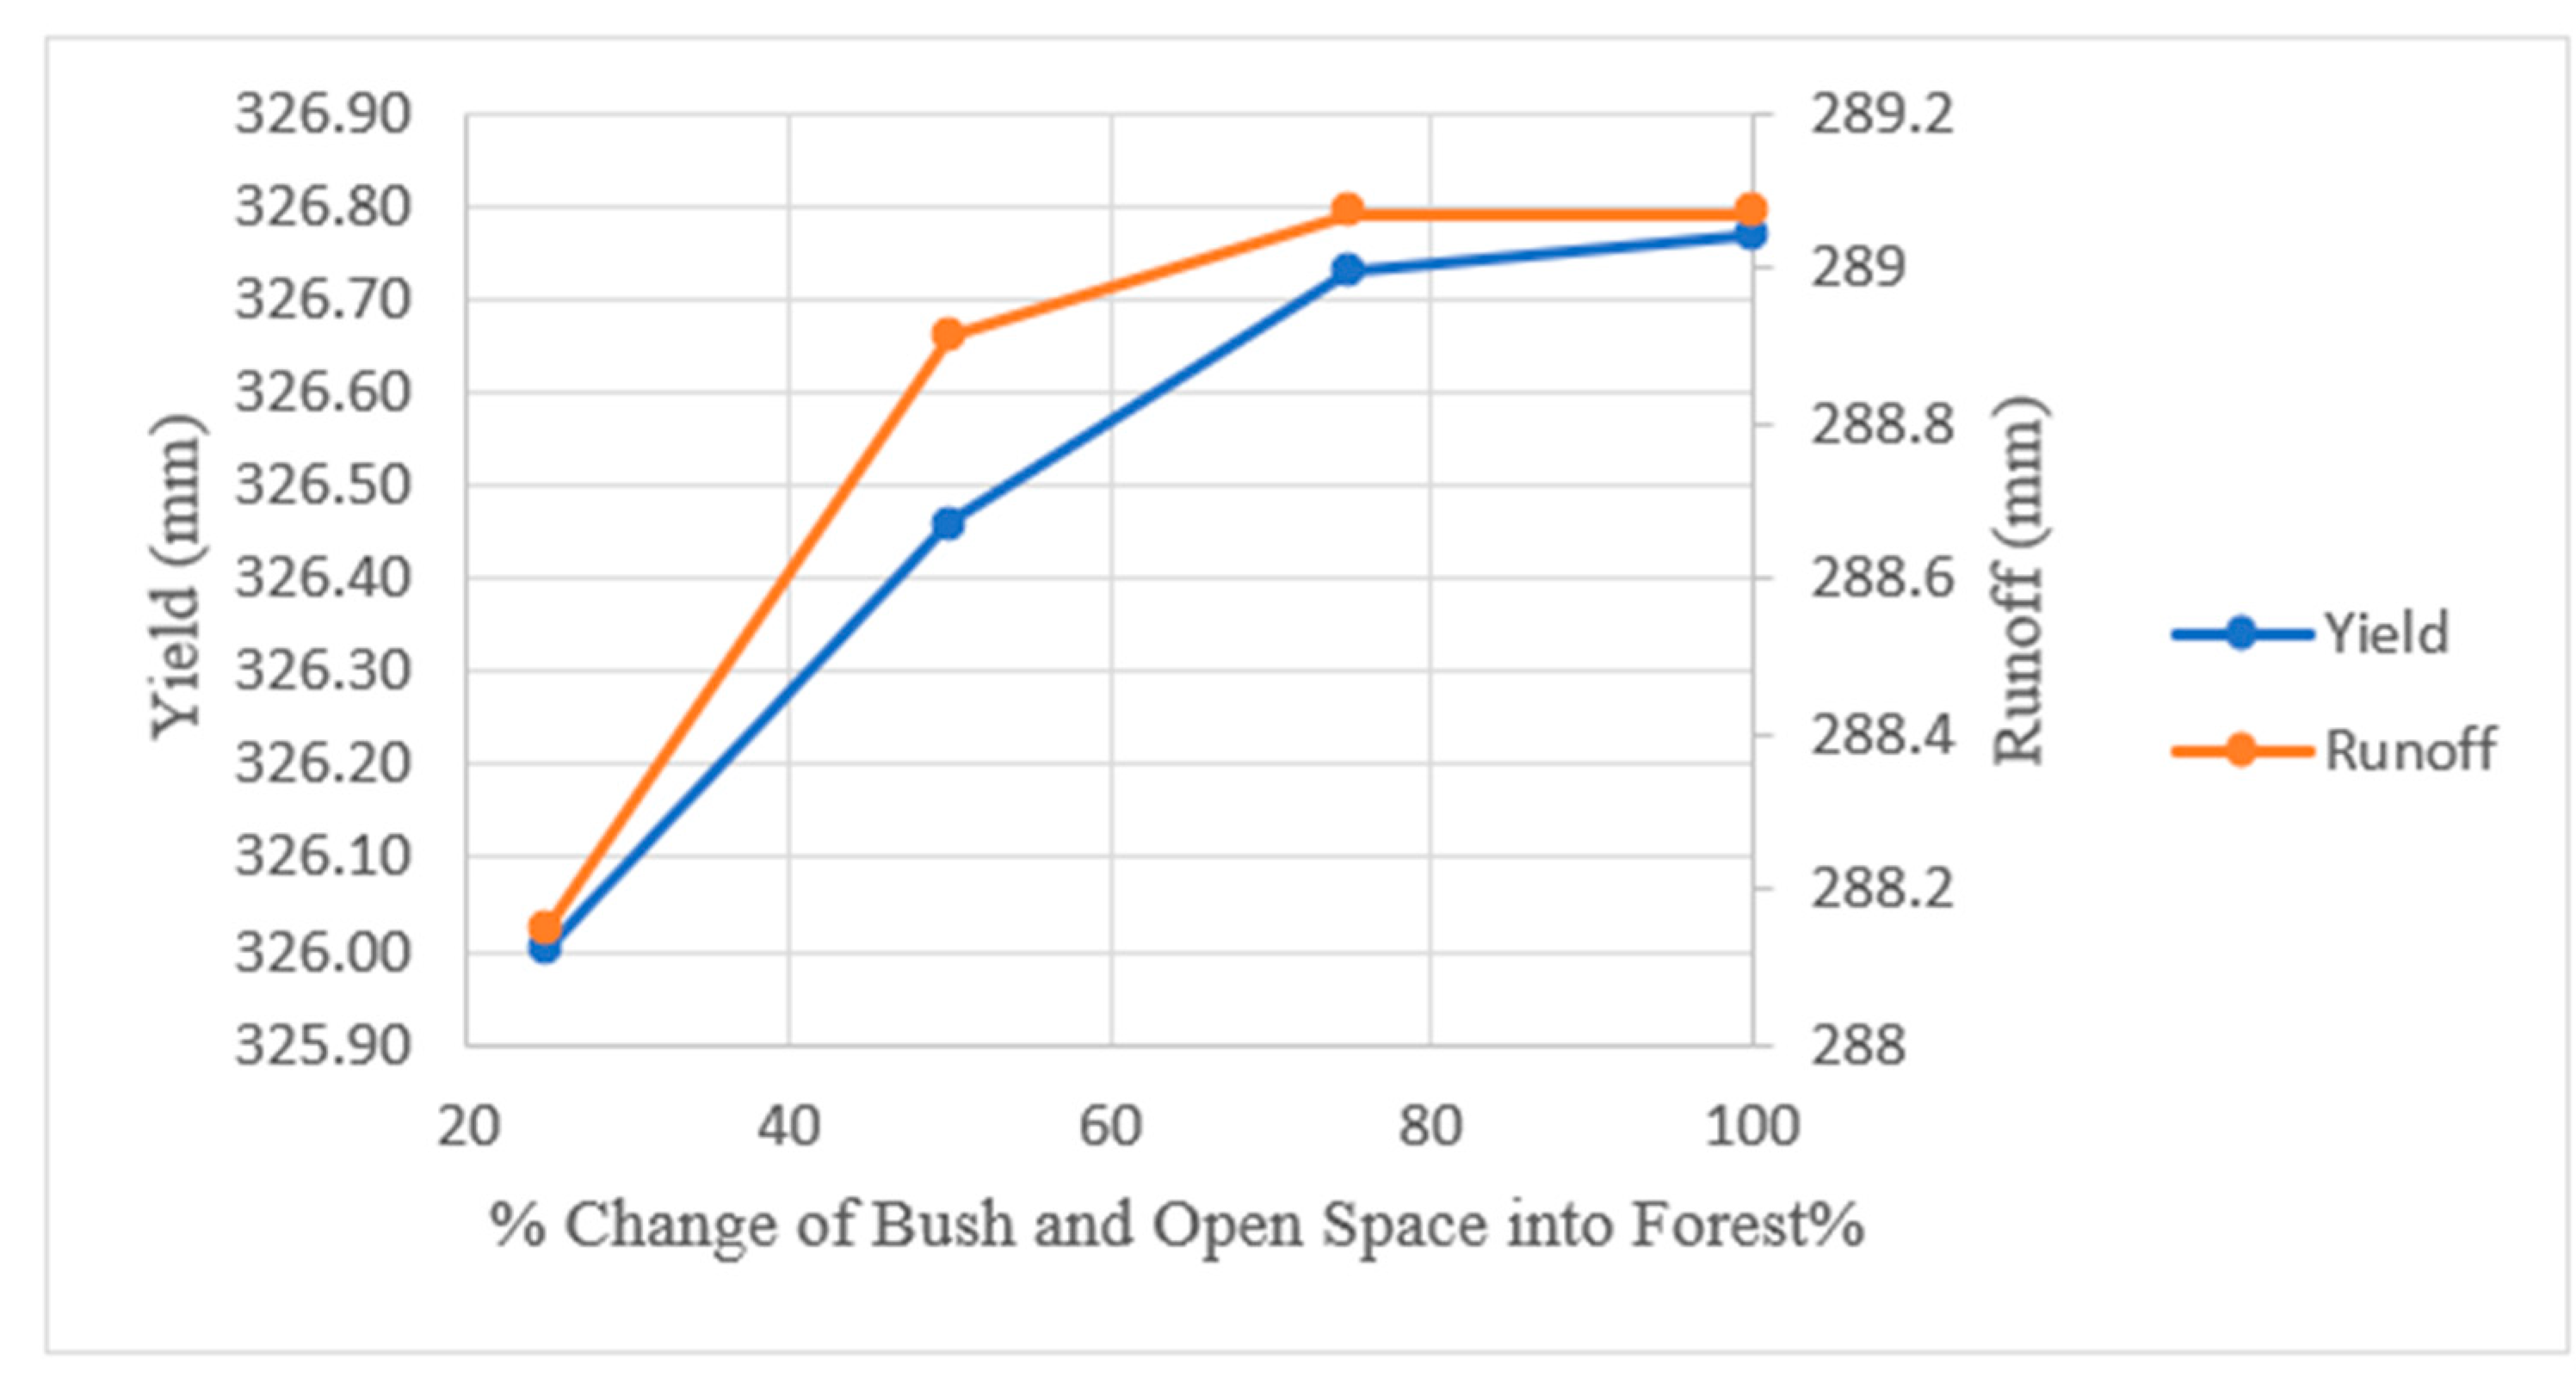
16]. The effect of land management practices, where farmers were encouraged to plant bamboo plantations and forest land was reclaimed for reafforestation, hence increasing vegetation cover, could be observed by the decreased runoff and groundwater recharge and increased catchment yield in 2019 (
Figure 12). However, the practice needs to be improved and sustained until the groundwater aquifers are recharged to sustainable levels.
The increasing human settlement and agricultural activities in the catchment translate to increasing water demand. With the high variability in river flows and reservoir storage levels, flower farms and a few intensive agricultural farms and industries have resorted to sinking boreholes. This further depletes the diminishing groundwater in the catchment, hence the continuous decrease, as observed in
Table 2. Inter-annual rainfall variability remains high. With the decreasing rainfall events and increasing rainfall intensity [
24], there is a likelihood of increased water demand vis-a-viz the availability. Therefore, there is a need to enact additional mitigation measures in addition to the simulated measures already being enacted, such as planting trees in the open spaces and bush areas that were previously forests and destroyed, and planting trees for commercial purposes in agricultural land. Further mitigation measures, such as harvesting surface runoff (e.g., water pans), terracing and the planting of strips of tea plantations on agricultural land with slopes ≥25% to recharge groundwater and for use in agricultural activities will hasten the process of recharging the diminished aquifers in the catchment. To ensure sustainability, the cost of these mitigation measures should be offered by downstream users to the upstream farming communities for their efforts in providing watershed protection ecosystem services.
5. Conclusions
To target and implement land use management practices in the Kaptagat catchment to improve its yield, SWAT modeling is an important decision-making tool. However, the availability of observed accurate streamflow data is necessary for the calibration and validation of simulated streamflow. The availability of land use, climate, and flow data made it possible for the modeling and understanding of the changing hydrologic response of the Kaptagat catchment that has been taking place over time. However, the observed bias between the observed data and the model output is attributed to inadequate observed data, which limits the model’s ability for its application in day-day management decisions, even though it may be sufficient to hypothetically examine the impacts of land use and climate on river discharge. Furthermore, [
25] a decline in monitoring networks was noted, suggesting the adoption of short planning periods. However, it is a predicament since long-term planning cannot be done.
The method applied involved obtaining the available climate and streamflow data from the Meteorological Department and Water Resources Authority (WRA). Sentinel land use data were used for the identification of dominant land use to be used for the supervised classification of Landsat images. The model was calibrated and validated for the simulation of land use change for at least the last three decades, 1989 to 2019. The study illustrated the effects of land use change on catchment yield, flow, and groundwater. The positive effects of management measures already in place were also observed. The Kenya Forest Service, in collaboration with ELDOWAS, local administration, and the Ministry of Agriculture at a county level, should continue working with the local community within the catchment to realize an increase in forest cover, terracing and the planting of tea plantation strips on agricultural lands with steep slopes and the protection of natural springs. Environmental conservation initiatives should also be implemented through payments for environmental services by downstream users offering incentives to upstream farming communities, in exchange for managing their land and resources for providing environmental services.
Further, there is a need for modeling of sediment transport and groundwater in the catchment, as they play a role in the amount of water stored in the catchment reservoirs and river flows. In the current state, the hydrologic response of the Kaptagat catchment is significantly improving and management practices taking place should be sustained.


