Abstract
To investigate whether increasing trade openness results in more severe environmental problems, this study investigates the impact of trade openness on carbon dioxide (CO2) emissions using panel data from 64 countries along the Belt and Road from 2001–2019. Fully considering the potential heterogeneity, the panel quantile regression approach is utilized. Moreover, this study explores the three major mediating effects of the process, namely the energy-substitution effect, economic effect, and technology effect. The empirical results indicate that the improvement in trade openness has a significantly positive effect on CO2 emissions, and it also shows that the impact varies with different levels of CO2 emissions. Furthermore, the indirect effect of trade openness on CO2 emissions via the economic effect is positive, while the indirect effect via the energy-substitution and the technology effect is negative. Therefore, it is necessary to improve renewable energy consumption, decrease energy intensity, and formulate related policies to reduce carbon emissions policies in terms of local conditions.
1. Introduction
The world today is characterized by economic globalization and integration, partly embodied in various regional economic cooperation agreements. One of the most efficient agreements is the Belt and Road Initiative (BRI) launched by China in 2013. As of January 2021, the number of countries that have joined the BRI with China amounted to 140, which accounts for more than 60% of global countries. Although the BRI is devoted to reducing poverty, accelerating technology development, and promoting people’s welfare, some energy and environmental problems such as excessive carbon dioxide (CO2) emissions have accompanied this boom in trade [1]. From 2001 to 2019, the country’s CO2 emissions increased from 24 billion tons to 34 billion tons, based on statistics from British Petroleum Ltd. Such rapid growth of CO2 emissions will not only induce a series of environmental problems, including increasing the temperature of the climate, the risk of natural disasters, and creating more pressure on resources [2], but also economic problems, such as reducing the annual GDP growth as much as 10% after 80 years [3]. Therefore, the excessive CO2 emissions have been a major concern, and mitigating these emissions has also been one of the greatest challenges for the whole world [4].
With regard to the significant role of the BRI, it is considered as China’s general plan of trade openness and international cooperation [5]. Although the novel coronavirus has partially broken the global trade system, in the first four months of 2020 the total trade volume between China and the BRI countries still maintained a positive growth trend. According to statistics from China Customs, China’s total imports and exports to the Belt and Road countries reached USD 388.19 billion, achieving an increase of 0.9%. Meanwhile, exports to the member countries of the Association of Southeast Asian Nations (ASEAN) were worth USD 104.21 billion, with an increase of 3.9%. Therefore, the BRI has significantly promoted the degree of trade openness.
Along with the rapidly increasing trade openness and CO2 emissions, Shahzad et al. [6] suggested that trade openness is one of the positive contributors to CO2 emissions. However, to the best of our knowledge, few studies have explored the relationship between trade openness and CO2 emissions from the perspective of heterogeneity and mediating effects, especially for the case of the BRI countries. Meanwhile, the mediating mechanism has not been systematically examined to date. To be more specific, significant differences exist in CO2 emissions across the Belt and Road countries, and the relationship may be heterogeneous with regard to different levels of CO2 emissions.
Aiming at those literature gaps, this study explores the association between trade openness and CO2 emissions by employing a panel dataset for 64 countries along the Belt and Road from 2001 to 2019, using the approach of panel quantile regression. Furthermore, this study investigates the impact mechanism of trade openness on CO2 emissions through three major potential mediators, which are substitution channel, economic channel, and technique channel. Therefore, the contributions of this study are as follows. Firstly, it explores whether trade openness resulting from the launch of BRI can affect CO2 emissions in the Belt and Road countries; and secondly, it addresses the impact mechanism of trade openness on CO2 emissions. This not only provides a more comprehensive analysis of this issue in those countries along the Belt and Road, but also identifies the factors that can mitigate CO2 emissions. Thirdly, previous studies have ignored the skewed distribution of CO2 emissions, which may result in biased findings. Therefore, the panel quantile regression approach is employed in this study to capture the potential heterogeneity.
The remainder of the study is organized as follows. Section 2 presents the relevant literature about trade openness and CO2 emissions. Section 3 puts forward hypotheses and describes the data description and model specification. Section 4 empirically analyzes the impact of trade openness on CO2 emissions, and considers endogeneity and robustness checks. Section 5 further discusses the mediating effect between trade openness and CO2 emissions. Section 6 provides conclusions and potential implications.
2. Literature Review
2.1. Literature on the Association between Trade Openness and CO2 Emissions
Since the early 1990s, with the rapid increase in trade openness and gradually worsening environmental problem, a large and growing body of literature has investigated the role of trade openness in CO2 emissions. Firstly, several studies indicate that there is a positive relationship between trade openness and CO2 emissions. Empirically, taking Pakistan as an example, Shahzad et al. [6] suggested that the elasticity is 0.122% for the short run and is 0.247% for the long run. However, by inducing square and cubic terms of trade openness, it is found that, in the long run, this positive relationship is linear, but it appears to have a nonlinear cubic-form in the short run [7]. Furthermore, there is not only a one-way causation between trade openness and CO2 emissions, but also a long-run positive feedback relationship—namely, they are a Granger Cause for each other [8]. Moreover, the relationship between trade openness and CO2 emissions is also affected by other factors, such as the level of income and economic growth [9].
Secondly, prior studies suggest a negative association between trade openness and CO2 emissions as well. From the micro firms’ perspective, Cui et al. [10] argued that increased openness to trade will require firms to adopt newer, cleaner, and more renewable energy, which reduces greenhouse gas emissions [10]. Furthermore, trade openness will lead firms to expand their production scale, which supports more investments in abatement emissions [11]. Empirically, taking OECD countries as an example, although a significantly negative relationship is captured, the effect is quantitatively very weak [12]. From the energy demand’s perspective, Rafindadi [13] indicated that trade openness supports financial development, and then lowers CO2 emissions.
Thirdly, results from earlier studies also demonstrate a mixed association between trade openness and CO2 emissions. For instance, the study undertaken in Ghana suggested that there are both positive effects (scale and composition effect) and negative effects (technique effect) of trade openness on CO2 emissions, but the former override the latter [14]. Moreover, the relationship presents heterogeneity with different degrees of development [15] and the types of sectors [16]. Concerning the degrees of development, the association is negative for the developed G-20 member countries, while it is positive for the developing member countries. With regard to the types of sectors, the relationship is negative for the industrial sectors, while it is positive for the export sectors.
2.2. Literature on Other Factors Influencing CO2 Emissions
Apart from trade openness, there are also other factors influencing CO2 emissions, such as population, levels of economic and financial development, and technology. Firstly, the factor of population that plays an important role in CO2 emissions mainly refers to population density [1], population growth [17], and urbanization [18]. Concerning population density, as the population density increases, the total CO2 emissions will increase, but the per capita CO2 emissions will decrease [19]. Regarding population growth, previous studies have not reached a consistent conclusion. Owusu [20] suggested the relationship between population growth and CO2 emissions is positive, but Begum et al. [21] believed it has no significant impact on CO2 emissions. Concerning urbanization, although the significantly positive role of urbanization is demonstrated [22], the strength of the impact depends on other factors as well, such as the number of college graduates [23], regions [24], and per capita GDP [25]. Furthermore, even tourism rather than urbanization will also increase CO2 emissions [26].
Secondly, the relationship between levels of economic and financial development specific to environmental pollution (mainly refers to CO2 emissions) is widely known as the Environmental Kuznets Curve (EKC), which indicates a non-linear inverted U-shape association. Khan et al. [27] and Auci and Trovato [28] empirically examined whether EKC holds for specific regions and periods, indicating that it does not hold for all datasets. Specifically, EKC holds for BRICS economies and BRI countries, but not for EU countries.
Thirdly, some technological factors, such as iron and steel-making processes [29], energy consumption structure [30], and energy intensity [31] also affect CO2 emissions. CO2 emissions are also the most significant among energy-related greenhouse gas emissions [32]. Improving the technology level produces a reduction in CO2 emissions [33]. Quantitatively, taking China as an example, it is found that the effects of energy intensity slow the growth of carbon emissions by 79%. Furthermore, the effect of the energy structure on mitigating CO2 emissions shows a heterogeneity among various sectors, and it is positive only in the agricultural and transportation sectors [34].
2.3. Literature Gap
Although extant studies have made great efforts to focus on the issues related to CO2 emissions, some literature gaps still exist. First, few studies have explored the impact of trade openness on CO2 emissions for the largest economic cooperation platform, the Belt and Road countries. Second, few studies have investigated the mediating impact mechanism of trade openness on CO2 emissions for the Belt and Road countries. Third, significant differences may exist in trade openness and various quantile levels of CO2 emissions. The impact of trade openness on CO2 emissions by quantile can be heterogeneous, which is also overlooked by the existing literature.
3. Methodology and Data
3.1. Hypotheses
In recent decades, a large volume of published studies have described the role of trade openness in CO2 emissions. However, the relationship between trade openness and CO2 emissions is somewhat mixed so far, which partly results from various mediating impact mechanisms (see Section 2.1). This study puts forward three major mechanisms of trade openness and CO2 emissions, namely the energy-substitution channel, economic channel, and technology channel.
The energy-substitution channel refers to “trade openness—renewable energy consumption—CO2 emissions”. It is a systematic theory at the level of energy investment and environmental problems in a sustainable development space. Under the context of globalization, trade openness has made all countries more active in importing, exporting, and foreign direct investment (FDI) [35], and it has also led, more specifically, to a further increase in energy investment from the perspective of energy. From a domestic perspective, the increasing investment in renewable energy with trade openness is transformed into domestic renewable energy consumption. Thus, trade openness will improve the energy consumption structure, and eventually reduce CO2 emissions. Therefore, this study puts forward H1:
Hypothesis 1 (H1).
In the energy-substitution channel, renewable energy consumption is a negative mediating variable, namely, trade openness reduces CO2 emissions by improving renewable energy consumption.
The economic channel refers to “trade openness—GDP—CO2 emissions”. The impact of trade openness on GDP is mainly reflected in two aspects, namely the externalities of technology and economies of scale. Firstly, the effect of knowledge spillovers is an important driving force for innovation growth. Both import trade and export trade can expand the market scale and significantly increase the knowledge stock within the economy, provide a good environment for companies to imitate advanced technology, and thereby form a guiding effect to promote GDP [36]. Secondly, trade openness can also drive the in-depth development of economies of scale, bring the actual output of enterprises closer to the potential maximum output, improve business performance, and promote economic growth [37]. About the relationship between GDP and CO2 emissions, EKC indicates that the association is positive at first but negative in the long run. Therefore, this study proposes H2a and H2b:
Hypothesis 2a (H2a).
In the economic channel, GDP is a positive mediating variable, namely, human economic activities lead to economic growth, through the production of goods and services that frequently produce carbon dioxide and thereby increase CO2 emissions.
Hypothesis 2b (H2b).
In the economic channel, GDP is a negative mediating variable, namely, trade openness promotes GDP, and then economic growth decreases CO2 emissions.
The technology channel refers to “trade openness—energy intensity—CO2 emissions”. In terms of the principles of energy economics, trade openness will reduce energy intensity [38]. This effect can be reflected through the structural effect and technological effect. The former refers to the changes in the industry structure caused by trade openness. For the Belt and Road countries, trade openness has promoted their economic transformation, and more energy-intensive industries will turn to less energy-intensive service industries, which has promoted the optimization and upgrading of their industrial structure and thereby reduced the energy intensity [39]. Moreover, the latter refers to channels such as independent research and development, direct introduction of foreign advanced technologies, and technological diffusion caused by FDI [40]. The use of advanced technologies and production processes, more effective energy-saving, and emission-reducing equipment will reduce industrial energy intensity [41]. In this study, the ratio between primary energy consumption (such as coal, oil, natural gas, and hydropower) and total GDP is employed to measure energy intensity [1]. The relationship between primary energy and CO2 emissions depends on the proportion of fossil fuels in the primary energy [42]. Therefore, H3 is hypothesized as follows:
Hypothesis 3 (H3).
In the technology channel, energy intensity is a negative mediating variable, namely, trade openness decreases CO2 emissions by lowering energy intensity.
The role of trade openness in CO2 emissions may take effect via the energy-substitution channel, the economic channel, and the technology channel. The total effect is the combined effect of the three channels. While both the energy-substitution channel and the technology channel are negative, the economic channel is unclear. Moreover, the relationship between trade openness and CO2 emissions is affected by other factors, so the association may show heterogeneity. These national-level factors will affect the conditional distribution of CO2 emissions, so that the heterogeneity will be reflected in CO2 emissions by quantile [43]. Therefore, this study proposes H4a, H4b, and H5:
Hypothesis 4a (H4a).
The total effect of trade openness on CO2 emissions is positive.
Hypothesis 4b (H4b).
The total effect of trade openness on CO2 emissions is negative.
Hypothesis 5 (H5).
The relationship between trade openness and CO2 emissions shows heterogeneity in terms of CO2 emissions by quantile.
3.2. Econometric Model
In terms of the hypotheses, this study specified the empirical model as follows:
In Equation (1), is the control variable j, and co2emissions and tradeopenness represent the degree of CO2 emissions and trade openness, which are the dependent variable and the key independent variables, respectively. Besides, to avoid the bias of variables omission, this study chose nine variables as control variables, namely financial development level, fossil fuel energy consumption, urbanization level, net foreign direct investment inflows [44], total fixed capital formation, density of population, annual growth rate of household final consumption expenditure, the number of R&D researchers, and coal rents [45]. Table 1 summarizes the detailed specifications on the variables.

Table 1.
Details of variables.
3.3. Data Description
The dataset of this study is from the panel data of 64 Belt and Road countries, which have joined BRI before the end of 2016 (see Table 2). In detail, 2 countries (Mali and Morocco) are from Africa, 2 countries (Mongolia and China) are from Eastern Asia, 10 countries (Singapore, Malaysia, Indonesia, Myanmar, Thailand, Lao, Cambodia, Vietnam, Negara Brunei Darussalam, and Philippines) are from ASEAN, 16 countries (Iran, Iraq, Turkey, Syrian Arab Republic, Jordan, Israel, Saudi Arabia, Yemen, Oman, United Arab Emirates, Qatar, Kuwait, Bahrain, Greece, Cyprus, and Egypt) are from Western Asia, 8 countries (India, Pakistan, Bangladesh, Afghanistan, Sri Lanka, Maldives, Nepal, and Bhutan) are from South Asia, 5 countries (Kazakhstan, Uzbekistan, Turkmenistan, Tajikistan, and Kyrgyz) are from Central Asia, 5 countries (Ukraine, Belarus, Georgia, Azerbaijan, and Armenia) are from the Commonwealth of Independent States (CIS), and 16 countries (Poland, Lithuania, Estonia, Latvia, Czech Republic, Slovakia, Hungary, Slovenia, Croatia, Bosnia and Herzegovina, Montenegro, Serbia, Albania, Romania, Bulgaria, and North Macedonia) are from Central and Eastern Europe.
Table 2.
The 64 countries along the Belt and Road.
The result of descriptive statistics is displayed in Table 3. The maximum value of trade openness is 437.33%, which occurs in Singapore, and the minimum value is 0.17%, which is specific to Afghanistan. The mean value of trade openness is 93.34%, and the standard error is as high as 55.12%, which indicates that 64 countries have relatively high differences in trade openness. Meanwhile, the maximum value of CO2 emissions is 43.9083 metric tons per capita, which occurs in Qatar, and the minimum value is 0.0371 metric tons per capita, which occurs in Afghanistan. The mean value of CO2 emissions is 6.4852, and the standard error is 8.3338, which also indicates that the data vary widely. Moreover, the maximum value of financial development level is 255.31%, which occurs in Cyprus, and the minimum value is 0.19%, which occurs in Afghanistan as well. The mean value of financial development is 41.3341, and the standard error is 39.3178, which also indicates quite different levels of financial development.
Table 3.
Descriptive statistics.
4. Empirical Analyses
This study utilizes the national panel data from 64 countries along the Belt and Road from 2001 to 2019 to empirically investigate the impact of trade openness on CO2 emissions. Therefore, the dataset is a short panel. However, to avoid estimation bias caused by non-stationarity, especially the unreliable estimation result caused by spurious regression, this study carries out unit root tests as well. In terms of the tests presented in Table 4, the first-order difference terms of most series are stationary, so it can be concluded that the variables in this study follow the I (1) process.
Table 4.
Unit root test.
Moreover, this study further examines whether there is a cointegration among the variables by the Kao test. In terms of the result, the Modified Dickey–Fuller t-statistic is −2.2307, and the corresponding p-value is 0.0128. Moreover, the Augmented Dickey–Fuller t-statistic is −9.0229, and the corresponding p-value is 0.0000. Thus, the result indicates that the null hypothesis, no cointegration, is significantly rejected. According to the results of the unit root test and Kao test, this study may further explore the relationship between trade openness and CO2 emissions.
4.1. Empirical Results
Before estimating the relationship between trade openness and CO2 emissions, this study first undertakes normality tests for the dependent variable of CO2 emissions [1]. The summary description for CO2 emissions shows that the skewness is 2.2455, while the kurtosis is 7.9370. Therefore, the distribution of CO2 emissions is right-skewed, rather than normally distributed. The graph of Kernel density estimation is presented in Figure 1. Because the normality of CO2 emissions does not hold, the Ordinary Least Squares (OLS) estimation is not applicable to this study. Thus, the panel quantile regression is employed to capture the heterogeneity of CO2 emissions by quantile.
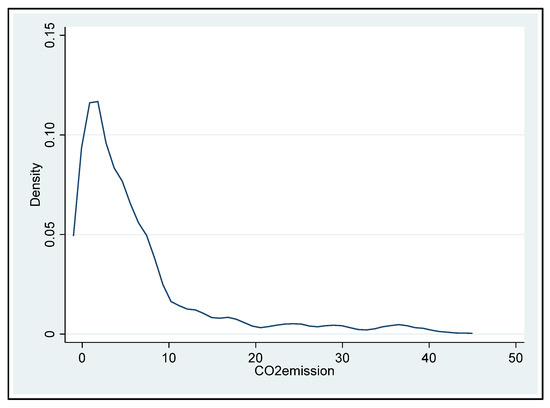
Figure 1.
Kernel density estimation for CO2 emissions.
The panel quantile regression results for the 10th, 25th, 50th, 75th, and 90th percentiles of the conditional distribution of CO2 emissions are reported in Table 5. The coefficients of trapen are all positive, and these coefficients are all significant except for the 10th percentile of CO2 emissions. Besides, the relationships are heterogeneous with CO2 emissions by quantile. In detail, the expansion of trade openness promotes CO2 emissions in those Belt and Road countries, although this impact is significantly heterogeneous across CO2 emissions by quantile, which is consistent with H4a and H5. Specifically, as the quantile of CO2 emissions increases from 25th to 90th, the impact of trade openness decreases from 0.0395 to 0.0282, monotonically.
Table 5.
Panel quantile regression results.
Meanwhile, it is interesting to note that in a low degree (the 10th percentile, for countries such as Afghanistan, Bhutan, and Mali) of CO2 emissions, the role of trade openness in releasing more CO2 is not statistically significant. This may be because, in the countries with lower levels of CO2 emissions, the import and export trade is less intense, and thus the marginal carbon effect of trade openness is no longer significant.
4.2. The Test of Endogeneity
The degree of CO2 emissions may be affected by many other factors, which have not been taken into account in this study. It implies that there may be an endogeneity problem. Therefore, this study employs two methods to eliminate the estimation bias caused by endogeneity.
Firstly, this study introduces the first-order lag term of the CO2 emissions and performs the dynamic system General Moment Method (SYS-GMM) estimation [46]. The result of the Arellano–Bond test shows that the statistic is 0.4200 and the p-value is 0.6740, which implies that the model in this study can be estimated by the GMM method. Besides, the result of the Sargan test shows that Chi2(187) = 188.6756, and the p-value is 0.4519, which means that the instrumental variables selected in this study are appropriate. The result of the GMM estimation is presented by Model 6 in Table 6. The result indicates that trade openness has a significantly positive impact on CO2 emissions.
Table 6.
The test of endogeneity.
Meanwhile, this study introduces the instrumental variable (IV) to correct the estimation bias caused by endogenous trade openness. Specifically, this study selects the first-order lag term of trade openness as an instrumental variable. In detail, if the endogenous variable is stationary, then using the lag term as its instrumental variable can produce a consistent estimator [47]. Moreover, the lag term of trade openness is relevant to itself and irrelevant to the random disturbance term in the present period. Therefore, the instrumental variable used in this study is associated with trade openness and is almost exogenous. Besides, to determine whether there is a weak identification problem, this study enters trade openness as the dependent variable and the instrumental variable as the independent variable. According to the results, the value of the F-statistic was 567.6000, which is larger than 16.3800. Therefore, in terms of the rule of thumb, there is no need to worry about any problems caused by weak instrumental variables. The estimation result is also presented in Models 7 to 11, in Table 6. The result shows that the coefficient of trapen is still significantly positive with heterogeneity, as hypothesized in H4a and H5.
4.3. Robustness Check
To perform the robustness appropriately, this study conducted related checks in three ways. First, it used the approach of fixed effect regression and re-estimated the model, and the result is presented in Model 12, in Table 7. Second, this study changed the method of measuring trade openness by the ratio of the total sum of import and export divided by the gross national income (GNI) (represented by trapen2), and the result is presented in Models 13 to 17, in Table 7.
Table 7.
Robustness check.
Thirdly, this study also divided the full sample into two subsamples according to the mean income level, defined as the high-income group and low-income group, and the results are presented in Table 8 and Table 9. In detail, 42 countries belong to the high-income group, namely, China, Armenia, Israel, Iraq, Iran, Bulgaria, Croatia, Hungary, North Macedonia, Qatar, Kazakhstan, Turkmenistan, Turkey, Serbia, Cyprus, Bahrain, Greece, Latvia, Czech Republic, Negara Brunei Darussalam, Slovakia, Slovenia, Singapore, Georgia, Saudi Arabia, Poland, Bosnia and Herzegovina, Thailand, Estonia, Belarus, Kuwait, Lithuania, Jordan, Romania, Azerbaijan, Albania, United Arab Emirates, Oman, Maldives, Malaysia, Mali, and Montenegro.
Table 8.
Panel quantile regression results: High-income group.
Table 9.
Panel quantile regression results: Low-income group.
Simultaneously, the low-income group contains 22 countries, which are Bhutan, Ukraine, Uzbekistan, Yemen, India, Indonesia, Kyrgyz, Tajikistan, Bangladesh, Nepal, Pakistan, Morocco, Sri Lanka, Cambodia, Myanmar, Lao, Philippines, Mongolia, Vietnam, Afghanistan, Syrian Arab Republic, and Egypt. The results indicate that all of the robustness checks support H4a and H5.
5. Further Discussion on the Mediating Effect Between Trade Openness and CO2 Emissions
The empirical results above indicate that there is a positive relationship between trade openness and CO2 emissions. However, countries should try their best to avoid environmental problems caused by CO2 emissions. Therefore, exploring the mediating effect between trade openness and CO2 emissions is necessary for mitigating greenhouse gas emissions. As is mentioned in Section 3.1, the positive association is a mixed result of three channels, which are the energy-substitution channel (renewable energy consumption), economic channel (GDP), and technology channel (energy intensity). To investigate whether the three mediating effects exist and how trade openness plays a role in CO2 emissions through the three channels, this study proposed the products of coefficients test [48]. In detail, we constructed the following three equations:
In Equation (2), Y represents the dependent variable of CO2 emissions, and X represents the independent variable of trade openness. Moreover, M represents the mediating variables to be tested, namely the energy-substitution channel (renewable energy consumption), economic channel (GDP), and technology channel (energy intensity). Moreover, we tested the null hypothesis: ab = 0 [49]. If this hypothesis is significantly rejected, there is a mediating effect. Specifically, to test this hypothesis, we constructed the following z-statistics:
In Equation (5), represents the estimator of a, represents the estimator of b, and represents the standard error of the estimator of . To obtain the relatively accurate standard error, this study utilized the Bootstrap method to estimate the standard error and thereby set up a 95% confidence interval (CI). If 0 is excluded in the CI, the products of coefficients are statistically significant, and the mediating effect exists [49]. Additionally, to produce a more accurate estimation, we repeated the sampling 500 times.
The result of the indirect mediating effect is presented in Table 10. First, concerning the energy-substitution channel, this study chose renewable energy consumption as a mediating variable. The result of the Bootstrap method suggests that the coefficient is negative, the corresponding z-statistic is significantly different from 0, and the 95% CI excludes 0. Therefore, the indirect effect via renewable energy consumption is negative, as expected in H1. Second, about the economic channel, we selected GDP as a mediating variable. The result of the Bootstrap method indicates that the coefficient is negative, the corresponding z-statistic is significantly different from 0, and the 95% CI does not include 0. Therefore, the indirect effect via GDP is significantly positive, which is consistent with H2a. Thirdly, for the technology channel, we utilized energy intensity as a mediating variable. The result of the Bootstrap method reveals that the coefficient is positive, the corresponding z-statistic is significantly different from 0, and the 95% CI does not contain 0. Therefore, the indirect effect via energy intensity is negative, and hence, the result is as hypothesized in H3.
Table 10.
Mediating effects.
6. Conclusions and Implications
With the accelerating pace of globalization, economic cooperation among countries around the world has played a vital role. In particular, the Belt and Road Initiative proposed by China in 2013 has introduced most countries into a community with a shared future. However, the environmental problems caused by trade openness also stand out gradually. Therefore, this study used 2001–2019 panel data from the Belt and Road countries to empirically explore the impact of trade openness on CO2 emissions. The results indicate that trade openness has a significant promotional effect on CO2 emissions. Furthermore, the role of trade openness varies with different levels of CO2 emissions. Specifically, for the CO2 emissions increased by quantile, the effect of trade openness decreases monotonically. Besides, this study put forward three major mechanisms, namely the energy-substitution channel (renewable energy consumption), economic channel (GDP), and technology channel (energy intensity). Moreover, renewable energy consumption and GDP are negative mediators, whereas energy intensity is a positive mediator.
According to the conclusions of this study, the full use of trade openness to solving environmental problems can be considered from three perspectives. The first is to improve renewable energy consumption. In terms of the empirical results, although the overall effect of trade openness is to increase CO2 emissions, renewable energy consumption will reduce CO2 emissions. Therefore, there is no time to lose in accelerating the consumption of renewable energy in the countries along the Belt and Road. The second strategic recommendation is to decrease energy intensity. Based on the empirical results, the mediating effect of energy intensity is positive. This implies that the lower the degree of energy intensity, the lower the CO2 releases, and subsequently the better the environmental quality. More specifically, in line with this study, the energy intensity is measured by the ratio of primary energy consumption to GDP. Therefore, reducing primary energy consumption is vital to reduce carbon emissions. Thus, there is an urgent need to eliminate backward capacity, resolve excess capacity, and adjust the industrial structure. The third recommendation is to formulate related policies of carbon emission reduction based on local conditions. According to the empirical results, the role of trade openness in CO2 emissions indicates significant differentials, and therefore specific emission-reduction policies should be developed for CO2 emissions by quantile. Specifically, the promotion effect of trade openness on CO2 emissions is not significant in the 10th quantile countries, such as Afghanistan, Bhutan, Lao, Nepal, Syrian Arab Republic, and Yemen, but it is significant in countries with a high quantile of CO2 emissions. Accordingly, countries with high CO2 emissions are encouraged to formulate specific policies on how to avoid environmental problems while ensuring trade openness.
Author Contributions
Conceptualization, F.C.; methodology, F.C. and G.J.; resources, G.J.; data collection, G.M.K.; writing—original draft preparation, F.C. and G.J.; writing—review and editing, F.C., G.M.K. and G.J.; supervision, F.C.; project administration, F.C.; funding acquisition, F.C. All authors have read and agreed to the published version of the manuscript.
Funding
This research was funded by the National Natural Science Foundation of China (Grant No. 71603049), Project for Young Excellent Talents in UIBE (Grant No. 18YQ07), and Key Research Project Foundation of Beijing Finance Society.
Data Availability Statement
Publicly available datasets were analyzed in this study. The data from the World Development Indicators of World Bank Database can be found here: https://databank.worldbank.org/reports.aspx?source=world-development-indicators&preview=on. Besides, the data from the British Petroleum Ltd can be found here: https://www.bp.com/en/global/corporate/energy-economics/statistical-review-of-world-energy/downloads.html.
Conflicts of Interest
The authors declare no conflict of interest.
References
- Dong, K.Y.; Dong, X.C.; Ren, X.H. Can expanding natural gas infrastructure mitigate CO2 emissions? Analysis of heterogeneous and mediation effects for China. Energy Econ. 2020, 90, 104830. [Google Scholar] [CrossRef]
- Ma, M.D.; Ma, X.; Cai, W.G.; Cai, W. Carbon-dioxide mitigation in the residential building sector: A household scale-based assessment. Energy Conv. Manag. 2019, 198, 111915. [Google Scholar] [CrossRef]
- Zoundi, Z. CO2 emissions, renewable energy and the Environmental Kuznets Curve, a panel cointegration approach. Renew. Sustain. Energy Rev. 2016, 72, 1067–1075. [Google Scholar] [CrossRef]
- Zhao, J.; Jiang, Q.Z.; Dong, X.C.; Dong, K.Y. Would environmental regulation improve the greenhouse gas benefits of natural gas use? A Chinese case study. Energy Econ. 2020, 87, 104712. [Google Scholar] [CrossRef]
- Gabriela, M.V.; Bernand, P.M.; Becerril-Torres, O.U. Inversión en infraestructura del transporte: Base para la implementación de la iniciativa de la franja y la ruta. México y la Cuenca del Pacífico 2020, 9, 21–39. [Google Scholar] [CrossRef]
- Shahzad, S.J.H.; Kumar, R.R.; Zakaria, M.; Hurr, M. Carbon emission, energy consumption, trade openness and financial development in Pakistan: A revisit. Renew. Sustain. Energy Rev. 2017, 70, 185–192. [Google Scholar] [CrossRef]
- Oktavilia, S.; Firmansyah, F. The relationships of environmental degradation and trade openness in Indonesia. Int. J. Econ. Financ. Issues 2016, 6, 125–129. Available online: https://www.researchgate.net/publication/309264417_The_Relationships_of_Environmental_Degradation_and_Trade_Openness_in_Indonesia (accessed on 14 January 2021).
- Al-Mulali, U.; Sheau-Ting, L. Econometric analysis of trade, exports, imports, energy consumption and CO2 emission in six regions. Renew. Sustain. Energy Rev. 2014, 33, 484–498. [Google Scholar] [CrossRef]
- Mohsen, M.; Rezaei, A.A.; Panait, I. A panel estimation of the relationship between trade liberalization, economic growth and CO2 emissions in BRICS countries. Hyperion Econ. J. 2014, 1, 3–27. Available online: https://www.ingentaconnect.com/content/doaj/23437995/2013/00000001/00000004/art00001 (accessed on 14 January 2021).
- Cui, J.; Lapan, H.; Moschini, G.C. Productivity, export, and environmental performance: Air pollutants in the United States. Am. J. Agr. Econ. 2015, 98, 66. [Google Scholar] [CrossRef]
- Forslid, R.; Okubo, T.; Ulltveit-Moe, K.H. Why are firms that export cleaner? International trade, abatement and environmental emissions. Res. Pap. Econ. 2015, 1–49. Available online: http://www2.ne.su.se/paper/wp15_02.pdf (accessed on 14 January 2021). [CrossRef]
- Pazienza, P. The environmental impact of the FDI inflow in the transport sector of OECD countries and policy implications. Int. Adv. Econ. Res. 2015, 1, 105–116. [Google Scholar] [CrossRef]
- Rafindadi, A.A. Does the need for economic growth influence energy consumption and CO2 emissions in Nigeria? Evidence from the innovation accounting test. Renew. Sustain. Energy Rev. 2016, 62, 1209–1225. [Google Scholar] [CrossRef]
- Appiahkonadu, P. The effect of trade liberalization on the environment: A case study of Ghana. Univ. Ghana 2013, 1–107. Available online: http://hdl.handle.net/123456789/5402 (accessed on 14 January 2021).
- Baek, J.; Kim, H.S. Trade liberalization, economic growth, energy consumption and the environment: Time series evidence from G-20 Economies. East Asian Econ. Rev. 2011, 1, 3–32. [Google Scholar] [CrossRef]
- Ferraz, C.; Young, C.E. Trade liberalization and industrial pollution in Brazil. Proc. Am. Soc. Inf. Sci. Technol. 1999, 40, 71–77. [Google Scholar] [CrossRef]
- Sefeedpari, P.; Ghahderijani, M.; Pishgar-Komleh, S.H. Assessment the effect of wheat farm sizes on energy consumption and CO2 emission. J. Renew. Sustain. Energy 2013, 5, 604–608. [Google Scholar] [CrossRef]
- Sajjad, S.H.; Blond, N.; Clappier, A.; Raza, A.; Shirazi, S.A.; Shakrullah, K. The preliminary study of urbanization, fossil fuels consumptions and CO2 emission in Karachi. Afr. J. Biotechnol. 2010, 13, 1941–1948. [Google Scholar] [CrossRef]
- Sohail, A.; Baiocchi, G.; Creutzig, F. CO2 emissions from direct energy use of urban households in India. Environ. Sci. Technol. 2015, 49, 11312–11320. [Google Scholar] [CrossRef]
- Owusu, E.L. The relationship between energy consumption, CO2 emission, population growth and economic growth: An empirical multivariate causal linkage from Ethiopia. Econ. Policy. Energy. Environ. 2018, 1, 225–239. Available online: https://ideas.repec.org/a/fan/efeefe/vhtml10.3280-efe2018-001010.html (accessed on 14 January 2021).
- Begum, R.A.; Sohag, K.; Abdullah, S.M.S.; Jaafar, M. CO2 emissions, energy consumption, economic and population growth in Malaysia. Renew. Sustain. Energy Rev. 2015, 41, 594–601. [Google Scholar] [CrossRef]
- Tian, J.; Yang, H.; Xiang, P.; Liu, D.; Li, L. Drivers of agricultural carbon emissions in Hunan Province, China. Environ. Earth Sci. 2016, 75, 121.1–121.17. [Google Scholar] [CrossRef]
- Xu, B.; Lin, B. Investigating drivers of CO2 emission in China’s heavy industry: A quantile regression analysis. Energy 2020, 206, 118159. [Google Scholar] [CrossRef]
- Yang, Z.; Liu, Y.S.; Wu, W.X.; Li, Y.R. Effects of rural-urban development transformation on energy consumption and CO2 emissions: A regional analysis in China. Renew. Sustain. Energy Rev. 2015, 52, 863–875. [Google Scholar] [CrossRef]
- Wang, Z.; Yin, F.; Zhang, Y.; Xian, Z. An empirical research on the influencing factors of regional CO2 emissions: Evidence from Beijing city, China. Appl. Energy 2012, 100, 277–284. [Google Scholar] [CrossRef]
- Lisa, R.; Madhav, P. Scenarios for future urbanization: Carbon dioxide emissions from passenger travel in three Indian cities. Transp. Res. Rec. 2018, 2193, 124–131. [Google Scholar] [CrossRef]
- Khan, A.; Chenggang, Y.; Hussain, J.; Bano, S.; Nawaz, A. Natural resources, tourism development, and energy-growth-CO2 emission nexus: A simultaneity modeling analysis of BRI countries. Resour. Policy 2020, 68, 101751. [Google Scholar] [CrossRef]
- Auci, S.; Trovato, G. The environmental Kuznets curve within European countries and sectors: Greenhouse emission, production function and technology. Econ. Politica 2018, 35, 895–915. [Google Scholar] [CrossRef]
- Yi, S.; Jian-Bai, H.; Chao, F. Decomposition of energy-related CO2 emissions in China’s iron and steel industry: A comprehensive decomposition framework. Resour. Policy 2018, 59, 103–116. [Google Scholar] [CrossRef]
- Xu, G.; Schwarz, P.; Yang, H. Adjusting energy consumption structure to achieve China’s CO2 emissions peak. Renew. Sustain. Energy Rev. 2020, 122, 109737. [Google Scholar] [CrossRef]
- Tajudeen, I.A.; Wossink, A.; Banerjee, P. How significant is energy efficiency to mitigate CO2 emissions? Evidence from OECD countries. Energy Econ. 2018, 72, 200–221. [Google Scholar] [CrossRef]
- Li, T.; Balezentis, T.; Makuteniene, D.; Streimikience, D.; Irena, K. Energy-related CO2 emission in European Union agriculture: Driving forces and possibilities for reduction. Appl. Energy 2016, 180, 682–694. [Google Scholar] [CrossRef]
- Li, H.; Mu, H.; Ming, Z.; Gui, S. Analysis of regional difference on impact factors of China’s energy-related CO2 emissions. Energy 2012, 39, 319–326. [Google Scholar] [CrossRef]
- Chen, J.; Wang, P.; Cui, L.; Huang, S.; Song, M. Decomposition and decoupling analysis of CO2 emissions in OECD. Appl. Energy 2018, 231, 937–950. [Google Scholar] [CrossRef]
- Zhang, M.; Mu, H.; Ning, Y.; Song, Y. Decomposition of energy-related CO2 emission over 1991–2006 in China. Ecol. Econ. 2009, 68, 2122–2128. [Google Scholar] [CrossRef]
- Branstetter, L. Is foreign direct investment a channel of knowledge spillovers? Evidence from Japan’s FDI in the United States. J. Int. Econ. 2006, 68, 325–344. [Google Scholar] [CrossRef]
- Herzer, D. Outward FDI and economic growth. J. Econ. Stud. 2010, 35, 476–494. [Google Scholar] [CrossRef]
- Copeland, B.R.; Taylor, M.S. Trade, growth, and the environment. J. Econ. Lit. 2004, 42, 7–71. [Google Scholar] [CrossRef]
- Fisher-Vanden, K.; Jefferson, G.H.; Jingkui, M.; Ma, J.; Xu, J. Technology development and energy productivity in China. Energy Econ. 2006, 28, 690–705. [Google Scholar] [CrossRef]
- Huebler, M.; Keller, A. Energy savings via FDI? Empirical evidence from developing countries. Environ. Dev. Econ. 2010, 15, 59–80. [Google Scholar] [CrossRef]
- Copeland, B.R.; Taylor, M.S. The trade-induced degradation hypothesis. Resour. Energy Econ. 1997, 19, 321–344. Available online: https://www.ixueshu.com/document/e07dee1f468034da318947a18e7f9386.html (accessed on 14 January 2021). [CrossRef]
- Wing, I.S.; Richard, S.E. The implications of the historical decline in US energy intensity for long-run CO2 emission projections. Energy Policy 2007, 35, 5267–5286. [Google Scholar] [CrossRef]
- Hammoudeh, S.; Nguyen, D.K.; Sousa, R.M. Energy prices and CO2 emission allowance prices: A quantile regression approach. Energy Policy 2014, 70, 201–206. [Google Scholar] [CrossRef]
- Guan, D.; Hubacek, K.; Weber, C.L.; Peters, G.P.; Reiner, D.M. The drivers of Chinese CO2 emissions from 1980–2030. Glob. Environ. Chang. 2008, 18, 626–634. [Google Scholar] [CrossRef]
- Yang, Y.; Cai, W.; Wang, C. Industrial CO2 intensity, indigenous innovation and R & D spillovers in China’s provinces. Appl. Energy 2014, 131, 117–127. [Google Scholar] [CrossRef]
- Wintoki, M.B.; Linck, J.S.; Netter, J.M. Endogeneity and the dynamics of internal corporate governance. J. Financ. Econ. 2012, 105, 581–606. [Google Scholar] [CrossRef]
- Bellemare, M.F.; Masaki, T.; Pepinsky, T.B. Lagged explanatory variables and the estimation of causal effect. J. Politics 2017, 79, 949–963. [Google Scholar] [CrossRef]
- Sobel, M.E. Asymptotic Confidence Intervals for Indirect Effects in Structural Equation Models; Leinhardt, S., Ed.; Sociological Methodology; American Sociological Association: Washington, DC, USA, 1982; pp. 290–312. [Google Scholar]
- Preacher, K.J.; Hayes, A.F. Asymptotic and resampling strategies for assessing and comparing indirect effects in multiple mediator models. Behav. Res. Methods 2008, 40, 879–891. [Google Scholar] [CrossRef]

Publisher’s Note: MDPI stays neutral with regard to jurisdictional claims in published maps and institutional affiliations. |
© 2021 by the authors. Licensee MDPI, Basel, Switzerland. This article is an open access article distributed under the terms and conditions of the Creative Commons Attribution (CC BY) license (http://creativecommons.org/licenses/by/4.0/).