Abstract
Water-subsidized systems are growing in number and maintaining the sustainability of such complex systems presents unique challenges. Interbasin water transfer creates new sociohydrological dynamics that come with tradeoffs and potential regime shifts. The Tempisque-Bebedero watershed in Northwest Costa Rica typifies this class of watershed: Transferred water is used for power generation and irrigated agriculture with significant downstream environmental impacts. To improve and clarify our understanding of the effects of social and biophysical factors on the resilience of such systems, a stylized dynamical systems model was developed, using as a guide the situation in the Tempisque-Bebedero watershed. This model was analyzed to understand the nature of socio-hydrologic regimes that exist in this class of basins and what factors determine these regimes. The model analysis revealed five distinct regimes and different regime shift behaviors dependent on environmental and policy conditions. This work offers insights into other complex socio-hydrologic systems with similar processes.
1. Introduction
Water-subsidized systems are social-ecological systems that import water from outside of their natural watersheds to address problems arising from the inadequacy of their natural water supplies to meet their demands. With populations and water demands growing, these systems constitute an increasingly important class of social-ecological systems [1]. They have the potential to promote hydrologic and social resilience through increased water access [2,3]. However, these systems have long been identified as introducing risk through the formation of new hydrologic and ecological connections [4]. For example, the Orange River Project in South Africa transfers water from the Orange River Catchment to facilitate hydroelectric power generation and irrigated agriculture, supporting rural livelihoods [5]. Similarly, Australia’s Murrumbidgee Irrigation Area is fed by interbasin water transfer and was used to provide land and livelihoods to returning soldiers after both the First and Second World Wars [6]. Both of these projects have also dealt with unintended environmental impacts—invasive blackfly species in the Orange River Project and blue-green algae blooms in the Murrumbidgee Irrigation Area [5,6].
These systems present unique challenges. They represent complex networks of interactions that can lead to unexpected social and environmental impacts and regime shifts. Trade-offs are common, with many systems trading cultural and ecosystem services for increased agricultural production [7]. Given the growing number of such systems [1], there is an increasing need for understanding resilience and sustainability of such water-subsidized systems. Many existing studies on these systems tend to be highly parameterized to assess the sustainability of a specific site. They emphasize recovery to a desired state [8,9] or individual site descriptive factors [10,11,12] as metrics of sustainability or resilience. Due to complex networks of interactions within these systems, however, such an approach is not amenable to clear and systematic studies of potential for regime shifts. In this paper, we attempt to take steps in that direction and make a complementary contribution through developing and analyzing a stylized model based on a water-subsidized system in Northwest Costa Rica.
In this study, we ask the following research questions: what socio-hydrologic regimes exist in a basin of this type? What factors determine these regimes and how do they interact? How might a water subsidized system experience regime shifts as these drivers change? To answer this question, we developed and analyzed a dynamical systems model of a water-subsidized system, incorporating input from stakeholders to describe key interactions. The goal of this study is to identify key drivers of change in the basin, operationalize how those drivers interact, and analyze to reveal potential regime shifts and what factors influence them.
2. Model Description
The developed model is described in this section. The model is developed using a watershed in Northwest Costa Rica as a representative of a class of complex, water subsidized systems. The study site is described in Section 2.1. Section 2.2 details the dynamical variables of the model, with explanation of the processes governing eco-hydrologic (Section 2.2.1) and social (Section 2.2.2) variables. The full model is summarized in Section 2.3 and the final, dimension-reduced model used for analysis is presented in Section 2.4.
2.1. Site Description
The model is developed using the situation experienced in the Tempisque-Bebedero watershed in Northwest Costa Rica. This watershed is chosen because it represents a class of watersheds on the receiving end of an interbasin water transfer project that drove hydropower generation and irrigated agriculture, with downstream ecological impacts. Additionally, we take advantage of previous stakeholder work (see Appendix A) and available data.
The Tempisque-Bebedero watershed in Northwest Costa Rica (Figure 1) typifies a water-subsidized system with unique opportunities for research. In 1979, Costa Rica’s first hydroelectric dam was created, forming Lake Arenal and initiating a system of interbasin water transfer from the rainy eastern half of Costa Rica, and the relatively dry Tempisque-Bebedero Basin. The Arenal reservoir is the largest in Costa Rica [13]. This interbasin water transfer supported the development of the Tempisque Arenal Irrigation and Drainage District, a 40,000 hectare zone of irrigated agricultural land, producing mainly rice and sugarcane [14]. Competing water needs have led to conflict and water shortage, both for human use and the environment [13]. After traveling through a network of irrigation canals, water leaves the agricultural sector, flowing through Palo Verde National Park. Palo Verde was designated a wetland of international importance by the Ramsar convention in 1991, largely due to the vast amount of local and migratory birds that find habitat in the area. In 1993, however, it was designated an impaired ecosystem due to an influx of Typha domignesis (cattail) and the subsequent reduction in waterfowl habitat [15]. Changes in the amount and timing of water flow are suspected to contribute to the wetland degradation [16]. Water concessions were adjusted in 2005 to guarantee minimum environmental flows in an effort to support the ecological health of the area [13]. However, the impaired ecosystem designation remains to this day.
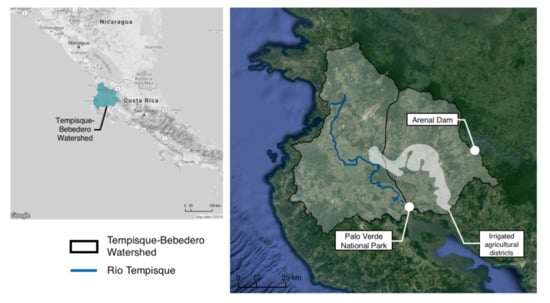
Figure 1.
The Tempisque-Bebedero watershed in Northwest Costa Rica [17]. Its irrigated agricultural district is supplied by water from Lake Arenal, moving water from the higher-precipitation east basin to the drier west basin.
2.2. Dynamical Variables
The first step in creating the model structure is the selection of dynamical variables. Dynamical variables represent the interconnected moving parts of the socio-hydrologic system. The model includes five dynamical variables—three eco-hydrologic variables and two social variables. The dynamical variables and parameters of the model are detailed in Table 1. The structure of the model is summarized in Figure 2.

Table 1.
Dynamical variables and parameters of the model.
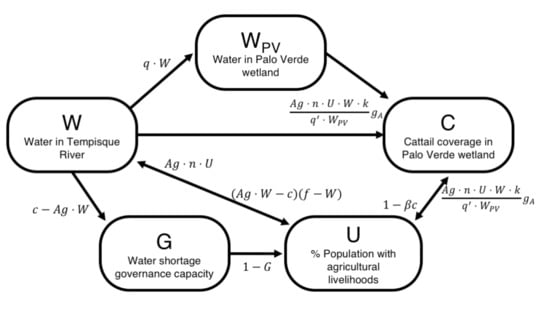
Figure 2.
A conceptual diagram of the model. Directed links represent causal effects from one dynamical variable to another.
2.2.1. Eco-Hydrologic Variables
The first dynamical variable, W, water in the Tempisque, is governed by the mass balance between the incoming water to the basin (a fixed amount, ), water consumption in the basin, and outflows to the wetland (at rate q). Water is consumed in the basin by two sectors—agriculture and an alternative industry. A competing alternative industry can take many forms; in the Tempisque-Bebedero basin, an example of such an industry is the emerging tourism sector present there. Water is allocated to agriculture on an individual basis () with total water consumed depending on the total number of agricultural users (). Water allocated to industry () is fixed with respect to users, with the tourism sector in the Tempisque-Bebedero as an example in mind.
Water in the Palo Verde Wetland, , is modeled as inflow from the Tempisque () minus outflow to the gulf (at a rate of ). This dynamical variable was included to better tie in upstream human activities with downstream ecological effects.
Cattail coverage, C, is an important environmental consideration of the Palo Verde Wetland. Palo Verde Wetland is designated an impaired Ramsar site after the landscape shifted from one of open water, which is important for migratory bird use, to one of densely populated cattail, which obscures the reflective water (espejos de agua) from birds overhead [15]. To incorporate wetland health, we have incorporated cattail coverage, into the model. Cattail is modeled as having an intrinsic growth rate (g) that is accelerated () by the flow of nutrients from the agricultural sector (). Cattail is also managed by Palo Verde National Park using a process called fangueo (F). Fangueo is the practice of using rice farming implements and a tractor to roller-chop the cattail in the wetland [15]. While this does not offer a long term solution, it counteracts the growth of the cattail and temporarily increases the areas of open water to aid migratory bird use of the wetland.
2.2.2. Social Variables
Governance is among the most important drivers in the minds of participating stakeholders from the workshop (Appendix A, Figure A1). This likely resonates with stakeholders in other similar basins. To capture the effect of governance, governance capacity G is used in this model to represent the capacity to mitigate the negative effects of drought. The dynamics of G is assumed to be the balance between the improvement that comes with experience of coping with droughts and the decay due to loss of institutional memory. While institutional memory can have both positive and negative effects, we assume a positive impact on the ability to respond to drought events (Ref. [18]). In this model, when a drought event occurs (), governance capacity is increased (at a rate of m) proportional to the severity of the drought (): the experience with coping with this drought prepares local governments and agencies to deal with the next one more effectively. Governance capacity gradually declines a rate of D (loss of institutional memory). In a basin with predicted increases in both drought and extreme events, we were interested in capturing the effects of experience on the governance capacity to respond. With these considerations, we write the dynamical equation for G as follows:
Finally, to model changing livelihoods in the basin, the population with agricultural livelihoods was used as a dynamic variable (U). This variable is modeled using a replicator equation from evolutionary game theory [19] shown in Equation (5). Workers in the basin have a level of responsiveness (r) to differences in payoff and choose between agricultural and alternative livelihoods based on that difference (). Payoff of alternative livelihoods () is held as a constant and represents the economic incentive for people to abandon the agricultural sector. Payoff of agriculture () depends on both water availability and governance capacity to help in times of drought. Cattail coverage also impacts agricultural payoff. Birds often use nearby rice fields as a habitat alternative, damaging crops, when cattail coverage obscures the wetland from overhead view.
where,
2.3. Putting Them Together
The full model then consists of the following five equations:
The goal of this model is to capture both social and eco-hydrologic components of the complex Tempisque-Bebedero watershed-as a representative of a class of water subsidized systems-and gain insights into how these components interact to determine different regimes that the complex system may exhibit. The overall picture of the model is as follows. Incoming water, both naturally occurring and subsidized from the neighboring basin, supports agriculture, industry, and the wetland. People in the basin can choose which livelihood to pursue based on payoff. In times of drought, experience increases the capacity of the governance to support agricultural workers. The wetland provides habitat for migratory birds, but when invasive cattail coverage is high, birds are driven to neighboring farms, damaging crops and reducing payoff-this represents adverse environmental feedback upstream, which may take other forms in other basins.
2.4. Final Model
To clearly investigate potential regime shifts the system may experience, we simplified the above model using nondimensionalization (Table 2) and time scale separation. For time scale separation, we assumed that eco-hydrologic variables respond relatively quickly compared to social variables. For example, shifts in livelihood can occur along generational lines. Long-term farming families may find their children leaving to find alternative work in cities. Simplifying in this way allows the model to retain the effects of the eco-hydrologic variables while reducing the dimensions for clearer analysis: in particular, we expressed W, , and C as functions of G and U. This procedure led to the following two-dimensional dynamical system of social variables.
where and are introduced for brevity and highlighting the dependence of the dynamics on U; see Appendix B for more details.
Table 2.
Dimensionless group definitions and interpretations.
We have arrived at a two-dimensional dynamical system model that captures the dynamics between governance capacity to mitigate the effects of drought (G) and the livelihood choices of users in the basin (U). It is important to recognize that the model was developed based on biophysical and social processes typically found in a water subsidized system, and that the feedbacks of ecohydrological variables are already embedded (through and )in the model.
3. Results and Discussion
The final model (Equations (6) and (7)) yields a range of qualitative system-level behaviors or regimes. The results are summarized in a phase diagram (Figure 3). Each point in the diagram represents a socio-hydrological setting, characterized by a combination of a hydrological and social parameter. The hydrological parameter we considered was the water allocation to the agriculturals sector (). The Guanacaste Province, which encompasses the Tempisque-Bebedero watershed, experiences frequent water disputes stemming from problems of allocation [20,21]. Water allocation to agriculture via the network of irrigation canals is also subject to significant variability due to prioritization of hydropower generation [22]. The second parameter considered is , the baseline agricultural profit. This parameter can be thought of as representing a social safety net or any subsidies that help farmers during difficult growing or market value years. Costa Rica offers options for financing and emergency cash payments to growers when disaster strikes, but the majority of this safety net takes the form of market price support [23]. Under the Central American Free Trade Agreement (CAFTA) however, the form of agricultural risk management will undergo significant changes, including a phasing out of tariffs by 2025 [23], translating to a reduction of the parameter. Under different combinations of and , the system may exhibit one of the five possible regimes (Figure 4), dependent on other drivers. In Figure 3, we focus on the influence of one such driver, the amount of incoming water (both naturally and via the water transfer project).
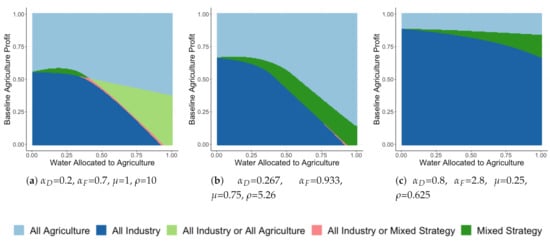
Figure 3.
Phase diagrams of possible regimes, under decreasing levels of incoming water. All five regimes are present in (a). (b,c) represent 25% and 75% decreases in incoming water to the system, respectively. With a 25% decrease, the phase diagram is dominated by three regimes, all industry, a mixed strategy, and all agriculture. A 75% decrease sees all industry as the prevalent regime.
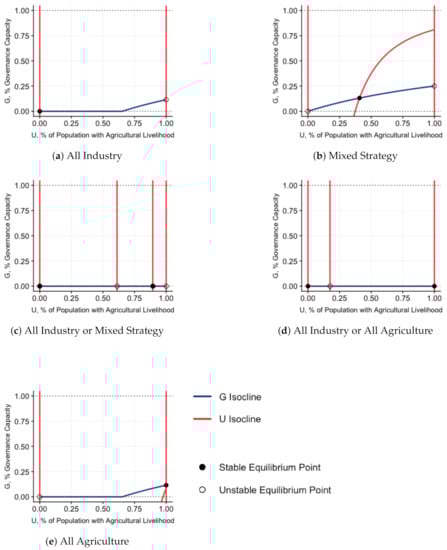
Figure 4.
Five possible regimes, under different socio-hydrological settings. Each of the five regimes represent a different qualitative behavior, characterized by the number and nature of its equilibria.
When baseline agricultural profit is too low and water allocation insufficient, there is no participation in agriculture (Figure 4a and lower left of phase diagrams in Figure 3). Instead, participation in alternative industry is at 100%. The only stable equilibrium point is when a governance and agricultural participation levels are zero. An example of this kind of “All Industry” regime may be found in the Osa Peninsula. In this area, ecotourism (alternative industry) provides a significant wage advantage over other income sources. Simultaneously, other income sources are tied to the ecotourism industry. Livelihoods from retail to roadwork are kept afloat by the tourism industry [24].
In contrast, at a sufficiently high values of (the top part of the phase diagrams in Figure 3), the only stable equilibrium is at full participation in agriculture and some governance capacity (Figure 4e). In this case, there is some water shortage occurring when the population is entirely agricultural and the governance capacity is maintained to alleviate profit losses due to drought. An example of such a regime can be seen in the Río Dos Novillos watershed, where study participants reported a large percentage of household income from agricultural activities including smallholder farms and wage work on plantations [25].
A mixed strategy (Figure 4b) emerges when governance capacity contributes to agricultural profit in times of water shortage, balancing payoff between agriculture and alternative industry. There is some participation in both agriculture and alternative industry. This regime is present in the center left of Figure 3a (a rather small region in the phase diagram), at the middle ground between all agriculture and all industry. An example of this mixed strategy regime may be found in the Guanacaste province. The irrigated districts have expanded, helping provide agricultural livelihoods to many. The opening of an international airport within the province also kick started the tourism industry, leading to urbanization and service industry careers [26].
Figure 4c and d both have multiple stable states. In the “All industry or Mixed Strategy” regime (Figure 4c), there are two stable equilibria, one at full participation in alternative industry and one at a mixed strategy. Depending on the system’s history, either equilibrium is a potential end point of the system. Figure 4d shows the “All Industry or All Agriculture” regime. Similar to Figure 4c, two stable equilibria are present, with the only endpoints of the system being full participation in either agriculture or industry. In this regime, the two livelihood options do not coexist. Both of these regimes occur at higher levels of agricultural water allocation and lower levels of baseline agricultural profit (the lower right of Figure 3a).
With changing policy and environmental conditions, the system may undergo regime shifts, going from one of the five regimes to another. Focusing on Figure 3a, different regime shift patterns emerge under different values of . For example, at and , the system is in an “All Agriculture” regime. Decreasing , moving down through Figure 3a, brings the system to a “Mixed” regime and then to an “All Industry” regime. This reflects a somewhat smooth transition from a system dominated by agricultural livelihoods to a system dominated by industrial livelihoods. At , such a decrease in is accompanied by a different path: decreasing still causes the system to shift from “All Agriculture” to, eventually, “All Industry”, but instead of passing through a “Mixed” regime, it passes through “All Industry or All Agriculture” and “All Industry or Mixed Strategy”. This implies the potential for a more drastic regime shift between the two extremes.
Decreasing incoming water changes the phase diagram (compare Figure 3a–c). For example, a value of and results in an “All Agricultural” regime in Figure 3a,b. When incoming water is lower still, the same socio-hydrological setting results in the opposite extreme, an “All Industry” regime, in Figure 3c. As incoming water is decreased, more of the phase diagram is dominated by an industrial livelihood outcome. This reflects the disproportionate effects of drought on the heavily water subsidized agricultural sector in the Tempisque-Bebedero basin.
4. Conclusions and Final Remarks
The interconnected and highly managed nature of water-subsidized systems presents unique challenges for promoting resilience. In this paper, we asked: what socio-hydrologic regimes exist in a basin of this type? What factors determine these regimes and how do they interact? How might a water subsidized system experience regime shifts as these drivers change? To answer these questions, a stylized model was developed to capture key biophysical and social processes in a representative watershed, namely, the Tempisque-Bebedero watershed. The model included five dynamical variables representing environmental and social aspects of the system. The model was simplified using nondimensionalization and time-scale separation to obtain clear results in terms of the social variables—participation in agricultural livelihoods and governance capacity. The model was evaluated under a range of socio-hydrological settings, which were characterized by a combination of hydrological and social parameters.
The model analysis revealed five regimes under different combinations of water allocation and agricultural subsidy policies. Boundaries between these regimes were illustrated in the phase diagram (Figure 3), which changed with changes in water availability (think climate change). Crossing such a boundary means that the system undergoes a regime shift. With its relative simplicity, the model offers a way to shed light on how changes in different drivers (e.g., climate change, trade agreements, etc.) may affect potential regime shifts that the system may experience. The knowledge of potential regime shifts in water-subsidized systems—with the degree of clarity reported here—is difficult to obtain from highly-parameterized, site-specific approaches that are often taken for these systems; this is our contribution to the existing body of knowledge. This knowledge will also complement other efforts (such as more sophisticated site-specific models, case study selection, and data collection) and help decision makers design their governance structure to navigate these potential regime shifts and pitfalls—either in anticipation of a potential shift or steering the system away from an undesirable boundary—and to sustain a water-subsidized system.
Author Contributions
K.V. and R.M. designed the study. K.V. conducted the analysis. K.V. and R.M. wrote the paper. Both authors have read and agreed to the published version of the manuscript.
Funding
The research was supported by the University of Florida’s Water Institute through its Fellowship Program (WIGF) under the project: Inducing Resilience for Water-Subsidized Systems. RM acknowledges the support by the Army Research Office/Army Research Laboratory under award W911NF1810267 (Multidisciplinary University Research Initiative). The views and conclusions contained in this document are those of the authors and should not be interpreted as representing the official policies either expressed or implied of the Army Research Office or the U.S. Government.
Institutional Review Board Statement
Not applicable.
Informed Consent Statement
Not applicable.
Data Availability Statement
This study was theoretical in nature and did not use empirical data in its analysis.
Acknowledgments
We wish to thank the WIGF project’s participating faculty advisors—Rafael Muñoz-Carpena, Jeffrey Johnson, Christine Angelini, Peter Waylen, Gregory Kiker, and Thomas Ankersen—as well as other WIGF fellows—Stefano Barchiesi, Caroline Huguenin, Oswaldo Medina-Ramirez, and Marco Pazmino for their support and insights. We also thank Marieke Veeger for leading the scenario planning workshop, which formed the basis of Ref. [27] and Figure A1.
Conflicts of Interest
The authors declare no conflict of interest.
Appendix A. Selecting Dynamical Variables
The first step in creating the model structure is the selection of dynamical variables. Dynamical variables represent the interconnected moving parts of the socio-hydrologic system. For this selection process, input from relevant stakeholders in the Tempisque-Bebedero watershed was incorporated through the results of a scenario planning workshop. The interested reader is referred to [27] for more details of the workshop. Only brief description is provided below.
Scenario planning has been used to develop policies when there are large uncertainties within a system [28]. Conducting this exercise with stakeholders involves a structured exploration of possible future scenarios at the extremes of uncertainty. The goal is to develop different narratives to gain perspective and information in planning for the future. This methodology is useful in engaging stakeholders in identifying what aspects of the system are important to them collectively, but typically ends with the development of scenarios. These scenarios have been used to influence policy and management [28], and resulting scenarios have been input into models. However, the scenario planning process has not yet been linked directly to model development efforts.
As part of the scenario planning methodology [29] drivers of change within the basin were listed. This was done through a mix of interviews and online surveys with stakeholders from the Tempisque basin from various sectors, including agricultural, academic, and government organizations. They were asked to list 7–10 drivers of change for water resources, agriculture, and livelihoods, respectively. These drivers include water availability, governance, and population growth. Drivers were then ranked by stakeholders for both relevance and uncertainty. Stakeholders were asked to choose from the combined list those drivers that they viewed as most important or relevant to the system. They then chose the drivers they viewed as most uncertain when thinking about the future. They were asked to provide 5 responses for most relevant and most uncertain, respectively, though some listed fewer or more. The ranking process resulted in Figure A1 [27], an evaluation of stakeholder-identified drivers of change in the Tempisque-Bebedero watershed.

Figure A1.
Drivers identified by stakeholders in a scenario planning workshop. This provided information on what drivers of change stakeholders viewed as “uncertai” or “important”. The shaded area contains the 5 drivers selected for use in developing dynamical variables. (Figure adapted from [27]).
Figure A1.
Drivers identified by stakeholders in a scenario planning workshop. This provided information on what drivers of change stakeholders viewed as “uncertai” or “important”. The shaded area contains the 5 drivers selected for use in developing dynamical variables. (Figure adapted from [27]).

For dynamical variables, we selected those that were considered important, well-understood, and sufficiently linked to capture some of the complex interactions within the system. Among drivers with high importance, we focused on those with low uncertainty rankings for use as dynamical variables. The drivers highlighted in Figure 2, represent elements that are highly important and sufficiently well understood to be modeled through simple dynamical equations. Governance, population/migration, and livelihood changes are considered social variables, while natural resource management and water quality are eco-hydrologic variables. The dynamics of these variables, along with some environmental concerns, were used to develop the conceptual model (Figure 2). Some of the stakeholder-identified high uncertainty drivers were included as tunable parameters; the dynamical outcomes of the model would then be considered under wide ranges of these parameters.
Appendix B. Model Simplification through Time-Scale Separation
Analysis is conducted on the nondimensionalized model. Nondimensionalization simplifies model analysis through parameter reduction. Dimensionless groups and their interpretations are summarized in Table 2. Substituting dimensionless groups into Equations (1)–(5) yields the following nondimensionalized version of the model.
where,
Time-scale separation was used on the the five-dimensional model to further simplify the analysis and obtain clear results. This technique (see, e.g., Ref. [30]) assumes that some components of a system follow significantly faster dynamics than the rest, practically approaching their steady states with respect to other slow-moving components. Mathematically, the steady states of these fast-moving components are expressed as functions of the other slow-moving components and plugged into the the dynamical equations of the slow-moving components, effectively reducing the dimensionality of the model to be analyzed while retaining some feedbacks and interactions among these components in the full model.
Here we assume that the social variables are moving more slowly than the eco-hydrologic variables. This means we assume as the system evolves, the eco-hydrologic variables react quickly to the social processes. We then write the equilibrium points of these eco-hydrologic variables, namely , , and as functions of U and G:
Substituting these functions into Equations (A1) and (A5) yields the final model presented in Equations (6) and (7), on which stability analysis (see Appendix C) is performed.
Appendix C. Stability analysis
First, the G- and U-isoclines were determined by setting Equations (6) and (7) equal to zero, respectively. The G-isocline can be expressed as follows:
where is introduced for brevity, while still capturing the dependence of the –isocline on U; the indicator function indicates the level of water shortage governance, G, is dependent on whether or not there is a water shortage, which is a deterministic value based on the level of participation in agriculture. This can be seen in the shape of the G-isocline shown in Figure 4.
There are three U-isoclines, one at full participation in agriculture, one at no participation in agriculture, and one where the payoffs, , of both livelihood strategies are equal. That is,
The isocline where payoffs are equal also depends on whether or not a water shortage is present. When a water shortage is present, the level of governance, G, bolsters payoff to agriculture (center U-isocline in Figure 4b); when there is no water shortage, governance level does not contribute to payoff (center U-isocline in Figure 4d). The nonlinear relationship between water and payoff to agriculture (too little water or too much water reduces overall payoff), creates the situation in Figure 4c where two different levels of participation in agriculture result in the same overall payoff, . The two center U-isoclines in Figure 4c are both instances where . These isoclines can be written as follows:
These isoclines are key in the stability analysis. The intersection between a G-isocline and a U-isocline indicates an equalibrium point. The isoclines dissect the U-G phase plane into regions. Analyzing the and equations to determine the directions in which G and U change in these different regions along with the confirmation by numerical simulations, one determines the stability of the equilibrium points. This was the analysis conducted in Figure 4.
References
- Sinha, P.; Rollason, E.; Bracken, L.J.; Wainwright, J.; Reaney, S.M. A new framework for integrated, holistic, and transparent evaluation of inter-basin water transfer schemes. Sci. Total Environ. 2020. [Google Scholar] [CrossRef] [PubMed]
- Murgatroyd, A.; Hall, J.W. The Resilience of Inter-basin Transfers to Severe Droughts With Changing Spatial Characteristics. Front. Environ. Sci. 2020. [Google Scholar] [CrossRef]
- Langridge, R.; Christian-Smith, J.; Lohse, K.A. Access and resilience: Analyzing the construction of social resilience to the threat of water scarcity. Ecol. Soc. 2006. [Google Scholar] [CrossRef]
- Davies, B.R.; Thoms, M.; Meador, M. An assessment of the ecological impacts of inter-basin water transfers, and their threats to river basin integrity and conservation. Aquat. Conserv. Mar. Freshw. Ecosyst. 1992. [Google Scholar] [CrossRef]
- Bohensky, E.; Reyers, B.; van Jaarsveld, A.S.; Fabricius, C. Ecosystem Services in the Gariep Basin: A Component of the Southern African Millennium Ecosystem Assessment (SAfMA); Technical Report; African Sun Media: Stellenbosch, South Africa, 2004. [Google Scholar]
- Kandasamy, J.; Sounthararajah, D.; Sivabalan, P.; Chanan, A.; Vigneswaran, S.; Sivapalan, M. Socio-hydrologic drivers of the pendulum swing between agricultural development and environmental health: A case study from Murrumbidgee River basin, Australia. Hydrol. Earth Syst. Sci. 2014, 18, 1027–1041. [Google Scholar] [CrossRef]
- Gordon, L.J.; Finlayson, C.M.; Falkenmark, M. Managing water in agriculture for food production and other ecosystem services. Agric. Water Manag. 2010. [Google Scholar] [CrossRef]
- Ren, K.; Huang, S.; Huang, Q.; Wang, H.; Leng, G.; Fang, W.; Li, P. Assessing the reliability, resilience and vulnerability of water supply system under multiple uncertain sources. J. Clean. Prod. 2020. [Google Scholar] [CrossRef]
- Emanuel, R.E.; Buckley, J.J.; Caldwell, P.V.; McNulty, S.G.; Sun, G. Influence of basin characteristics on the effectiveness and downstream reach of interbasin water transfers: Displacing a problem. Environ. Res. Lett. 2015. [Google Scholar] [CrossRef]
- Kefayati, M.; Saghafian, B.; Ahmadi, A.; Babazadeh, H. Empirical evaluation of river basin sustainability affected by inter-basin water transfer using composite indicators. Water Environ. J. 2018. [Google Scholar] [CrossRef]
- Xu, Z.X.; Takeuchi, K.; Ishidaira, H.; Zhang, X.W. Sustainability analysis for Yellow River water resources using the system dynamics approach. Water Resour. Manag. 2002. [Google Scholar] [CrossRef]
- Wilson, M.C.; Li, X.Y.; Ma, Y.J.; Smith, A.T.; Wu, J. A Review of the economic, social, and environmental impacts of China’s South–North Water Transfer Project: A sustainability perspective. Sustainability 2017, 9, 1489. [Google Scholar] [CrossRef]
- Guzmán Arias, I.; Calvo Alvarado, J.C. Water resources of the Upper Tempisque River Watershed, Costa Rica Water resources of the Upper Tempisque River Watershed, Costa Rica (Technical note). Tecnol. Marcha 2012, 25, 63–70. [Google Scholar] [CrossRef]
- Guzmán-Arias, I.; Calvo-Alvarado, J. Planning and development of Costa Rica water resources: Current status and perspectives. Tecnol. Marcha 2013, 26, 52–63. [Google Scholar] [CrossRef]
- Osland, M.J.; Gonzalez, E.; Richardson, C.J. Restoring diversity after cattail expansion: Disturbance, resilience, and seasonality in a tropical dry wetland. Ecol. Appl. 2017, 21, 715–728. [Google Scholar] [CrossRef]
- Alonso, A.; Kennedy, R.E.; Murcia, C. Wetland Landscape Spatio-Temporal Degradation Dynamics Using the New Google Earth Engine Cloud-Based Platform: Opportunities for Non-Specialists in Remote Sensing. Trans. ASABE 2016, 59, 1331–1342. [Google Scholar] [CrossRef]
- Kahle, D.; Wickham, H. ggmap: Spatial visualization with ggplot2. R J. 2013. [Google Scholar] [CrossRef]
- Corbett, J.; Grube, D.C.; Lovell, H.; Scott, R. Singular memory or institutional memories? Toward a dynamic approach. Governance 2018, 31, 555–573. [Google Scholar] [CrossRef]
- Nowak, M.A. Evolutionary Dynamics: Exploring the Equations of Life; Harvard University Press: Chicago, IL, USA, 2006. [Google Scholar]
- Kuzdas, C.; Warner, B.P. Conflict and Cooperation Costa Rica’s Water Sector: Lessons for Water Management. In The Ecolaboratory: Environmental Governance and Economic Development in Costa Rica; University of Arizona Press: Tucson, AZ, USA, 2020; pp. 276–289. [Google Scholar]
- Warner, B.P.; Kuzdas, C.; Yglesias, M.G.; Childers, D.L. Limits to adaptation to interacting global change risks among smallholder rice farmers in Northwest Costa Rica. Glob. Environ. Chang. 2015, 30, 101–112. [Google Scholar] [CrossRef]
- Kaune, A.; Werner, M.; Rodríguez, E.; Karimi, P.; de Fraiture, C. A novel tool to assess available hydrological information and the occurrence of sub-optimal water allocation decisions in large irrigation districts. Agric. Water Manag. 2017, 191, 229–238. [Google Scholar] [CrossRef]
- OECD. Agricultural Policies in Costa Rica; OECD Publishing: Paris, France, 2017. [Google Scholar] [CrossRef]
- Hunt, C.A.; Durham, W.H.; Driscoll, L.; Honey, M. Can ecotourism deliver real economic, social, and environmental benefits? A study of the Osa Peninsula, Costa Rica. J. Sustain. Tour. 2015, 23, 339–357. [Google Scholar] [CrossRef]
- Lansing, D.; Bidegaray, P.; Hansen, D.O.; McSweeney, K. Placing the plantation in smallholder agriculture: Evidence from Costa Rica. Ecol. Eng. 2008. [Google Scholar] [CrossRef]
- Morales, L.; Pratt, L. Analysis of the Daniel Oduber Quirós Airport, Liberia, Guanacaste; Center For Responsible Travel: Washington, DC, USA, 2010. [Google Scholar]
- University of Florida; Organización de Estudios Tropicales; Universidad de Cooperación Internacional. Taller de Creación de Escenarios Futuros Sobre los Recursos Hídricos, el Ambiente, la Agricultura y Los Medios de Vida Bajo el Cambio Climático en la Cuenca Arenal-Tempisque; 2018; unpublished report. [Google Scholar]
- Peterson, G.D.; Cumming, G.S.; Carpenter, S.R. Scenario planning: A tool for conservation in an uncertain world. Conserv. Biol. 2003, 17, 358–366. [Google Scholar] [CrossRef]
- O’Brien, F.A. Scenario planning—Lessons for practice from teaching and learning. Eur. J. Oper. Res. 2004, 152, 709–722. [Google Scholar] [CrossRef]
- Gunawardena, J. Some lessons about models from Michaelis and Menten. Mol. Biol. Cell 2012, 23. [Google Scholar] [CrossRef] [PubMed]


Publisher’s Note: MDPI stays neutral with regard to jurisdictional claims in published maps and institutional affiliations. |
© 2021 by the authors. Licensee MDPI, Basel, Switzerland. This article is an open access article distributed under the terms and conditions of the Creative Commons Attribution (CC BY) license (http://creativecommons.org/licenses/by/4.0/).