1. Introduction
Phosphorus (P) is a key plant nutrient for which there is no substitute. Global demand for P relates primarily to its use as fertilizer in the agricultural sector, although all types of biomass production as well as some other industrial activities require P. The current flow of P through society is to a considerable extent linear, with much of the P in fertilizers originating from phosphate rock deposits. Deposits are steadily declining both in terms of quantity and quality [
1]; most of the ones that remain either reside in geopolitically unstable regions, contain high amounts of cadmium, or are costly to mine due to low concentrations or challenging locations [
2,
3]. New deposits form slowly and very specific geochemical conditions are required for formation to occur [
4]. There is only one P mine in Europe, located in Finland. Therefore, Europe, including Sweden, is heavily dependent on imported P. This has led the EU to place P on its list of critical raw materials [
5]. In an era where biomass production sectors are under pressure from increasing demand for both food and energy and the concept of bioeconomy is gaining momentum, responsible nutrient management is essential to ensure high productivity in the future.
When emitted to aquatic environments, P can lead to excessive growth of algae and cyanobacteria [
6]. This can cause anoxic bottom zones, also known as “dead zones”, which are serious problems in water bodies. It has been a particularly severe problem in the Baltic Sea, a brackish arm of the North Atlantic Ocean towards which Sweden has a long coastline. The Baltic Sea currently hosts the largest dead zone in the world [
7].
Making today’s P flows more circular is essential to secure future biomass production and mitigate eutrophication. In attempts to understand current and potential future P flow patterns, Material Flow Analyses (MFAs) have been conducted for P for many countries [
8]. In Sweden, such studies have been made both at the level of individual municipalities [
9,
10,
11,
12,
13] and at the national level—for flows to and from various production sectors [
14,
15] as well as for the forestry sector [
16]. The studies at the national level have found that large amounts of P are lost from Swedish biomass production, e.g., to landfill. Building further on these previous studies, this study assesses the recirculation potential for P in Sweden through evaluating the extent to which recirculation of currently under-utilized flows can meet fertilizer needs for biomass production in agriculture and forestry in Sweden. The joint consideration of recirculation scenarios for agriculture and forestry, in conjunction with the conceptualization of P flows as either renewable or non-renewable, provides a novel perspective to the discussion on the circularity of P flows at the national level in Sweden. The inclusion of forestry should also be of interest globally, as P recirculation in the forestry sector has received limited attention.
2. Materials and Methods
This study is based on MFA [
17,
18]. Based on national statistics and other available literature, P containing flows entering or exiting the Swedish system, as well as flows between different production sectors, were quantified in a prestudy to this study [
19]. The reference year was 2017, and data were acquired for this year when available. In other cases, data from the latest year available were used; data from 2018, however, were avoided, since that was an extraordinarily warm and dry year in Sweden with low biomass production. The respective calculations and uncertainty estimations for all flows relevant for the current study are provided in the
Supplementary Materials.
In order to assess the recirculation potential for P in Sweden, sizeable flows that were seen to be partially or completely lost with regard to biomass production (here called either waste flows or flows to landfill or equivalent) were reviewed with regard to their size, concentration, plant availability, contamination and geo-spatial distribution. In terms of geo-spatial distribution, the geographic location as well as the size of the flows at the origin was evaluated. For losses to the aquatic environment, only the size of the flows was evaluated.
Based on the evaluation of under-utilized flows, recirculation scenarios were generated, and the P recirculation potential was assessed for agriculture and forestry, respectively. For agricultural land, the amount that could potentially be recirculated was compared to the current P input to agricultural land. For forest land, the amount that could potentially be recirculated was compared both to the amount of P currently applied and the amount currently removed from forest land. This was done because there are substantial uncertainties concerning the size of the inputs to forest land.
In this paper, all flows are expressed in metric tons per year.
3. Results
3.1. Current P Flows
3.1.1. P Requirements for Agriculture and Forestry
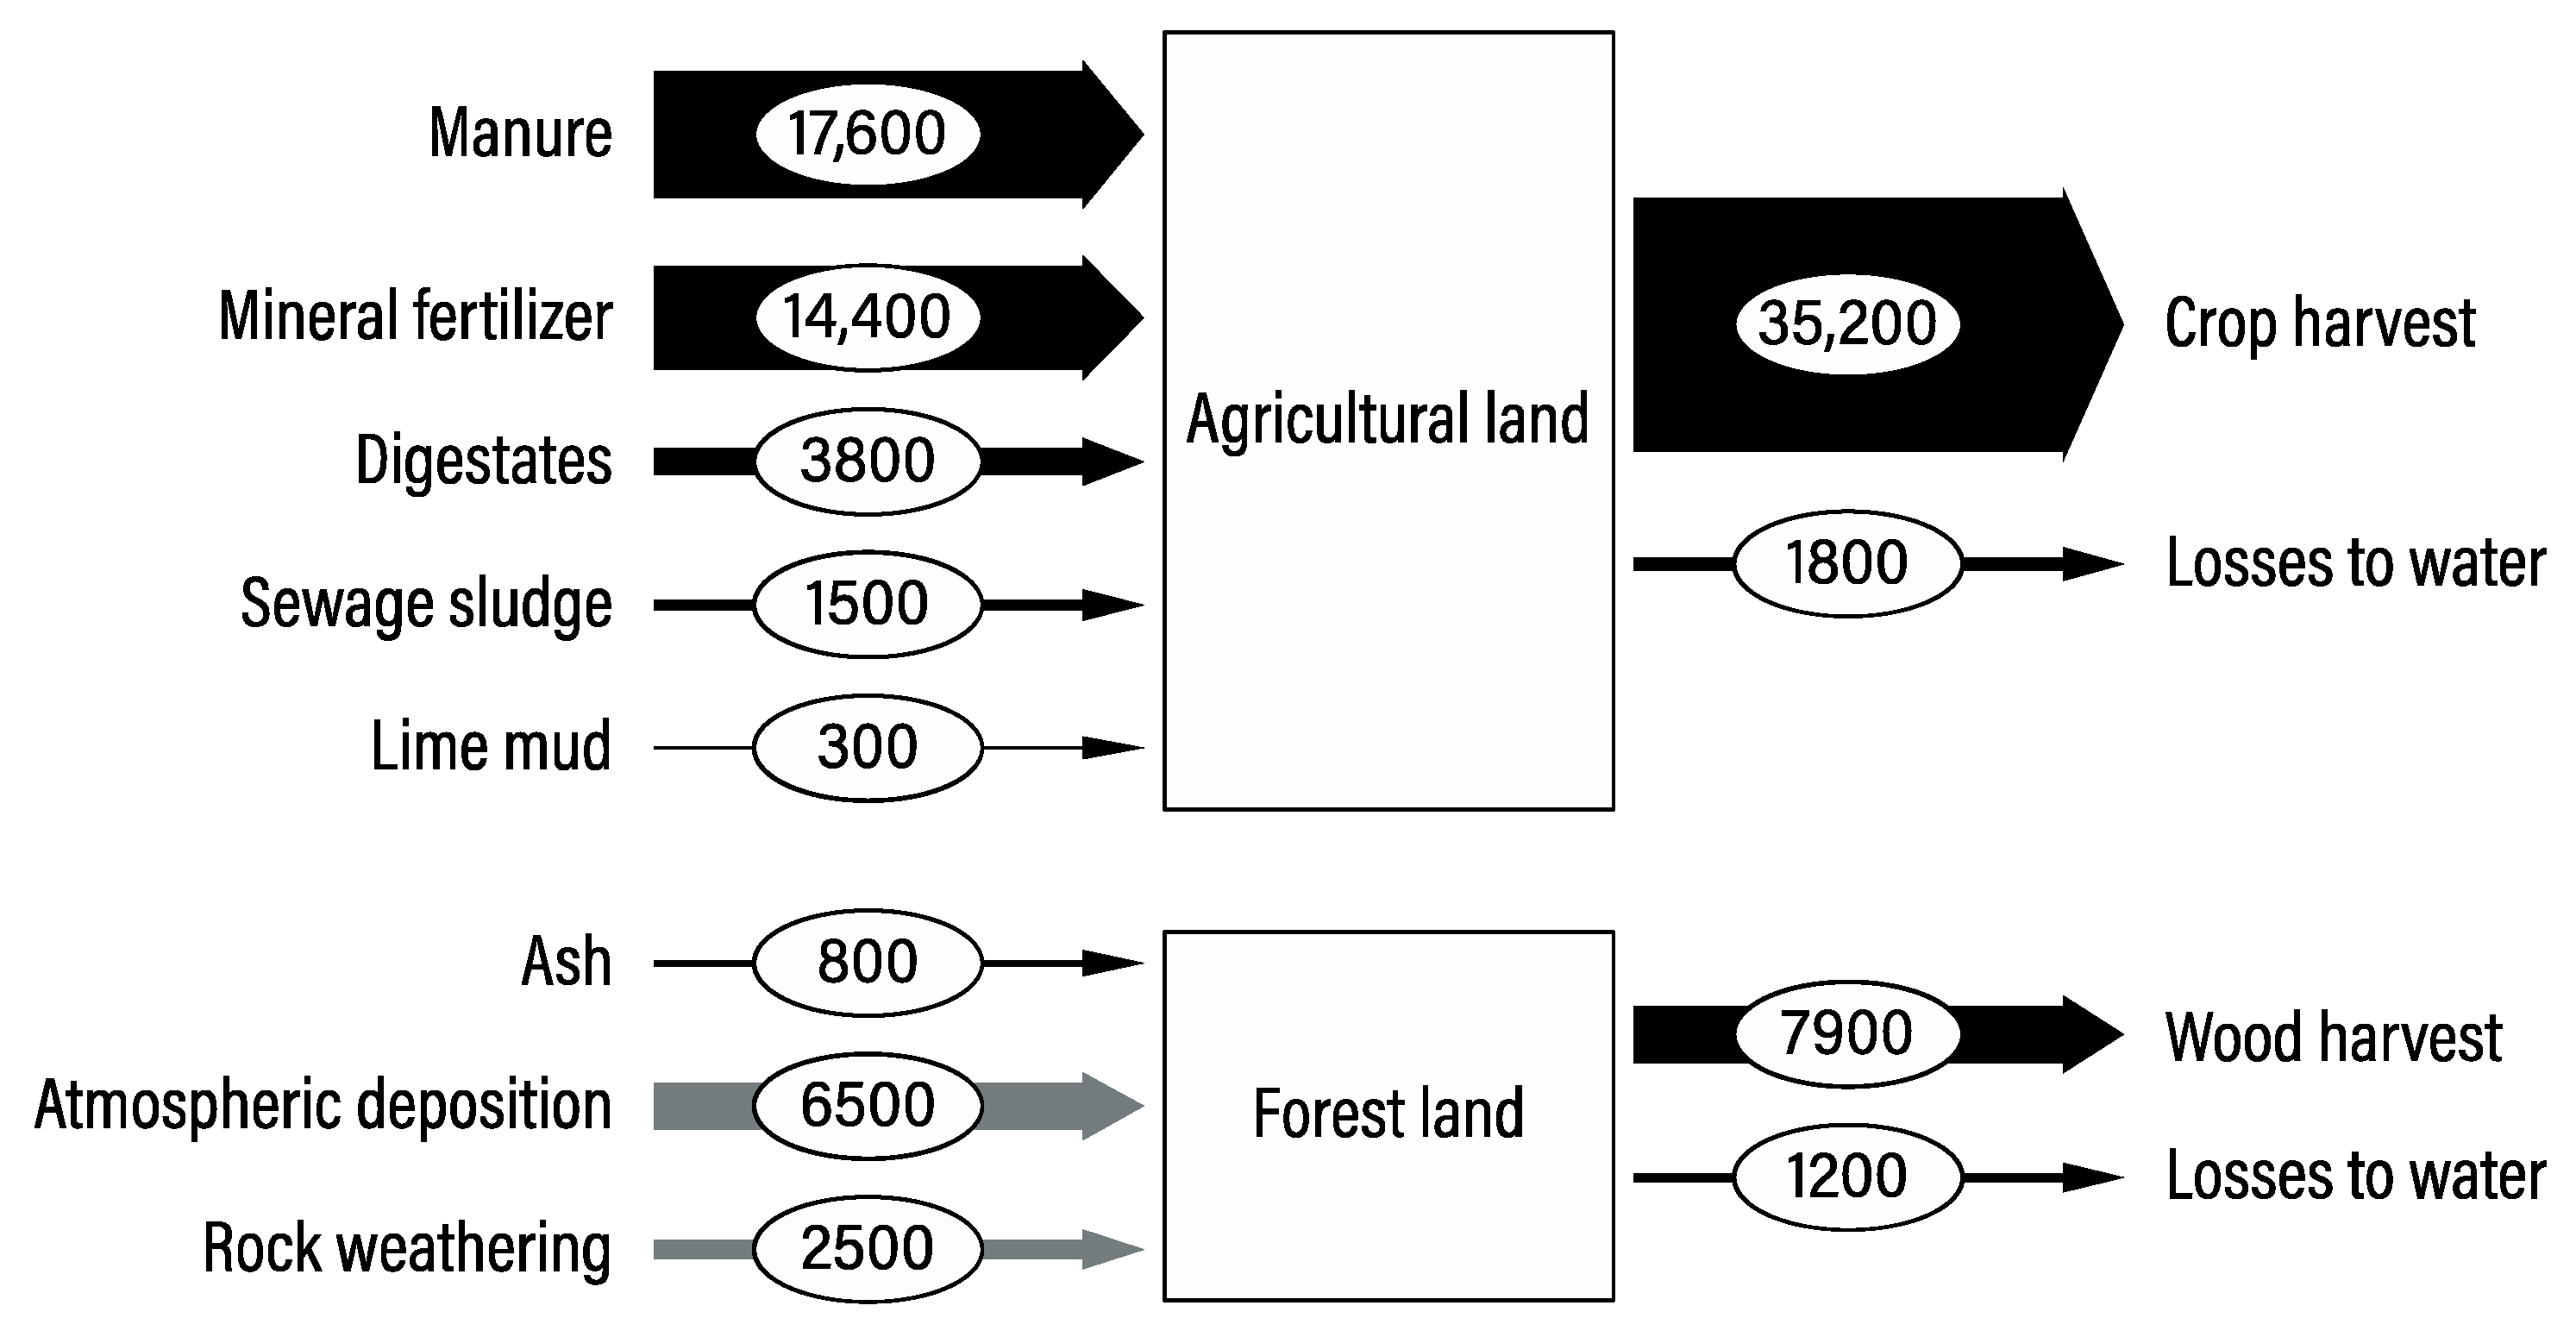
Biomass production on agricultural land in Sweden is highly dependent on imported mineral P fertilizer; see
Figure 1. It is worth noting that the mineral fertilizer input to agricultural land is not the only P being imported to the Swedish agricultural sector; large amounts of P are also imported in the form of animal feed and food items; see
Figure 2. The P in these flows may also originate from mineral reserves, before passing through biological systems. Plenty of P is exported through food items, mainly in the form of cereals.
Neither atmospheric deposition nor rock weathering are as important inputs for agricultural land as they are for forest land, since the forest area is around ten times larger than the area used for agriculture in Sweden [
20]. For these reasons, quantification of these flows was not attempted and they are thus not shown for agricultural land. Estimates for atmospheric deposition have varied by an order of magnitude in previous studies [
14]. What is referred to as atmospheric deposition is not deposition of gaseous compounds with near constant concentrations in the air, which is the case for nitrogen. Rather, it is in the form of dust or aerosols being blown by the wind from one reservoir to another [
21]. To get an accurate estimation of what the atmospheric deposition actually amounts to, one would have to map it in fine grid, but that has not yet been done and is beyond the scope of this study. It is also possible that more P is blown off from agricultural land than what is deposited, which would make atmospheric deposition a net negative for agricultural land.
Note that inputs and outputs are not completely balanced in
Figure 1, neither for agricultural nor for forest land. Inputs are slightly larger than outputs; the differences reflect gaps and uncertainties. However, for agriculture, where inputs and outputs are mostly intentional and uncertainties much lower, a good balance seems to exist.
3.1.2. P Flows to the Aquatic Environment and Landfill or Equivalent
Large amounts of P are lost from the biomass production system either to the aquatic environment (e.g., as runoff from agricultural and forest land) or in other ways (e.g., in the form of ashes from incineration being landfilled). Losses are summarized in
Figure 3. The characteristics of the flows lost from biomass production are further discussed later in this Section.
Figure 3 shows that there are considerable amounts of P in mining waste, wood ashes and sewage sludge that are currently not utilized in biomass production. The amount of P in mining waste is very large in relation to all other flows combined. With regard to losses to the aquatic environment, runoff from agricultural and forest land both constitute large flows.
3.2. Recirculation Potential
Flows to landfill or equivalent are here described based on size, concentration, plant availability and geo-spatial distribution, to allow for an assessment of which flows are suitable for recirculation to agriculture and forestry and of where more information is needed. The flows are shown in
Figure 3 (left side) and some characteristics are provided in
Table 1. In the end of this section, losses to the aquatic environment (right side of
Figure 3) are briefly discussed.
3.2.1. Forest Industry
Wood ashes from the forest industry. Wood ashes from the forest industry (flow 1 in
Figure 3) mainly come from burning bark from stemwood for energy in saw and pulp mills. The cadmium content is much higher than what is allowed for agricultural purposes [
22]. The majority of the cadmium, however, finds its way into fly ashes during combustion, leaving the bottom ashes with lower concentrations [
23].
Even if the contamination might hinder usage in agriculture, ashes can still find use in forestry. According to Kiikkilä and colleagues (2003) [
24], spreading wood ashes rich in cadmium on forest soil has only minor negative impacts on soil biota. Experiments have suggested that P availability in these ashes is comparable to that of mineral fertilizer [
25]. However, another study [
26] suggests that ashes from wood (as well as sludge, meat and bone) have low plant availability, based on their low solubility in various solvents. Therefore, further studies of the plant availability of P in wood (and other) ashes are warranted [
27].
Bio-sludge. Bio-sludge is a by-product from wastewater treatment in the pulp and paper industry (flow 2 in
Figure 3). Anaerobic digestion of bio-sludge has been discussed, with the goal of producing biogas and applying digestates in agriculture, but the heavy metal contamination can be considerable. Contaminants exist in the form of copper, zinc, cadmium and chromium, and large amounts of other material would have to be co-treated in order for the digestates to be diluted to a level of contamination acceptable in agriculture [
28]. Processes have been developed to separate P from bio-sludge, for example by incineration and subsequent P extraction from the ashes [
29], but they are expensive and not in use today. A pilot facility in which the bio-sludge is processed into hydro-char is currently being tested in Finland [
30]. The hydro-char generated in that location is to be used as a fuel. The process allows for P to be separated, either before or after combustion [
31].
Other flows in the forestry sub-system. Both green liquor dregs (flow 3 in
Figure 3) and lime mud (flow 4 in
Figure 3) are separated from the pulp-making process because of the content of process contaminants. While green liquor dregs contain lead and mercury [
32], lime mud contains large amounts of cadmium [
33,
34], which combined with low P concentrations leads to a high concentration of contaminants per kg P. Based on the low total P content, low concentration, contaminants and that these are geographically dispersed across the country, they do not seem very interesting to recirculate. However, some lime mud is already applied to agricultural land because of its ability to amend acidic soils [
35], and thus also provides other benefits in addition to P. P in lime mud is present as rhenanite [
36], which has intermediate plant availability [
37].
3.2.2. Waste and Wastewater Management
Ashes from solid waste treatment. P in mixed ashes from the solid waste treatment sub-system (flow 5 in
Figure 3) originates from food, paper and wood waste. This organic waste is co-incinerated with many other types of materials, in the form of mixed household waste [
38]. The presence of other material generally dilutes the P concentration to a point where the ashes are no longer a valuable P source. Since a large part of the P in these ashes stems from food waste, it may be wiser from a P management perspective to work towards having more food waste digested or composted rather than trying to separate P from the ashes.
Compost. Compost produced in central composting facilities (flow 6 in
Figure 3) originates from mixed food waste, vegetable food waste and/or manure. Composting at individual farms was considered an internal flow within the agricultural system and is not included in this figure. According to Bernstad and la Cour Jansen (2011) [
39], P in compost has a 1:1 substitution ratio when compared to mineral fertilizer. Only limited testing has been performed for compost in Sweden, but cadmium contents seem relatively high [
40]. Compost from these composting facilities is currently not recirculated to industrial biomass production. Instead, it is used in private gardens and similar.
Sewage sludge. Around one third of the sewage sludge produced (flow 7 in
Figure 3) is recycled to agricultural land every year. In terms of contaminants, sewage sludge contains pathogens [
41], microplastics [
42], various organic contaminants [
43] and heavy metals [
44]. In addition to the laws regulating contaminants in Sweden, there is a voluntary certification system, REVAQ, for sewage sludge that is to be applied to agricultural land, in which contaminants are limited to a certain threshold value. For example, cadmium is limited to 30 mg/kg P [
39]. P is usually precipitated with iron or aluminum in Swedish wastewater treatment plants, which creates relatively strong bonds. The plant availability of sewage sludge has therefore been a subject of intense debate but is often said to be lower than that of mineral fertilizer [
45]. There are considerable geo-spatial limitations for sewage sludge, since some of the more remote wastewater treatment plants cannot reasonably transport their sludge to agricultural lands. This is especially true for northern Sweden, which has very little agricultural land in comparison to the southern parts of the country. There are, however, many emerging technologies that aim to address this problem through separation of the P from wastewater, sludge or sludge incineration ashes [
46,
47].
3.2.3. Mining and Steel Industry
Mining waste. The amount of P in mining waste (flow 8 in
Figure 3) is very large compared to other national flows. P is in the form of phosphates such as fluorapatite [
48]. This could be used to produce phosphate fertilizer, which is generally derived from apatite. The mining operations and reserves are located in the northern parts of Sweden, far from most agricultural regions. However, since concentrations are high, and reserves are concentrated to a few places, this should not be a major concern for fertilizer production. The mining company LKAB is currently investigating the potential to produce phosphate fertilizer from this mining waste [
49]. However, there is arsenic present [
50], which is a large concern when producing fertilizers. According to the company Ragn-Sells, that was running a pilot plant in cooperation with LKAB in 2019, the concentration of arsenic is 500 ppm [
51]. In addition to the annual generation, mining waste has accumulated in reservoirs over the years. These currently hold around 1,500,000 tons of P [
50]. However, extracting the P in the mining waste that is already in reservoirs is problematic because of the permafrost [
51].
LD-slag. LD-slag (flow 9 in
Figure 3) is a by-product from steel production with the Linz-Donawitz process. It would have to be treated before agricultural use, probably through extraction of the P. Extracting P from LD-slag would not only be beneficial as a way to produce P fertilizer, but other components of the LD-slag could also potentially be returned to the process if the P is separated. Marhual and colleagues (2011) [
52] suggest that the P in LD-slag is in the form of calcium phosphate, or in a calcium silica matrix.
3.2.4. Other Industrial Sectors
Ashes from wood in the energy sector. Wooden material that is unfit for industrial production of timber and pulp, such as sticks and tops, enters the energy sector and is burned for energy recovery. P ends up in ashes (flow 10 in
Figure 3), and some of these ashes are spread on forest land, but most are landfilled. It is reasonable to assume lower P concentrations than for ashes from the pulp and paper industry because of the lower share of bark, which has a higher P content. Contamination is probably similar to ashes from the pulp and paper industry. As mentioned in
Section 3.2.1, studies on plant availability of P in ashes from wood are few and contradictory.
Ashes from Biomal. Biomal is a type of biofuel that is produced from animal by-products and carcasses that are classified as biological risk material. Other than potential pathogens, no contaminants have been indicated. Ashes from incineration of Biomal (flow 11 in
Figure 3) are, however, currently classified as biological risk material, and can therefore not be legally recirculated to agriculture [
53]. P is probably largely present in the form of apatite, which is the form of P that is generally present in bones [
26]. Apatite has to be treated to achieve high plant availability. Biomal is produced in one centralized plant in Sweden and incinerated in a handful of heat and power plants in southern Sweden.
3.2.5. Summary of Flows to Landfill or Equivalent
Table 1 summarizes the characteristics (size, concentration, plant availability, contamination and geo-spatial distribution) of each flow described in
Section 3 The current level of recirculation to biomass production sectors is also shown, as well as which production sector (agriculture or forestry) flows are assumed to be recirculated to in
Section 4.
3.2.6. Losses to the Aquatic Environment
Since emissions from wastewater treatment are relatively small in Sweden, measures that will increase the efficiency of P use in agriculture are likely the most effective forms of emission abatement. Such measures could be in the form of more careful selection of fertilizer type, amount, time of application and location, e.g., according to the RRRR concept [
55]. The idea behind this concept is that nutrient emissions can be drastically lowered while yields are kept high through more efficient nutrient management techniques. This can for example be through utilizing novel technologies for mapping P requirements of different stretches of land in a fine mesh. Agricultural measures such as these could be very valuable as they have the potential to reduce both losses of and demand for mineral P. Another way to reduce emissions is through the trapping of P from agricultural runoff in filters [
56]. Similar measures for forestry are likely not of interest because of lower P concentrations in flows from these larger areas.
Over time, P emitted to aquatic environments has accumulated in sediments. In the Baltic Sea, P fluxes to the water column from sediments are now larger from these “past sins” than from land [
7]. Several geo-engineering propositions have been made for reducing these fluxes, such as dredging the nutrient-rich sediments or precipitating P through iron or aluminum addition to the water column. However, it is not clear how effective such measures could be, or what other effects they could have. Dredging, for example, can have other environmental consequences, such as affecting decomposition rates of organic matter [
57] and disturbing ecosystems in other ways. Another approach that could be employed is to harvest and remove different types of biomass (such as cultivated macroalgae or naturally growing reeds) from the sea [
58] which would remove nutrients from the ecosystem. It may be possible to utilize the nutrients in such biomass after harvest, e.g., after digestion or incineration with subsequent P extraction.
4. Discussion: Towards a Circular P Economy?
Based on the size and characteristics of different flows, recirculation scenarios for P in Sweden were generated in which the loop was closed for some currently under-utilized flows. Agricultural land and forest land were treated separately in the assessment. For agricultural recirculation, a distinction was made between renewable sources that are already part of biological systems and non-renewable sources (only flows 8 and 9 in
Figure 3); the terms primary and secondary were not used as phosphorus recovered from mining waste can be considered to be secondary although it is not renewable. No such division was necessary for forestry, since all of the flows that were considered for recirculation are renewable. In the scenarios, it was assumed that the P in the flows is fully utilized. This is likely an over-estimation: the P in many of the flows is likely less available to plants than P in mineral fertilizer (as discussed in
Section 3), and treatment or extraction processes would probably be required for some of the flows which would result in losses. As such, the presented scenarios should be interpreted as illustrations of the theoretical recirculation potential of P in Sweden and not necessarily as practically viable pathways.
4.1. Recirculation to Agricultural Land
Agricultural land had an input of about 37,500 tons of P, and an output of around 37,000 tons, including losses to water. Uncertainties considered, agricultural land therefore seems to be in relatively good balance in terms of input and output of P on a national scale. Of the total input, 47 percent came from manure and 38 percent from mineral fertilizer; see
Figure 4. Swedish agricultural production is thus currently heavily reliant on imported mineral P and the current P recirculation level for agriculture can be said to be 62 percent. The rest of the input to agricultural land consists of digested sewage sludge (4 percent), other digestates (including the manure sent to co-digestion facilities) (10 percent) and lime mud (1 percent).
P is thus currently already recirculated in the form of manure, various digestates and sludge from the waste and wastewater treatment sector. It could be assumed that all of the P-containing flows of the waste and wastewater treatment sector (flows 5–7) can be used, as well as additional P from sewage sludge that is not currently utilized, compost, and food waste that is currently being incinerated as mixed waste; practically all digestates are already being recirculated. P in sewage sludge that is not yet recirculated to agriculture could then add another 10 percent of the total input, compost 1 percent, and the food waste that is incinerated another 3 percent. This means that the total additional recirculation potential from the waste and wastewater treatment sector compared to 2017 is equivalent to more than a third of the P input from imported mineral fertilizer, or 14 percent of the total P input to agricultural land. There are also a couple of renewable P flows available for recirculation other than those from the waste and wastewater treatment sector. P in lime mud which is landfilled (flow 4 in
Figure 3) could constitute another 1 percent of the input and P in biological risk material from the burning of Biomal 1 percent. Together, all of these renewable, currently under-utilized flows, make up around 41 percent of the P in added mineral fertilizer, or almost 16 percent of the total P input to agricultural land.
Additionally, about 60,000 tons of P are landfilled each year in the form of mining waste (flow 8 in
Figure 3), and almost 1500 tons of P end up in LD-slag from the steel industry (flow 9 in
Figure 3). These two flows alone make up more than four times what is needed in terms of mineral P input to Swedish agricultural land, and it could therefore, if recovered, also be partially exported from Sweden. However, it has to be remembered that this is a non-renewable input that is not (yet) part of a circular system and that mining and metallurgical activities are drivers of the generation of these flows. Adding these flows could guarantee future supply as long as these activities are ongoing, but it would add mineral P to the system and would not be true recirculation. Net additions to a circular system would in principle only be acceptable if the system itself grows during a limited period (e.g., if agricultural land area or intensity increase) and if the element can be contained in the system.
All in all, with the scenarios described above and shown in
Figure 4, the (input-based) recirculation of P in Swedish agriculture could increase from 62 percent to 77 percent if only renewable phosphorus sources are utilized. If also sources that originate in mining activities in Sweden are utilized, this could easily remove the need for imported mineral P and even make Sweden a net exporter of P fertilizers.
4.2. Recirculation to Forest Land
Not counting atmospheric deposition and rock weathering, Swedish forest ecosystems seem to be in a state of considerable nutrient imbalance, with around 7900 tons of P leaving the system every year (first bar in
Figure 5) and only 800 tons being returned in the form of ashes. This means that only around 10 percent of the P that is removed from forest land is actively returned each year. Some of the remaining demand is filled through atmospheric deposition and rock weathering. What these flows actually amount to, however, is highly uncertain. If these flows are on the lower end of estimates (second bar in
Figure 5), there is a continuous depletion of P in Swedish forest soil. If they are on the higher end of estimates (third bar in
Figure 5), however, input and output may be in balance.
Ashes from the burning of wood (flows 1 and 10) seem like a natural match for recirculation to forest land, since these ashes should, in addition to P, contain other non-volatile macro- and micronutrients in proportions that match the forest’s needs. These ashes constitute around 4500 tons of P in total for both the energy and forestry sectors, not counting the 800 tons already being applied to forest land. If the bio-sludge from the pulp industry (flow 2 in
Figure 3) could also be returned to forest land, that would bring another 1000 tons of P. Since some lime mud is already applied in agriculture, it was assumed that recirculation to agricultural land should be the target for the currently landfilled lime mud as well (flow 4 in
Figure 3; only a few hundred tons). Green liquor dregs (flow 3 in
Figure 3) were not considered suitable for recirculation as per the assessment made in
Section 3.
Together, bio-sludge and currently un-utilized ashes from the burning of wood make up around 5500 tons of P (last bar in
Figure 5). If these flows can be recirculated to forest land, an additional 70 percent of the P leaving forest land each year could be actively returned. This means that with the described scenario, the (output-based) recirculation could increase from 10 percent to 80 percent (not counting atmospheric deposition and rock weathering at all) potentially improving the long-term productivity of Swedish forestry. However, if the amounts of P from rock weathering and atmospheric deposition are on the higher end of estimates, then recirculating ashes may in fact lead to excessive P concentrations in certain areas, which may impact the quality of the produced biomass. This warrants further studies on the size of these flows. Nevertheless, it seems that it should be possible to achieve a good balance between inputs and outputs without the addition of any mineral (non-renewable) P.
4.3. Discussion of Results
4.3.1. The Potential for Plausible Recirculation Efforts to Make a Significant Difference
In Swedish agriculture, currently under-utilized flows of P cannot fully replace P from mineral fertilizer unless mining waste is used. Recirculation of flows that mostly originate from agriculture could increase from 62 to 77 percent. That completely closing the P loop is not possible is partially due to inefficiencies and losses in the agriculture and food production sector. Changes in agricultural practices, such as improving efficiency in fertilizer application, are therefore required in addition to recirculation efforts in order to decrease the dependency on mineral P input.
For Swedish forestry, the (output-based) active recirculation level could increase from today’s 10 to 80 percent if additional flows that are not yet recirculated are added. This would potentially provide a better P balance for Swedish forest soil. These flows are primarily bio-sludge and ashes from pulp and paper mills as well as from the bioenergy sector. Experiments with ash recirculation, such as through ash granules, should be further encouraged. The amount of P that needs to be recirculated to forest land, however, depends on the rate of weathering and atmospheric deposition, which are highly uncertain.
For many of the considered recirculation efforts to be possible, development or changes are required in terms of technology, transportation, etc. Some of this was mentioned in
Section 3 In the scenarios generated in this study, all of these conditions and requirements were considered to be in place; also, it was assumed that all of the P in considered flows could be utilized, which is an overestimation in most cases. However, the purpose of the reported study was not to make a detailed recirculation plan but rather to check if plausible recirculation efforts could make a significant difference, which they could. It is worth noting that while there are plenty of novel technologies for P recovery from waste streams, few are sufficiently mature for industrial implementation [
58]. In general, such processes have economic challenges [
59] and will not be economically viable unless the value of other benefits such as parallel recovery of other resources (e.g., nitrogen or energy) or food security are included [
60].
4.3.2. The Need for Abating Emissions to the Aquatic Environment
Emissions to the aquatic environment constitute a significant portion of the total P losses in the system. To achieve efficient abatement of these emissions, the agriculture and food production sectors should be in focus. Manure application is much higher in areas with high animal density, which leads to an excess of P being applied in those areas [
61]. If P can be transferred from these areas to areas that are deficient in P, emissions of P and other nutrients can likely be reduced. Life cycle assessments have indicated positive outcomes for such scenarios for Norway [
62] and Denmark [
63].
4.3.3. The Benefit of Digesting Instead of Incinerating Food Waste
There is significant potential to increase the recirculation of P by increasing the amount of food waste going to digestion rather than incineration. Co-incineration of food waste and other waste today dilutes the P concentration to the point where it is not economically feasible to recover P from the ashes. Alternatively, avoiding mixing flows with higher P content with other flows before incineration could help to provide ashes with high enough P content for economic P recovery.
4.3.4. There Is Strong Potential for P Recovery from Sewage Sludge
For sewage sludge, there is a considerably larger potential than what is currently exploited. As long as conventional urban drainage systems and wastewater treatment plants are in use and hence sewage sludge is produced, policies should be designed to ensure that it is either used, treated or stored in centralized storage to facilitate future usage. Some of the current uses, such as for construction soil, are a waste from the perspective of biomass production. Recent developments with regard to proposed changes in legislation in Sweden suggest that recovery of 60 percent of the P in sludge could be mandated in the future and that only very clean sludges, if any, can be spread on agricultural soil. P would then mostly have to be extracted from wastewater, from sludge or from sludge incineration ash before use. If 60 percent of the total P in sewage sludge would be recovered and used as an agricultural fertilizer, this would correspond to 8 percent of the total input, and 22 percent of the mineral P input. The amount of P in sewage sludge currently recirculated corresponded to 4 percent of the total input, or 10 percent of the mineral P input.
4.3.5. Full Independence from Non-Renewable P Sources Is Implausible
Regardless of what measures are taken, Sweden is likely going to remain dependent on mineral P in the foreseeable future, particularly in agriculture. In this context, it should be noted that the amount of P in mining waste is very large in comparison to other national flows. This type of mineral P is not from a renewable resource. However, the P currently circulating in the system largely stems from mineral reserves too, although it may already have made one or several loops. It can be argued that the increase in P intensity by the addition of mineral sources of P has been a prerequisite for intensified agricultural practices. The problem, however, is the constant increase in mineral P in the system. As long as losses appear, this will create problems related to the occurrence of excessive amounts of nutrients in different environments. Moreover, we may eventually be running the biomass production systems at a too high production rate. The issue of how we manage biogeochemical flows of P (and nitrogen for that matter) on the planet was highlighted by Steffen and collaborators (2015) [
64] in the assessment of how different planetary boundaries for important earth systems are transgressed. P flows were deemed to be in a red zone, i.e., high risk.
4.3.6. P in Mining Waste Could Be a Valuable Resource
Considering today’s input levels, the P in the mining waste that is already stored in water reservoirs would be enough to sustain Sweden’s needs of mineral P for around one hundred years, if P extraction proves feasible. As such, the P in mining waste could be a valuable national resource that could ensure food security if imports become less viable and even if Swedish mining industry would decline.
4.4. Limitations of the Study
This study was delimited to one specific year that is believed to be representative for at least a ten-year period in terms of climate, agricultural practices, imports and exports of biomass products, technologies, etcetera. However, should any of these factors change rapidly, the results need to be seen in the light of such changes. Further, the focus on Sweden does not allow for conclusions to be transferred to other countries without an analysis of potential differences. As an example, the neighboring country of Norway has a very strong aquaculture and fishery sector that needs to be taken into account as P flows through that sector are considerable [
65].
For some of the P containing flows related to, e.g., agricultural produce and products from food industry, detailed information is lacking. However, it is believed that for the purpose of the current study that looked into the theoretical recirculation potential, orders of magnitude are still correct, and further detail would not have changed the main conclusions. Other important gaps in data relate, e.g., to atmospheric deposition and rock weathering. Although not changing the overall conclusion from this study that a balance for forest soil could be achieved, more detailed data would be needed if specific plans targeting P balances would be drafted. Further, for any plans to make sure that P addition is balanced to P needs, the geographical resolution of data needs to be increased compared to what is studied and presented here for the national system.
5. Conclusions
There is considerable potential for increasing the circularity of P flows in both agriculture and forestry in Sweden through recirculating waste flows; the active P recirculation could increase from 62 to 77 percent for agriculture and from 10 to 80 percent for forestry. Human excreta and wood ashes stand out as large, renewable sources of P that are currently under-utilized.
Just recirculating renewable waste flows, however, is not enough to replace all of the mineral P in agriculture. Therefore, inefficiencies in agriculture also have to be addressed if Sweden is to be independent from mined mineral P. In addition to renewable waste flows, the mining waste produced in Sweden contains very large amounts of P. While not technically a renewable resource, this material could prove important for securing biomass production in the future. As this study has provided information on the theoretical potential for recirculation but not on the viability of the use of specific recirculation technologies, more studies are needed that shed light on how much of the theoretical potential that can be harnessed. Future studies could also look into the need for redistribution between different parts of the country as well as various scenarios for reducing the need for P in agriculture, e.g., changes in agricultural practices and consumer dietary preferences.
Supplementary Materials
The following is available online at
https://www.mdpi.com/article/10.3390/su13073733/s1, Supporting Information: Summary of data that underpinned this work, notably uncertainty quantification, P-containing flows, P contents of different goods, and efficiencies of on-site wastewater treatment technologies.
Author Contributions
Conceptualization, M.S. and R.H.; methodology, D.L., M.S. and R.H.; formal analysis, D.L.; investigation, D.L.; data curation, D.L.; writing—original draft preparation, D.L.; writing—review and editing, M.S. and R.H.; visualization, D.L.; supervision, M.S. and R.H.; project administration, M.S. and R.H. All authors have read and agreed to the published version of the manuscript.
Funding
M.S. received funding from the InPhos project No. 17022 (2018–2020), which is financed by the EIT Raw Materials—a body of the European Union. M.S. also received funding from the Swedish Research Council for Environment, Agricultural Sciences and Spatial Planning (FORMAS) under grant agreement No. 2015-1116. R.H. received funding from the Swedish Research Council for Environment, Agricultural Sciences and Spatial Planning (FORMAS) under grant agreement No. 2016-00859.
Institutional Review Board Statement
Not applicable.
Informed Consent Statement
Not applicable.
Data Availability Statement
Not applicable.
Conflicts of Interest
The authors declare no conflict of interest.
References
- Cordell, D.; White, S. Life’s Bottleneck: Sustaining the World’s Phosphorus for a Food Secure Future. Annu. Rev. Environ. Resour. 2014, 39, 161–188. [Google Scholar] [CrossRef]
- Cordell, D.; Drangert, J.-O.; White, S. The story of phosphorus: Global food security and food for thought. Glob. Environ. Chang. 2009, 19, 292–305. [Google Scholar] [CrossRef]
- Reijnders, L. Phosphorus resources, their depletion and conservation, a review. Resour. Conserv. Recycl. 2014, 93, 32–49. [Google Scholar] [CrossRef]
- Filippelli, G.M. Phosphate rock formation and marine phosphorus geochemistry: The deep time perspective. Chemosphere 2011, 84, 759–766. [Google Scholar] [CrossRef] [PubMed]
- European Commision. EU List of Critical Raw Materials. 2017. Available online: https://ec.europa.eu/growth/sectors/raw-materials/specific-interest/critical_en (accessed on 20 July 2020).
- Correll, D.L. Phosphorus: A rate limiting nutrient in surface waters. Poult. Sci. 1999, 78, 674–682. [Google Scholar] [CrossRef]
- Svanbäck, A.; McCrackin, M. Internal Load. 2016. Available online: https://balticeye.org/en/eutrophication/policy-brief-internal-load/ (accessed on 16 July 2020).
- Jedelhauser, M.; Binder, C.R. Losses and efficiencies of phosphorus on a national level—A comparison of European substance flow analyses. Resour. Conserv. Recycl. 2015, 105, 294–310. [Google Scholar] [CrossRef]
- Nilsson, J. A Phosphorus Budget for a Swedish Municipality. J. Environ. Manag. 1995, 45, 243–253. [Google Scholar] [CrossRef]
- Cederberg, C. Flows of Plant Nutrients in Food Production and Consumption in a Swedish District. AMBIO 1999, 28, 502–508. [Google Scholar]
- Schmid Neset, T.S.; Bader, H.-P.; Scheidegger, R.; Lohm, U. The flow of phosphorus in food production and consumption—Linköping, Sweden, 1870–2000. Sci. Total Environ. 2008, 396, 111–120. [Google Scholar] [CrossRef] [PubMed]
- Kalmykova, Y.; Harder, R.; Borgestedt, H.; Svanäng, I. Pathways and Management of Phosphorus in Urban Areas. J. Ind. Ecol. 2012, 16, 928–939. [Google Scholar] [CrossRef] [Green Version]
- Wu, J.; Franzén, D.; Malmström, M.E. Anthropogenic phosphorus flows under different scenarios for the city of Stockholm, Sweden. Sci. Total Environ. 2016, 542, 1094–1105. [Google Scholar] [CrossRef] [Green Version]
- Linderholm, K.; Mattsson, J.E.; Tillman, A.-M. Phosphorus flows to and from Swedish agriculture and food chain. AMBIO 2012, 41, 883–893. [Google Scholar] [CrossRef] [Green Version]
- Linderholm, K.; Mattsson, J.E. Analys av Fosforflöden i Sverige. 2013. Available online: https://pub.epsilon.slu.se/9439/ (accessed on 12 March 2019).
- Staaf, H. Fosforflöden Inom Skogsbruket och Skogsindustrin. 2013. Available online: http://www.naturvardsverket.se/upload/miljoarbete-i-samhallet/miljoarbete-i-sverige/regeringsuppdrag/2013/fosfor/underlagsrapporter/fosforfloden-inom-skogsbruket-och-skogsindustrin-2013.pdf (accessed on 24 March 2019).
- Voet, E.V.D. Substance flow analysis methodology. In A Handbook of Industrial Ecology; Ayres, R.U., Ayres, L.W., Eds.; Edward Elgar Publishing Limited: Northampton, UK, 2002; pp. 91–101. [Google Scholar]
- Brunner, P.H.; Rechberger, H. Practical Handbook of Material Flow Analysis; Lewis: Boca Raton, FL, USA, 2004. [Google Scholar]
- Lorick, D. Assessing the Possibility of a Circular Economy for Phosphorus in Sweden [Chalmers University of Technology]. 2019. Available online: https://odr.chalmers.se/handle/20.500.12380/300108 (accessed on 20 July 2020).
- SCB. Markanvändningen i Sverige—Sjunde Utgåvan. 2019. Available online: https://www.scb.se/hitta-statistik/statistik-efter-amne/miljo/markanvandning/markanvandningen-i-sverige/pong/publikationer/markanvandningen-i-sverige/ (accessed on 5 April 2019).
- Tipping, E.; Benham, S.; Boyle, J.F.; Crow, P.; Davies, J.; Fischer, U.; Guyatt, H.; Helliwell, R.; Jackson-Blake, L.; Lawlor, A.J.; et al. Atmospheric deposition of phosphorus to land and freshwater. Environ. Sci. Process. Impacts 2014, 16, 1608–1617. [Google Scholar] [CrossRef] [PubMed] [Green Version]
- Ek, M.; Westling, O. Dagsläget Beträffande Skogsindustrins Avfall. IVL. 2003. Available online: http://scholar.google.com/scholar?hl=en&btnG=Search&q=intitle:Dagsl?get+betr?ffande+skogsindustrins+avfall#0 (accessed on 15 April 2019).
- Narodoslawsky, M.; Obernberger, I. From waste to raw material--the route from biomass to wood ash for cadmium and other heavy metals. J. Hazard. Mater. 1996, 50, 157–168. [Google Scholar] [CrossRef]
- Kiikkilä, O.; Moilanen, M.; Tervahauta, A.; Fritze, H. Cadmium-containing wood ash in a pine forest: Effects on humus microflora and cadmium concentrations in mushrooms, berries, and needles. Can. J. For. Res. 2003, 33, 2443–2451. [Google Scholar] [CrossRef]
- Li, X.; Rubæk, G.H.; Sørensen, P. High plant availability of phosphorus and low availability of cadmium in four biomass combustion ashes. Sci. Total Environ. 2016, 557–558, 851–860. [Google Scholar] [CrossRef] [PubMed]
- Langeveld, K. Phosphorus Recovery into Fertilizers and Industrial Products by ICL in Europe. In Phosphorus Recovery and Recycling; Springer: Singapore, 2019; pp. 235–252. [Google Scholar] [CrossRef]
- Kratz, S.; Vogel, C.; Adam, C. Agronomic performance of P recycling fertilizers and methods to predict it: A review. Nutr. Cycl. Agroecosyst. 2019, 115, 1–39. [Google Scholar] [CrossRef]
- Ericsson, T. Nuvärdesmaterial Kring Bioslam (Vol. 2). 2013. Available online: http://www.processum.se/images/dokument/FoU/BioslamBilaga2RapportF.pdf.pdf (accessed on 17 April 2019).
- Fuglesang, M.; Sivard, Å.; Törmälä, J.; Fougner, K. Biokol Från Bioslam—Pilotförsök. 2015. Available online: https://energiforskmedia.blob.core.windows.net/media/21214/biokol-fran-bioslam-energiforskrapport-2015-218.pdf (accessed on 16 April 2019).
- Stora Enso. From Hard-to-Handle Waste to Pure Bioenergy. 2019. Available online: https://www.storaenso.com/en/newsroom/news/2019/12/from-hard-to-handle-waste-to-pure-bioenergy (accessed on 22 August 2020).
- Axegård, P. Towards Industrial Implementation of HTC Treatment of Biosludge. 2019. Available online: https://greennorth.se/upload/images/nyheter/htc-presentationer/Peter-Axegard-C-Green-HTC-KONF-I-UMEA-2019-03-14.pdf (accessed on 22 August 2020).
- Mäkitalo, M.; Maurice, C.; Jia, Y.; Öhlander, B. Characterization of Green Liquor Dregs, Potentially Useful for Prevention of the Formation of Acid Rock Drainage. Minerals 2014, 4, 330–344. [Google Scholar] [CrossRef] [Green Version]
- Hultman, N.; Lundmark, S. Dammbindning av Grusvägar Med Mesakalk. 2007. Available online: http://www.diva-portal.se/smash/get/diva2:1016995/FULLTEXT01.pdf (accessed on 10 April 2019).
- Seefeldt, S.; (MEWAB AB, Karlstad, Sweden). Personal communication, 2019.
- The Swedish Board of Agriculture. Sockerbetor Behöver Välkalkade Jordar. 2018. Available online: http://www.jordbruksverket.se/amnesomraden/odling/jordbruksgrodor/sockerbetor/vaxtnaring/kalkning.4.32b12c7f12940112a7c800035459.html (accessed on 4 April 2019).
- Mousavi, S.M.; DeMartini, N. Fate of phosphorus in the lime cycle of the kraft pulping process. TAPPI J. 2020, 19, 139–148. [Google Scholar]
- Möller, K. Assessment of Alternative Phosphorus Fertilizers for Organic Farming: Chars, Ashes and Slags. 2016. Available online: https://improve-p.uni-hohenheim.de/fileadmin/_migrated/content_uploads/Moeller2016-Factsheet-Ashes.pdf (accessed on 24 April 2019).
- Swedish Environmental Protection Agency. Avfallsstatistik i Sverige 2016. 2016. Available online: https://www.scb.se/contentassets/842cdb4c880247b28fad6fef853a0526/mi0305_2016a01_br_misambr1801.pdf (accessed on 22 March 2019).
- Bernstad, A.; la Cour Jansen, J. A life cycle approach to the management of household food waste—A Swedish full-scale case study. Waste Manag. 2011, 31, 1879–1896. [Google Scholar] [CrossRef] [PubMed]
- Sternbeck, J. Förekomst av Föroreningar i Olika Avlopp- och av-Fallsfraktioner som är Relevanta för Fosforåterföring. 2013. Available online: http://naturvardsverket.diva-portal.org/smash/record.jsf?pid=diva2%3A711700&dswid=7546 (accessed on 26 March 2019).
- Straub, T.M.; Pepper, I.L.; Gerba, C.P. Hazards from Pathogenic Microorganisms in Land-Disposed Sewage Sludge BT—Reviews of Environmental Contamination and Toxicology; Ware, G.W., Ed.; Springer: New York, NY, USA, 1993; pp. 55–91. [Google Scholar]
- Mahon, A.M.; O’Connell, B.; Healy, M.G.; O’Connor, I.; Officer, R.; Nash, R.; Morrison, L. Microplastics in Sewage Sludge: Effects of Treatment. Environ. Sci. Technol. 2017, 51, 810–818. [Google Scholar] [CrossRef] [PubMed]
- Smith, S.R. Organic contaminants in sewage sludge (biosolids) and their significance for agricultural recycling. Philos. Trans. R. Soc. A Math. Phys. Eng. Sci. 2009, 367, 4005–4041. [Google Scholar] [CrossRef] [PubMed] [Green Version]
- The Swedish Water and Wastewater Association. REVAQ Årsrapport 2017. 2017. Available online: https://www.svensktvatten.se/globalassets/avlopp-och-miljo/uppstromsarbete-och-kretslopp/revaq-certifiering/revaq-arsrapport-2017.pdf (accessed on 23 April 2019).
- Kirchmann, H.; Börjesson, G.; Kätterer, T.; Cohen, Y. From agricultural use of sewage sludge to nutrient extraction: A soil science outlook. AMBIO 2017, 46, 143–154. [Google Scholar] [CrossRef] [PubMed] [Green Version]
- Harder, R.; Wielemaker, R.; Larsen, T.A.; Zeeman, G.; Öberg, G. Recycling nutrients contained in human excreta to agriculture: Pathways, processes, and products. Crit. Rev. Environ. Sci. Technol. 2019, 49, 695–743. [Google Scholar] [CrossRef] [Green Version]
- Johannesdottir, S.L.; Macura, B.; McConville, J.; Lorick, D.; Haddaway, N.R.; Karczmarczyk, A.; Ek, F.; Piniewski, M.; Księżniak, M.; Osuch, P. What evidence exists on ecotechnologies for recycling carbon and nutrients from domestic wastewater? A systematic map. Environ. Evid. 2020, 9, 1–14. [Google Scholar] [CrossRef]
- Jonsson, E.; Troll, V.R.; Högdahl, K.; Harris, C.; Weis, F.; Nilsson, K.P.; Skelton, A. Magmatic origin of giant ‘Kiruna-type’ apatite-iron-oxide ores in Central Sweden. Sci. Rep. 2013, 3, 1–8. [Google Scholar] [CrossRef]
- LKAB. LKAB Invests in Pilot Plant for Phosphorus and Rare Earth Metals. 2019. Available online: https://www.lkab.com/en/news-room/press-releases/lkab-invests-in-pilot-plants-for-phosphorus-and-rare-earth-metals/ (accessed on 19 April 2019).
- SGU. Metaller och Mineral i Gruvavfall. 2019. Available online: https://www.sgu.se/mineralnaring/metall--och-mineralatervinning/metaller-och-mineral-i-gruvavfall/ (accessed on 5 January 2019).
- Larshans, P.; (Ragn-Sells, Tallinn, Estonia). Personal communication, 2020.
- Marhual, N.P.; Pradhan, N.; Mohanta, N.C.; Sukla, L.B.; Mishra, B.K. Dephosphorization of LD slag by phosphorus solubilising bacteria. Int. Biodeterior. Biodegrad. 2011, 65, 404–409. [Google Scholar] [CrossRef]
- Virta, L.; (Konvex AB, Kävlinge, Sweden). Personal communication, 2019.
- Statistics Sweden. Discharges via Municipal Wastewater Treatment Plants Has Decreased. 2018. Available online: https://www.scb.se/en/finding-statistics/statistics-by-subject-area/environment/emissions/discharges-to-water-and-sewage-sludge-production--municipal-waste-water-treatment-plants-pulp-and-paper-industry-and-other-industry/pong/statistical-news/discharges- (accessed on 20 April 2019).
- Roberts, T. Right Product, Right Rate, Right Time, and Right Place…the Foundation of BMPs for Fertilizer. In Proceedings of the IFA International Workshop on Fertilizer Best Management Practices, Brussels, Belgium, 7–9 March 2007; pp. 14–15. Available online: http://www.ipni.net/publication/bettercrops.nsf/0/91607AF3210A609F852579800080C01C/$FILE/BetterCrops2007-4p14.pdf (accessed on 29 April 2019).
- Ekstrand, S. Ditch Dams and Filters to Trap Phosphorus in Agriculture. 2017. Available online: http://www.balticsea2020.org/english/alla-projekt/overgodning/eutrophication-completed-projects/58-ditch-damms-and-filters-to-trap-phosphorus-in-agriculture (accessed on 30 April 2019).
- Graca, B.; Burska, D.; Matuszewska, K. The Impact of Dredging Deep Pits on Organic Matter Decomposition in Sediments. Water Air Soil Pollut. 2004, 158, 237–259. [Google Scholar] [CrossRef]
- Gröndahl, F.; Brandt, N.; Karlsson, S.; Malmström, M. Sustainable use of Baltic Sea natural resources based on ecological engineering and biogas production. In WIT Transactions on Ecology and the Environment; WIT Press: Southhampton, UK, 2009; Volume 122. [Google Scholar] [CrossRef] [Green Version]
- Li, B.; Udugama, I.A.; Mansouri, S.S.; Yu, W.; Baroutian, S.; Gernaey, K.V.; Young, B.R. An exploration of barriers for commercializing phosphorus recovery technologies. J. Clean. Prod. 2019, 229, 1342–1354. [Google Scholar] [CrossRef]
- Mayer, B.K.; Baker, L.A.; Boyer, T.H.; Drechsel, P.; Gifford, M.; Hanjra, M.A.; Parameswaran, P.; Stoltzfus, J.; Westerhoff, P.; Rittmann, B.E. Total Value of Phosphorus Recovery. Environ. Sci. Technol. 2016, 50, 6606–6620. [Google Scholar] [CrossRef]
- Sveriges Officiella Statistik. Nitrogen and Phosphorus Balances for Agricultural Land in 2016. 2018. Available online: https://www.scb.se/contentassets/6707adf4535a475aa8d44526ec390ecd/mi1004_2016a01_sm_mi40sm1801.pdf (accessed on 24 March 2019).
- Hanserud, O.S.; Lyng, K.-A.; Vries, J.W.D.; Øgaard, A.F.; Brattebø, H. Redistributing Phosphorus in Animal Manure from a Livestock-Intensive Region to an Arable Region: Exploration of Environmental Consequences. Sustainability 2017, 9, 595. [Google Scholar] [CrossRef] [Green Version]
- ten Hoeve, M.; Hutchings, N.J.; Peters, G.M.; Svanström, M.; Jensen, L.S.; Bruun, S. Life cycle assessment of pig slurry treatment technologies for nutrient redistribution in Denmark. J. Environ. Manag. 2014, 132, 60–70. [Google Scholar] [CrossRef] [PubMed]
- Steffen, W.; Richardson, K.; Rockström, J.; Cornell, S.E.; Fetzer, I.; Bennett, E.M.; Biggs, R.; Carpenter, S.R.; de Vries, W.; de Wit, C.A.; et al. Planetary boundaries: Guiding human development on a changing planet. Science 2015, 347, 1259855. [Google Scholar] [CrossRef] [PubMed] [Green Version]
- Hamilton, H.A.; Brod, E.; Hanserud, O.S.; Gracey, E.O.; Vestrum, M.I.; Bøen, A.; Steinhoff, F.S.; Müller, D.B.; Brattebø, H. Investigating Cross-Sectoral Synergies through Integrated Aquaculture, Fisheries, and Agriculture Phosphorus Assessments: A Case Study of Norway. J. Ind. Ecol. 2016, 20, 867–881. [Google Scholar] [CrossRef]
| Publisher’s Note: MDPI stays neutral with regard to jurisdictional claims in published maps and institutional affiliations. |
© 2021 by the authors. Licensee MDPI, Basel, Switzerland. This article is an open access article distributed under the terms and conditions of the Creative Commons Attribution (CC BY) license (http://creativecommons.org/licenses/by/4.0/).


