
Urban Green Infrastructure as a Strategy to Address Urban Energy Efficiency and Sustainability. A Case Study of Milagrosa (Pamplona) †


Abstract
:1. Introduction
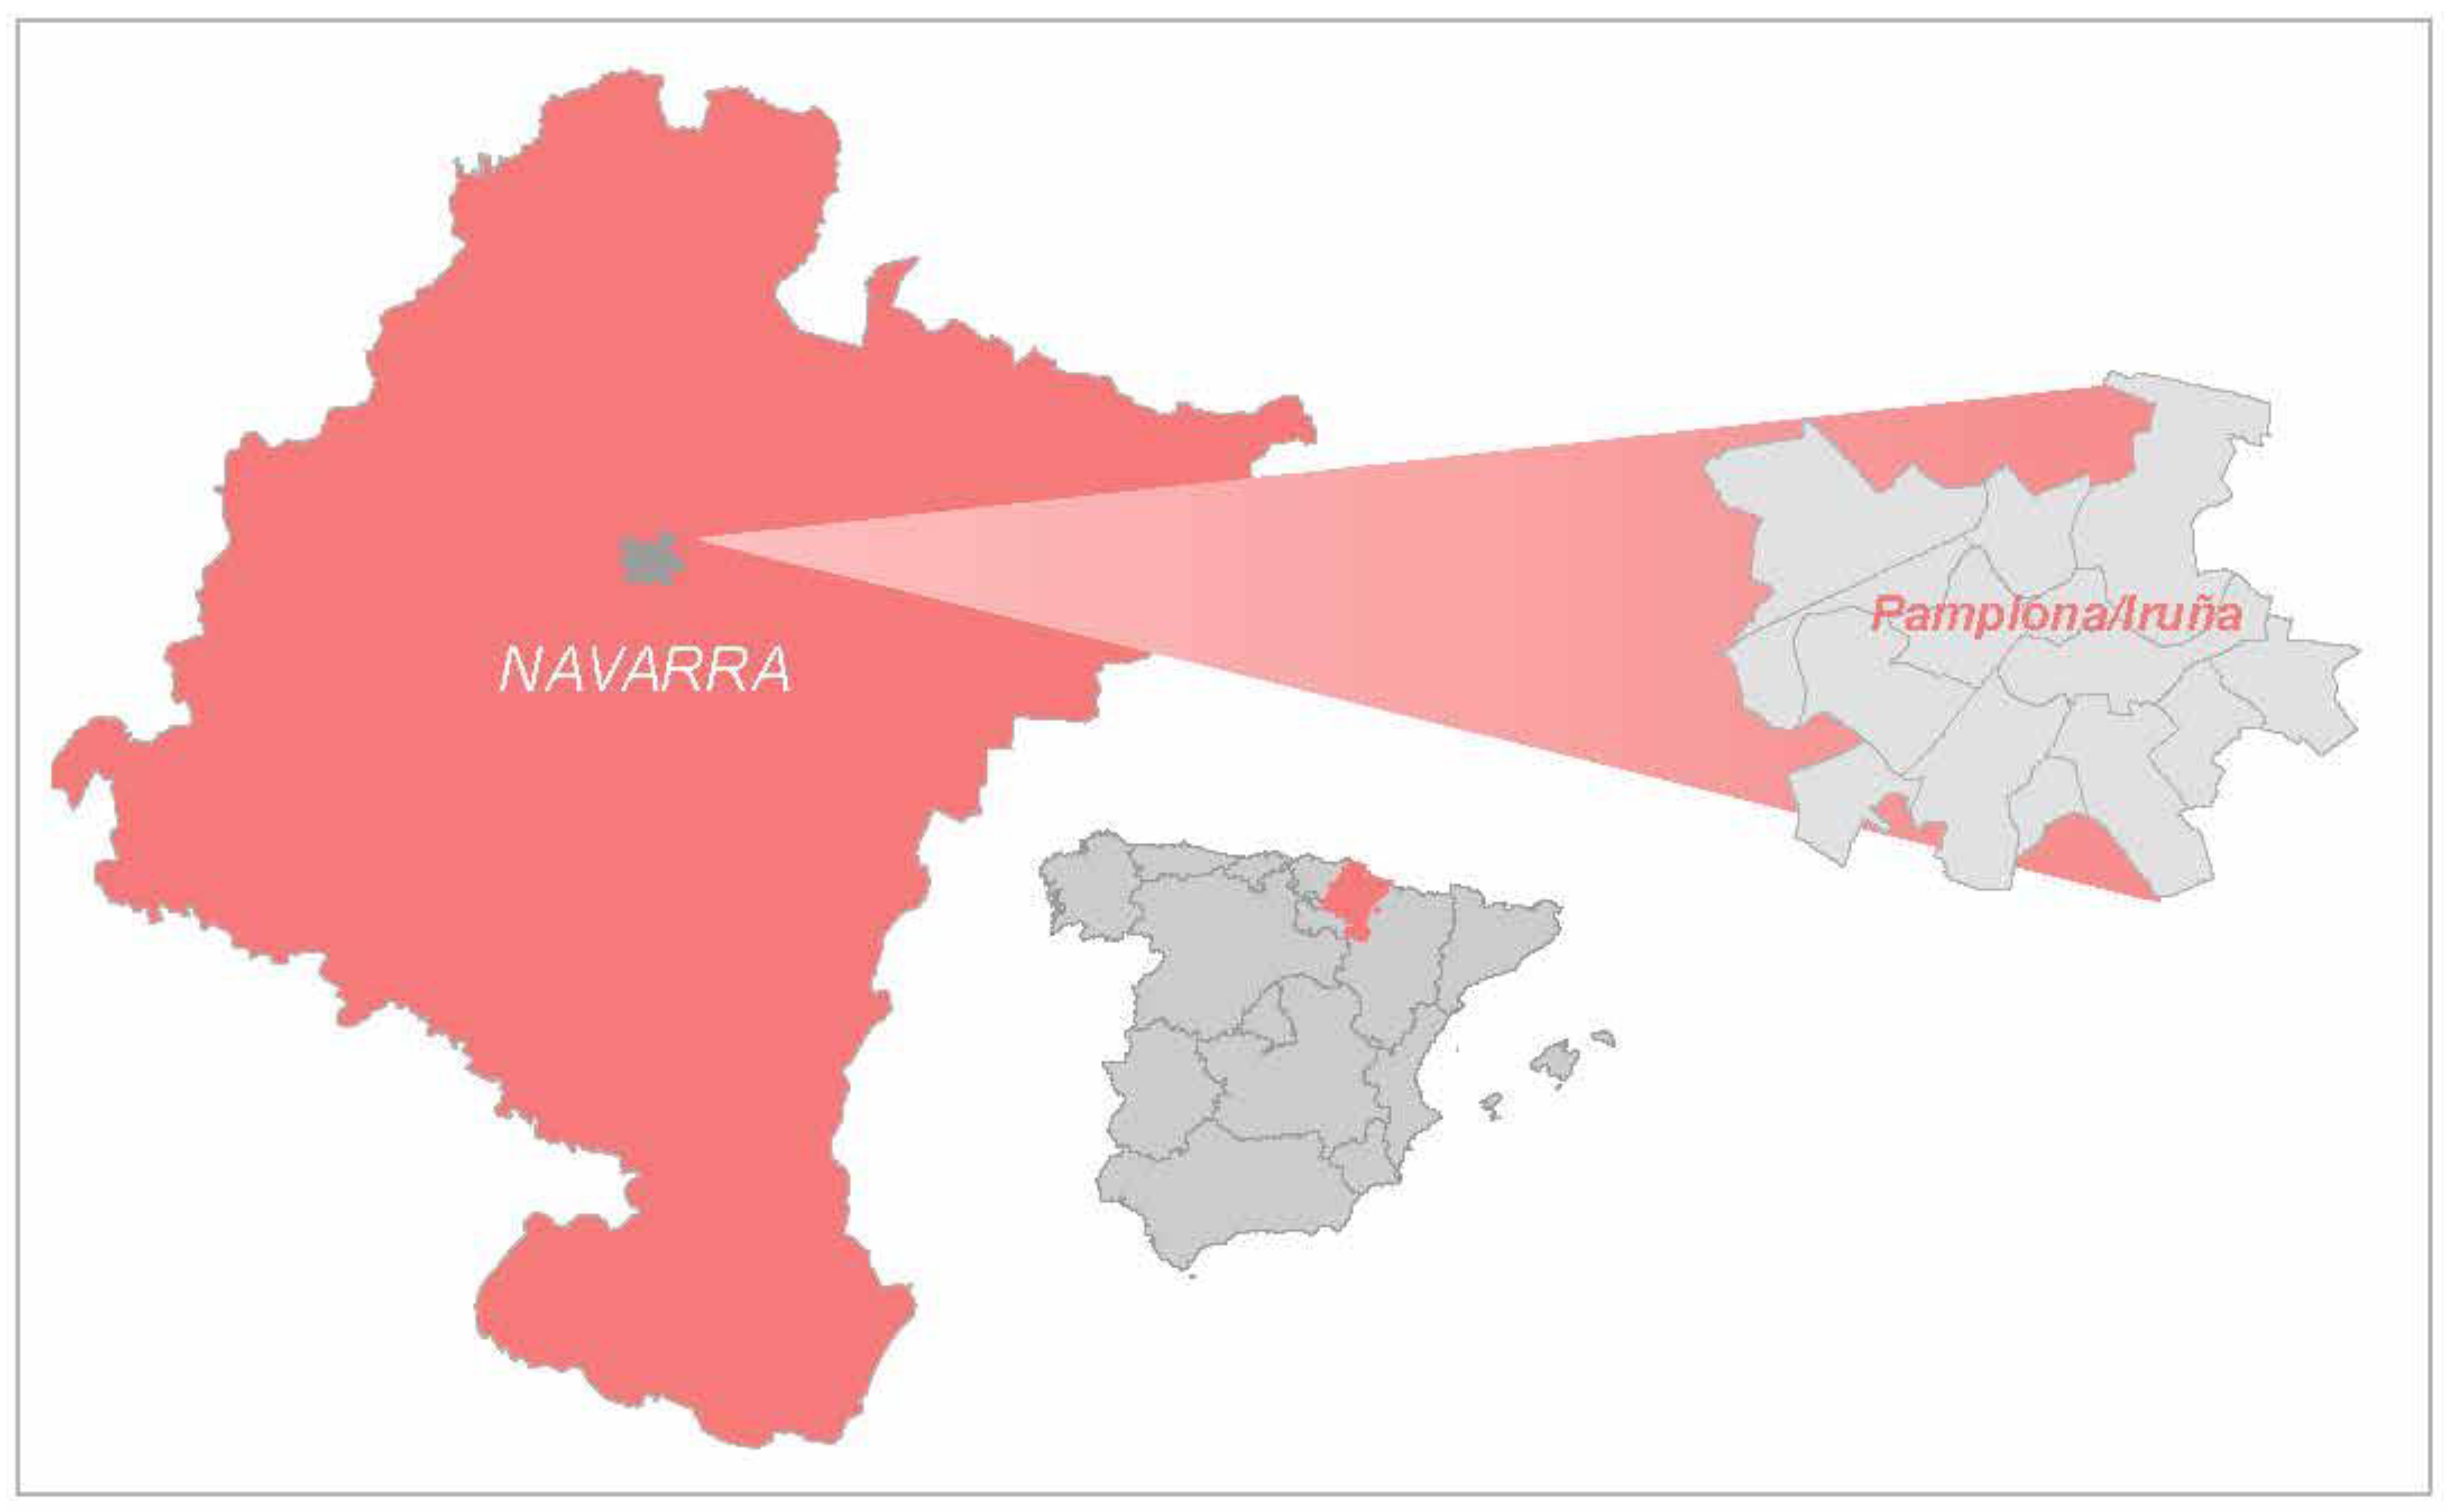
2. Area of Study
3. Methodology
4. Results
5. Discussion
6. Conclusions
Author Contributions
Funding
Institutional Review Board Statement
Informed Consent Statement
Data Availability Statement
Conflicts of Interest
References
- Xing, Y.; Jones, P.; Donnison, I. Characterization of nature-based solutions for the built environment. Sustainability 2017, 9, 149. [Google Scholar] [CrossRef] [Green Version]
- Verdaguer, C.Y.; Velázquez, I. Pasos hacia la regeneración urbana ecológica: Más allá de la eficiencia energética. Ciudad. Territ. Estud. Territ. 2012, 171, 97–112. [Google Scholar]
- Badiu, D.L.; Iojă, C.I.; Pătroescu, M.; Breuste, J.; Artmann, M.; Niță, M.R.; Grădinaru, S.R.; Onose, D.A. Is urban green space per capita a valuable target to achieve cities’ sustainability goals? Romania as a case study. Ecol. Indic. 2016, 70, 53–66. [Google Scholar] [CrossRef]
- Comisión Europea. Estrategia de la UE Sobre la Biodiversidad de aquí a 2030 Reintegrar la Naturaleza en Nuestras Vidas; COM (2020) 380 final; Office for Official Publications of the European Communities: Luxembourg, 2020. [Google Scholar]
- Haaland, C.; van den Bosch, C.K. Challenges and strategies for urban green-space planning in cities undergoing densification: A review. Urban For. Urban Green. 2015, 14, 760–771. [Google Scholar] [CrossRef]
- McPhearson, T.; Pickett, S.T.; Grimm, N.B.; Niemelä, J.; Alberti, M.; Elmqvist, T.; Qureshi, S. Advancing Urban Ecology toward a Science of Cities. BioScience 2016, 66, 198–212. [Google Scholar] [CrossRef] [Green Version]
- Lähde, E.; Di Marino, M. Multidisciplinary collaboration and understanding of green infrastructure Results from the cities of Tampere, Vantaa, and Jyväskylä (Finland). Urban For. Urban Green. 2019, 40, 63–72. [Google Scholar] [CrossRef]
- Dorst, H.; van der Jagt, A.; Raven, R.; Runhaar, H. Urban greening through nature-based solutions–Key characteristics of an emerging concept. Sustain. Cities Soc. 2019, 49, 101620. [Google Scholar] [CrossRef]
- Comisión Europea. Comunicación Sobre “Infraestructura Verde: Mejora del Capital Natural de Europa”; COM (2013) 249 final, Bruselas, 6.5.2013; Office for Official Publications of the European Communities: Luxembourg, 2013. [Google Scholar]
- Ayuntamiento de Vitoria-Gasteiz (Centro de Estudios Ambientales). La Infraestructura Verde Urbana de Vitoria-Gasteiz; Documento de Propuesta; Ayuntamiento de Vitoria-Gasteiz: Vitoria-Gasteiz, Spain, 2014. [Google Scholar]
- Lennon, M. Explaining the currency of novel policy concepts: Learning from green infrastructure planning. Environ. Plan. C Gov. Policy 2015, 33, 1039–1057. [Google Scholar] [CrossRef] [Green Version]
- Wang, J.Y.; Banzhaf, E. Towards a better understanding of Green Infrastructure: A critical review. Ecol. Indic. 2018, 85, 758–772. [Google Scholar] [CrossRef]
- Kabisch, N.; Strohbach, M.; Haase, D.; Kronenberg, J. Urban green space availability in European cities. Ecol. Indic. 2016, 70, 586–596. [Google Scholar] [CrossRef]
- White, M.R.; Langenheim, N. A spatio-temporal decision support system for designing with street trees. Int. J. E-Plan. Res. 2018, 7, 1–24. [Google Scholar] [CrossRef]
- Locke, D.H.; Grove, J.M.; Galvin, M.; O’Neil-Dunne, J.P.; Murphy, C. Applications of Urban Tree Canopy Assessment and Prioritization Tools: Supporting Collaborative Decision Making to Achieve Urban Sustainability Goals. Cities Environ. 2013, 6, 7. Available online: http://digitalcommons.lmu.edu/cate/vol6/iss1/7 (accessed on 14 March 2020).
- Hernández, A.; Alguacil Gómez, J.; Medina del Río, M.; Moreno Caballero, C. Parámetros Dotacionales en Suelo Urbano; Ministerio de Obras Públicas, Transportes y Medio Ambiente: Madrid, Spain, 1996. [Google Scholar]
- Rossi, A. La arquitectura de la Ciudad; Gustavo Gili: Barcelona, Spain, 1982. [Google Scholar]
- ASEJA Asociación Española de Parques y Jardines Públicos. Análisis de la Conservación de la Infraestructura Verde en España 2015; ASEJA Asociación de Empresas de Gestión de Infraestructura Verde: Madrid, Spain, 2017. [Google Scholar]
- World Health Organization (WHO). Health Indicators of Sustainable Cities in the Context of the Rio+20 UN Conference on Sustainable Development; WHO: Geneva, Switzerland, 2012. [Google Scholar]
- Russo, A.; Cirella, G.T. Modern compact cities: How much greenery do we need? Int. J. Environ. Res. Public Health 2018, 15, 2180. [Google Scholar] [CrossRef] [PubMed] [Green Version]
- Szulczewska, B.; Giedych, R.; Borowski, J.; Kuchcik, M.; Sikorski, P.; Mazurkiewicz, A.; Stańczyk, T. How much green is needed for a vital neighborhood? In search for empirical evidence. Land Use Policy 2014, 38, 330–345. [Google Scholar] [CrossRef]
- Jim, C.Y. Green-space preservation and allocation for sustainable greening of compact cities. Cities 2004, 21, 311–320. [Google Scholar] [CrossRef]
- Zhang, Y.; Van den Berg, A.E.; Van Dijk, T.; Weitkamp, G. Quality over quantity: Contribution of urban green space to neighborhood satisfaction. Int. J. Environ. Res. Public Health 2017, 14, 535. [Google Scholar] [CrossRef]
- Fernández de Manuel, B.; Méndez-Fernández, L.; Peña, L.; Ametzaga-Arregi, I. A new indicator of the effectiveness of urban green infrastructure based on ecosystem services assessment. Basic Appl. Ecol. 2021, 53, 12–25. [Google Scholar] [CrossRef]
- Pristeri, G.; Peroni, F.; Pappalardo, S.E.; Codato, D.; Masi, A.; De Marchi, M. Whose UrbanGreen? Mapping and Classifying Public and Private Green Spaces in Padua for Spatial Planning Policies. ISPRS Int. J. Geo-Inf. 2021, 10, 538. [Google Scholar] [CrossRef]
- Virtudes, A.L.; Manso, M. Green Walls applications in Urban Rehabilitation. In Recent Advances in Engineering Mechanics, Structures and Urban Planning; En Scutelnicu, E., Rotondo, F., Varum, H., Eds.; WSEAS Press: Cambridge, UK, 2013; pp. 139–144. [Google Scholar]
- Hansen, R.; Olafsson, A.S.; van der Jagt, A.P.N.; Rall, E.; Pauleit, S. Planning multifunctional green infrastructure for compact cities: What is the state of practice? Ecol. Indic. 2019, 96, 99–110. [Google Scholar] [CrossRef]
- Artmann, M.; Kohler, M.; Meinel, G.; Gan, J.; Ioja, I.C. How smart growth and green infrastructure can mutually support each other-A conceptual framework for compact and green cities. Ecol. Indic. 2017, 96, 10–22. [Google Scholar] [CrossRef]
- Duarte Pinto, V.; Martins, C.; Rodrigues, J.; Pires Rosa, M. Improving access to greenspaces in the Mediterranean city of Faro. AIMS Environ. Sci. 2020, 7, 226–246. [Google Scholar] [CrossRef]
- Maes, J.; Zulian, G.; Guenther, S.; Thijssen, M.; Raynal, J. Enhancing Resilience of Urban Ecosystems through Green Infrastructure; (EnRoute), EUR 29630 EN; Publications Office of the European Union: Luxembourg, 2019. [Google Scholar]
- Anguluri, R.; Narayanan, P. Role of green space in urban planning: Outlook towards smart cities. Urban For. Urban Green. 2017, 25, 58–65. [Google Scholar] [CrossRef]
- Ramyar, R.; Ackerman, A.; Johnston, D.M. Adapting cities for climate change through urban green infrastructure planning. Cities 2021, 117, 103316. [Google Scholar] [CrossRef]
- Herman, K.; Sbarcea, M.; Panagopoulos, T. Creating Green Space Sustainability through Low-Budget and Upcycling Strategies. Sustainability 2018, 10, 1857. [Google Scholar] [CrossRef] [Green Version]
- Peschardt, K.K.; Schipperijn, J.; Stigsdotter, U.K. Use of Small Public Urban Green Spaces (SPUG). Urban For. Urban Green. 2012, 11, 235–244. [Google Scholar] [CrossRef]
- Ponrahono, Z.; Zakariya, K. Quality of designs and features of Small Urban Green Spaces in Petaling Jaya Town, Malaysia. Plan. Malays. 2021, 19, 138–149. [Google Scholar] [CrossRef]
- Wu, C.; Li, J.; Wang, C.; Song, C.; Haase, D.; Breuste, J.; Finka, M. Estimating the Cooling Effect of Pocket Green Space in High Density Urban Areas in Shanghai, China. Front. Environ. Sci. 2021, 9, 657969. [Google Scholar] [CrossRef]


| Objectives | Action Lines | Timescale |
|---|---|---|
| Better equity between the distribution, access and quality of urban greenspaces [29] | Identify and map areas with specific deficiencies in terms of elements and green spaces. | Short Term |
| Diagnose and evaluate deficiencies in terms of ecosystem services and in relation to the supply and demand of such services in the area. [24,27] | Medium Term | |
| Integrate UGI into Urban Planning processes [30]. | Inclusion of the UGI in the Urban Planning in order to harmonize the city model with the objectives of the UGI and give it the necessary legal support. | Long Term |
| Promote the development of special protection and conservation plans provided by the Land Law, as tools to perform diagnoses and policy proposals in critical areas. | Lomg Term | |
| Promote cooperation across authorities and departments in order to identify common objectives and synergies (cross-scale and cross-departmental co-operation). Integrated spatial analyses, in particular, require expertise from different fields. [27,28] | Long Term | |
| Improvement and increase of the elements of UGI network and increase the efficiency of green spaces through combining different functions: (multifunctionality as the main planning principle [28,29]. | Prepare a geolocated inventory of spaces and locations that could increase the area (public or private) dedicated to the UGI: parking spaces, public spaces and waterproof leisure spaces, inner courtyards of buildings and educational centres, party walls, vacant lots [31]. Figure 7 shows a map with that kind of opportunity spaces located in La Milagrosa neighbourhood through exhaustive fieldwork. The introduction of green spaces and elements in these locations could significantly improve the ecological, environmental and social conditions of this space. | Short Term |
| Develop an inventory of resources and NbS for implementation in small spaces: biodiversity micro spaces, vertical gardens, vegetal facades, green roofs, schoolyards and all kinds of elements and green spaces that can provide ecological, economic and social functions. Figure 8 shows two proposals for the renaturalization of two small spaces of La Milagrosa through the use of Nature-based Solutions. | Medium Term | |
| Protect and incentive private vegetation development [25] | Medium Term | |
| Incorporate citizen participation in order to identify improvement possibilities of green spaces [27,28,32] and to design them [33]. | Medium Term | |
| Increase accessibility to public uses with pocket parks or small public urban green spaces [25,29,34,35,36] | Medium Term | |
| Plant urban trees in the most compact spaces that show little chance of implementing new green spaces [24]. | Medium Term | |
| Use green roofs as a form of compensating the loss of greenspaces, ecosystem services and biodiversity in urban areas [29] | Medium Term | |
| Promote the renovation and rehabilitation of buildings through facades and green roofs. Green roofs can improve shading, insulation, evapotranspiration and thermal mass so, they allow buildings to be more sustainable in terms of energy efficiency [29]. | Long Term | |
| Promote the participation of educational centres in the elaboration of proposals for the increase and improvement of green spaces and network. | Short Term | |
| Incorporate the Academy (technical schools and faculties), through researchers and their research projects and through the practices of undergraduate and postgraduate students in order to get them involved in the search and research of technical and natural solutions for the design and implementation of green infrastructure in complex urban areas. | Medium Term | |
| Improving energy efficiency | Implement Pocket Green Spaces (green space with a size less than 2 ha) in all possible spaces [35]. | Long Term |
| Changing surface materials and using low heat capacity materials [32]. | Long Term | |
| Design the green network in order to provide more shade, especially on hard surfaces, and using evapotranspiration to cool the environment [32]. | Medium Term | |
| Improving ecological connectivity. Physical and functional connectivity between green spaces is particularly important as this will increase the functionality of single green spaces [27]. | Prepare an inventory and map of the points and areas where achieving the necessary connectivity can be a complex problem, difficult to solve. | Short Term |
| Develop a database of good practices and resources to address ecological connectivity in compact urban areas | Medium Term | |
| Incorporate connectivity objectives into sustainable mobility plans (harmonize programs and actions in order to optimize resources and results). | Long Term |
Publisher’s Note: MDPI stays neutral with regard to jurisdictional claims in published maps and institutional affiliations. |
© 2021 by the authors. Licensee MDPI, Basel, Switzerland. This article is an open access article distributed under the terms and conditions of the Creative Commons Attribution (CC BY) license (https://creativecommons.org/licenses/by/4.0/).
Share and Cite
Latasa, I.; Laurenz, A.; Sádaba, J. Urban Green Infrastructure as a Strategy to Address Urban Energy Efficiency and Sustainability. A Case Study of Milagrosa (Pamplona). Sustainability 2022, 14, 28. https://doi.org/10.3390/su14010028
Latasa I, Laurenz A, Sádaba J. Urban Green Infrastructure as a Strategy to Address Urban Energy Efficiency and Sustainability. A Case Study of Milagrosa (Pamplona). Sustainability. 2022; 14(1):28. https://doi.org/10.3390/su14010028
Chicago/Turabian StyleLatasa, Itxaro, Angela Laurenz, and Juan Sádaba. 2022. "Urban Green Infrastructure as a Strategy to Address Urban Energy Efficiency and Sustainability. A Case Study of Milagrosa (Pamplona)" Sustainability 14, no. 1: 28. https://doi.org/10.3390/su14010028