3.2.1. Iron-Based Rods
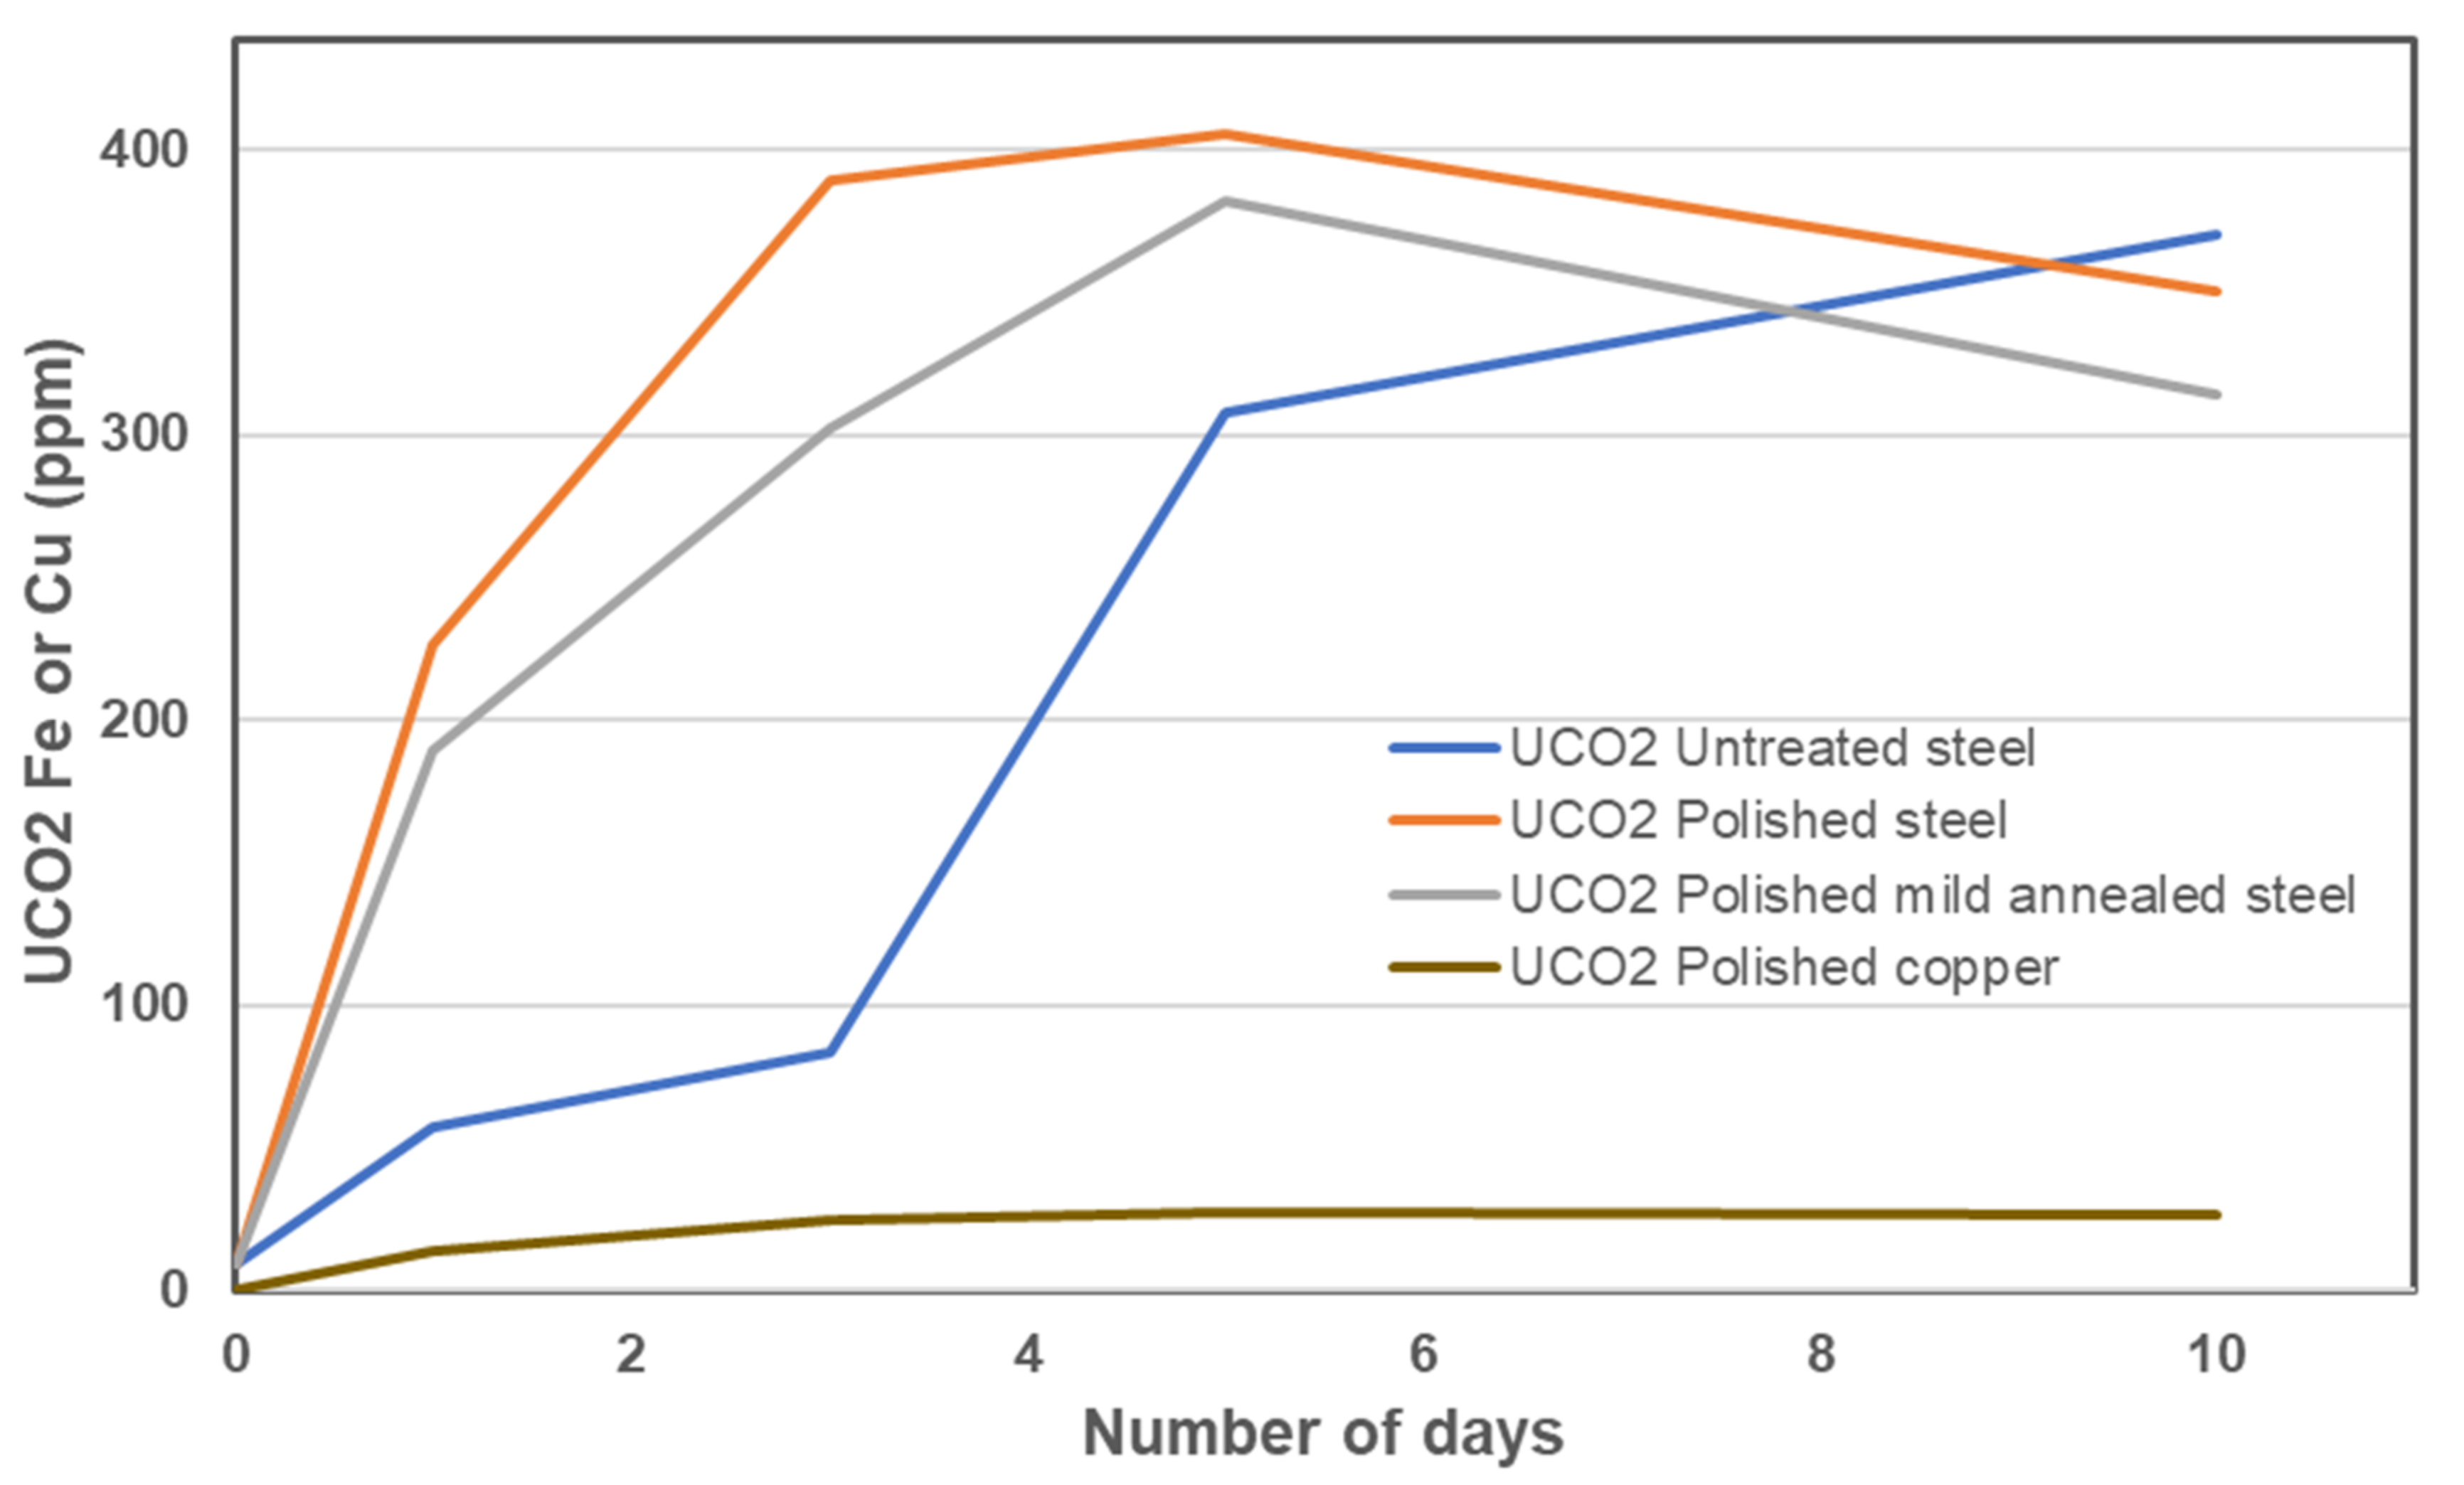
Iron concentration dissolved from the unpolished reference steel rod surfaces into UCO2 increased during the test from 58 ppm (1 d), 84 ppm (3 d), 308 ppm (5 d) to 370 ppm (10 d) (see
Figure 2). The values are averages of three parallel samples. For polished steel rod, the iron concentration dissolved into UCO2 first increased up to 5 d (406 ppm) but then decreased to 351 ppm at 10 days. A similar increasing trend during the five first days followed by a lower concentration at 10 days was measured for mild annealed polished steel rods in UCO2. In general, lower ion concentrations were measured for the mild annealed steel rods than for the polished steel rods.
For the polished samples, the dissolved iron concentration increased up to five days, after which the amount of dissolved iron started slowly decreasing. The decrease suggested formation of iron-containing precipitates. This was, however, not verified. Unlike the polished samples, iron continued dissolving from the untreated steel rod, probably because the dissolved iron concentration did not reach saturation during the experiment. No precipitates could be verified on the rod surfaces nor in oils.
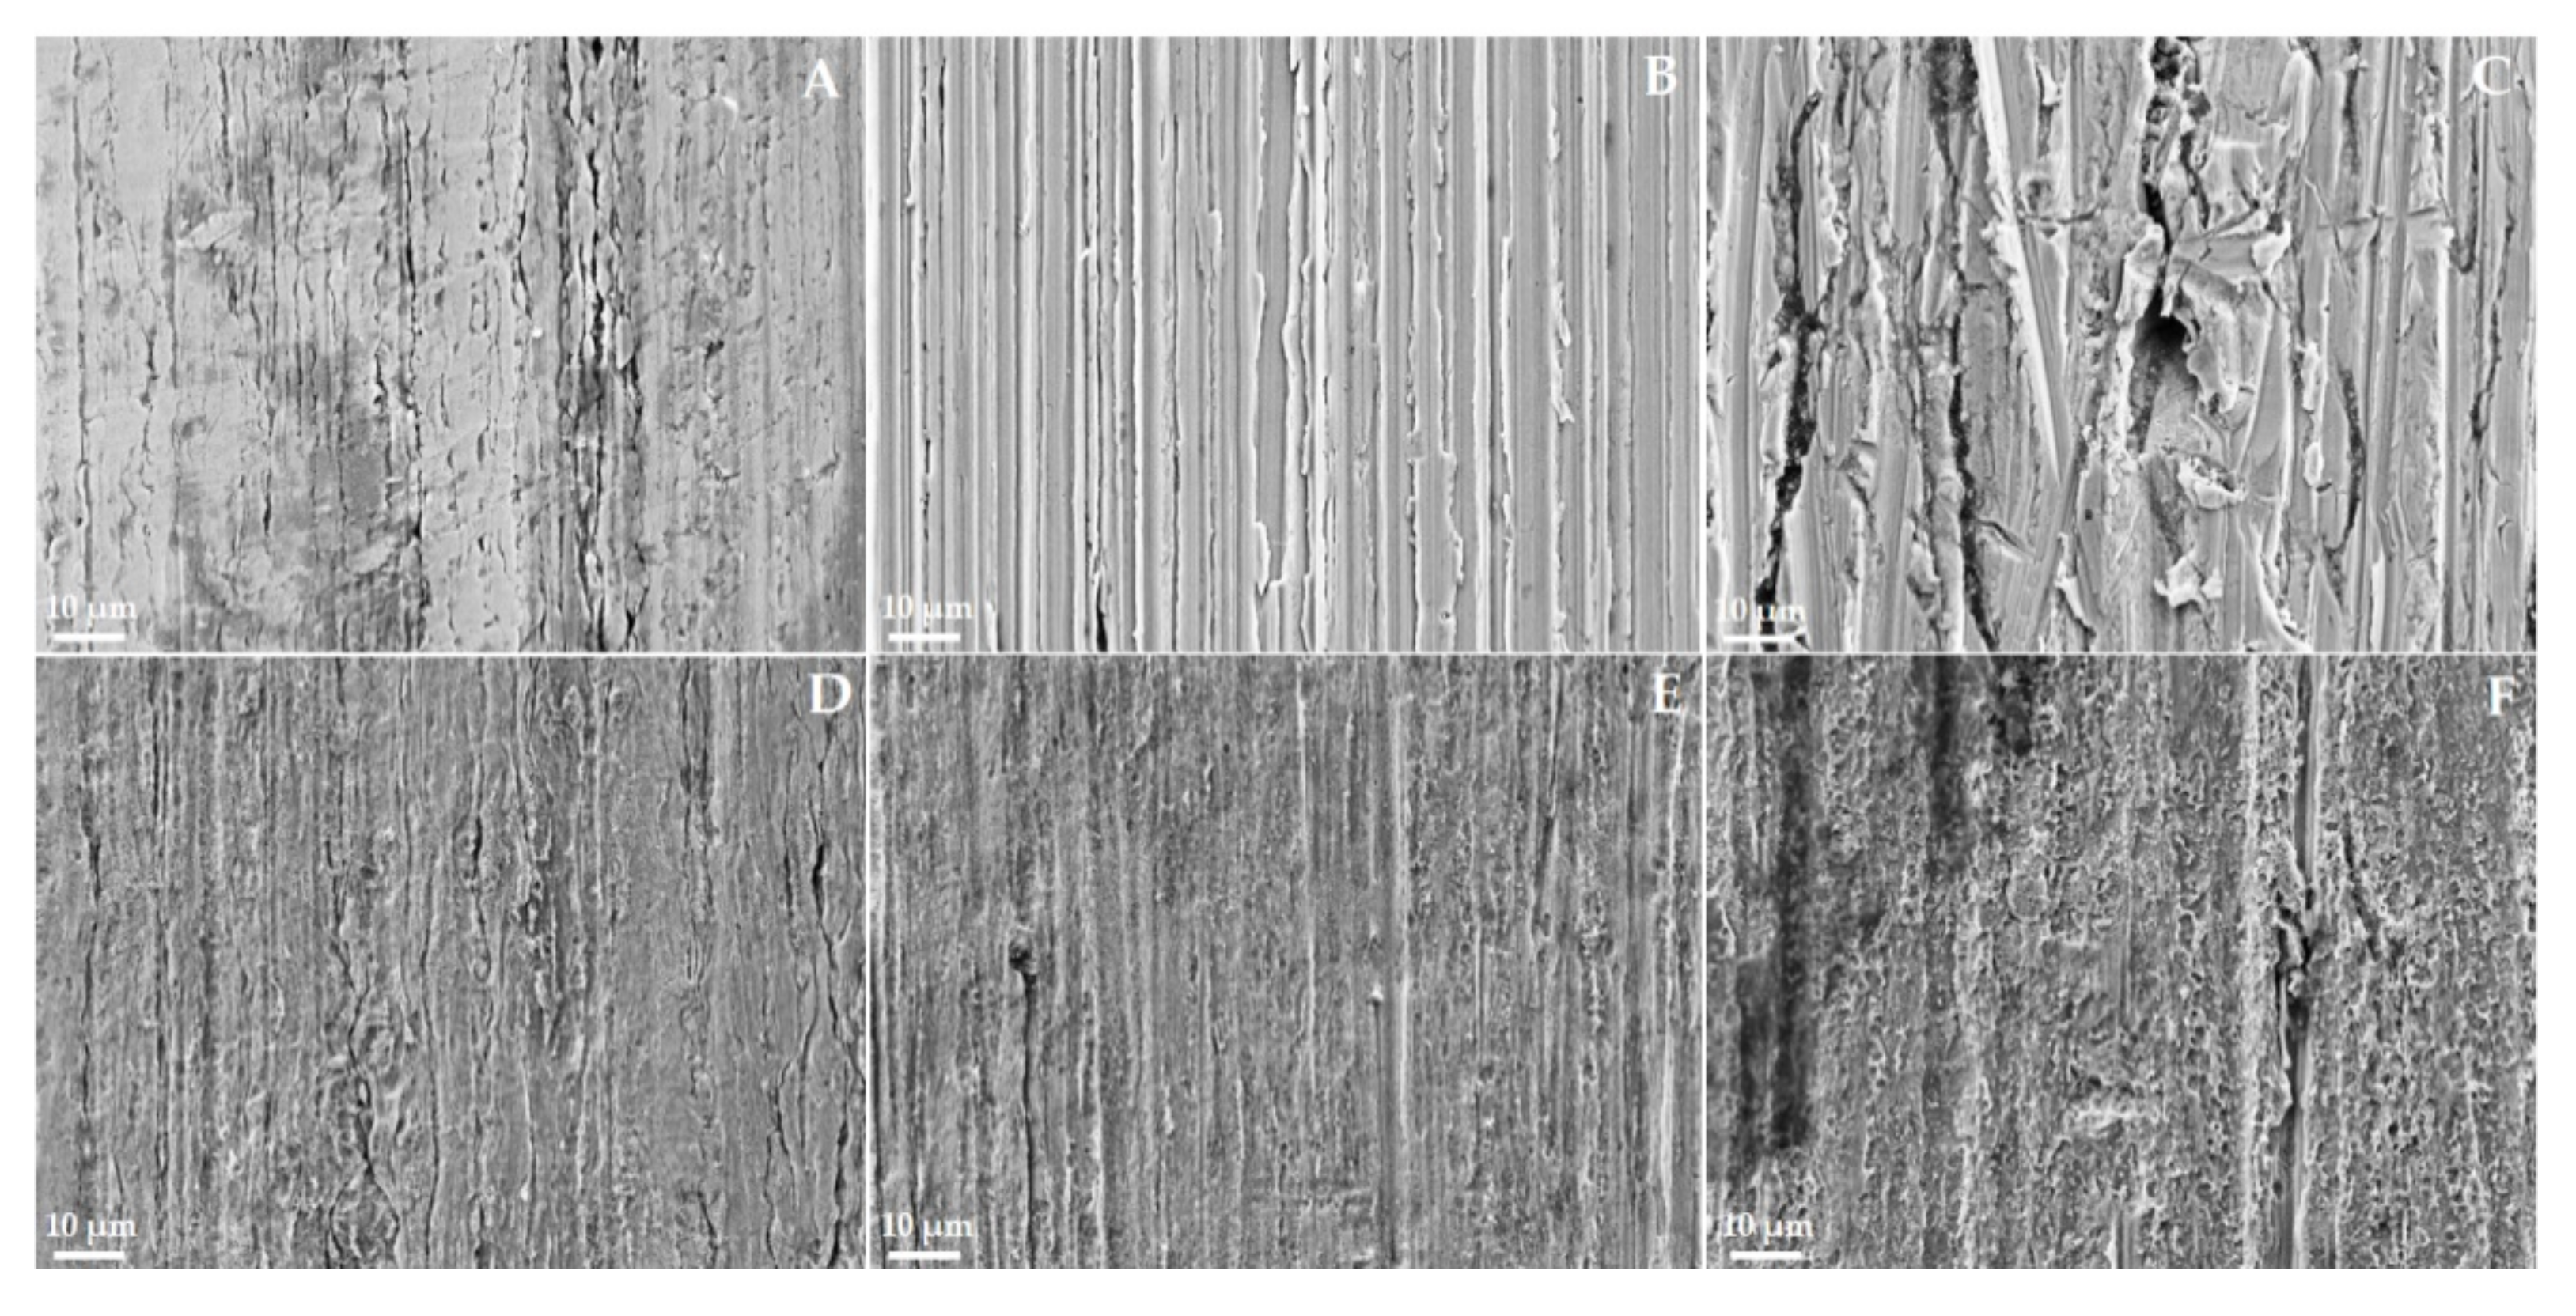
The SEM secondary electron images in
Figure 3 show the surface morphology of an untreated steel rod, a polished steel rod, and a polished annealed steel rod. The unpolished steel, polished steel, and polished mild anneal steel rod surfaces are shown in
Figure 3A–C. The surface morphology of the steel rods is rather even before corrosion. However, polishing gives steep scratches on the surfaces. After immersion for 10 days, the surface morphologies are smoother (
Figure 3D–F). As seen in the SEM images, the oil exposure clearly affected the surface morphology of rods, thus suggesting corrosion. This is in agreement with the measured ion concentration in the oil after the exposure.
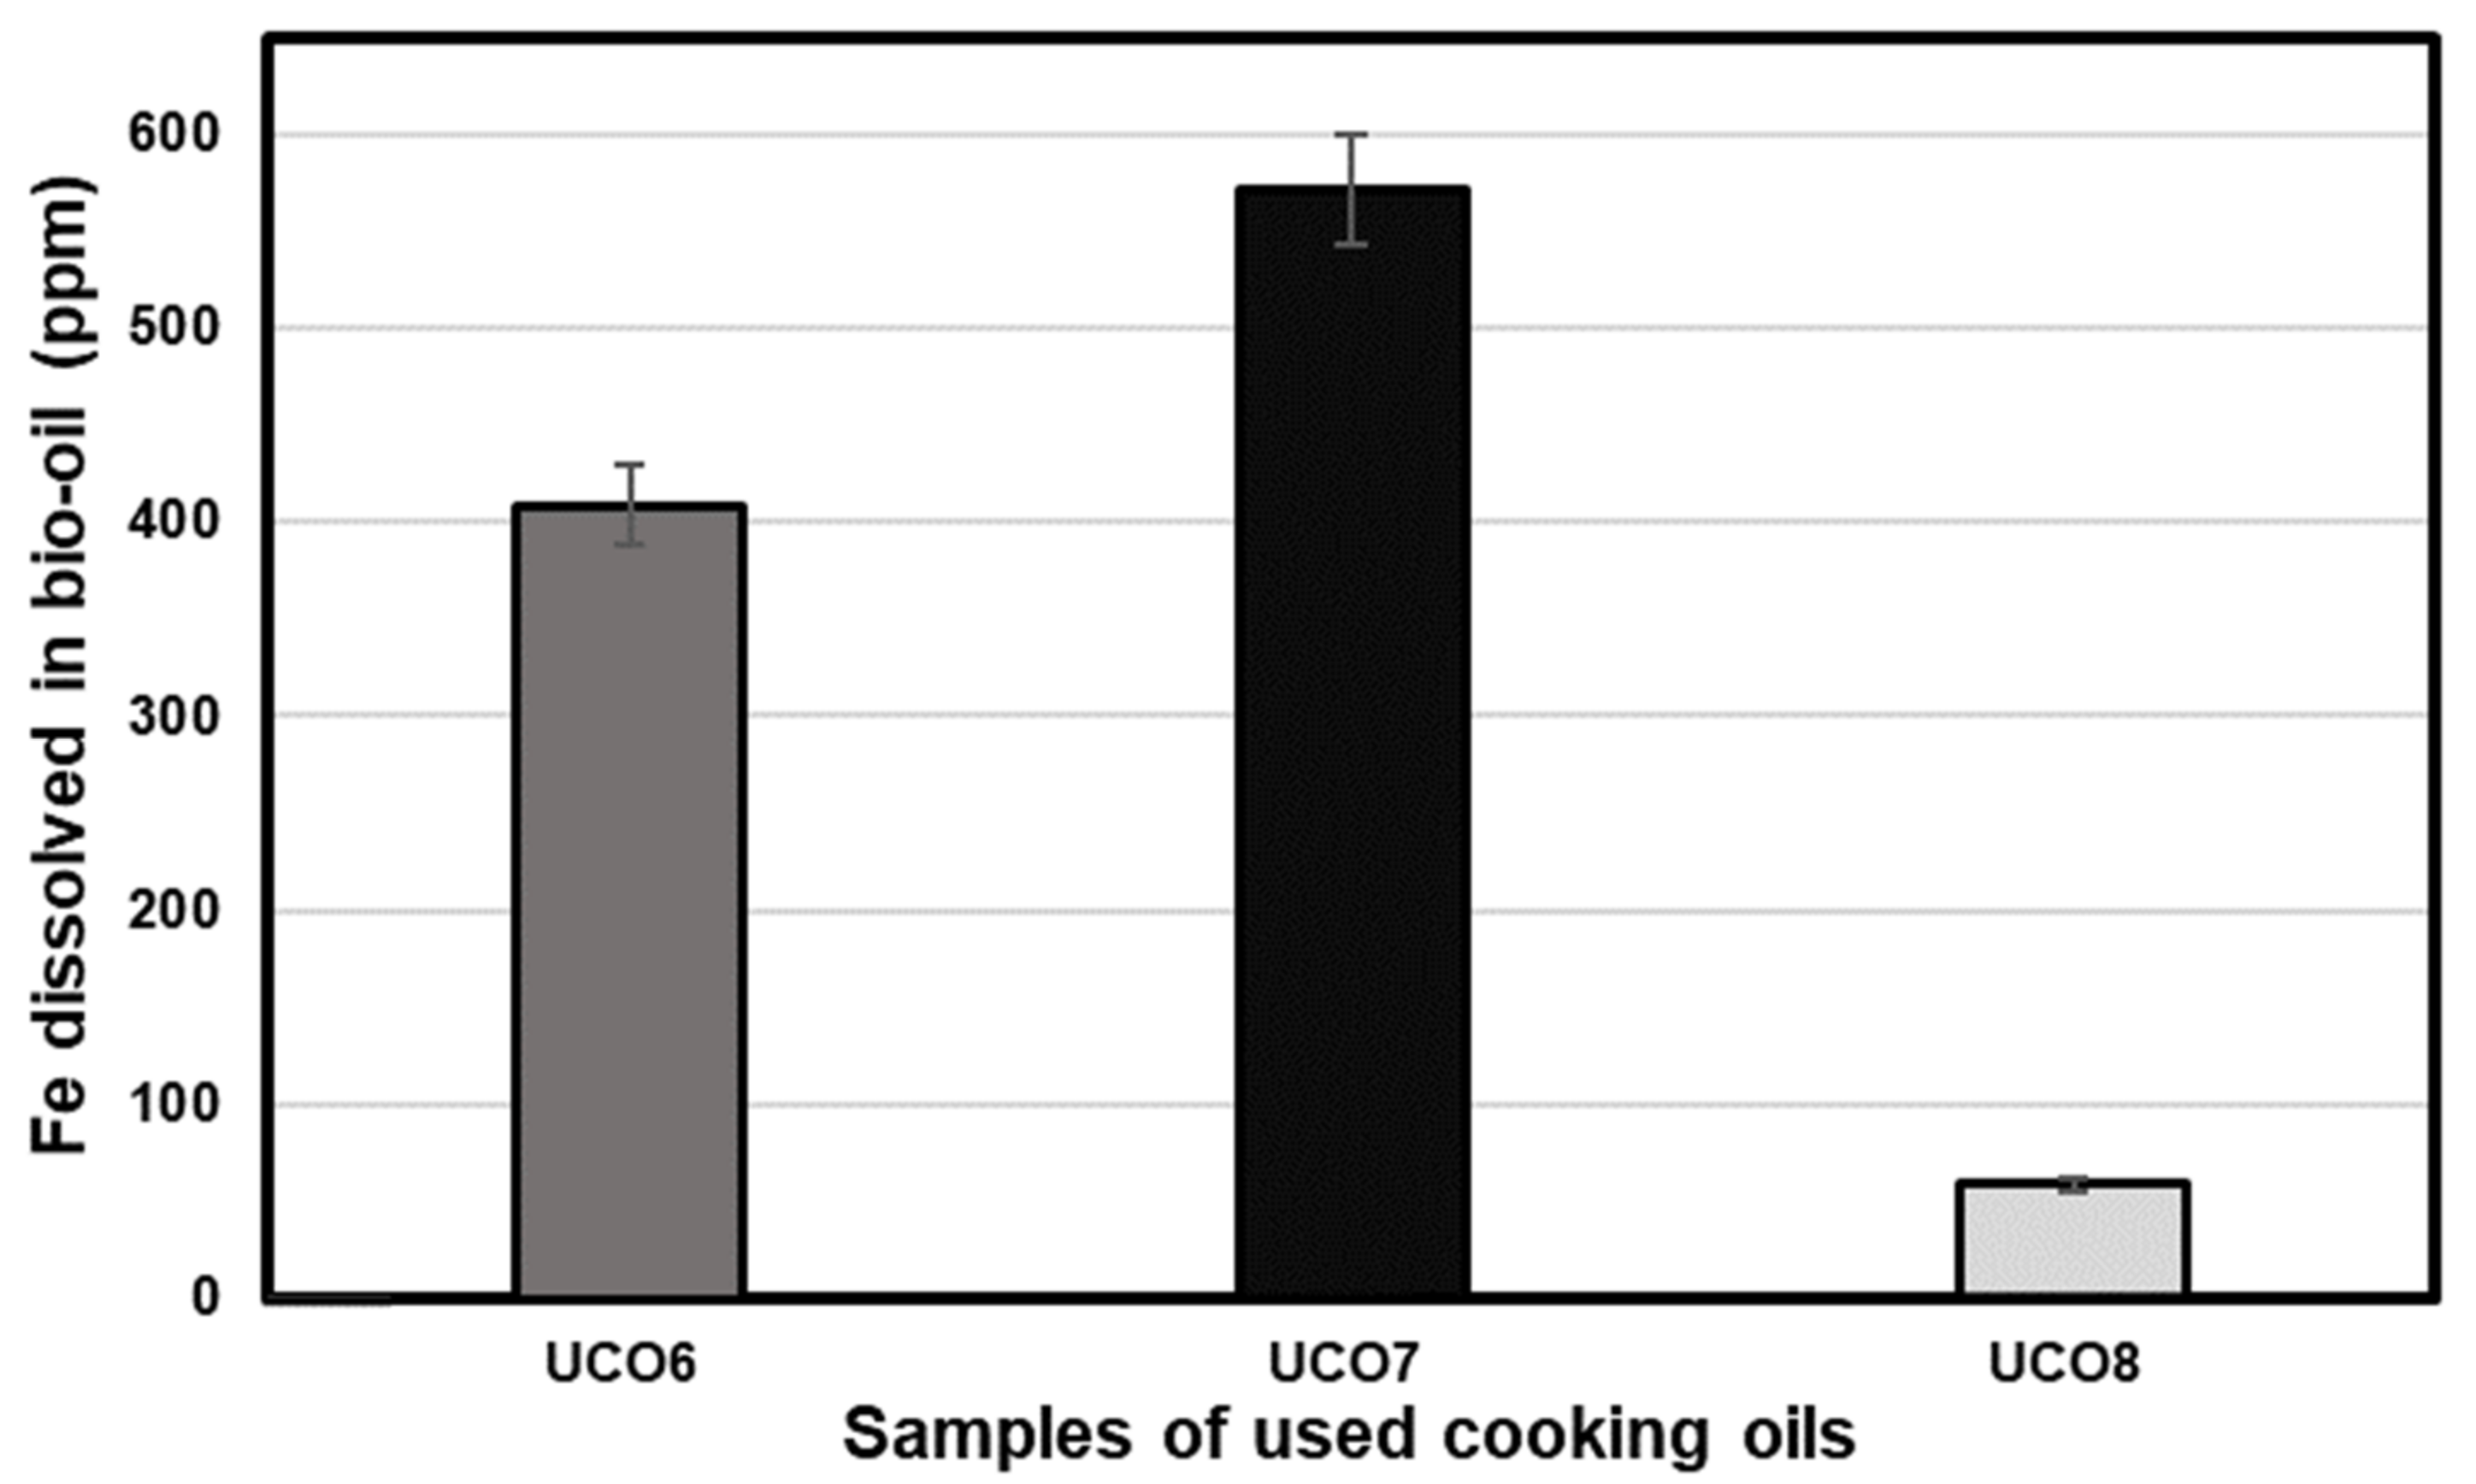
Table 4 shows the relative concentrations of iron dissolved from polished steel rods into the different oil batches at different time points. If the measured concentration was less than 50 ppm, the dissolution was considered low (L). Again, concentrations higher than 200 ppm indicated high dissolution (H), while the concentration in between was considered as medium dissolution (M). The average iron concentration in the oils before the exposures was around 8 ppm. UCO1 and UCO4 dissolved a very low iron concentration (8–14 ppm); the reason for this could be that their water concentration is the lowest, and FFAs concentration is among the highest. UCO3, UCO5, and UCO8 dissolved a medium iron concentration (50–199 ppm). The water concentrations were between 2200–2700 ppm, and the ANs were highest compared to the other oils.
UCO2, UCO6, and UCO7 dissolved a high iron concentration (200–600 ppm). For UCO6 and UCO7, the water content was the highest, between 3100–3750 ppm, and for UCO2, the water content was 1800 ppm, which was also close to the maximum approved level of 2000 ppm of water in oil [
10]. The ANs were 6.5–6.9 mg KOH/g oil, which was lower compared to UCO5 and UCO8 samples’ ANs (8–8.8 mg KOH/g oil).
The immersion test for three days with a polished steel rod showed higher corrosivity of UCO2, UCO6, and UCO7 (200–600 ppm) but the medium level of corrosivity (50–199 ppm) with UCO3, UCO5, and UCO8 (see
Figure 4). In contrast, UCO1 and UCO4 showed the lowest corrosivity (8–49 ppm).
Results of the immersion test for all UCO samples for the three days are presented in
Table 3 together with the corresponding values for AN and water contents. As the immersion test results presented in
Table 3 show that the corrosion properties of these oils (UCO8, UCO5, and UCO4) were lowest compared to the other oils, it could be possible that unsaturated FFAs, e.g., oleic acid, acts as a surfactant on the steel surface and decreases the corrosive properties of UCO oils, as was noticed in a previous study [
13]. Fatty acids, such as oleic acid, linoleic acid, and linolenic acid derivatives, are environmentally-friendly corrosion inhibitors protecting mild steel, etc. [
32]. Oleic acid was used as a surfactant and bonded covalently to the surfaces of magnetite nanoparticles [
33]. A seed oil,
Opuntia dillenii, which consists of fatty acids, was shown to form a barrier layer on the surface of iron by preventing contact of the metal surface and the corrosive solution [
12].
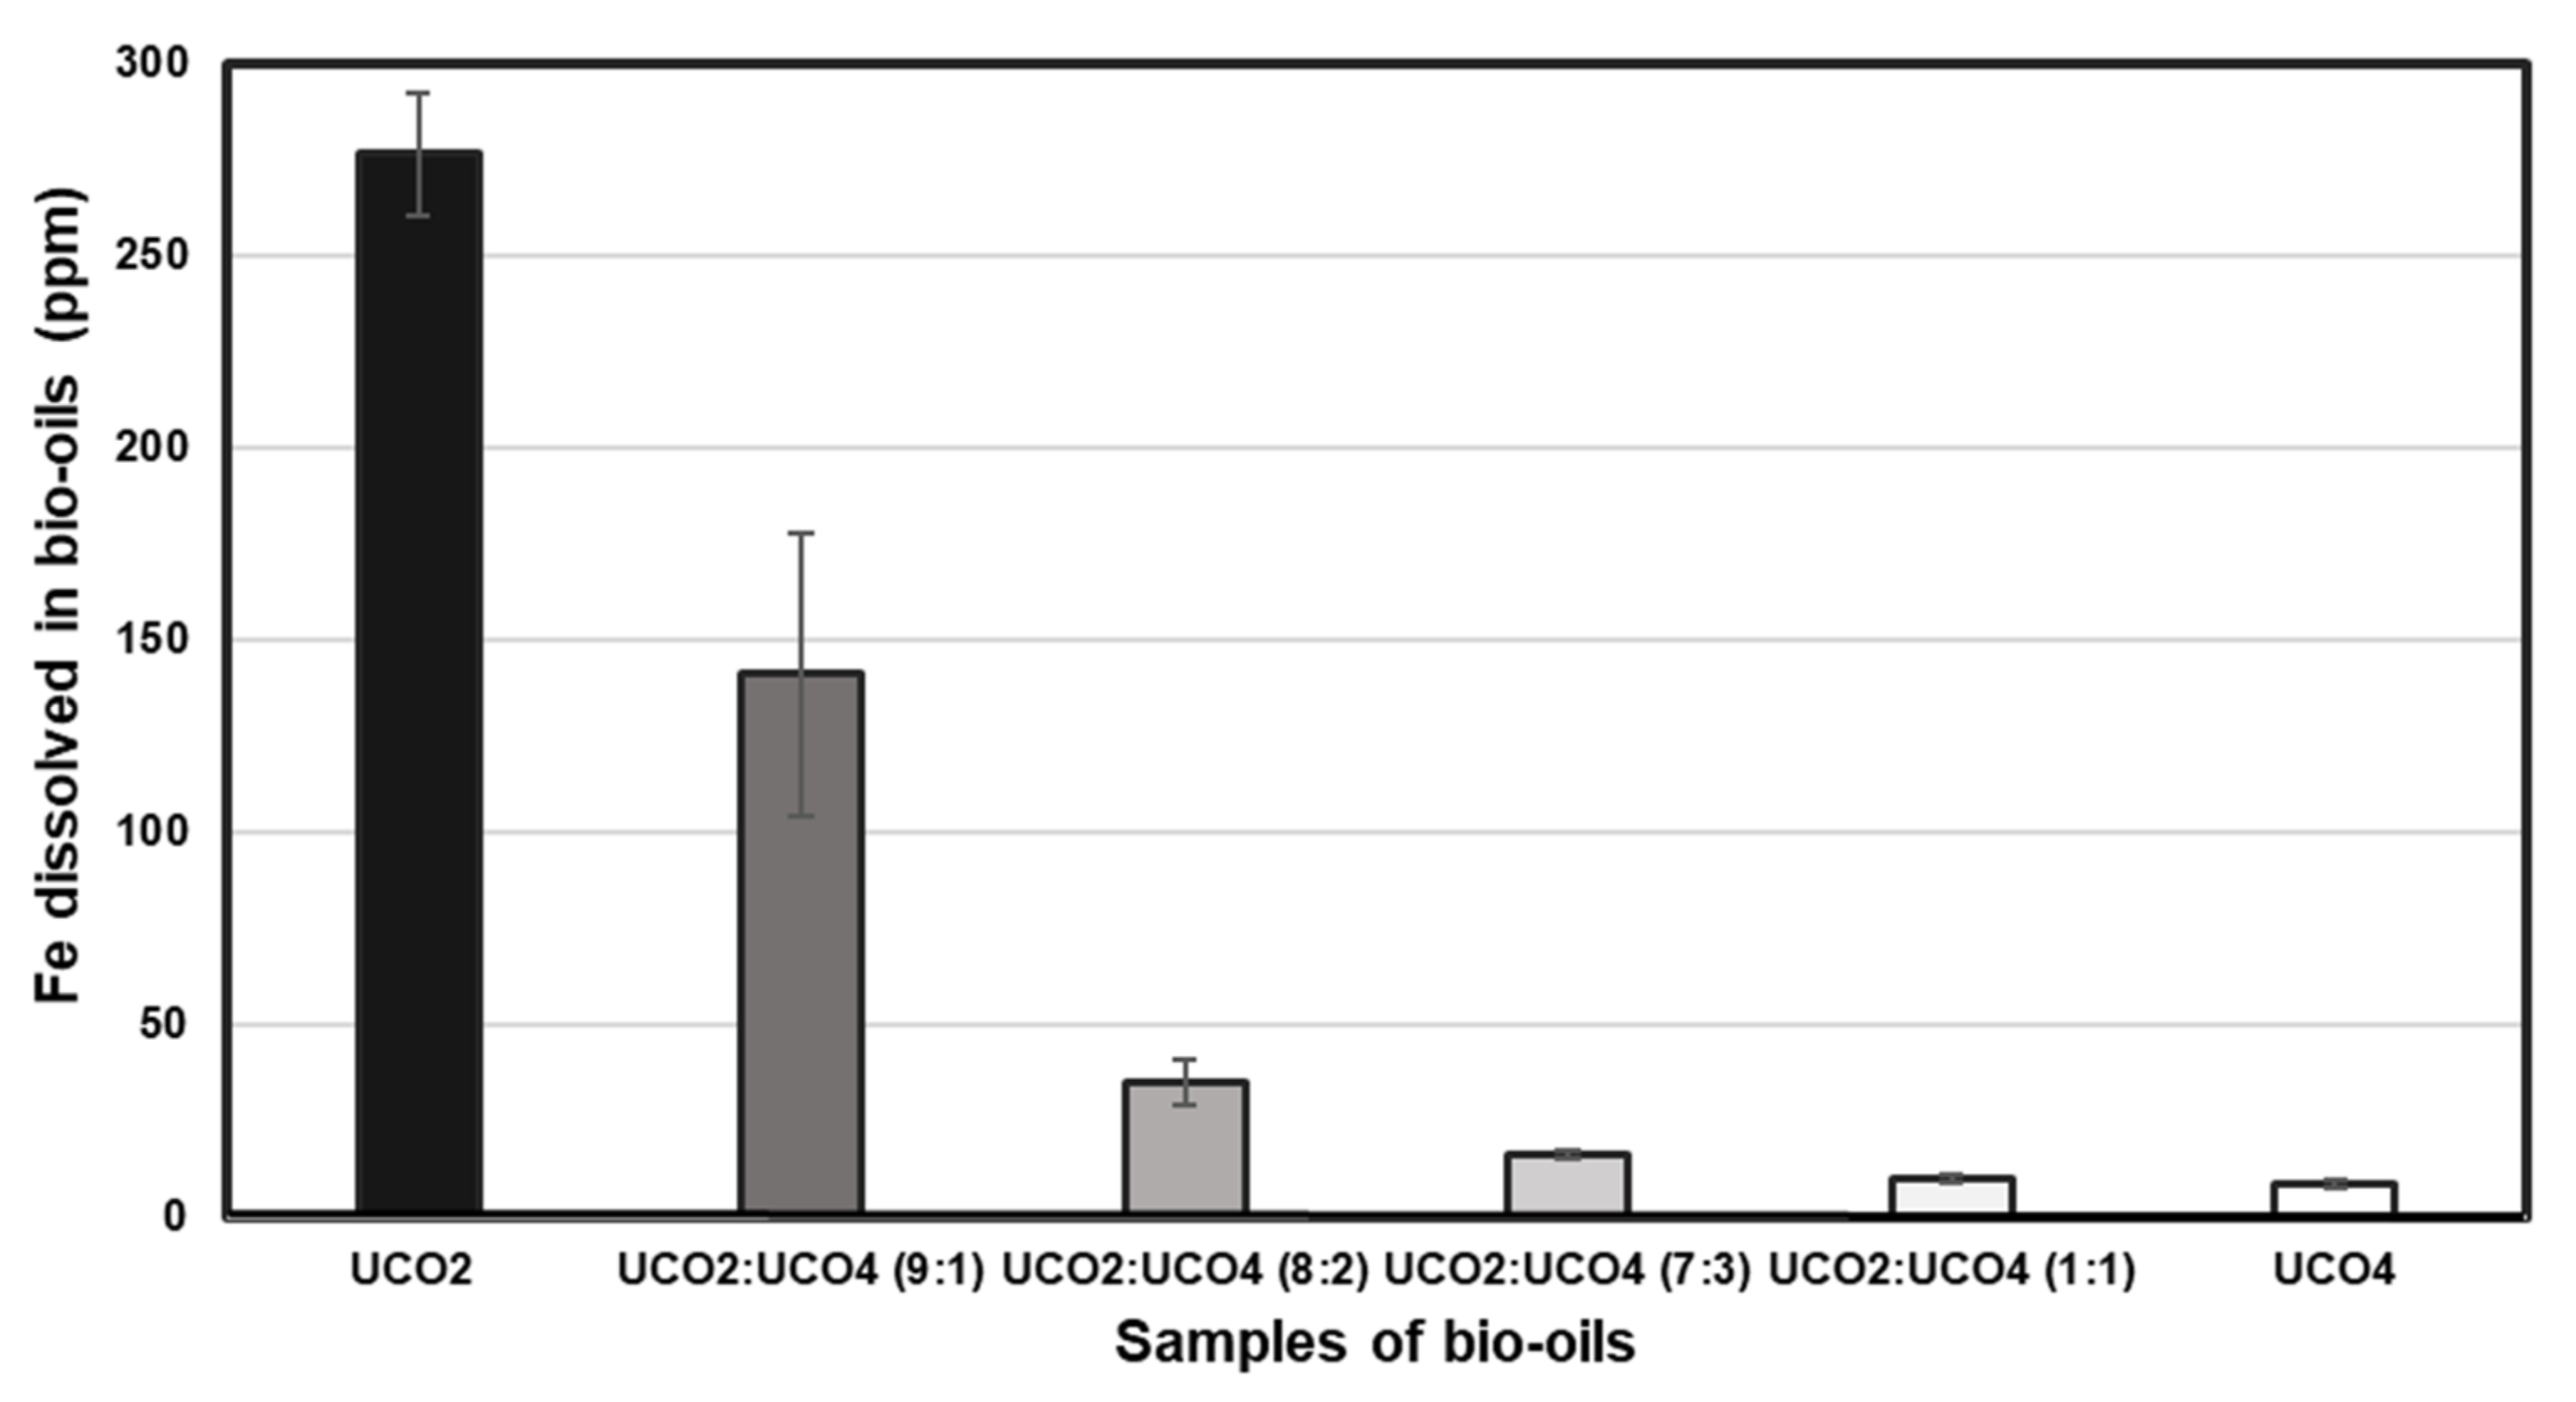
The more corrosive UCO2 was mixed with the low corrosive UCO4 in fractions of 9:1, 8:2, 7:3, and 1:1. The immersion test during 3 d with a polished steel rod was implemented. Three replications for each sample were performed.
Figure 5 shows the iron concentrations dissolved in the oils. When UCO2 was used in the immersion test, an average iron concentration of 277 ppm was dissolved. As the fractions with decreasing concentration of UCO2 were tested, the concentration of dissolved iron in oil also decreased. The results show that by adding the low corrosive UCO4 oil to a very corrosive UCO2 oil, the harmful corrosive properties of the bio-oil mixture decreased. For utilization of different UCO batches, it would be very important to know the quality of each batch. The most corrosive batches should be blended with the less corrosive batches in a certain proportion such that the influence of the more corrosive oils is minimized.
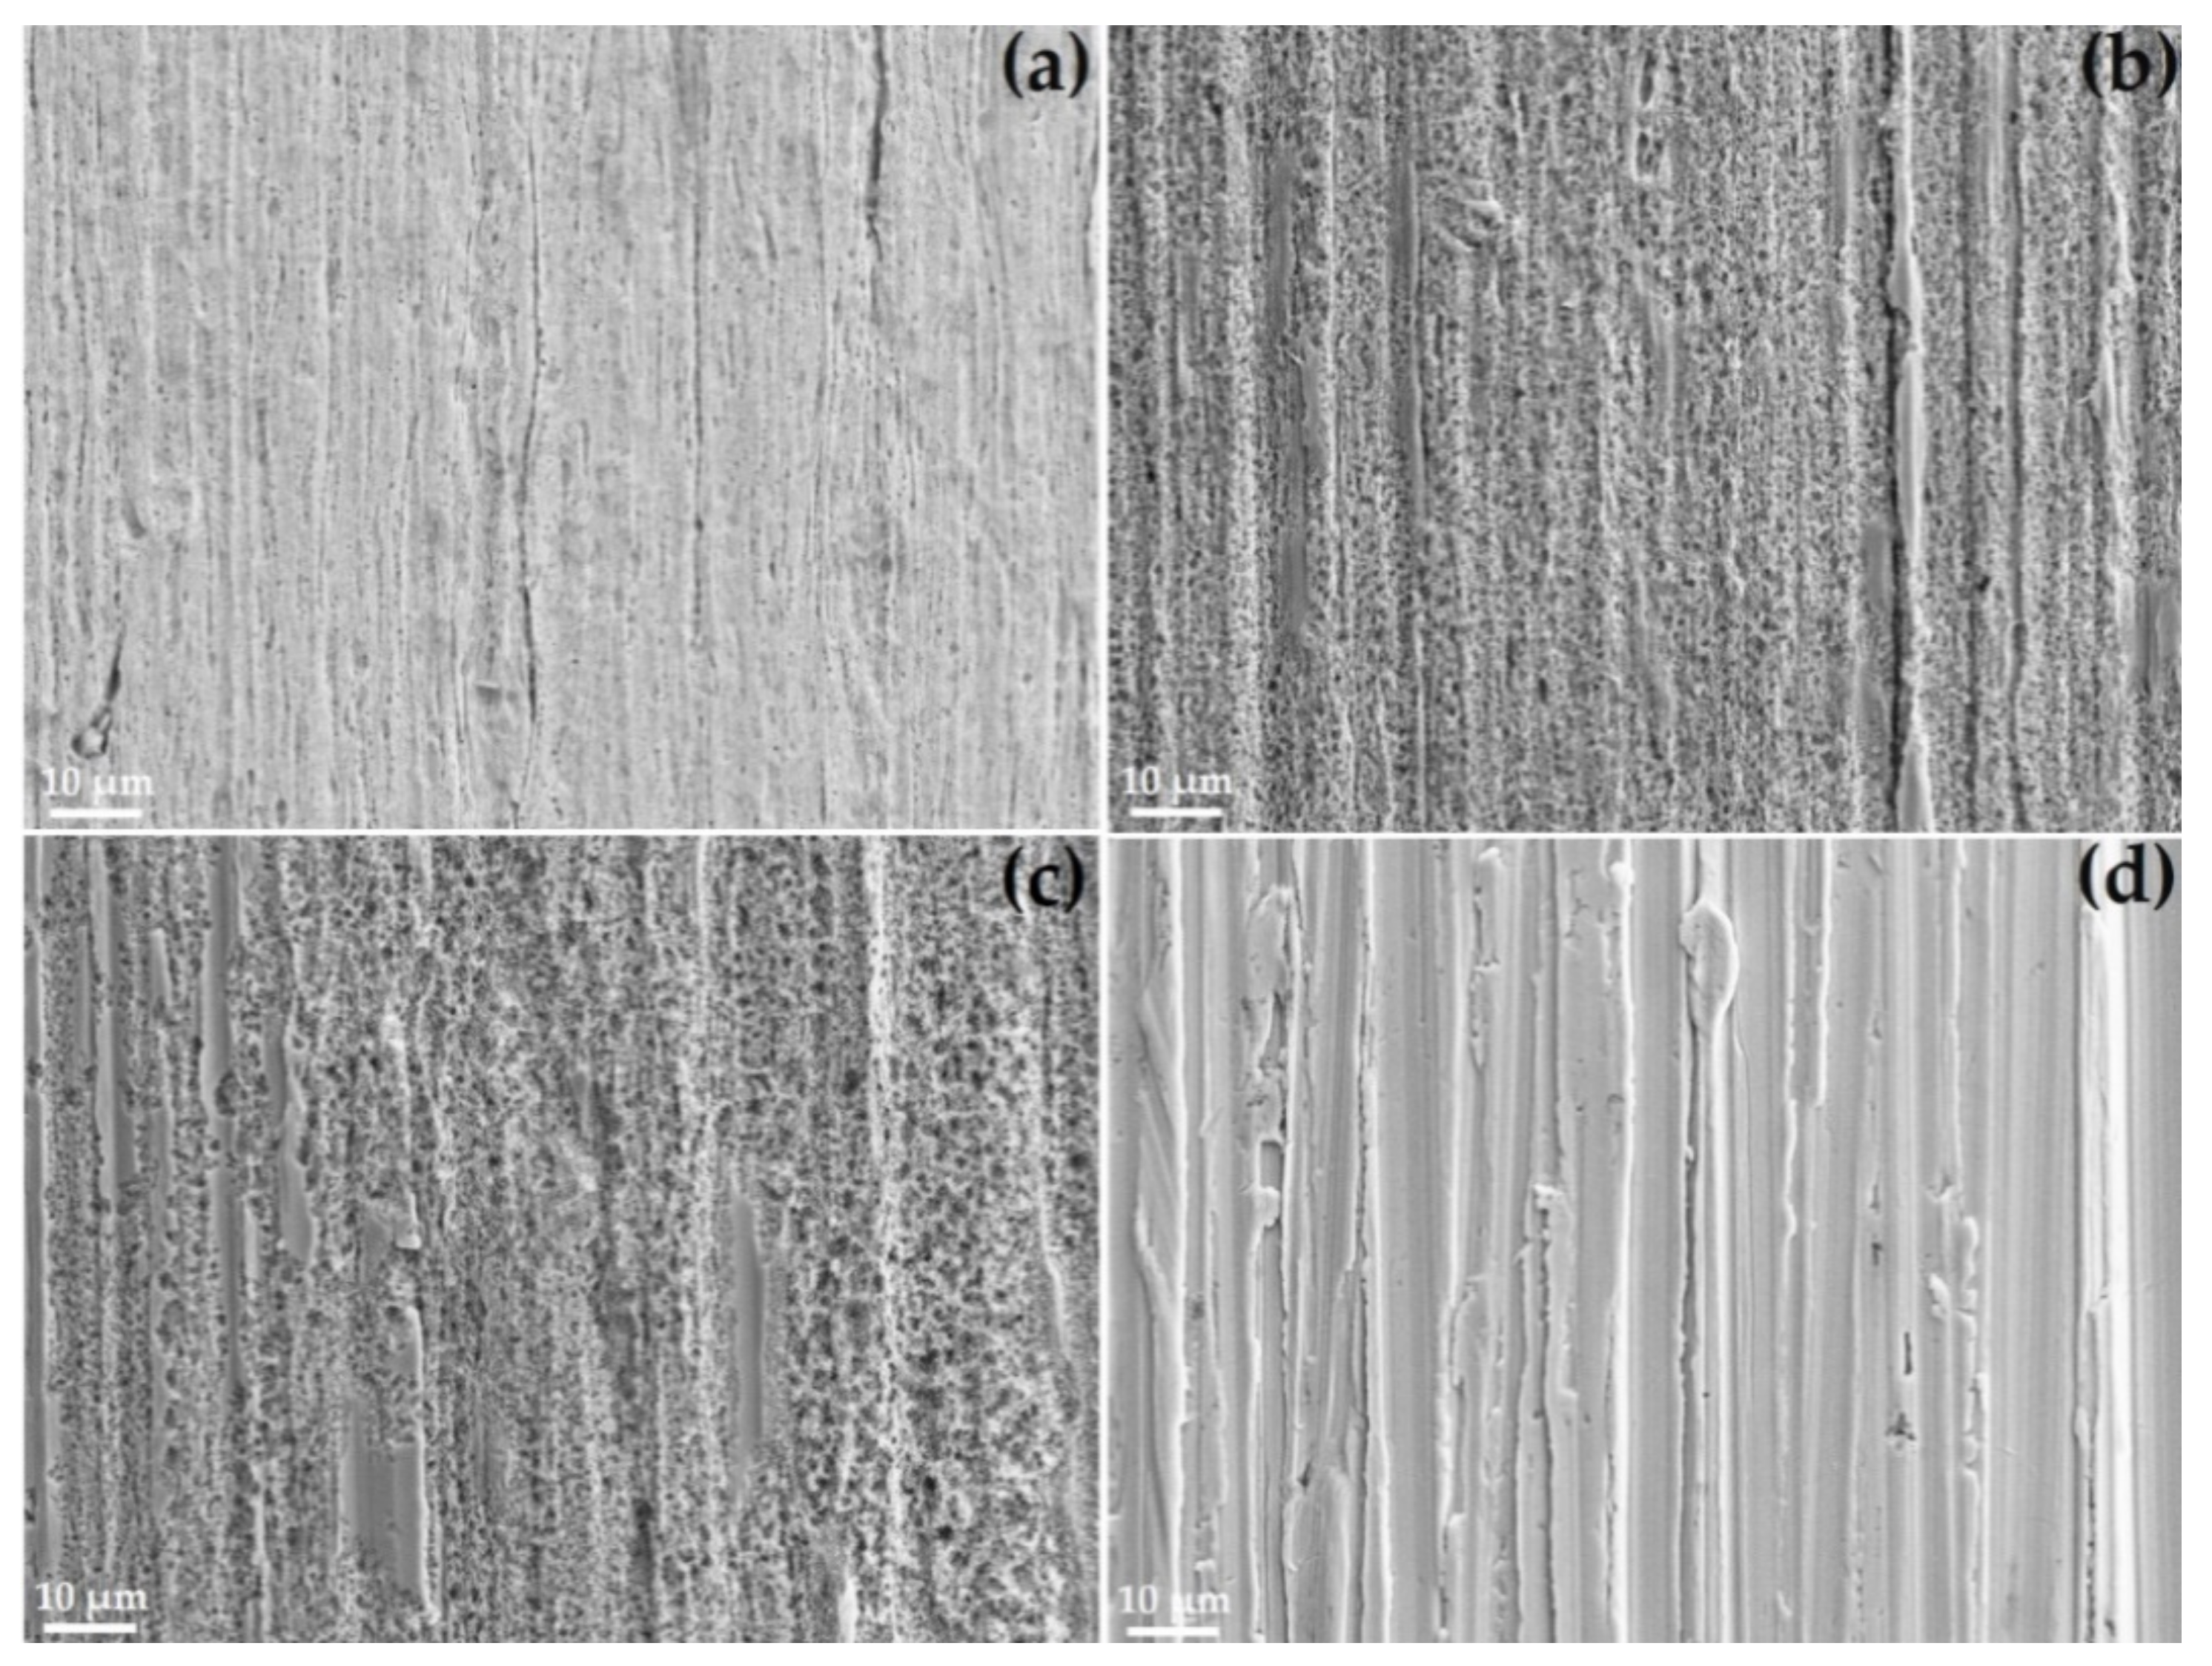
The SEM secondary electron images in
Figure 6 show the surface morphology of the polished steel rods after three days of exposure to the following oil samples: (a) UCO2, (b) UCO2:UCO4 (9:1), (c) UCO2:UCO4 (8:2), and (d) UCO4.
Figure 6a shows corrosion on the steel surface, 6b shows corrosion, and
Figure 6c shows corrosion on the steel surface.
Figure 6d shows a very smooth surface with very low corrosion.
As seen in the SEM images, the oil exposure clearly affected the surface morphology of rods, thus suggesting corrosion. The measured ion concentration in the oil after the exposure also supports this finding.
3.2.2. Copper Rod Corrosion
A polished copper rod was used in the immersion test. The concentration of copper in UCO2 was analyzed with ICP-OES. UCO2 dissolved copper during 1 d only 14 ppm, and during 3 d, 5 d, and 10 d, the level of dissolved copper was 25.9 ± 0.7 ppm (
Table 5). The copper rods withstood corrosion much better than the steel rods when UCO2 was used.
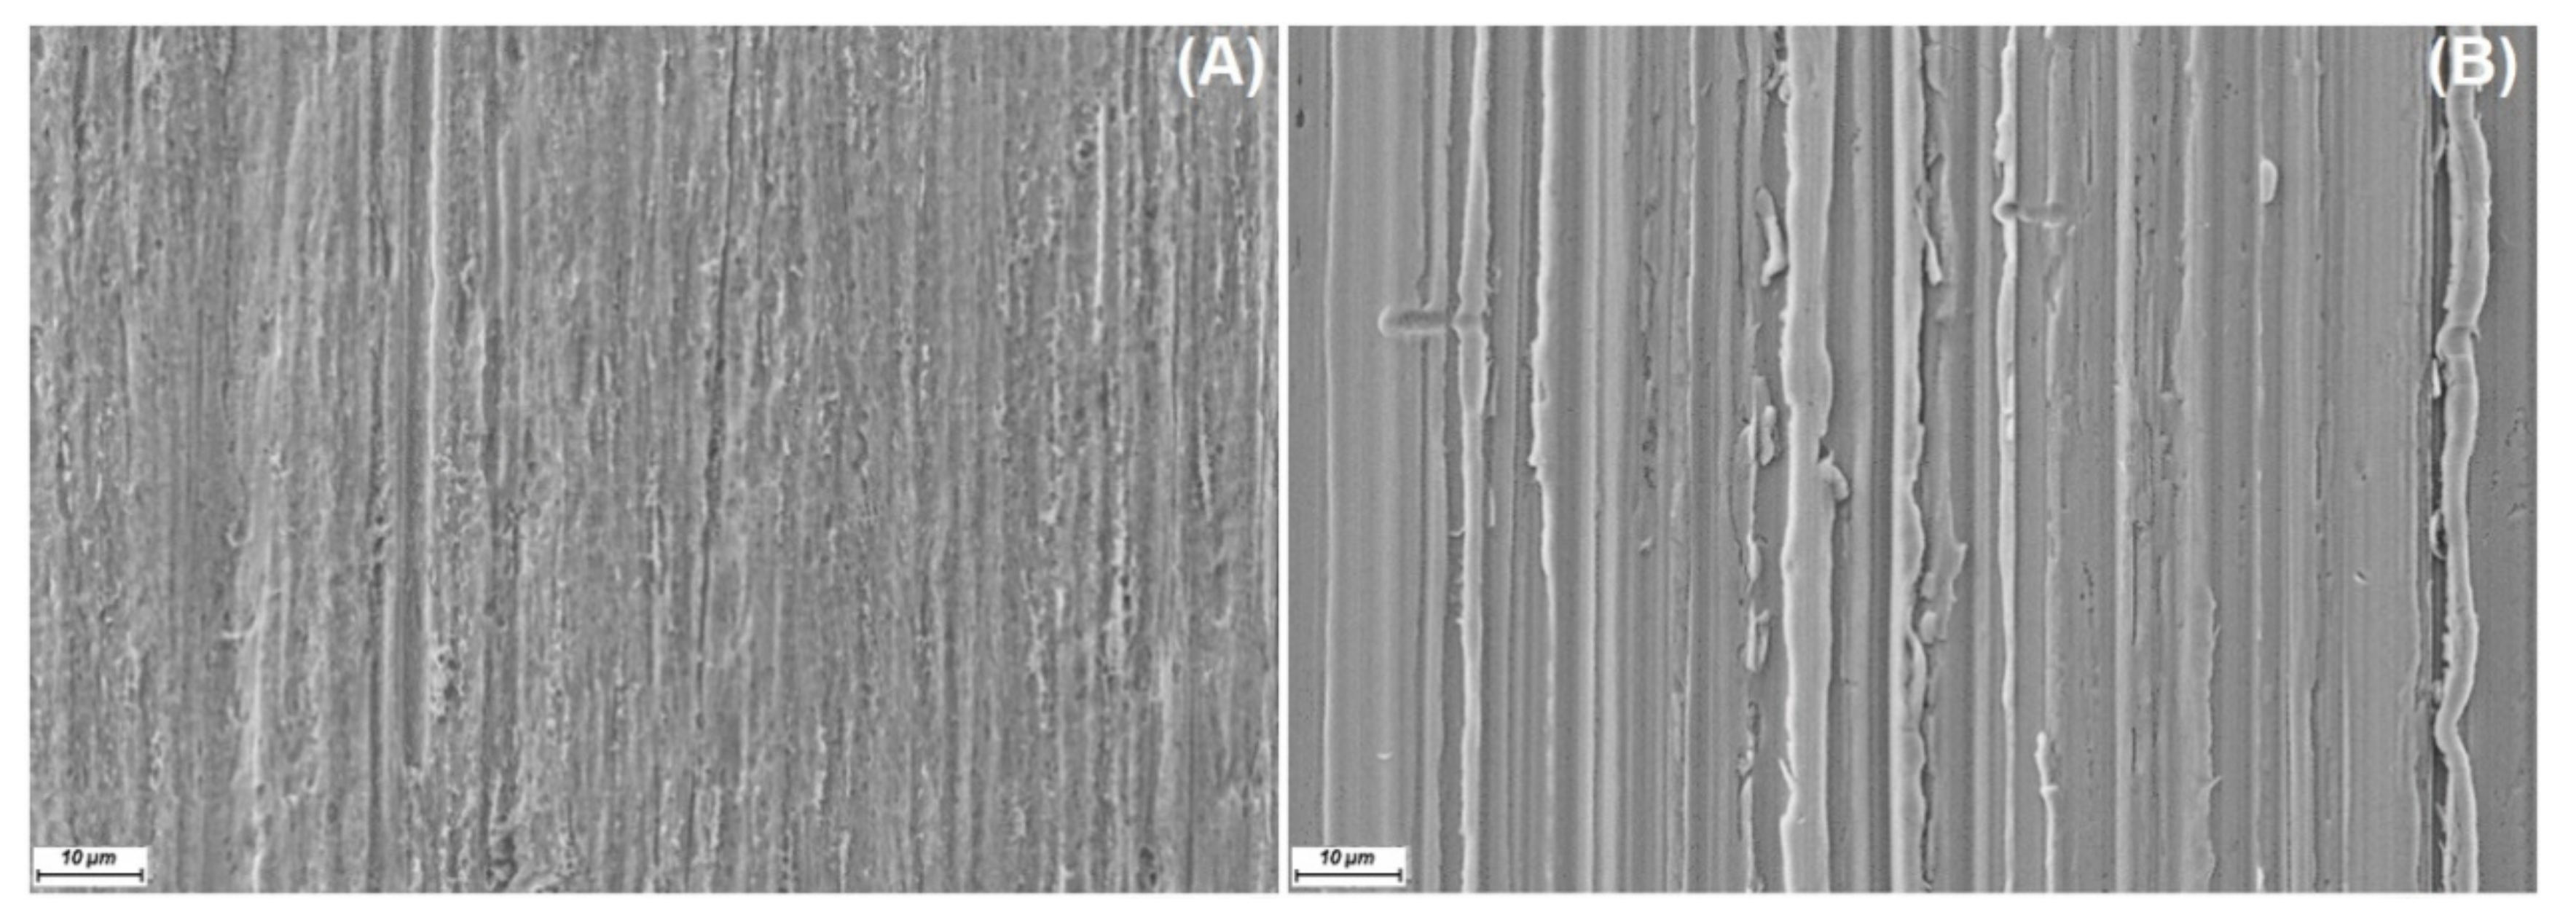
Figure 7A,B shows the minor change on the surfaces of the copper rod before and after expose to UCO2. For up to three days, copper kept dissolving, but after that, the copper content remained constant.
The same batch of UCO2 was used in this copper test as in the test where UCO2 and UCO4 were mixed. A polished steel rod was used with UCO2 in the immersion test (3 d), and it was noticed that 277 ppm iron was dissolved into the oil (
Figure 5).
When comparing the two rods in contact with the oil during the immersion test, the area 268.48 mm2 of the polished copper rod was smaller compared to the polished steel rod’s area of 431.57 mm2. The concentration of copper dissolved from the rod was 0.09 ppm/mm2, and the iron dissolved from the rod was 0.64 ppm/mm2, which means that there was about 6.8 times higher concentration of iron compared to copper dissolved in UCO2 oil. These results indicate that the corrosive compounds in UCO2 caused more corrosion in contact with the polished steel rod surface compared to the copper rod surface.
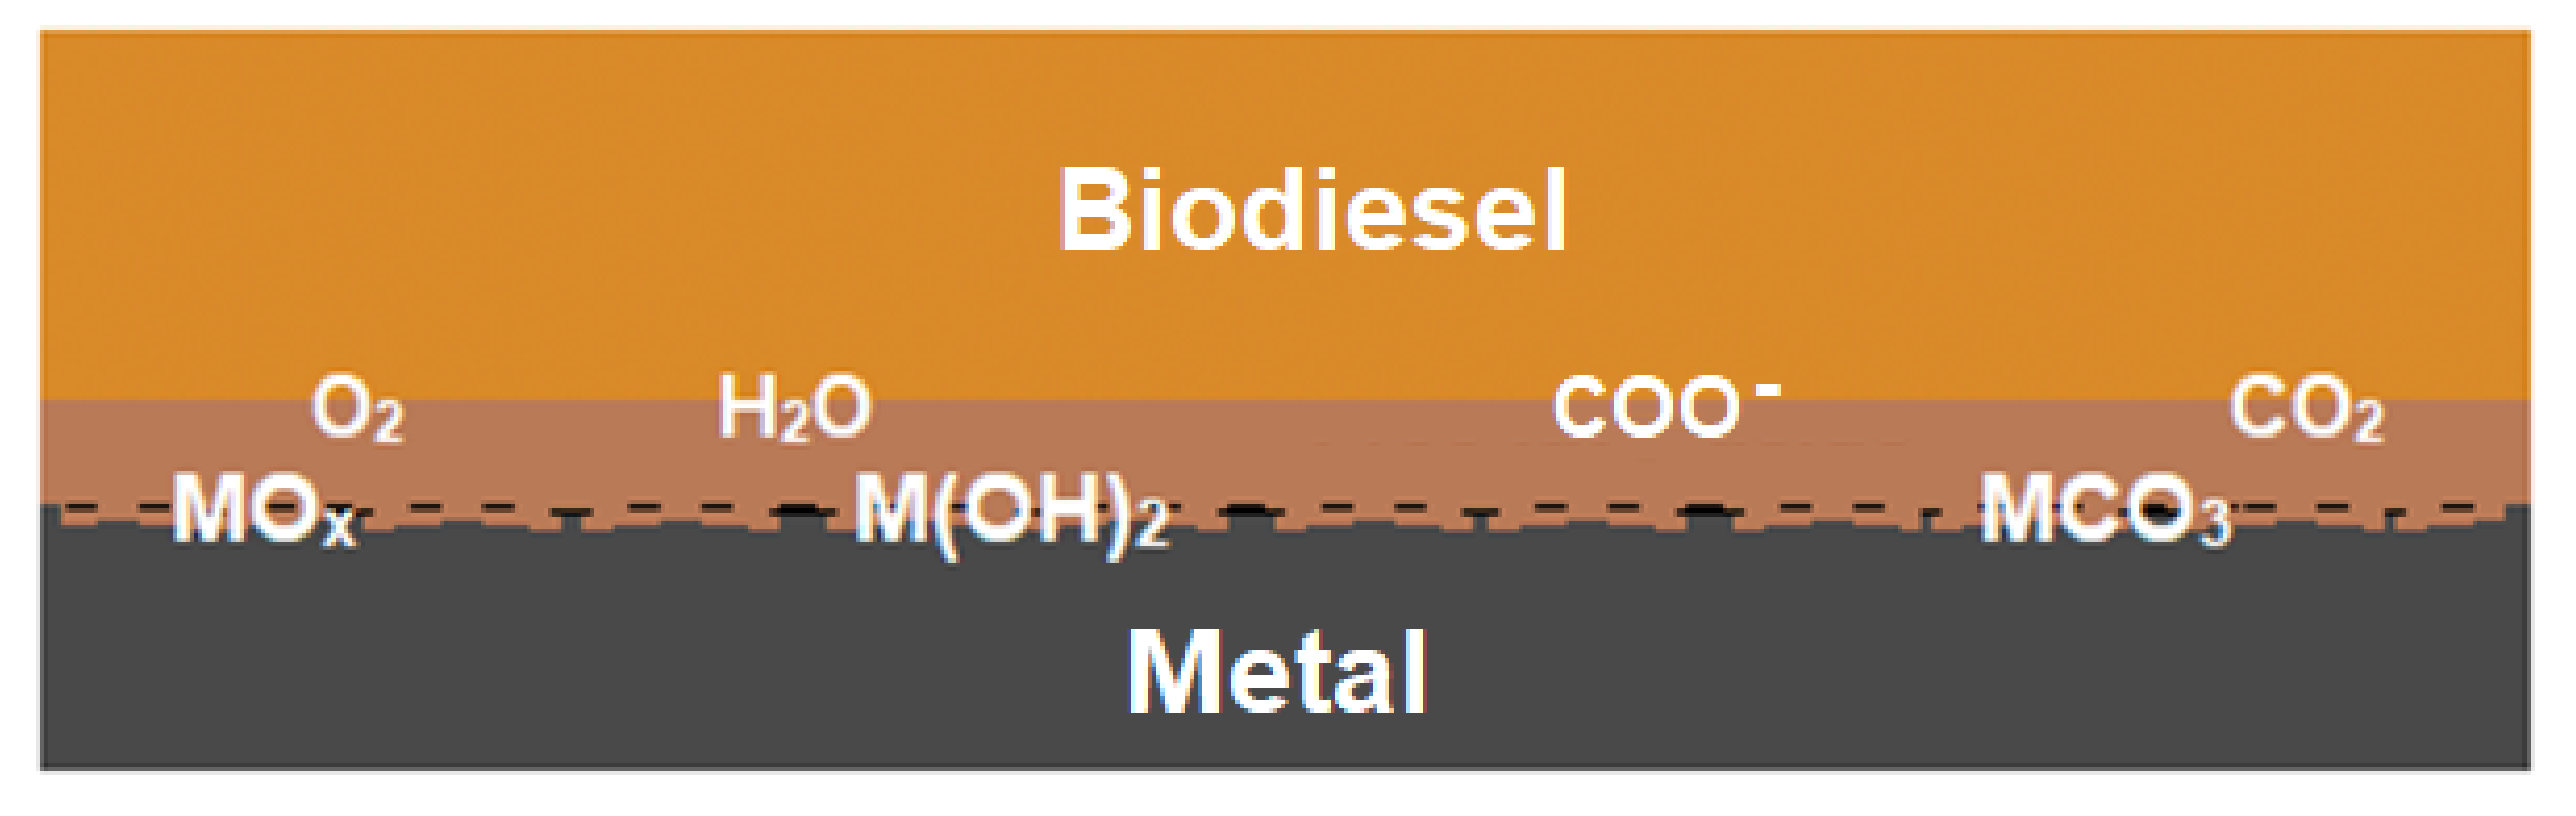
Immersion tests with copper in UCOs could not be found in the open literature. Thus, we consider the corrosive properties of biodiesels for comparison. Biodiesel is chemically modified from UCOs and animal fats (that contain triglycerides and impurities like water, FFAs, etc.). During the chemical modification, including, e.g., transesterification, the production of biodiesel occurs, which is a mono-alkyl ester-based oxygenated fuel [
34].
Immersion tests of copper, mild carbon steel, and stainless steel in biodiesel at 43 °C for two months were performed by Hu et al. [
15]. According to their results, copper and mild carbon steel were observed to be more susceptible to corrosion than stainless steel. They also reported that chemical reactions controlled the corrosion mechanism of the metals [
15]. Dissolved copper and iron were also found to act as strong catalysts to oxidize biodiesel [
16]. Fazal et al. [
9] also studied corrosion of copper in biodiesel and found out that after a certain immersion period (600–1200 h), the formation of oxygenated compounds on the surface of copper exposed to biodiesel reduced corrosion rate.
The immersion tests with biodiesel discussed above were done at elevated temperatures and for a longer immersion period [
9,
15,
16,
23,
28]. During the biodiesel immersion tests, copper was most vulnerable to corrosion; however, in our shorter period of immersion testing at room temperature with UCO2, polished copper was observed to be less corroded compared to the polished steel rod. The reason could be that the concentration of dissolved copper at room temperature reached a saturation level during the three-day immersion test, or there could be chemical reactions that control the corrosion of the copper surface exposed to the UCO2.
3.2.3. Corrosion Inhibitor
The immersion tests were made for three days with a polished steel rod and the bio-oil UCO2. During the test, there was 310 ppm iron dissolved in UCO2.
Table 6 shows that when 0.025 wt% or 0.25 wt% tert-butylamine (TBA) was added to UCO2, the concentration of dissolved iron decreased to 9 ppm in both samples. When 2.42 wt% TBA was added to UCO2, the iron dissolved from the polished steel rod was 14 ppm. To prevent corrosion of a polished steel rod, 0.025 wt% TBA was enough to add to UCO2. The low iron concentration (9 ppm) measured in the bio-oil was on the same level as when no steel rod had been in contact with oil.
Deyab et al. [
21] reported that corrosion inhibitors contain organic compounds with nitrogen, oxygen, or sulfur atoms, heterocyclic compounds, and pi electrons. The polar functional groups present in inhibitors are considered to be the center of reaction for adsorption [
22]. Inhibitors ethylenediamine, tert-butylamine (TBA), or n-butylamine form a stable metal oxide protective layer and thus inhibit the corrosion in biodiesel [
23]. Physical adsorption of amine-based inhibitors could have created a stable protective layer over the steel surface and thus prevented corrosion in our bio-oils [
23,
25].
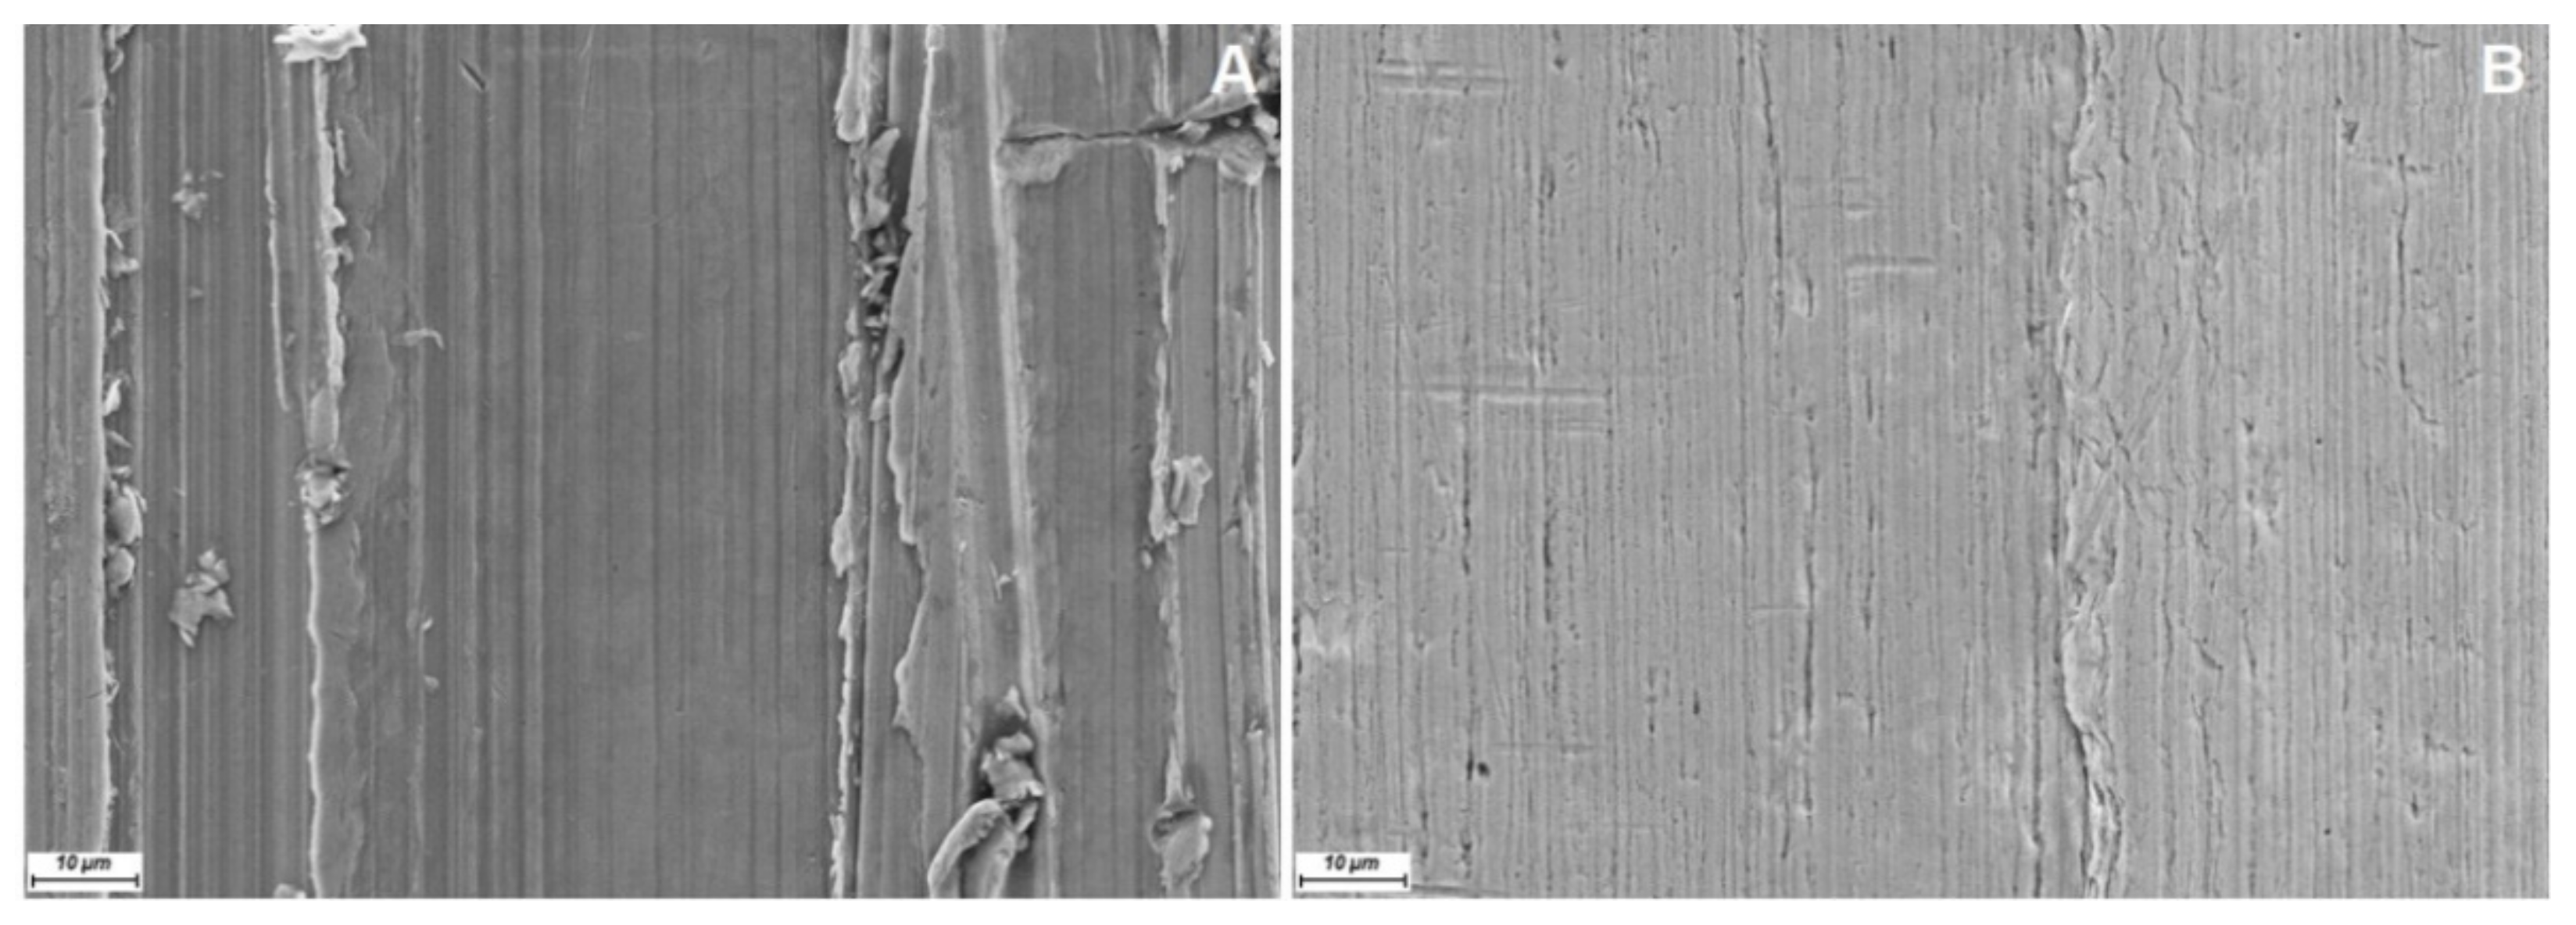
As can be seen in
Figure 8A,B, the steel rod surface after three-day immersion in UCO2 and TBA (0.025 wt%) is smoother than the immersion in UCO2 alone. The smoother surface observed when TBA was added originated from the smaller amounts of dissolved iron or less corrosion of the surface.
Despite the promising results of TBA, notably inhibiting corrosion, it should be mentioned from the chemical safety point of view that it is classified as an acutely toxic substance. Therefore, more environmentally friendly chemicals as a replacement for TBA should be one of the focuses of future research in this area.


